Review

Ultrasound Assisted Extraction for the Recovery of Phenolic Compounds from Vegetable Sources

by
Nelly Medina-Torres
1,
Teresa Ayora-Talavera
1,
Hugo Espinosa-Andrews
2,
Angeles Sánchez-Contreras
1 and
Neith Pacheco
1,*
1
Centro de Investigación y Asistencia en Tecnología y Diseño del Estado de Jalisco CIATEJ Unidad Sureste, Parque Científico Tecnológico de Yucatán, Km 5.5 Carretera Sierra Papacal-Chuburná Puerto, Mérida CP 97302, Mexico
2
CIATEJ Unidad Zapopan, Camino Arenero 1227, El Bajío del Arenal, 45019 Zapopan Jalisco, Mexico
*
Author to whom correspondence should be addressed.
Agronomy 2017, 7(3), 47; https://doi.org/10.3390/agronomy7030047
Submission received: 31 May 2017 / Revised: 20 June 2017 / Accepted: 30 June 2017 / Published: 7 July 2017

Abstract

:
Vegetable sources and agro-industrial residues represent an important source of phenolic compounds that are useful in a wide range of applications, especially those with biological activities. Conventional techniques of phytochemical extraction have been associated with a high consumption of organic solvents that limits the application of bioactive extracts, leading to the implementation of novel extraction technologies using mechanisms such as Ultrasound Assisted Extraction (UAE). In the present review, an analysis of the involved variables in the extraction yield of phenolic compounds through UAE is presented, highlighting the advantages of this technology based on the results obtained in various optimized studies. A comparison with other technologies and a proposal of its possible application for agro industrial residues as raw material of phenolic compounds is also indicated. Finally, it is concluded that UAE is a technology that is placed within the area of Sustainable Chemistry since it promotes the use of renewable raw materials through the extraction of phenolic compounds, implementing the substitution of organic solvents with solvents that do not present toxic effects, lowering the energy consumption when compared to conventional methods and minimizing process times and temperatures, which is useful for the extraction of thermo-labile compounds.

1. Introduction

Phytochemically, extraction of bioactive compounds could be defined as a separation procedure employed for the recovery and purification of plant materials, rendering them useful in a wide range of applications [1]. Conventional techniques of phytochemical extraction with biological activities include maceration and Soxhlet extraction; these methods have been associated with a high consumption of organic solvents that limits the application of bioactive extracts due to solvent toxicity [2]. In addition, long time extraction is required, which involves high energetic consumption causing an incremental cost [2]. Thus far, the implementation of novel extraction technologies, using different mechanisms such as Ultrasound, Microwave energy, Supercritical fluids and Accelerated solvent extraction has been promoted [3]; the main objective of these methods is to reduce extraction time and energy consumption which is reflected in the lowering of the final cost. A common aspect of these technologies is that they are sustainable, because they protect both the environment and consumers’ health and enhancing the economically and innovatively competitiveness of industries [4]. The main characteristics of the extraction technologies mentioned above and the conventional methods are presented in Table 1.
Ultrasonic Assisted Extraction (UAE) stands out as a sustainable alternative which requires a moderate investment of solvent and energy. Furthermore, it is easy to handle, safe, economical and reproducible due to the fact that this technology allows its development under conditions of atmospheric pressure and at an ambient temperature [6,7].
UAE is based on the principle of acoustic cavitation which is capable of damaging the cell walls of the plant matrix and thereby favoring the release of bioactive compounds [8]. This technology can be applied to obtain different phytochemicals of which phenolic compounds stand out. These are appreciated by various fields of industry, particularly the food and pharmaceutical industries, thanks to their antimicrobial, anti-inflammatory, anticancer properties and mainly for their antioxidant capability [9].
The integration and application of the biological properties of phenolic compounds have led to a great variety of studies focused on the recovery of these compounds from various plant sources, under the principle of implementing sustainable technologies such as UAE [10]. Therefore, in the present review paper, an analysis of the variables involved in the extraction yield of phenolic compounds through the UAE will be presented, highlighting the advantages of this technology based on the results obtained in various optimization studies. A comparison with other technologies and a proposal of its possible application for agro-industrial residues as raw material of phenolic compounds is also indicated.

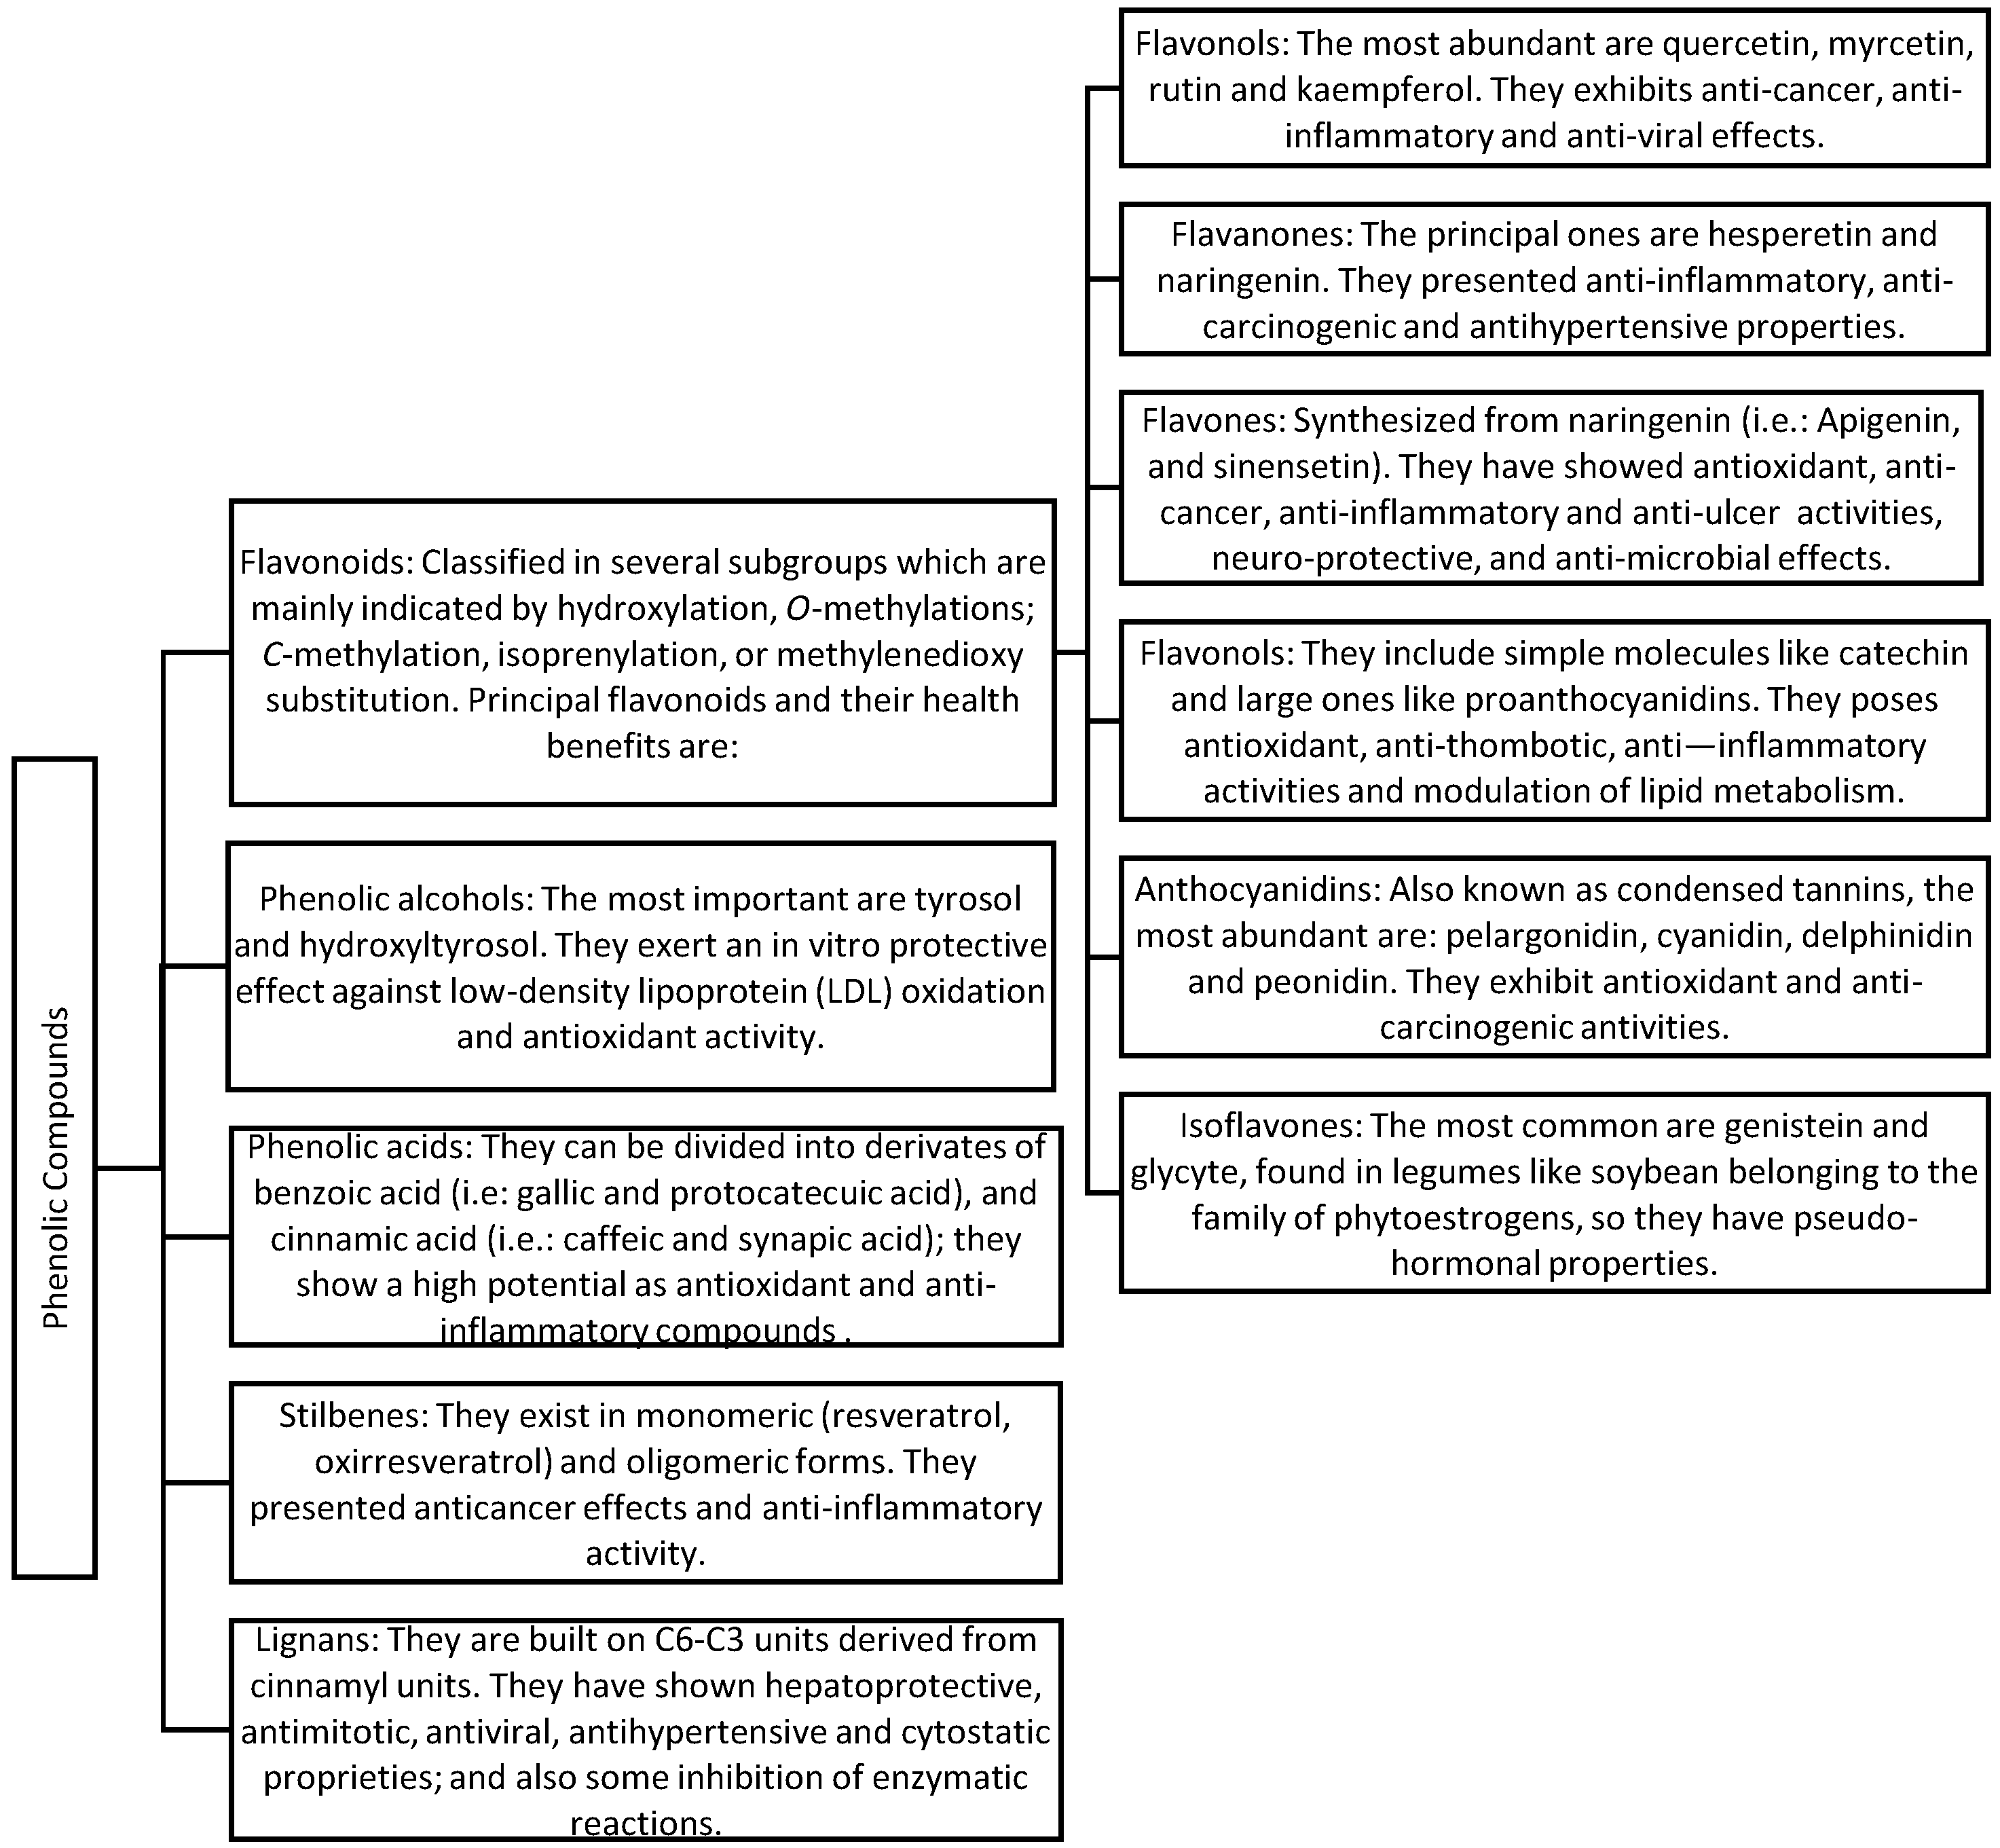
2. Phenolic Compounds: Characteristics and Biological Potential

Phenolic compounds are metabolites derived from vegetal sources (plants, vegetables and fruits) that play an important role in the growth and reproduction of plants, by acting as attractants of pollinators and as mechanism against predators. These compounds have been linked to the morphological and sensory characteristics of the vegetable sources and their by-products as well as contributing to their taste and pigmentation. Additionally, they are responsible for some nutraceutical or functional properties in the plants or residues that possess them [11].
The biological properties and bioavailability of phenolic compounds depend to a great extent on the food matrix; the classification and principal biological properties of phenolic compounds are shown in Figure 1. They can be found in cereals such as: barley, oats, rye, rice and corn, some vegetables and fruits such as: apples, citrus, bananas, plums, blackberries, blueberries, cherries, guavas, mangoes, papayas, pineapples, raspberries, grapes, and strawberries, which are the main source of phenolic compounds. They can also be obtained from vegetable by-products such as teas and wines [12,13]. Table 2 shows the main phenolic compounds in some vegetal sources [11,14].
Phenolic compounds are synthesized by the shikimate, polyketide and mevalonate pathways which produce the great variety of metabolites derived from phenol. These are characterized by the presence of one or several hidroxil (-OH) groups bonded to a 6-carbon aromatic ring, which can be found as free glycosides and glycosidic forms, and this means that they are linked to sugars such as glucose, galactose, rhamnose, xylose and arabinose [15]. Despite all the advantages related to polyphenols, this compounds are very sensitive to several environmental factors, such as heat and light, and they also show low water solubility in their fee form that contributed to a lack in long-term stability; it is for this the reason that there is such a big challenge to the development of new strategies to overcome the drawbacks associated with polyphenol stability [9]. Due to vegetable sources being a great source of polyphenol compounds, the extraction methodologies that improve polyphenol yields with preservation of biological activities, as the UAE technique, represent an important topic to be analyzed.

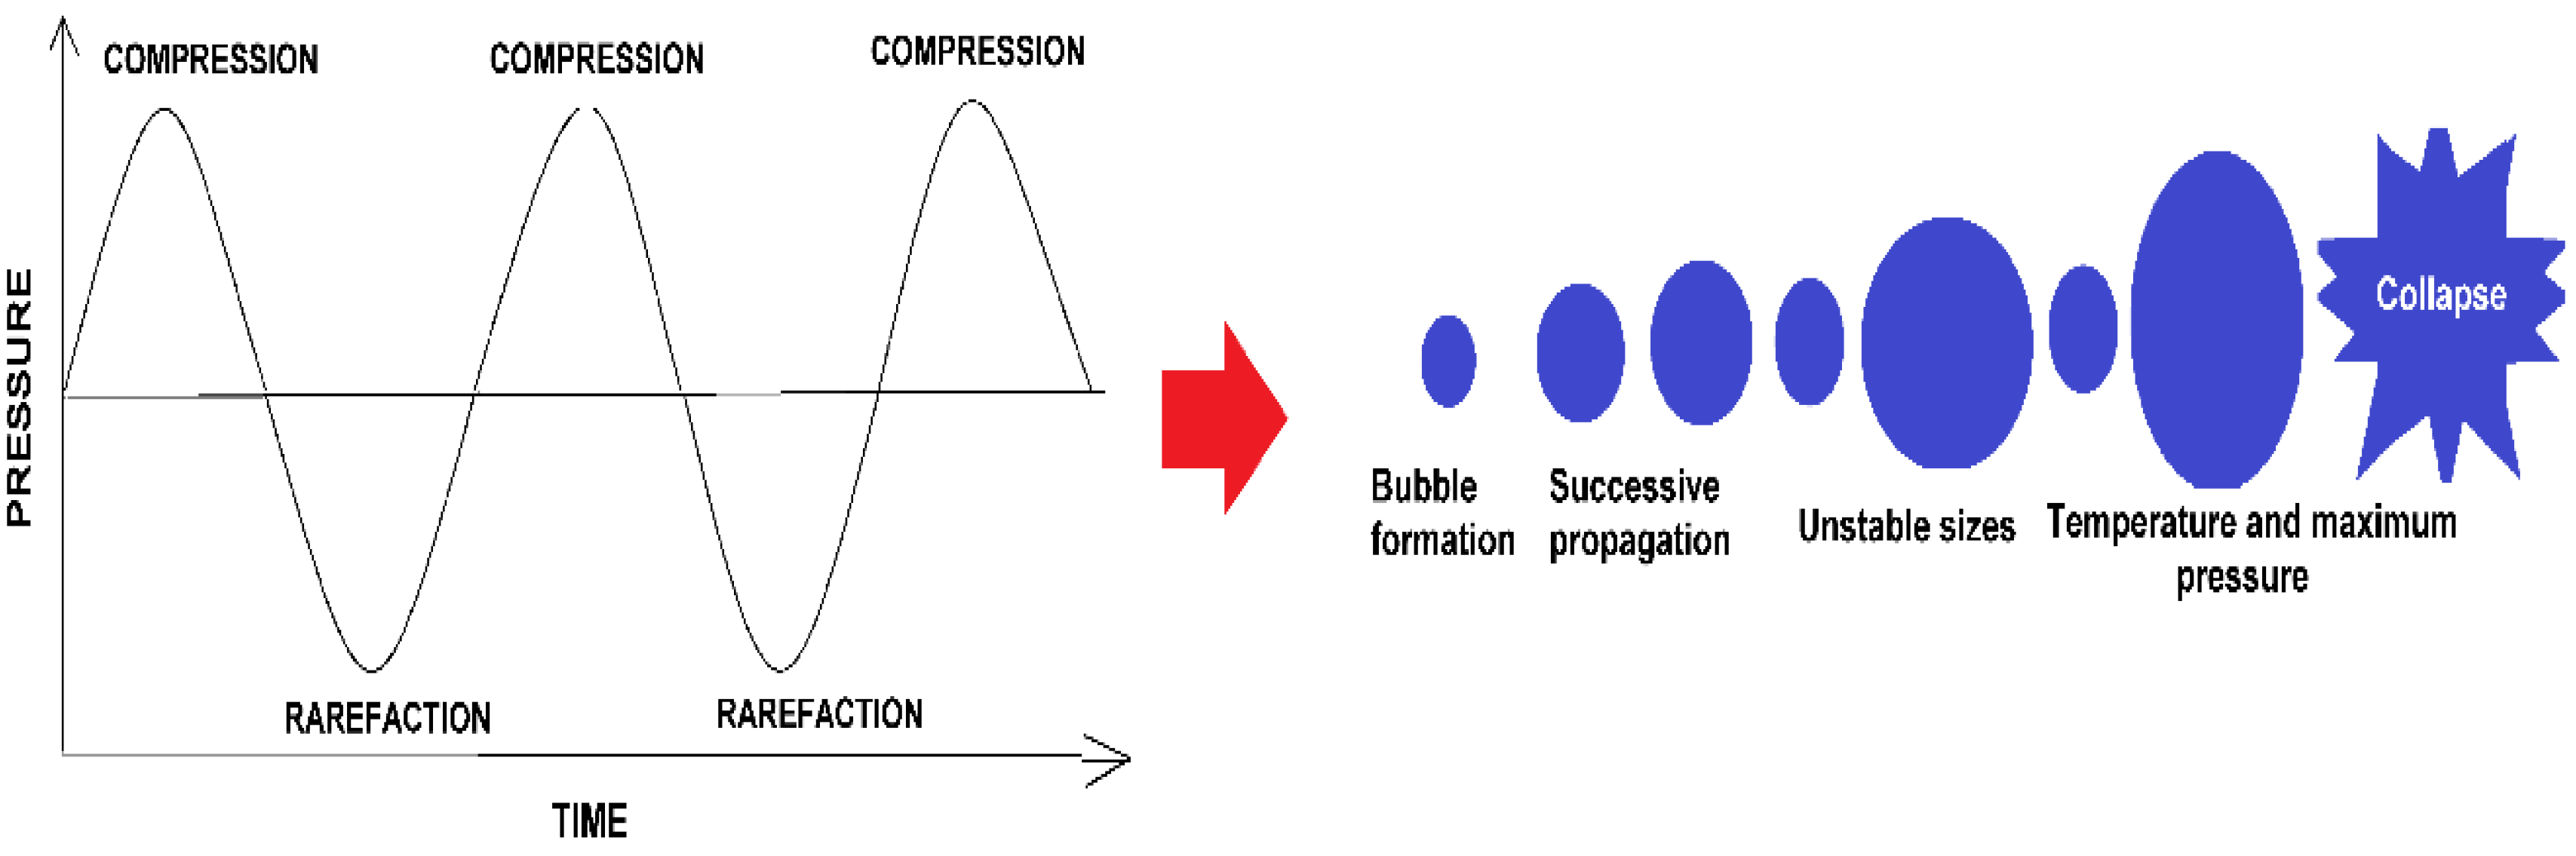
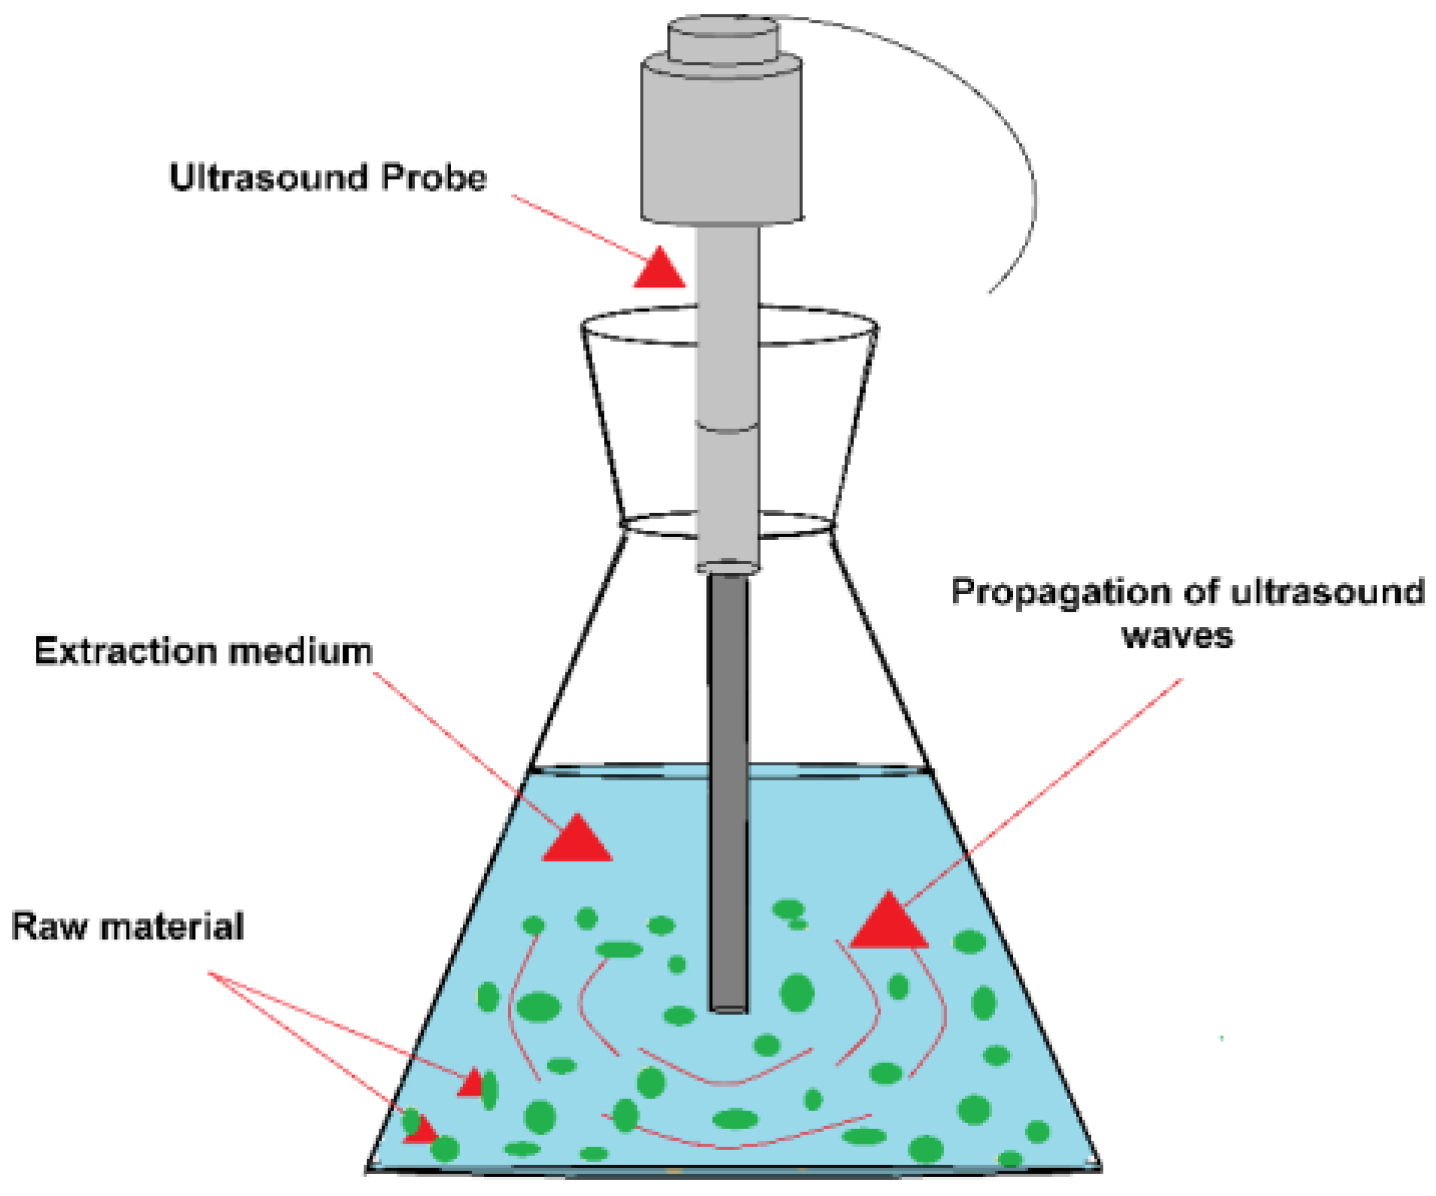
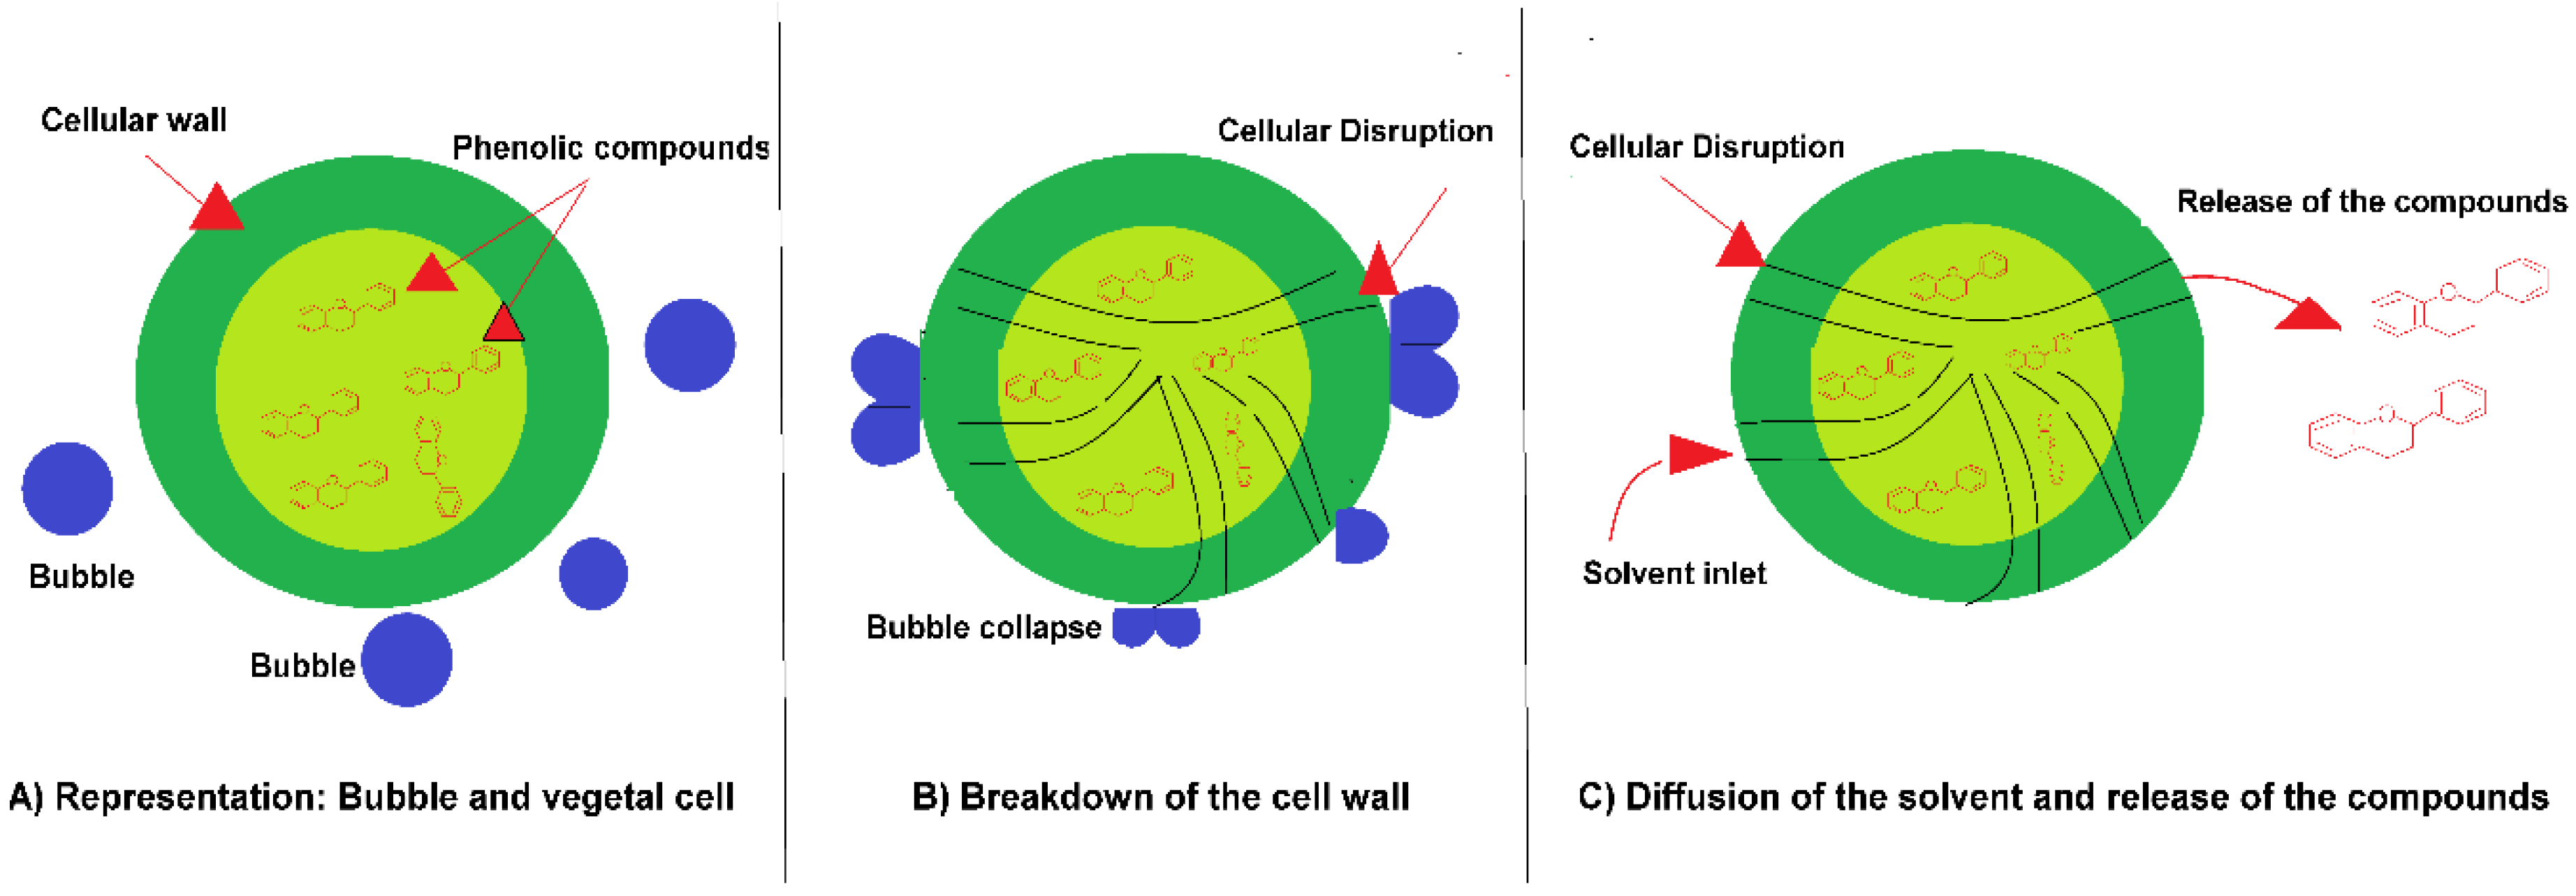
3. Ultrasonic Assisted Extraction (UAE) and Characteristics

Ultrasound is based on the propagation of mechanical waves, formed by a set of cycles defined as the combination of high and low pressures, called compressions and rarefactions, respectively [18,19]. The main characteristics of Ultrasound waves are [20]:
  • Length: distance between two points of compression or rarefaction.
  • Amplitude: maximum height of a wave.
  • Frequency (Hz): number of cycles per unit of time.
  • Speed (m/s): product of frequency by wavelength.
  • Power (W): ratio between the energy transported and the time considered.
  • Intensity: ratio of a power unit across a unit area (W/cm2).
The spectrum of waves involved in ultrasound is called ultrasonic waves and the frequencies of these waves are those above the audible range (>20 kHz) and below the microwave frequencies (up to 10 MHz). The magnitude of the frequency which is related to the ultrasound effect, that is to say frequencies lower than 20 to 100 kHz, is dominated by physical effects and is commonly used in non-destructive analytical techniques. On the other hand, frequencies of 200 to 500 kHz are dominated by chemical effects [8]. Among the main applications reported for ultrasound are: emulsification, crystallization, reactions kinetics, fermentations, and compounds extraction. It is the last application which is the focus of our interest [21].
Ultrasonic Assisted Extraction (UAE) has acoustic cavitation force as the main driving force; it is capable of inducing a series of compressions and rarefactions in the molecules of the present solvent, causing the formation of bubbles as a result of changes in temperature and pressure (Figure 2) [22].
In general, several mechanisms involved in UAE have been identified. One of the positions of our mechanism is the fragmentation attributed to the collisions between particles and ultrasonic waves, which causes a reduction in the particle size, thereby facilitating mass transfer. Another is erosion which helps to improve the accessibility of the solvent by imploding the bubbles on the surface of the plant matrix. Sono-capillarity and Sonoporation, are able to improve the penetration of liquid through the channels produced by the bubble implosion and the alteration of the permeability of the cell membranes, respectively. Finally, the sheer stress mechanism produces the collapse of the cavitation bubble into the fluid, due to the oscillation phenomenon (Figure 3) [23].
Ultrasonic irradiation can be applied in two ways: by direct contact with the sample or through the walls where the sample is contained (indirectly) such as ultrasonic bath systems. The principal disadvantage of the ultrasonic bath is that it generally operates at a single frequency (20 or 40 kHz). However, there are more efficient extraction systems, such the Ultrasound system coupled with a probe (Figure 4), where the direct contact with the sample allows it to develop a power up to 100 times more than that provided in the ultrasonic bath [24].

4. Effect of Involved Variables of UAE in Efficiency and Yield

During the UAE there are variables that are directly related to extraction efficiency and yield, such as the way in which the ultrasound irradiation is applied (directly or indirectly), and the extraction conditions: time, temperature, solvent type and concentration used [8]. The following is an analysis of the influence on efficiency and yield on the main variables reported in UAE studies of phenolic compounds. In Table 3 some examples of these common variables involved in UAE efficiency and yield compare to conventional methods are summarized.

4.1. Effect of Ultrasound System Characteristics

4.1.1. Operation Equipment Mode and Frequency

The UAE can be carried out in a continuous or pulsed manner; both of which refer to how the irradiation is performed. The first one, as it name suggests, is in a continuous form and in the second one, the irradiation is achieved by intervals. Pan et al. [26] reported higher extraction rates as compared to a conventional extraction process. However, in practice it is not advisable to use a prolonged treatment in a continuous mode, since it may cause the degradation and/or oxidation of the phenolic compounds, as a consequence of the generation of highly reactive hydroxyl radicals, when using high frequencies (358 and 850 kHz) or high powers (750 W) [27].
Due to understanding the importance of the frequency, most of the studies are performed with low-frequency equipment (20–60 kHz), especially with bioactive phenolic compounds, since these frequencies does not affect their stability after they have been extracted [6]. Additionally, Tchabo et al. [28] reported an increase in the recovery of anthocyanins when using a low-frequency, and they indicated that this behavior could be attributed to the inactivation of oxidative enzymes, such as β-galactosidase, which has a secondary effect on these compounds. They also suggested the increase of the activity of some enzymes, such as pectinase, helps to disintegrate cell walls during cavitation.

4.1.2. Ultrasound System and Amplitude

As indicated in paragraph 3, there are two principal ultrasonic systems: the ultrasonic bath and the system with a coupled probe [25]. In the latter, amplitude plays an important role in the intensification of extraction since, in increasing the amplitude, the number of compression and rarefaction cycles of ultrasonic waves increases and, as a consequence, there is a higher delivery of the compounds [29]. Carrera et el. [30], reported significant statistical differences when comparing anthocyanin and tannin extraction yields using wave amplitudes of 20% and 50%, which suggests that a greater ultrasonic amplitude induces a greater number of cavities thus improving the extraction process. However, it is important to point out that the increase in extraction yields cannot be attributed exclusively to the abrasive effects or the turbulence created by ultrasonic waves, but also to the physical effects on the surface of the particles [31].

4.2. Effect of Sample Pretreatment

The pretreatment of raw material, such as dehydration techniques or particle size reduction, has a great effect on the extraction yield of phenolic compounds. Drosou et al. [32], who evaluated the effect of Air Drying (AD) and Accelerated Solar Drying (ASS) in obtaining phenolic compounds by UAE from Agiorgitiko grapes, particularly malvidin-3-O-glucoside and quercetin, indicated a higher extraction yield using AD, which is attributed to the decrease of the mass transfer coefficient during the UAE in ASS treatment caused by the hardening-phenomenon (formation of a shell on the surface of the matrix). Following the drying effect, Vilkhu et al. [10] indicated that the improvement in extraction efficiency when using the substrate in the dry state is due to the ability of the substrate to swell and hydrate thereby causing an increase in the pores of the cellular wall.
Additionally, it has been shown that a greater contact area between the solvent and the particles favors the extraction of phenolic compounds. Mane et al. [33] observed a decrease in mass transfer rate with increasing particle size, this tendency makes sense, since the contact surface decreases, in addition to that the pore diffusion path increases with the increase in particle size.

4.3. Effect of the Solvent

Phenolic compounds are distributed in the cell according to the solubility which is cause by their polarity. Hydrophilic substances are found mainly in cell vacuoles, while others such as the majority of lignins, flavonoids, and water insoluble polyphenols are deposited in the cell wall through hydrophobic bonds with proteins and polysaccharides [27]. It is for this reason that the extraction solvent must be selected according to the solubility of the compounds to which the process is directed. Furthermore, the toxicity, cost, and availability must also be taken into account [34]. Solvents such as methanol or ethanol have a significantly lower polarity when compared to water and this favors the solubility and diffusion of the phenolic compounds by reducing the dielectric constant of the solvent. However, previous studies agree that using highly pure organic solvents can lead to the dehydration and collapse of plant cells, as well as denaturation of the proteins of the cell wall thus making the extraction of phenolic compounds difficult [35]. For this reason, hydro-alcoholic mixtures, especially ethanol, are the solvent systems most suitable for extraction due to the different polarities of the phenolic compounds and the acceptability of this system for human consumption [36]. In this context, Şahin and Şamlı [37] reported that the best extraction yield of phenolic compounds was achieved using a 50%–50% ethanol–water mixture. These authors point to a synergistic effect among the solvents, since water acts as a swelling agent of the plant matrix, increasing the contact surface, while ethanol induces the rupture of the bond between the solutes and the matrix. Nevertheless, Tomsik [34] and Muñiz-Márquez [36] indicated that at 70% of ethanol concentration in solvents resulted in better extraction yields, due to the polarity of the compounds presented in the samples.
The solubility of phenolic compounds in different solvents cannot be based only on their polarities as the solubility is related to different parameters such as the stereochemistry of the compounds (the polar and non-polar fragments of the molecule) and the intermolecular forces between them and the solvent [38]. Similarly, the interaction of the solvent with the extraction system must be taken into account. The physical characteristics of the solvent greatly affect cavitation, because the cavities are formed more easily when a high-pressure solvent with low viscosity and low surface tension is used [39].

4.4. Temperature Effect

Temperature is one of the main factors involved in the UAE. In general, an increase in this variable correlates with improvements in extraction yields of the phenolic compounds due to: the induction of matrix bonds ruptures, increase of the compound solubility, solvent diffusion rate, mass transfer and reduction in viscosity and tension of the solvent [40,41]. Although temperature may increase mass transfer during extraction, it may also promote higher degradation rates of the compounds obtained, especially when the UAE process reaches temperatures above 75 °C [30]. Another drawback in employing high temperatures would be a decrease in the extraction rate constant, due to the reduction in cavitation intensity as a result of the lower surface tension and the increased vapor pressure of the cavitation bubbles [42].

4.5. Effect of Solute/Solvent Ratio

The solute/solvent ratio is one of the most critical factors during mass transfer, because a larger volume of solvent helps to accelerate the diffusion process [36]. An increase in the concentration of phenolic compounds is observed as the solute/solvent ratio increases [27]. Sousa et al. [43] indicated that a ratio of 1:40 g/mL solute/solvent is ideal to provide the amount of solvent required to enter the cells thereby improving the permeation of the phenolic compounds. However, it should be noted that the UAE can generate more soluble compounds. Therefore, using high amounts of solvent could lead to saturation of the liquid in the extraction system. Furthermore, high amounts of solvents mean an increased cost for subsequent operations, such as the concentration and filtration of the extracts obtained, as well as an increase in the amount of waste generated [44].

4.6. Extraction Time

During the UAE process the solutes are in contact with the solvent, so the extraction efficiency is greatly influenced by the interaction time between the two phases [41]. Şahin and Şamlı [37] reported that the content of phenolic compounds extracted by Ultrasound increases as a function of time, following a mechanism formed by two main stages. The first is called the “washing” step, which covers the first 10–20 min of extraction. In this step the dissolution of the soluble components on the surfaces of the matrix is carried out and it is at this stage that up to 90% of the recovery of the total content of the phenolic compounds can be achieved thus indicating a considerably rapid extraction rate [45]. In the second stage, known as “slow extraction”, the mass transfer of the solute from the matrix into the solvent is carried out by diffusion; the time of this process can last from 60 to 100 min [37].

5. Optimization of Ultrasonic Assisted Extraction

According to the analysis presented above, it can be inferred that all the variables mentioned affect the efficiency and yield of using UAE to obtain phenolic compounds. Although these effects were addressed in isolation, it should be noted that, in the system they interact together, and the product of the interaction of these variables is reflected in the content of the biological activity of the extracts obtained.
The analysis of the simultaneous effect of the variables can be performed through the implementation of the Response Surface Methodology (RSM), a mathematical and statistical tool that has been widely used to optimize the experimental conditions of a process [46]. Table 4 presents the reports of optimization studies for the production of phenolic compounds by UAE. The main factors to be considered during the process are presented along with the respective optimum conditions determined according to the study carried out.
Among the different methods of RSM reported in Table 2, the design by Box–Behnken is the most frequently reported [46], followed by the central composite design [51] and the face-centered cubic experimental design [34]. The regression analysis on the results obtained from the implementation of these models generates polynomial equations (using the significant values of the estimated regression coefficients), from which the optimal conditions of the process are determined. The main advantage of RSM is the small number of experimental trials required to evaluate the effect of multiple parameters in conjunction with their interactions [47]; it is for this reason that in the process of obtaining polyphenols by means of UAE, this tool has been used in order to maximize extraction yield and the biological activity of the extract.

6. Comparison UAE with Other Methods of Extraction

Several studies demonstrate the efficiency of the UAE process compared to other methods, whether conventional or novel. In the following section, a comparative analysis is presented in which the results obtained by UAE are compared against different methods of extraction.

6.1. Comparison against Conventional Methods

It has been reported that UAE represents an improvement to the extraction yield in the recovery of phenolic compounds compere to conventional extraction methods. Vázquez et al. [56] reported that the UAE provided an extraction yield of 168 mg/g dry weight (DW) in the recovery of anthraquinones from stems of Rubiáceae, exceeding the extraction yield obtained by the Soxhlet method (34 Mg/g DW). In addition, there was a reduction on the extraction time of 16 to 2 h; a reduction in the amount of solvent used (from 36 mL/g to 20 mL/g) was also observed. In the same way Cai et al. [57], report the highest efficiency in the recovery of phenolic compounds from purple potatoes by UAE, with it increasing by 22% the polyphenol content compared to Accelerated-Solvent Extraction (ASE). This trend was also observed in the recovery of flavonoids with an increase of 18.3r this value. Rodríguez-Pérez et al. [58] also reported an increase in the production of phenolic compounds from olefinic leaves by UAE (47 mg GAE/g DW) when compared to conventional extraction (27 mg GAE/g DW), reporting chlorogenic acid as the major compound.
Additionally, extraction efficiency related to the time factor is also demonstrated. Pan et al. [26] reported that UAE reduced the extraction time of phenolic compounds from pomegranate peels by 87% and presented an antioxidant activity greater than 22% greater than those obtained by maceration. Carrera et al. [30] also reported a reduction in the time of extraction of phenolic compounds from grapes with UAE requiring 10 times less extraction time than that of maceration. All studies agreed that this improvement in extraction is due to the fact that the use of ultrasound favors the rupture of the cell wall, with the subsequent increase in the penetration of the solvent.

6.2. Comparison against Non-Conventional Methods

Ledesma-escobar et al. [59] indicate that UAE presented a higher recovery percentage of phenolic compounds from lemon when compared to the Microwave-Assisted Extraction (MAE), particularly for neosperidin (16%) and eriodictiol (13%). These results also indicated that UAE was faster, since the process required only 5 min, compared to 10.8 min for MAE. According to Rodríguez-rojo et al. [60] the improvement observed with UAE is due to the fact that this technique improves the transport of internal solvent by disruption of the cells through cavitation. Yildiz-ozturk et al. [61], also performed the comparison between MAE and UAE during the extraction of phenolic compounds from leaves of Stevia (S. Rebaudiana) and reported that the phenolic compounds obtained by UAE showed a better percent of inhibition by DPPH.
On the contrary M’hiri et al. [62] reported a decrease in the antioxidant activity of the phenolic extract of orange peels which was attributed to the fact that the ultrasound can induce the formation of free radicals in the liquid medium. This leads to sonochemical reactions, causing oxidation and degradation. Therefore, these results indicate that moderate ultrasonic power (100 to 125 W) allows efficient extraction with high antioxidant activity.
Several studies have indicated that the implementation of UAE may also influence the profile of the phenolic compounds present in the extract. Nayak et al. [63] compared phenolic profiles from orange peels (Citrus Sinensis) obtained by UAE and MAE and reported significant differences in composition. This demonstrates that UAE favors a less aggressive system than MAE by obtaining higher extraction yields particularly for Gallic acid (210 μg/g DW) and p-Coumaric acid (171 μg/g DW). Although it is important to obtain higher extraction yields, the stability of the obtained compounds which is related to their biological activity, should be also considered. Such stability depends largely on chemical structure. The flavonoids obtained by UAE have been shown to be highly stable compounds, as only a minimum loss of 10% of compounds was reported after a lapse of 4 weeks of storage at 4 °C in the dark [45].

7. Scale-Up UAE

The UAE represents a feasible technological option for industrial scale-up. The advantage of scaling this method of extraction lies in the reduction of the processing time and high yields obtained, as well as its environmental sustainability. Pingret et al. [64], carried out the extraction of phenolic compounds from apple pulp by UAE, using as scaling parameter the solvent-solute ratio (1: 500) in a pilot extraction tank of 30 L coupled with a quadruple ultrasound output at 25 kHz and 200 W. The results reported a 15% extraction yield higher than that obtained by conventional extraction, where the major compounds were chlorogenic acid, catechins, epicatechin, procyanidins, quercetin 3-O-galactoside and Quercetin 3-O-glucoside. On the other hand, Alexandru et al. [65] performed a pilot-level UAE using 1 kg of clove and 20 L of solvent during a 45-min extraction period and obtained a maximum of 215 mg GAE/L of phenolic compounds with eugenol being one of those found in greater abundance. For this study the scaling parameter was also the solvent-solute ratio (approximately 1:15), using a multi-probe system with four titanium horns driven by the same electronic generator. Among other scaling studies, it is possible to consider the phenolic compounds of Pnus pinaste extraction [31], where the scaling parameter was the capacity of the reactor (1:10), with a capacity of 30 L. This obtained a total of 308.7 mg EQ/100 g DW.
With regards to the economic aspect of UAE, Vieira et al. [7] estimated the cost of production (defined as the ratio of annual operating cost and production rate), of crude extracts of palm heart (Euterpe edulis) by UAE and compared it to agitation extraction by considering the following variables: extraction time, ethanol concentration, temperature and ratio solvent to feed. According with this report, extracts produced by the UAE had slightly higher manufacturing costs (90.57–165.34 USD/kg) than those obtained by the conventional process (87.32–167.48 USD/kg). However, the solvent volume to feed mass ratio presented a lower cost, seeing as how this is one of the most costly inputs. These large-scale experiments demonstrate that UAE represents an alternative for the extraction of phenolic compounds at the industrial level.

8. UAE, Innovation-Driven to Environmental Sustainability

New trends in the development of environmental research are aimed at finding technologies to reduce and prevent pollution; in this context, using UAE to obtain phenolic compounds could be considered as an applicable technology in the field of Green Chemistry as it is possible to use renewable raw materials, which therefore reduces the use of auxiliary substances, and reduces energy consumption [66]. The points mentioned above are derived from the list of principles of Green Chemistry which, when complied with, mean the process can be considered sustainable and therefore “friendly to the environment.” The following sections present an analysis of the relevance of the UAE to each of the above principles.

8.1. Use of Renewable Raw Materials

The growing industrialization of agro-food products, especially those from vegetable sources, generate by-products such as peels, bagasse and/or seeds which are considered as agro-industrial residues that can constitute 20% to 50% of the total weight of the plant material [64,67,68]. The lack of final disposal and the inadequate management of these residues has promoted the search for a use for them and, as such, has given them an added value through the extraction of bioactive phytochemicals [25]. Phenolic compounds can be found in even greater abundance in the peels and seeds than in the edible portion of the plant material. This is true in the case of lemon, orange and grapefruit peels, where the content is 15% higher than the shelled fruit. In the peels of apple, peaches, and pears, the content is twice as high as in peeled fruits [12].
D’Alessandro et al. [27] propose the residues of black Aronia (Aronia melanocarpa) as raw material for the obtaining of flavonoids. They reported that Aronia extracts exhibiting very high antioxidant capacity could be used as additives in food industry and cosmetics (as natural antioxidants and/or natural colorants). The studies of Garcia-castello et al. [35] which were carried out on grapefruit residues (Citrus paradisi L.), indicated the presence of Neohesperidin, Neoeritrocin, Narirutin, Hesperidin and Tangeritin as the major compounds. Reátegui et al. [69] proposed the valorization of blackberry bagasse (Rubus sp.) through UAE to obtain various cyanidines. Finally, Rabelo et al. [70] performed UAE on artichoke residues and reported a chlorogenic acid extraction yield of 16.47 mg/g DW. This indicates that agro-industrial waste can potentially be used in innovative techniques such as UAE to obtain phenolic compounds that are of great value in the industrial field. This would give rise to economic benefits from generating products with added value, and the subsequent reduction in environmental pollution.

8.2. Reduction of the Use of Auxiliary Substances

This principle postulates that the use of substances that are not essential (solvents, reagents to carry out separations, etc.) will be avoided as far as possible, and if used, it will be as safe as possible [3]. A common feature in most reported UAE studies is the substitution of organic solvents which represent a greater toxicity to the environment.
In this sense, the use of Deep Eutectic Solvents (DESs) is mentioned. These solvents are characterized by their high availability, low cost and toxicity and they are positioned as an ecological alternative to conventional solvents. The DESs result from the mixture of one or more components with a high melting point which presents them with the ability to donate and accept protons and electrons to form hydrogen bonds, thus increasing their dissolution capacity [71]. Bubalo et al. [72] presented the use of DESs to extract anthocyanins from grape waste, using 5 different mixtures with glycerol, oxalic acid, malic acid, proline, and sorbose; each were mixed with choline chloride. The results indicated that the hydrochloric acid mixture and choline chloride resulted in the highest extraction yields, equivalent to 30 mg/g DW, with anthocyanins being the major compounds.
Katsampa et al. [38] performed UAE for the recovery of phenolic compounds from onion residues as raw material, using an aqueous mixture of glycerol as a solvent. The authors note that the advantages of the use of glycerol are due to the low dielectric constant, which gives it the ability to extract phenolic compounds which are poorly soluble in water. Furthermore, it is a solvent with high availability, low cost and no toxicity. According to the results, the total content of phenolic compounds was 64.91 mg GAE/g DW, with quercetin and cyanidin being the most abundant compounds.
Among the solvents mentioned above, ethanol stands out for having the mention of “GRAS” (Generally Recognized as Safe), guaranteeing the safety of the process according to Food and Drug Administration (FDA) [10]. Authors like Rodríguez-rojo et al. [60] and Rodrigues et al. [73] emphasize the importance of the implementation of solvents with GRAS denomination when using ethanol to extract acid Rosmarinic from rosemary, and anthocyanins from jabuticaba peels. In general, it can be summarized that an “environmentally friendly” solvent must be one that has low toxicity, low reactivity (non-flammable, high boiling point) and high availability.

8.3. Decreased Energy Consumption

To decrease energy consumption, the reduction in energy requirements is necessary. The process must be carried out at environmental temperature and pressure [3]. In the study presented by González-Centeno et al. [74], who studied the effect of temperature on the time and extraction yield of grape phenolic compounds; they determined that UAE was up to 8 times faster compared to maceration at temperatures of 50 °C. These results show the great variety of advantages of implementing the UAE. It allows a reduction in energy costs when compared to conventional methods which require the addition of heat, in addition to reducing the time periods of the extraction process.

9. Conclusions

The above mentioned points indicate that the efficiency of UAE for the recovery of phenolic compounds is mainly due to the phenomenon of acoustic cavitation. This is because of the propagation of the ultrasonic waves through a liquid medium which causes damage to the vegetal wall and results in an improvement in solvent penetration and the subsequent release of the content of polyphenolic compounds.
UAE is a technology that is placed within the area of Sustainable Chemistry since it promotes the use of renewable raw materials through the extraction of phenolic compounds. In addition to implementing the substitution of organic solvents with solvents that do not present toxic effects, it consumes less energy during the process when compared to conventional methods. It also minimizes process times and temperatures, which is useful for the extraction of thermo-labile compounds, such as phenolic compounds.
All these characteristics demonstrate that UAE represents an alternative innovation for the use of agro-industrial residues through the efficient extraction of phenolic compounds. This is due to the fact that they generate value added products of great interest in the industrial field. Finally, they facilitate the subsequent reduction in environmental pollution compared to other conventional extraction techniques.

Acknowledgments

We thank CONACYT for the grant of Nelly Medina-Torres.

Author Contributions

Nelly Medina-Torres, Teresa Ayora-Talavera and Neith Pacheco selected the topic and contributed to the analysis of information to the structure of the paper, Angeles Sánchez-Contreras and Hugo Espinosa-Andrews contributed several revisions to improve the content and discussion of the document.

Conflicts of Interest

Authors declare no conflict of interest.

References

  1. Gil-ch, G.J.; Villa, A.; Ayala-zavala, J.F.; Heredia, J.B.; Sepulveda, D.; Yahia, E.M.; Gonz, G.A. Technologies for Extraction and Production of Bioactive Compounds to be Used as Nutraceuticals and Food Ingredients: An Overview. Compr. Rev. Food Sci. Food Saf. 2013, 12, 5–23. [Google Scholar]
  2. Da Porto, C.; Porretto, E.; Decorti, D. Ultrasonics Sonochemistry Comparison of ultrasound-assisted extraction with conventional extraction methods of oil and polyphenols from grape (Vitis vinifera L.) seeds. Ultrason. Sonochem. 2013, 20, 1076–1080. [Google Scholar] [CrossRef] [PubMed]
  3. Bendicho, C.; De La Calle, I.; Pena, F.; Costas, M.; Cabaleiro, N.; Lavilla, I. Ultrasound-assisted pretreatment of solid samples in the context of green analytical chemistry. TrAC Trends Anal. Chem. 2012, 31, 50–60. [Google Scholar] [CrossRef]
  4. Armenta, S.; Garrigues, S.; De Guardia, M. The role of green extraction techniques in Green Analyticla Chemistry. Trends Anal. Chem. 2015, 71, 2–8. [Google Scholar] [CrossRef]
  5. Chemat, F.; Khan, M.K. Applications of ultrasound in food technology: Processing, preservation and extraction. Ultrason. Sonochem. 2011, 18, 813–835. [Google Scholar] [CrossRef] [PubMed]
  6. Soria, A.C.; Villamiel, M. Effect of ultrasound on the technological properties and bioactivity of food: A review. Trends Food Sci. Technol. 2010, 21, 323–331. [Google Scholar] [CrossRef]
  7. Vieira, G.S.; Cavalcanti, R.N.; Meireles, M.A.A.; Hubinger, M.D. Chemical and economic evaluation of natural antioxidant extracts obtained by ultrasound-assisted and agitated bed extraction from jussara pulp (Euterpe edulis). J. Food Eng. 2013, 119, 196–204. [Google Scholar] [CrossRef]
  8. Tiwari, B.K. Trends in Analytical Chemistry Ultrasound: A clean, green extraction technology. TrAC Trends Anal. Chem. 2015, 71, 100–109. [Google Scholar] [CrossRef]
  9. Parisi, O.I.; Puoci, F.; Restuccia, D.; Iemma, F.; Picci, N. Polyphenols and Their Formulations: Different Strategies to Overcome the Drawbacks Associated with Their Poor Stability and Bioavailability. Polyphenols Hum. Health Dis. 2014, 4, 29–45. [Google Scholar] [CrossRef]
  10. Vilkhu, K.; Mawson, R.; Simons, L.; Bates, D. Applications and opportunities for ultrasound assisted extraction in the food industry—A review. Innov. Food Sci. Emerg. Technol. 2008, 9, 161–169. [Google Scholar] [CrossRef]
  11. Ignat, I.; Volf, I.; Popa, V.I. A critical review of methods for characterisation of polyphenolic compounds in fruits and vegetables. Food Chem. 2011, 126, 1821–1835. [Google Scholar] [CrossRef] [PubMed]
  12. Balasundram, N. Food Chemistry Phenolic compounds in plants and agri-industrial by-products: Antioxidant activity, occurrence, and potential uses. Food Chem. 2006, 99, 191–203. [Google Scholar] [CrossRef]
  13. Gutiérrez-grijalva, E.P.; Ambriz-pére, D.L.; Leyva-lópez, N.; Castillo-lópez, R.I.; Heredia, J.B. Review: Dietary phenolic compounds, health benefits and bioaccessibility. Arch. Latinoam. Nutr. 2016, 66, 87–100. [Google Scholar]
  14. Shahidi, F.; Ambigaipalan, P. Phenolics and polyphenolics in foods, beverages and spices: Antioxidant activity and health effects—A review. J. Funct. Foods 2015, 18, 820–897. [Google Scholar] [CrossRef]
  15. Paul, E.; Grijalva, G. Bioavailability of dietary phenolic compounds. Rev. Esp. Nutr. Hum. Diet. 2016, 20, 140–147. [Google Scholar] [CrossRef]
  16. Carocho, M.; Ferreira, I.C.F.R. The Role of Phenolic Compounds in the Fight against Cancer—A Review. Anti Cancer Agents Med. Chem. 2013, 13, 1236–1258. [Google Scholar] [CrossRef]
  17. Oroian, M.; Escriche, I. Antioxidants: Characterization, natural sources, extraction and analysis. Food Res. Int. 2015, 74, 10–36. [Google Scholar] [CrossRef] [PubMed]
  18. Musielak, G.; Mierzwa, D.; Kroehnke, J. Trends in Food Science & Technology Food drying enhancement by ultrasound—A review. Trends Food Sci. Technol. 2016, 56, 126–141. [Google Scholar]
  19. Awad, T.S.; Moharram, H.A.; Shaltout, O.E.; Asker, D.; Youssef, M.M. Applications of ultrasound in analysis, processing and quality control of food: A review. Food Res. Int. 2012, 48, 410–427. [Google Scholar] [CrossRef]
  20. Tippens, P.E.; Hernández, A.E.G. Física: Conceptos y Aplicaciones; Javier Neyra Bravo: Naucalpan, D.F., México, 2007. [Google Scholar]
  21. Kadam, S.U.; Tiwari, B.K.; Alvarez, C.; Donnell, C.P.O. Ultrasound applications for the extraction, identification and delivery of food proteins and bioactive peptides. Trends Food Sci. Technol. 2015, 46, 60–67. [Google Scholar] [CrossRef]
  22. Shirsath, S.R.; Sonawane, S.H.; Gogate, P.R. Intensification of extraction of natural products using ultrasonic irradiations—A review of current status. Chem. Eng. Process. Process Intensif. 2012, 53, 10–23. [Google Scholar] [CrossRef]
  23. Chemat, F.; Rombaut, N.; Sicaire, A.; Meullemiestre, A.; Abert-vian, M. Ultrasound assisted extraction of food and natural products. Mechanisms, techniques, combinations, protocols and applications. A review. Ultrason. Sonochem. 2017, 34, 540–560. [Google Scholar] [CrossRef] [PubMed]
  24. Pico, Y. Ultrasound-assisted extraction for food and environmental samples. TrAC Trends Anal. Chem. 2013, 43, 84–99. [Google Scholar] [CrossRef]
  25. Barba, F.J.; Zhu, Z.; Koubaa, M.; Sant, A.S. Green alternative methods for the extraction of antioxidant bioactive compounds from winery wastes and by-products: A review. Trends Food Sci. Technol. 2016, 49, 96–109. [Google Scholar] [CrossRef]
  26. Pan, Z.; Qu, W.; Ma, H.; Atungulu, G.G.; McHugh, T.H. Continuous and pulsed ultrasound-assisted extractions of antioxidants from pomegranate peel. Ultrason. Sonochem. 2012, 19, 365–372. [Google Scholar] [CrossRef] [PubMed]
  27. Galvan D’Alessandro, L.; Kriaa, K.; Nikov, I.; Dimitrov, K. Ultrasound assisted extraction of polyphenols from black chokeberry. Sep. Purif. Technol. 2012, 93, 42–47. [Google Scholar] [CrossRef]
  28. Tchabo, W.; Ma, Y.; Engmann, F.N.; Zhang, H. Ultrasound-assisted enzymatic extraction (UAEE) of phytochemical compounds from mulberry (Morus nigra) must and optimization study using response surface methodology. Ind. Crops Prod. 2015, 63, 214–225. [Google Scholar] [CrossRef]
  29. Al-dhabi, N.A.; Ponmurugan, K.; Maran, P. Development and validation of ultrasound-assisted solid-liquid extraction of phenolic compounds from waste spent coffee grounds. Ultrason. Sonochem. 2017, 34, 206–213. [Google Scholar] [CrossRef] [PubMed]
  30. Carrera, C.; Ruiz-rodríguez, A.; Palma, M.; Barroso, C.G. Ultrasound assisted extraction of phenolic compounds from grapes. Anal. Chim. Acta 2012, 732, 100–104. [Google Scholar] [CrossRef] [PubMed]
  31. Meullemiestre, A.; Petitcolas, E.; Maache-rezzoug, Z.; Chemat, F.; Rezzoug, S.A. Impact of ultrasound on solid-liquid extraction of phenolic compounds from maritime pine sawdust waste. Kinetics, optimization and large scale experiments. Ultrason. Sonochem. 2016, 28, 230–239. [Google Scholar] [CrossRef] [PubMed]
  32. Drosou, C.; Kyriakopoulou, K.; Bimpilas, A.; Krokida, M. A comparative study on different extraction techniques to recover red grape pomace polyphenols from vinification byproducts. Ind. Crops Prod. 2015, 75, 141–149. [Google Scholar] [CrossRef]
  33. Mane, S.; Bremner, D.H.; Tziboula-clarke, A.; Lemos, M.A. Effect of ultrasound on the extraction of total anthocyanins from Purple Majesty potato. Ultrason. Sonochem. 2015, 27, 509–514. [Google Scholar] [CrossRef] [PubMed]
  34. Tomšik, A.; Pavlic, B.; Vladic, J.; Ramic, M.; Brindza, J.; Vidovic, S. Optimization of ultrasound-assisted extraction of bioactive compounds from wild garlic (Allium ursinum L.). Ultrason. Sonochem. 2016, 29, 502–511. [Google Scholar] [CrossRef] [PubMed]
  35. Garcia-castello, E.M.; Rodriguez-lopez, A.D.; Mayor, L.; Ballesteros, R.; Conidi, C.; Cassano, A. Optimization of conventional and ultrasound assisted extraction of fl avonoids from grapefruit (Citrus paradisi L.) solid wastes. LWT Food Sci. Technol. 2015, 64, 1114–1122. [Google Scholar] [CrossRef]
  36. Muñiz-márquez, D.B.; Martínez-ávila, G.C.; Wong-paz, J.E.; Belmares-cerda, R.; Rodríguez-herrera, R.; Aguilar, C.N. Ultraso nics Sonoch emistry Ultrasound-assisted extraction of phenolic compounds from Laurus nobilis L. and their antioxidant activity. Ultrason. Sonochem. 2013, 20, 1149–1154. [Google Scholar] [CrossRef] [PubMed]
  37. Selin Sahin, R.S. Optimization of olive leaf extract obtained by ultrasound-assisted extraction with response surface methodology. Ultrason. Sonochem. 2013, 20, 595–602. [Google Scholar] [CrossRef] [PubMed]
  38. Katsampa, P.; Valsamedou, E.; Grigorakis, S.; Makris, D.P. A green ultrasound-assisted extraction process for the recovery of antioxidant polyphenols and pigments from onion solid wastes using Box-Behnken experimental design and kinetics. Ind. Crops Prod. 2015, 77, 535–543. [Google Scholar] [CrossRef]
  39. Corbin, C.; Fidel, T.; Leclerc, E.A.; Barakzoy, E.; Sagot, N.; Falguiéres, A.; Renouard, S.; Blondeau, J.P.; Ferroud, C.; Doussot, J.; et al. Development and validation of an efficient ultrasound assisted extraction of phenolic compounds from flax (Linum usitatissimum L.) seeds. Ultrason. Sonochem. 2015, 26, 176–185. [Google Scholar] [CrossRef] [PubMed]
  40. Celli, G.B.; Ghanem, A.; Brooks, M.S. Optimization of ultrasound-assisted extraction of anthocyanins from haskap berries (Lonicera caerulea L.) using Response Surface Methodology. Ultrason. Sonochem. 2015, 27, 449–455. [Google Scholar] [CrossRef] [PubMed]
  41. Hossain, M.B.; Brunton, N.P.; Patras, A.; Tiwari, B.; Donnell, C.P.O.; Martin-diana, A.B.; Barry-ryan, C. Optimization of ultrasound assisted extraction of antioxidant compounds from marjoram (Origanum majorana L.) using response surface methodology. Ultrason. Sonochem. 2012, 19, 582–590. [Google Scholar] [CrossRef] [PubMed]
  42. Tao, Y.; Zhang, Z.; Sun, D. Kinetic modeling of ultrasound-assisted extraction of phenolic compounds from grape marc: Influence of acoustic energy density and temperature. Ultrason. Sonochem. 2014, 21, 1461–1469. [Google Scholar] [CrossRef] [PubMed]
  43. Sousa, A.D.; Maia, A.I.V.; Rodrigues, T.H.S.; Canuto, K.M.; Ribeiro, P.R.V.; Pereira, R.D.C.A.; Vieira, R.F.; Brito, E.S.d. Ultrasound-assisted and pressurized liquid extraction of phenolic compounds from Phyllanthus amarus and its composition evaluation by UPLC-QTOF. Ind. Crops Prod. 2016, 79, 91–103. [Google Scholar] [CrossRef]
  44. Wong, J.E.; Muñiz, D.B.; Martínez, G.C.G.; Belmares, R.E.; Aguilar, C.N. Ultrasound-assisted extraction of polyphenols from native plants in the Mexican desert. Ultrason. Sonochem. 2015, 22, 474–481. [Google Scholar] [CrossRef] [PubMed]
  45. Tao, Y.; Wu, D.; Zhang, Q.; Sun, D. Ultrasound-assisted extraction of phenolics from wine lees: Modeling, optimization and stability of extracts during storage. Ultrason. Sonochem. 2014, 21, 706–715. [Google Scholar] [CrossRef] [PubMed]
  46. Chen, M.; Zhao, Y.; Yu, S. Optimisation of ultrasonic-assisted extraction of phenolic compounds, antioxidants, and anthocyanins from sugar beet molasses. Food Chem. 2015, 172, 543–550. [Google Scholar] [CrossRef] [PubMed]
  47. Aybastıer, Ö.; Is, E.; Saliha, S. Optimization of ultrasonic-assisted extraction of antioxidant compounds from blackberry leaves using response surface methodology. Ind. Crops Prod. 2013, 44, 558–565. [Google Scholar] [CrossRef]
  48. Wang, X.; Wu, Y.; Chen, G.; Yue, W.; Liang, Q.; Wu, Q. Optimisation of ultrasound assisted extraction of phenolic compounds from Sparganii rhizoma with response surface methodology. Ultrason. Sonochem. 2013, 20, 846–854. [Google Scholar] [CrossRef] [PubMed]
  49. González-centeno, M.R.; Knoerzer, K.; Sabarez, H.; Simal, S.; Rosselló, C.; Femenia, A. Effect of acoustic frequency and power density on the aqueous ultrasonic-assisted extraction of grape pomace (Vitis vinifera L.)—A response surface approach. Ultrason. Sonochem. 2014, 21, 2176–2184. [Google Scholar] [CrossRef] [PubMed]
  50. Heydari, M.; Rajaei, A.; Salar, D.; Ali, S.; Bolourian, S. Optimization of ultrasonic-assisted extraction of phenolic compounds from bovine pennyroyal (Phlomidoschema parviflorum) leaves using response surface methodology. Ind. Crops Prod. 2014, 57, 195–202. [Google Scholar] [CrossRef]
  51. Mkadmini, K.; Jdey, A.; Abdelly, C.; Majdoub, H.; Ksouri, R. Optimization of ultrasound-assisted extraction of antioxidant compounds from Tunisian Zizyphus lotus fruits using response surface methodology. Food Chem. 2015, 184, 80–89. [Google Scholar]
  52. Vidovic, S.; Zekovic, Z.; Vladic, J.; Cvejin, A.; Pavlic, B. Modeling and optimization of ultrasound-assisted extraction of polyphenolic compounds from Aronia melanocarpa by-products from filter-tea factory. Ultrason. Sonochem. 2015, 23, 360–368. [Google Scholar]
  53. Xu, J.; Wang, W.; Liang, H.; Zhang, Q.; Li, Q. Optimization of ionic liquid based ultrasonic assisted extraction of antioxidant compounds from Curcuma longa L. using response surface methodology. Ind. Crops Prod. 2015, 76, 487–493. [Google Scholar] [CrossRef]
  54. He, B.; Zhang, L.; Yue, X.; Liang, J.; Jiang, J.; Gao, X.; Yue, P. Optimization of Ultrasound-Assisted Extraction of phenolic compounds and anthocyanins from blueberry (Vaccinium ashei) wine pomace. Food Chem. 2016, 204, 70–76. [Google Scholar] [CrossRef] [PubMed]
  55. Sharmila, G.; Nikitha, V.S.; Ilaiyarasi, S.; Dhivya, K.; Rajasekar, V.; Kumar, N.M.; Muthukumaran, K.; Muthukumaran, C. Ultrasound assisted extraction of total phenolics from Cassia auriculata leaves and evaluation of its antioxidant activities. Ind. Crops Prod. 2016, 84, 13–21. [Google Scholar] [CrossRef]
  56. Vázquez, M.F.B.; Comini, L.R.; Martini, R.E.; Montoya, S.C.N.; Bottini, S.; Cabrera, J.L. Comparisons between conventional, ultrasound-assisted and microwave-assisted methods for extraction of anthraquinones from Heterophyllaea pustulata Hook f. (Rubiaceae). Ultrason. Sonochem. 2014, 21, 478–484. [Google Scholar] [CrossRef] [PubMed]
  57. Cai, Z.; Qu, Z.; Lan, Y.; Zhao, S.; Ma, X.; Wan, Q.; Jing, P.; Li, P. Conventional, ultrasound-assisted, and accelerated-solvent extractions of anthocyanins from purple sweet potatoes. Food Chem. 2016, 197, 266–272. [Google Scholar] [CrossRef] [PubMed]
  58. Rodríguez-Pérez, C.; Quirantes-Piné, R.; Fernández-Gutiérrez, A.; Segura-Carretero, A. Optimization of extraction method to obtain a phenolic compounds-rich extract from Moringa oleifera Lam leaves. Ind. Crops Prod. 2015, 66, 246–254. [Google Scholar] [CrossRef]
  59. Ledesma-escobar, C.A.; Priego-capote, F. Comparative study of the effect of auxiliary energies on the extraction of Citrus fruit components. Talanta 2015, 144, 522–528. [Google Scholar] [CrossRef] [PubMed]
  60. Rodríguez-rojo, S.; Visentin, A.; Maestri, D.; Cocero, M.J. Assisted extraction of rosemary antioxidants with green solvents. J. Food Eng. 2012, 109, 98–103. [Google Scholar] [CrossRef]
  61. Yildiz-ozturk, E.; Nalbantsoy, A.; Tag, O.; Yesil-celiktas, O. A comparative study on extraction processes of Stevia rebaudiana leaves with emphasis on antioxidant, cytotoxic and nitric oxide inhibition activities. Ind. Crops Prod. 2015, 77, 961–971. [Google Scholar] [CrossRef]
  62. M´hiri, N.; Ioannou, I.; Boudhrioua, N.; Ghoul, M. Processing Effect of different operating conditions on the extraction of phenolic compounds in orange peel. Food Bioprod. 2015, 6, 161–170. [Google Scholar] [CrossRef]
  63. Nayak, B.; Dahmoune, F.; Moussi, K.; Remini, H.; Dairi, S.; Aoun, O.; Khodir, M. Comparison of microwave, ultrasound and accelerated-assisted solvent extraction for recovery of polyphenols from Citrus sinensis peels. Food Chem. 2015, 187, 507–516. [Google Scholar] [CrossRef] [PubMed]
  64. Pingret, D.; Fabiano-Tixier, A.S.; Le Bourvellec, C.; Renard, C.M.; Chemat, F. Lab and pilot-scale ultrasound-assisted water extraction of polyphenols from apple pomace. J. Food Eng. 2012, 111, 73–81. [Google Scholar] [CrossRef]
  65. Alexandru, L.; Cravotto, G.; Giordana, L.; Binello, A.; Chemat, F. Ultrasound-assisted extraction of clove buds using batch- and flow-reactors: A comparative study on a pilot scale. Innov. Food Sci. Emerg. Technol. 2013, 20, 167–172. [Google Scholar] [CrossRef]
  66. Oniszczuk, A.; Olech, M. Optimization of ultrasound-assisted extraction and LC-ESI–MS/MS analysis of phenolic acids from Brassica oleracea L. var. sabellica. Ind. Crops Prod. 2016, 83, 359–363. [Google Scholar] [CrossRef]
  67. Goula, A.M.; Thymiatis, K.; Kaderides, K. Processing Valorization of grape pomace: Drying behavior and ultrasound extraction of phenolics. Food Bioprod. 2016, 100, 132–144. [Google Scholar] [CrossRef]
  68. Dahmoune, F.; Boulekbache, L.; Moussi, K.; Aoun, O.; Spigno, G. Valorization of Citrus limon residues for the recovery of antioxidants: Evaluation and optimization of microwave and ultrasound application to solvent extraction. Ind. Crops Prod. 2013, 50, 77–87. [Google Scholar] [CrossRef]
  69. Luis, J.; Reátegui, P.; Paula, A.; Barbero, G.F.; Rezende, C.A.; Martínez, J. Extraction of antioxidant compounds from blackberry (Rubus sp.) bagasse using supercritical CO2 assisted by ultrasound. J. Supercrit. Fluids 2014, 94, 223–233. [Google Scholar]
  70. Rabelo, R.S.; Machado, M.T.C.; Martínez, J.; Hubinger, M.D. Ultrasound assisted extraction and nano fi ltration of phenolic compounds from artichoke solid wastes. J. Food Eng. 2016, 178, 170–180. [Google Scholar] [CrossRef]
  71. Bosiljkov, T.; Dujmi, F. Processing Natural deep eutectic solvents and ultrasound-assisted extraction: Green approaches for extraction of wine lees anthocyanins. Food Bioprod. 2016, 2, 195–203. [Google Scholar]
  72. Tomaševic, M.; Kovac, K.; Bubalo, M.C.; Natka, C. Green extraction of grape skin phenolics by using deep eutectic solvents. Food Chem. 2016, 200, 159–166. [Google Scholar]
  73. Rodrigues, S.; Fernandes, F.A.N.; Sousa, E.; Brito, D.; Dutra, A.; Narain, N. Ultrasound extraction of phenolics and anthocyanins from jabuticaba peel. Ind. Crops Prod. 2015, 69, 400–407. [Google Scholar] [CrossRef]
  74. González-Centeno, M.; Comas-Serra, F.; Femenia, A.; Rosselló, C.; Simal, S. Effect of power ultrasound applicationon aqueous extraction of phenolic compounds and antioxidant capacity from grape pomace (Vitis vinifera L.): Experimental kinetics and modeling. Ultrasonics Sonochem. 2015, 22, 506–514. [Google Scholar] [CrossRef] [PubMed]
Figure 1. General classification of phenolic compounds [16,17].
Agronomy 07 00047 g001
Figure 2. The principle of acoustic cavitation. Modified from Soria and Villamiel [6].
Agronomy 07 00047 g002
Figure 3. Graphical representation of cavitation-bubble collapsing and releasing plant material in three steps. (A) Bubble and vegetal cell representation, (B) Breakdown of the cell wall and bubble collapse, finally (C) Diffusion of the solvent through the cellular disruption and release of the compounds. Modified from Shirsath et al. [22].
Agronomy 07 00047 g003
Figure 4. Representation of an Ultrasound system coupled to a probe. Modification from Barba et al. [25].
Agronomy 07 00047 g004
Table 1. Main characteristics, advantages and disadvantages of novel and conventional extraction technologies [3,5].
CharacteristicNovel Extraction TechnologyConventional Methods
Ultrasound-AssistedMicrowave-AssistedSupercritical FluidsAccelerated by SolventsMechanical AgitationSoxhlet
Driving forceAcoustic cavitationMicrowave powerPressure in conjunction with supercritical fluidHeat in conjunction with the solvent under pressureSolvent contactHeat
Extraction time10–60 min3–30 min10–60 min10–20 minSeveral hours6–24 h
Sample size1–30 g1–10 g1–5 g1–30 g1–30 g1–30 g
Solvent amount50–200 mL10–40 mL30–60 mL15–60 mLLarge volume150–500 mL
Power AmountModerateHighModerateModerateHighHigh
AdvantageEasy to handle, safe (atmospheric pressure and ambient temperature), moderate use of solvent, reproducibleFast, easy to handle, moderate use of solventFast, safe, no filtering required, high selectivityFast, safe, no filtering requiredNot use o sophisticated equipmentNot use of sophisticated equipment
DisadvantagesRequired filtration step, possible degradation of compounds at high frequenciesRisk of explosion (solvent must absorb microwave power), expensive, required filtration stepMany parameters to optimizePossible degradation of thermo-labiles compoundsRisk of spills and exposure to organic vapors, degradation of thermos-labiles compounds, required filtration stepExposure risk to organic vapors, degradation of thermos-labiles compounds
Table 2. Main phenolic compounds in some vegetal sources [11,14].
PolyphenolVegetal Source
FlavonoidsAnthocyanins: Cyanidin, pelargonidin, petunidinBilberries, blackcurrant, cherries, cranberries, black berries, blueberries, strawberries, apricot, grapes, red cabbage, black bean, barley, pomegranate, onion, sweet potato, cocoa
Flavones: Apigenin, luteolin, rutinCitric fruits, celery, parsley, spinach, artichoke, buckwheat, corn, sorghum, black rice, red cabbage, asparagus, olive, coffee, oregano, fenugreek seeds, nuts
Isoflavones: Genistein, daidzein, glyciteinSoybean, black beans, green peas
Flavanones: Naringenin, hesperitine, hesperidin, eriodictynCitric fruits: grapefruit, orange, lemon; tomato, sorghum, mint
Flavonols: Quercetin, kaempferol, isoquercetine, myricetinApples, grapes, citric fruits, beans, blueberries, buckwheat, cranberries, endive, leeks, lettuce, onions, olive, pepper, tomato, moringa, sorghum, nuts, broccoli, potato, strawberries, blackwheat, cocoa, peach, raspberries, asparagus, lentils, oregano, rosemary, almonds, fenugreek seeds
Flavanols (flavan-3-ols): (+)-catechin, (−)-epicatechin, (+)-gallocatechin, (−)-epigallocatechinApricots, apples, blueberries, grapes, onions, lettuce, buckwheat, hazelnut, cocoa, evening primrose, black tea, green tea, almonds
Phenolic acidsHydroxybenzoic acid: Gallic, p-hydroxy-benzoic, protocatechuic, vanillic and syringic acidsGrapes, blueberries, bilberries, blackberries, lentils, cranberries, oilseeds, apricots, blackwheat, carrot, onions, potato, sweet potato, soybean, rapeseed, borage, canola, evening primrose, sorghum, wheat, barley, millet rice, oat, peas, olive, coffee, nuts, almonds, ginger, turmeric, hazelnut
Hydroxycinnamic acid: Caffeic, ferulic, p-coumaric and sinapic acidsBlueberries, blackcurrant, apricot, blackberries, peas, grapes, rice, rye, buckwheat, millet, sorghum, cranberries, bilberries, oat, barley, broccoli, carrot, onion, potato, soybean, rapeseed, canola, flaxseed, hazelnut, borage, olive, almonds, black pepper, clove, turmeric
TanninsProanthocyanidins (condensed tannins)Berries, cocoa, barley, buckwheat, lentils, beans, peas, rapeseed, canola, evening primrose, blackcurrant, raspberries
Hydrolysable tanninsGrapes, blueberries, cranberries, blackberries, pomegranate, lentils, rapeseed, canola
StilbenesResveratrolGrapes, peanuts, bilberries, nuts, blueberries
LignansBarley; flaxseed, sesame seed
Table 3. Effect of involved variables of Ultrasound Assisted Extraction (UAE) in polyphenols extraction yields from different vegetable sources.
Variable InvolvedVegetable SourceCompoundsUAE ConditionsPerformance/RemarksReference
Ultrasound irradiationPomegranate peelTotal polyphenolsContinuous irradiationIncreased yield of 24%, Pan et al. [26]
Pomegranate peelTotal polyphenolsPulsed irradiation of 5sIncreased yield of 22%, Pan et al. [26]
FrequencyGrape seedsPhenolic compounds25 kHz–60 kHzLow frequencies enhance extraction yield Soria and Villamiel [6]
Grapes Resveratrol47 kHz, 14 WIncreased yield of 24–28% Barba et al. [25]
Grapes by productsPolyphenols35 kHzIncreased yield of 50%Barba et al. [25]
Herbal extractsPolyphenols20–24 kHzIncreases yield up to 34%Vilkhu et al. [10]
Ultrasonic powerWild garlic Bioactive compounds19.2 to 38.4 W/LLow power resulted in better extraction Tomšik et al. [34]
AmplitudeGrapesPhenolic compounds20, 50 and 100%Increased yield of 15%, higher cycles increases recoveryMeullemiestre et al. [31]
Purple Majesty potatoAnthocyanins30, 50 and 70%Anthocyanins increased in all cases when higher amplitude valuesMane et al. [33]
Pre-treatmentGrape pomacePolyphenolsSolar driedIncreased extractionDrosou et al. [32]
Purple Majesty potatoAnthocyaninsFreeze dried and MicrowaveIncreased anthocyanins extraction and decrease solvent usedMane et al. [33]
Solvent compositionBlack chokeberry AnthocyaninsEthanol concentration of 0 and 50%Ethanol at 50% showed 3-fold higher than water. Galvan et al. [27]
Purple Majesty potatoAnthocyaninsEthanol concentration 50 and 70%Anthocyanins presented and increment when ethanol increasesMane et al. [33]
Grape pomacePolyphenolsWater, water: ethanol (1:1) and ethanol 100%Ethanol: water favor released of polyphenolsDrosou et al. [32]
Herbal extractsPolyphenolsWater–ethanol (1:1)Increases yield up to 34%Vilkhu et al. [10]
Laurus nobilis L.Phenolic compoundsEthanol concentration at 0, 35, 70%Extraction yield increases when ethanol concentration increases.Muñiz-Márquez et al. [36]
Wild garlic Bioactive compoundsEthanol concentration 30 to 70%Higher ethanol concentration resulted in better extraction yieldTomšik et al. [34]
TemperatureBlack chokeberryAnthocyanins20–70 °CIncrement of temperatures improved polyphenol extractionGalvan et al. [27]
Wild garlic Bioactive compounds40–80 °CHigher temperatures resulted in better extraction yieldTomšik et al. [34]
Grapefruit Flavonoids25–70 °CHigher temperature increases extraction yieldGarcía-Castello et al. [35].
Grape marcPhenolic compounds20–50 °CBetter extraction yield is obtained a higher temperatures Tao et al. [42]
Solid/liquid ratioLaurus nobilis L.Phenolic compounds1:4, 1:8, 1:12When solid/liquid ratio decreases polyphenol extract yield increases Muñiz-Márquez et al. [36]
TimeWild garlic Bioactive compounds40 to 80 minHigher time resulted in better extractionTomšik et al. [34]
Laurus nobilis L.Phenolic compounds20, 40, 60 minPresented lower effect in extraction yieldMuñiz-Márquez et al. [36]
Black chokeberry Anthocyanins0–24 min,Higher at the beginning of the extraction, decreases considerably with timeGalvan et al. [27]
Purple Majesty potatoAnthocyanins5, 30, 60, 120 minA maximal increment of Anthocyanins was observed at 30 minMane et al. [33]
Table 4. Optimization studies reported for the production of phenolic compounds by UAE.
Optimization
Reference* Raw material
* Solvent
* Equipment
Optimization MethodologyOptimal ConditionsResults
Aybastıer et al. [47]* Blackberry leaves.
* Methanol.
* Ultrasonic bath.
Box–Behnken.(Sol.): 61%–64%
T/°C: 66–68.
T/M: 105–117.
TPC: 80.19 mg GAE/g DW.
Wang et al. [48]* Rhizomes of S. (Stoloniferum Buch.-Ham).
* Ethanol.
* Ultrasound: 25 kHz, 300 W
Box–Behnken.(Sol.): 75.3%
T/M: 40
Solv/sol: 19.21 mL/g.
TPC: 881.12 μg/g DW.
González-centeno et al. [49]* Grape skin (Vitis vinifera L.).
* Water.
* Ultrasound generator
Box–Behnken.T/M: 25
Fc: 40
kHz. Pw: 150 W/L.
TPC: 32.31 mg GAE/g FW.
AA: 53.47 mg Trolox/100 g FW
Majd et al. [50]*Phlomidoschema parviflorum.
* Methanol 80%.
* Ultrasonic probe system: 200 W
Box–Behnken.T/°C: 41.5
T/M: 49.3
pH: 6.5.
TPC: 15.4 mg GAE/g DB.
Celli et al. [40]* Berries (Lonicera caerulea L.).
* Ethanol.
* Ultrasonic bath: 40 kHz, and 100 W.
Box–Behnken.(Sol.): 80%
T/°C: 35
T/M: 20
Solv/sol: 25/1 (mL/g).
Anthocyanins T: 22.73 mg cyanidin E/g DW.
Chen et al. [46]* Sugar beet molasses.
* Ethanol.
* Ultrasonic bath: 40 kHz.
Central compound Design.(Sol.): 57%–63%
T/°C: 41–48
T/M: 66–73.
TPC: 17.36 mg GAE/100 mL.
AA: 16.66 mg/g.
Hammi et al. [51]* Azufaifo (Ziziphus lotus).
* Ethanol.
* Ultrasonic bath: 35 kHz.
Central Design Composite Rotatable(Sol.): 50%
T/°C: 63
T/M: 25
Solv/sol: 67 mL/g.
TPC: 40.782 mg GAE/g DW.
AA: 0.289 mg/mL.
Ramić et al. [52]* Black Aronia (Aronia melanocarpa).
* Ethanol 50%.
* Ultrasonic bath: 40 kHz.
Factorial complete (33) with three levels.T/°C: 70
T/M: 80.1
Pw: 206.64 W.
TPC: 15.41 mg GAE/mL.
Tchabo et al. [28]* Fruits of blackberry (Morus nigra).
* Enzyme (Pectinex UF).
* Ultrasonic probe (35.3 cm × 28.2 cm × 10.4 cm).
Box–Behnken.(Sol.): 0.010%
T/M: 11.58.
Fc: 33.82 kHz.
TPC: 298.06 mg/100 mL.
Totals Flavonoids: 379.24 mg/100 mL.
Xu et al. [53]* Rhizomes of Curcuma longa L.
* Bromine solution.
* Ultrasonic bath: 40 kHz.
Box–Behnken.(Sol.): 4.2 mol/L
T/M: 90
Solv/sol: 30 mL/g.
Pt: 250 W.
Totals Curcuminoids: 5.72 g/100 g.
He et al. [54]* Blueberry wine waste (Vaccinium ashei).
* Ethanol.
* Ultrasonic bath: 40 kHz.
Box–Behnken.T/°C: 61.3
T/M: 23.67
Solv/sol: 21.70 mL/g.
TPC: 16.41 mg GAE/g DW.
Sharmila et al. [55]* Cassia flower (Cassia auriculata).
* Methanol, Ethanol, and Water.
* Ultrasonic generator.
Box–Behnken.(Sol.): 60%
T/M: 5
pH: 6.2.
Pw: 50 W.
TPC: 15.41 mg GAE/g DW.
Percent inhibition by DPPH: 90.5%
Definitions: (Sol.): Solvent concentration; T/°C: Temperature (°C); T/M: Time (minutes); Solv/sol: Ratio Solvent/solute; Fc: Frequency; Pw: Power; Amp: Amplitude; TPC: Total phenolic compounds; AA: Antioxidant activity; DW: Dry Weight.

