
Vegetable Intercropping in a Small-Scale Aquaponic System
by
 , , , ,
Carmelo Maucieri
1,2,*, 
Carlo Nicoletto
1,
Zala Schmautz
2 ,
,
Paolo Sambo
1,
Tamas Komives
3,4 ,
,
Maurizio Borin
1 and 
Ranka Junge
2 1
Department of Agronomy, Food, Natural Resources, Animals and Environment—DAFNAE, University of Padova, Agripolis Campus, Viale dell’Università 16, 35020 Legnaro, Italy
2
Institute of Natural Resource Sciences, Zurich University of Applied Sciences, Grüental, 8820 Wädenswil, Switzerland
3
Plant Protection Institute, Hungarian Academy of Sciences, Centre for Agricultural Research, Herman Otto 15, 1022 Budapest, Hungary
4
Faculty of Agricultural Science, Esterhazy Karoly University, Matrai ut 36, 3200 Gyongyos, Hungary
*
Author to whom correspondence should be addressed.
Agronomy 2017, 7(4), 63; https://doi.org/10.3390/agronomy7040063
Submission received: 15 August 2017
/
Revised: 5 September 2017
/
Accepted: 20 September 2017
/
Published: 23 September 2017
Abstract
:This paper reports the results of the first study of an aquaponic system for Pangasianodon hypophthalmus production that uses Lactuca sativa L. (lettuce) and Cichorium intybus L. rubifolium group (red chicory) intercropping in the hydroponic section. The experiment was conducted in a greenhouse at the Zurich University of Applied Sciences, Wädenswil, Switzerland, using nine small-scale aquaponic systems (each approximately 400 L), with the nutrient film technique (NFT). The intercropping of vegetables did not influence the water temperature, pH, electric conductivity (EC), oxidation–reduction potential, nor O2 content. Intercropping with red chicory increased the lettuce sugar content (+16.0% and +25.3% for glucose and fructose, respectively) and reduced the lettuce caffeic acid content (−16.8%). In regards to bitter taste compounds (sesquiterpene lactones), intercropping reduced the concentrations of dihydro-lactucopicrin + lactucopicrin (−42.0%) in lettuce, and dihydro-lactucopicrin + lactucopicrin (−22.0%) and 8-deoxy–lactucin + dihydro-lactucopicrin oxalate (−18.7%) in red chicory, whereas dihydro-lactucin content increased (+40.6%) in red chicory in regards to monoculture. A significantly higher organic nitrogen content was found in the lettuce (3.9%) than in the red chicory biomass (3.4%), following the intercropping treatment. Anion and cation contents in vegetables were affected by species (Cl−, NO3−, PO43−, SO42−, and Ca2+), intercropping (K+ and Mg2+), and species × intercropping interactions (NO2− and NH4+). Experimental treatments (monoculture vs intercropping and distance from NFT inlet) did not exert significant effects on leaf SPAD (index of relative chlorophyll content) values, whereas the red coloration of the plants increased from the inlet to the outlet of the NFT channel. Intercropping of lettuce and red chicory affected the typical taste of these vegetables by increasing the sweetness of lettuce and changing the ratio among bitter taste compounds in red chicory. These results suggest intercropping as a possible solution for improving vegetable quality in aquaponics. Although the results are interesting, they have been obtained in a relatively short period, thus investigations for longer periods are necessary to confirm these findings. Further studies are also needed to corroborate the positive effect of the presence of red chicory in the system on fish production parameters.
1. Introduction
During the last decades, global aquaculture production has expanded at an average annual rate of 6.2%, and accounted for 44.1% of total production (including for non-food uses) in 2014 [1]. The large-scale application of aquaculture, however, is limited by land and water availability as well as by environmental concerns due to emissions and waste [2]. Thus, further expansion of aquaculture depends on the development and application of new technologies that intensify fish cultivation while maximizing water and nutrient reuse, and minimizing environmental impacts [3]. A possible solution to these concerns is aquaponics, which is an ingenious combination of aquaculture and hydroponics—fish excreta provide nutrients for plant growth, and the treated water can be reused in the system. Aquaponics has been gaining popularity during the last decade, and the number of publications on a variety of aquaponic systems (different setup, different plant and different fish species) is increasing exponentially [4].
In this paper, we report the results of the first study of an aquaponic system that uses intercropping of two vegetables in its hydroponic section. Intercropping has potential to allow yield gains without increased inputs, and/or greater stability of yield with decreased inputs. Thus, it could be one route to deliver sustainable intensification [5].
While there are studies of intercropping in hydroponic cultivation, there are none that we are aware of in aquaponics. Ding et al. [6] determined the allelopathic potential of garlic on the growth of pepper plants in a floating hydroponic system. The response of the pepper plants depended on the number of garlic plants included in the co-culture system, indicating an association between pepper growth and the garlic root exudate concentration. When grown together, the pepper plant height, chlorophyll content, and peroxidase, catalase and phenylalanine ammonia–lyase activities were significantly increased; in contrast, a reduction in methane dicarboxylic aldehyde content was observed. On the other hand, Shibli and Smith [7] compared hydroponically grown tomatoes and potatoes, and reported that monocultures of both species grew better than intercropped species. In the intercropped cultures, tissue mineral content decreased, medium pH became more acidic, osmotic potential decreased and electrical conductivity increased, as compared to monocultures. A lettuce seedling bioassay did not indicate evidence of allelopathic compounds accumulating in the hydroponic intercropped system. Mortley et al. [8] compared peanuts and sweet potatoes in monocultured and intercropped, recirculating hydroponic systems, using the nutrient film technique (NFT). Whilst the number of storage roots per sweet potato plant was similar for both, monoculture and intercropping, the storage root fresh and dry masses were higher (29% and 36% higher, respectively), in intercropped plants. On the other hand, peanut total dry mass, pod dry mass, mature and total seed dry mass, and fibrous root dry mass were all higher in monoculture than in intercropping, while the useful biomass/total biomass ratio was similar for both arrangements.
As reviewed above, somewhat contradictory results were obtained in terms of vegetable yield and product quality in experiments with different species, indicating a species–specific response. Furthermore, an effect of intercropping on water quality in hydroponic systems has been reported [7], implicating also a possible positive effect on the fish growing in intercropping aquaponic systems. A fundamental aspect of intercropping is that it avoids unfavorable intra- or interspecific competition, whilst fostering interspecific facilitation, in which plants increase the growth and survival of their neighbors [9]. Methods for selecting intercropping partners have not been developed yet. There exists certain knowledge that has accumulated over centuries, e.g., the advantage of nitrogen transfer between legumes and non-leguminous plants in field conditions. Unfortunately, there is no information available about plant competition or facilitation when intercropping is used in novel production systems like aquaponics.
Red chicory is known for its high polyphenol content as compared to lettuce [10] and, in particular, for the presence of antioxidants and bioactive molecules in its root tissue [11]. These can be released in the nutrient solution through root exudates, the amount of which reaches 20% of a plant’s aboveground production [12].
With this in mind, this work was carried out in order to test the hypothesis that the intercropping of lettuce and red chicory will have positive effects on the yield and quality of both vegetables, and possibly even on the growth of fish in aquaponic systems, due to the positive effect of red chicory root exudates.
2. Results
2.1. Water Quality
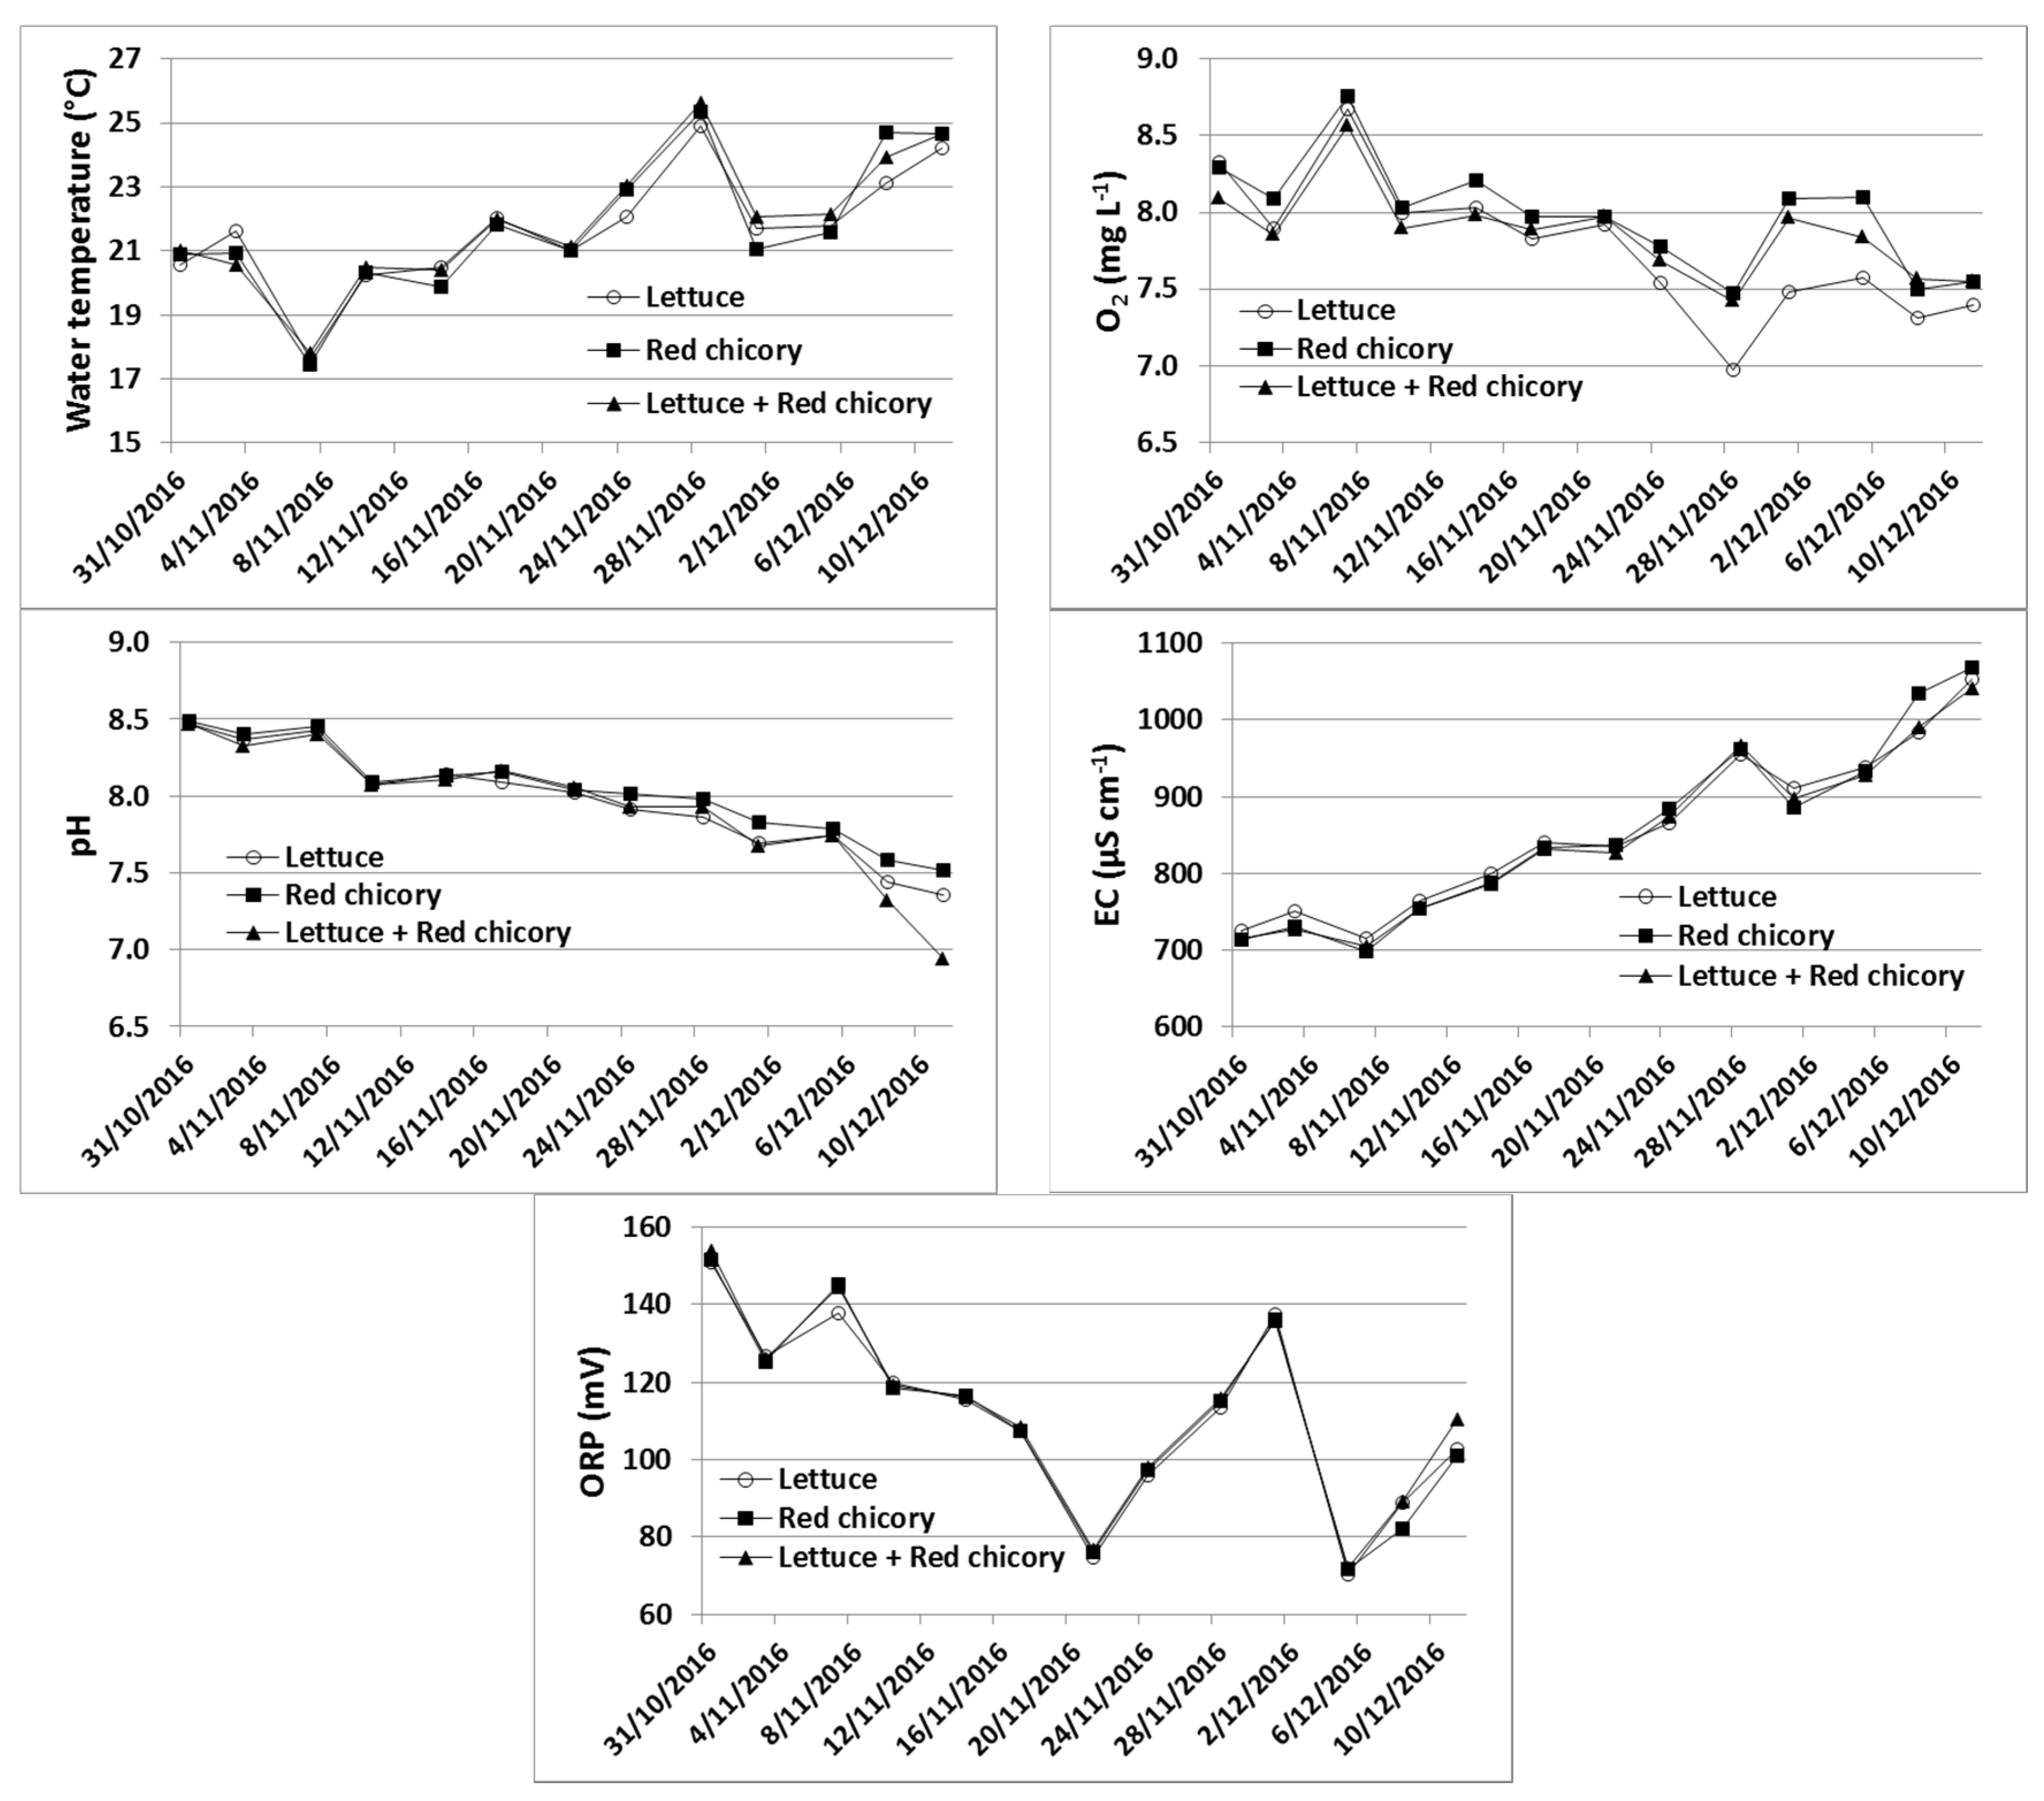
The water temperature did not show marked variation between treatments, with an average value of 21.8 ± 2.1 °C, whereas significant variations were observed during the trial (Figure 1). The pH, electric conductivity (EC), oxidation–reduction potential (ORP), O2 content and temperature were not influenced (ANOVA, p > 0.05) by the treatments (Figure 1). In regards to NH4+–N and NO2−–N, on average (between monitoring dates), contents in water were different among treatments, with significantly (ANOVA, p < 0.01) lower values in the system with red chicory (0.094 ± 0.038 mg L−1 and 0.107 ± 0.042 mg L−1 for NH4+–N and NO2−–N, respectively) compared to the lettuce alone, and red chicory and lettuce intercropped (which showed average contents of 0.143 ± 0.066 mg L−1 and 0.153 ± 0.073 mg L−1 mg L−1 in the water, for NH4+–N and NO2−–N, respectively).
A treatment effect on PO43− water content was also found, with a significantly (ANOVA, p < 0.05) higher content with intercropping treatment (6.5 ± 3.1 mg L−1) than the other two treatments, which showed an average concentration of 4.7 ± 1.6 mg L−1. No significant differences (ANOVA, p > 0.05) were detected among treatments for Na+ (grand mean 98.2 ± 17.1 mg L−1), Mg2+ (grand mean 112.4 ± 13.2 mg L−1), K+ (grand mean 33.6 ± 28.2 mg L−1), Ca2+ (grand mean 37.5 ± 2.5 mg L−1), Cl− (grand mean 95.0 ± 43.1 mg L−1), NO3− (grand mean 200.1 ± 141.9 mg L−1), or SO42− (grand mean 47.5 ± 12.2 mg L−1).
2.2. Plant Production
Experimental treatments (monoculture vs intercropping, and distance from NFT inlet) did not exert significant effects (ANOVA, p > 0.05) on morpho-biometric characteristics, SPAD values (index of relative chlorophyll content), plant weights or dry matter content, with differences between species (Table 1). In regards to the color of leaves, no significant differences (ANOVA, p > 0.05) were found for lightness (L*) or blue-yellow components (b*), whereas the a* value (green-red components) significantly (ANOVA, p < 0.05) increased from the inlet (−3.806) to the outlet (−0.596) of the NFT channel. The high differences that were recorded between species are related to the intrinsic color characteristic of the two crops considered. Lettuce does not have red tones, and consequently, the a* values are always negative in contrast to what is recorded for chicory, a typical vegetable with red colored leaves. Intercropping with red chicory significantly increased (ANOVA, p > 0.05) the sugar content in lettuce (+16.0% and +25.3% for glucose and fructose, respectively) (Table 2). Intercropping exerted no effect (ANOVA, p < 0.05) on the sugar content of red chicory (Table 3).
The total phenol content and total antioxidant activity of lettuce and red chicory were not influenced (ANOVA, p > 0.05) by intercropping, and were significantly (ANOVA, p < 0.01) higher in red chicory (Figure 2). Chlorogenic acid was detected in both plant species, whereas caffeic acid was detected only in lettuce, with a significantly (ANOVA, p < 0.05) lower value (−16.8%) in the intercropped system (Table 2). Chicoric acid was found only in red chicory plants, with no treatment effect (ANOVA, p > 0.05) (Table 3).
The two plant species were characterized by different bitter taste compounds (sesquiterpene lactones). In lettuce, intercropping significantly reduced (ANOVA, p < 0.05) the concentration (−42.0%) of dihydro-lactucopicrin + lactucopicrin (Table 4). Specific bitter taste compounds in red chicory responded to intercropping with a significant (ANOVA, p < 0.05) increase (+40.6%) in dihydrolactucin and a significant reduction in dihydro-lactucopicrin + lactucopicrin (−22.0%), and 8-deoxy-lactucin + dihydro-lactucopicrin oxalate (−18.7%) (Table 5). Total organic nitrogen in the biomass was not significantly different (ANOVA, p > 0.05) between lettuce and red chicory when they were cultivated alone, with an average concentration of 3.7%. In the intercropping systems, lettuce had a significantly (ANOVA, p < 0.05) higher organic nitrogen content (3.9%) than red chicory (3.4%). Anion and cation contents in the dry biomasses of lettuce and red chicory were affected (ANOVA, p < 0.05) by the species (Cl−, NO3−, PO43−, SO42−, and Ca2+), the intercropping treatment (K+ and Mg2+), and the species x intercropping treatment interactions (NO2− and NH4+) (Table 6).
2.3. Fish Production
Pangasius (Pangasianodon hypophthalmus) mortality was zero, thus showing that no acute negative effect on fish health was exerted by the plants. During the experiments, the pangasius fish in each system consumed, on average, 386 g of feed. Fish production parameters are listed in Table 7. The obtained results, although without significant differences (ANOVA, p > 0.05), suggest a positive effect of red chicory presence on fish growth. Specific growth rate (SGR) was always below 1% (Table 7).
3. Discussion
3.1. Water Quality
pH is an important parameter in aquaponics because it influences both fish and plants, the former through nitrification rates and the fraction of toxic unionized ammonia in the system, and the latter through the nutrients’ availabilities [13]. Although aquaponic systems can tolerate a wide range of pH values (from 6.0 to 9.0) [14], literature data indicate that the optimum water pH range for nitrifying bacteria is between 7.0 and 8.5 [15,16], whereas lower pH values (from 5.5 to 7.2) result in better availability of plant nutrients [17,18,19] because the precipitation of Fe, Mn, P, Ca, and Mg to insoluble and unavailable salts is avoided [13]. A compromise between nitrification and nutrient availability is reached in aquaponic systems by maintaining pH values close to 7 [20]. In this study, the pH value was optimal, ranging between 6.5 and 8.5, showing a constant decrease during the monitoring period. This decrease can be attributed to the bacteria-mediated nitrification [21] and to the accumulation of CO2 that reacts with water and thus produces carbonic acid [22].
EC values increased over the experimental period, indicating the accumulation of ions, due to the ions released from the fish feed and the ions derived from the mineralization of accumulated organic matter [23]. We assume that the increase in EC is attributable mainly to the ions that are not readily absorbed by plants (Na+, Cl−, SO42−), suggesting that water exchange should be scheduled for the system over the medium–long term in order to prevent possible toxic effects to the plants and/or to the fish.
Water ORP values varied during the experiment (Figure 1) showing, independently from the date and the treatment type, an average value of 111.6 ± 24.1 mV, indicating oxidative conditions in the systems that enable complete nitrification. This is confirmed by the water O2 content that showed an average value of 7.9 ± 0.4 mg L−1, which was within the optimal range (5 to 8 mg L−1) suggested for aquaponic systems [24].
3.2. Plant Production
Plant weight was very low (5 to 10 times lower) when compared to other studies from both greenhouse and open field conditions [25,26,27]. This was due to both the short experimental period, due to the red chicory cultivar being characterized by a growth cycle of about 50 days, and the environmental conditions. In particular, the low temperature reduced fish feed consumption, which in turn affected nutrient levels in the water.
Considering the color coordinates, the a* value variation indicated that, from the inlet to the outlet of the NFT channel, the color profile of the vegetables decreased in the green, and increased in the red fraction. This suggested that plants positioned further from the inlet of the NFT channel, were more stressed—probably due to the depletion of nutrients in the water flow—and responded to stress by producing more anthocyanins.
It is difficult to explain the increased lettuce sugar content following intercropping with red chicory, because of the limited availability of experiments in this field. Nevertheless, it is possible to hypothesize the mechanisms that have led to this result by referring to intercropping experiments in soil , albeit with different species. Ahmad et al. [28] showed that the chlorophyll content in pepper (Capsicum annuum L.) increased when intercropped with garlic (Allium sativum L.). Any variation in chlorophyll content is expected to bring changes in photosynthesis rates. Consequently, the higher content of sugars in lettuce may be due to the higher content of chlorophylls, as evidenced, though not significantly, by the SPAD values.
The levels of chlorogenic acid and chicoric acid in red chicory plants in aquaponics were much higher when compared to other types of radicchio (Cichorium intybus L., group Rubifolium) [29], which probably reflects higher stress levels. Also, chemical compounds responsible for bitter taste were higher than those found in other studies [30]. Moreover, if we consider each sesquiterpene lactone’s sensory threshold [31], the bitter taste of red chicory cultivated in aquaponic systems could be easily perceived. Variations in anion and cation contents in lettuce and red chicory dry biomasses are linked to the different nutritional needs of the species, but also to the ionic equilibria present in the cultivation system. For example, the high levels of nitrate in lettuce are mainly due to the greater capacity of lettuce to absorb nitric nitrogen, as opposed to red chicory [32]. Conversely, the lower Mg2+ content found in R+ (red chicory intercropped with lettuce) is related to the known antagonistic effect of K+, which is highly absorbed in R+. This result is in turn linked to the presence of Ca2+, which may have antagonistic effects against K+. In fact, the lower Ca2+ content in R (red chicory) and R+, mainly due to the higher absorption capacity of Ca2+ by lettuce, exerts a greater assimilation of K+ by the red chicory itself.
3.3. Fish Production
Fish SGR was influenced by the feed composition, and values ranging from 0.93% to 2.28% have been previously reported [33,34,35,36]. Feed conversion ratios (FCR) ranged from 1.48 to 1.71, with lower values in the systems with red chicory. Literature data showed FCR values ranging from 1.49% to 3.80% [33,34,35,36]. The better fish performance in the systems with red chicory was probably due to the better water quality, in terms of NH4+ and NO2− levels. This is indirectly confirmed by the findings of Lam et al. [37] who reported higher fish growth at higher hydroponics/aquaculture ratios because the higher plant presence to absorb the fish waste provides better water quality conditions for the fish.
4. Materials and Methods
4.1. Experimental Design
The experiment was conducted from 31 October to 12 December 2016 (6 weeks) in a double plastic-covered greenhouse at the Zurich University of Applied Sciences (ZHAW) in Wädenswil, Switzerland. Nine small-scale aquaponics systems were used and arranged in a randomized block experimental design; each consisting of a fish tank, a settling tank, a biofilter and a 7.5 m long NFT channel (Figure 3). The total volume of each system was approximately 400 L. Aeration into the sump and the biofilter was provided via compressed air using AL-80 air pumps (Alita Industries, Arcadia, CA, USA) (one pump for every three systems) and air stone diffusers, to assure suitably dissolved oxygen (DO) levels, as well as proper, continuous mixing of biochips in the biofilter. A water pump (Aquarius Universal Eco 4000, Oase GmbH, Hörstel, Germany) with an approximate flow rate of 62 L h−1 directed water flow from the biofilter to the NFT channels. Three heaters (NEWA Therm pro 300W, NEWA Tecno Industrial Srl, Loreggia, Italy) were installed in the biofilter to maintain constant temperatures in the system (26.5 ± 1.5 °C). No additional lighting was used. Water evapotranspiration of systems was reintegrated 7 times during the experiment, adding 3.0 ± 0.5 L system−1 day−1 (0.75% of system water).
The tanks were stocked with pangasius (Pangasianodon hypophthalmus). The fish were manually fed ad libitum with a swimming pelleted feed (Pre Grower-15 EF, 2.0 mm, 50% protein, 1.35% total phosphorus) three times per day. The NFT channels of the three systems each were planted with (i) lettuce (Lactuca sativa L.) alone, (ii) red chicory (Cichorium intybus L. rubifolium group) alone and (iii) an intercropping of these two species.
4.2. Water Quality Monitoring
The system water was monitored twice a week by measuring temperature, dissolved oxygen (DO), pH, and electric conductivity (EC) with a portable multi-parameter meter (HQ40d Portable Multi-Parameter Meter, Hach Lange GmbH, Germany). Once a week, the levels of ammonium nitrogen (NH4+–N) and nitrite nitrogen (NO2−–N) were determined photometrically (cuvette tests, Hach Lange GmbH, Germany). Quantitative determination of Na+, Mg2+, K+, Ca2+, Cl−, NO3−, PO43−, and SO42− was carried out by ion chromatography at the end of experiment on frozen samples taken six times from the third to the sixth experimental weeks.
4.3. Fish Monitoring
The fish mortality was monitored daily. All fish from each tank were weighed together at the beginning and at the end of experiment, and the following parameters were determined:
4.4. Plant Harvest and Biomass Analysis
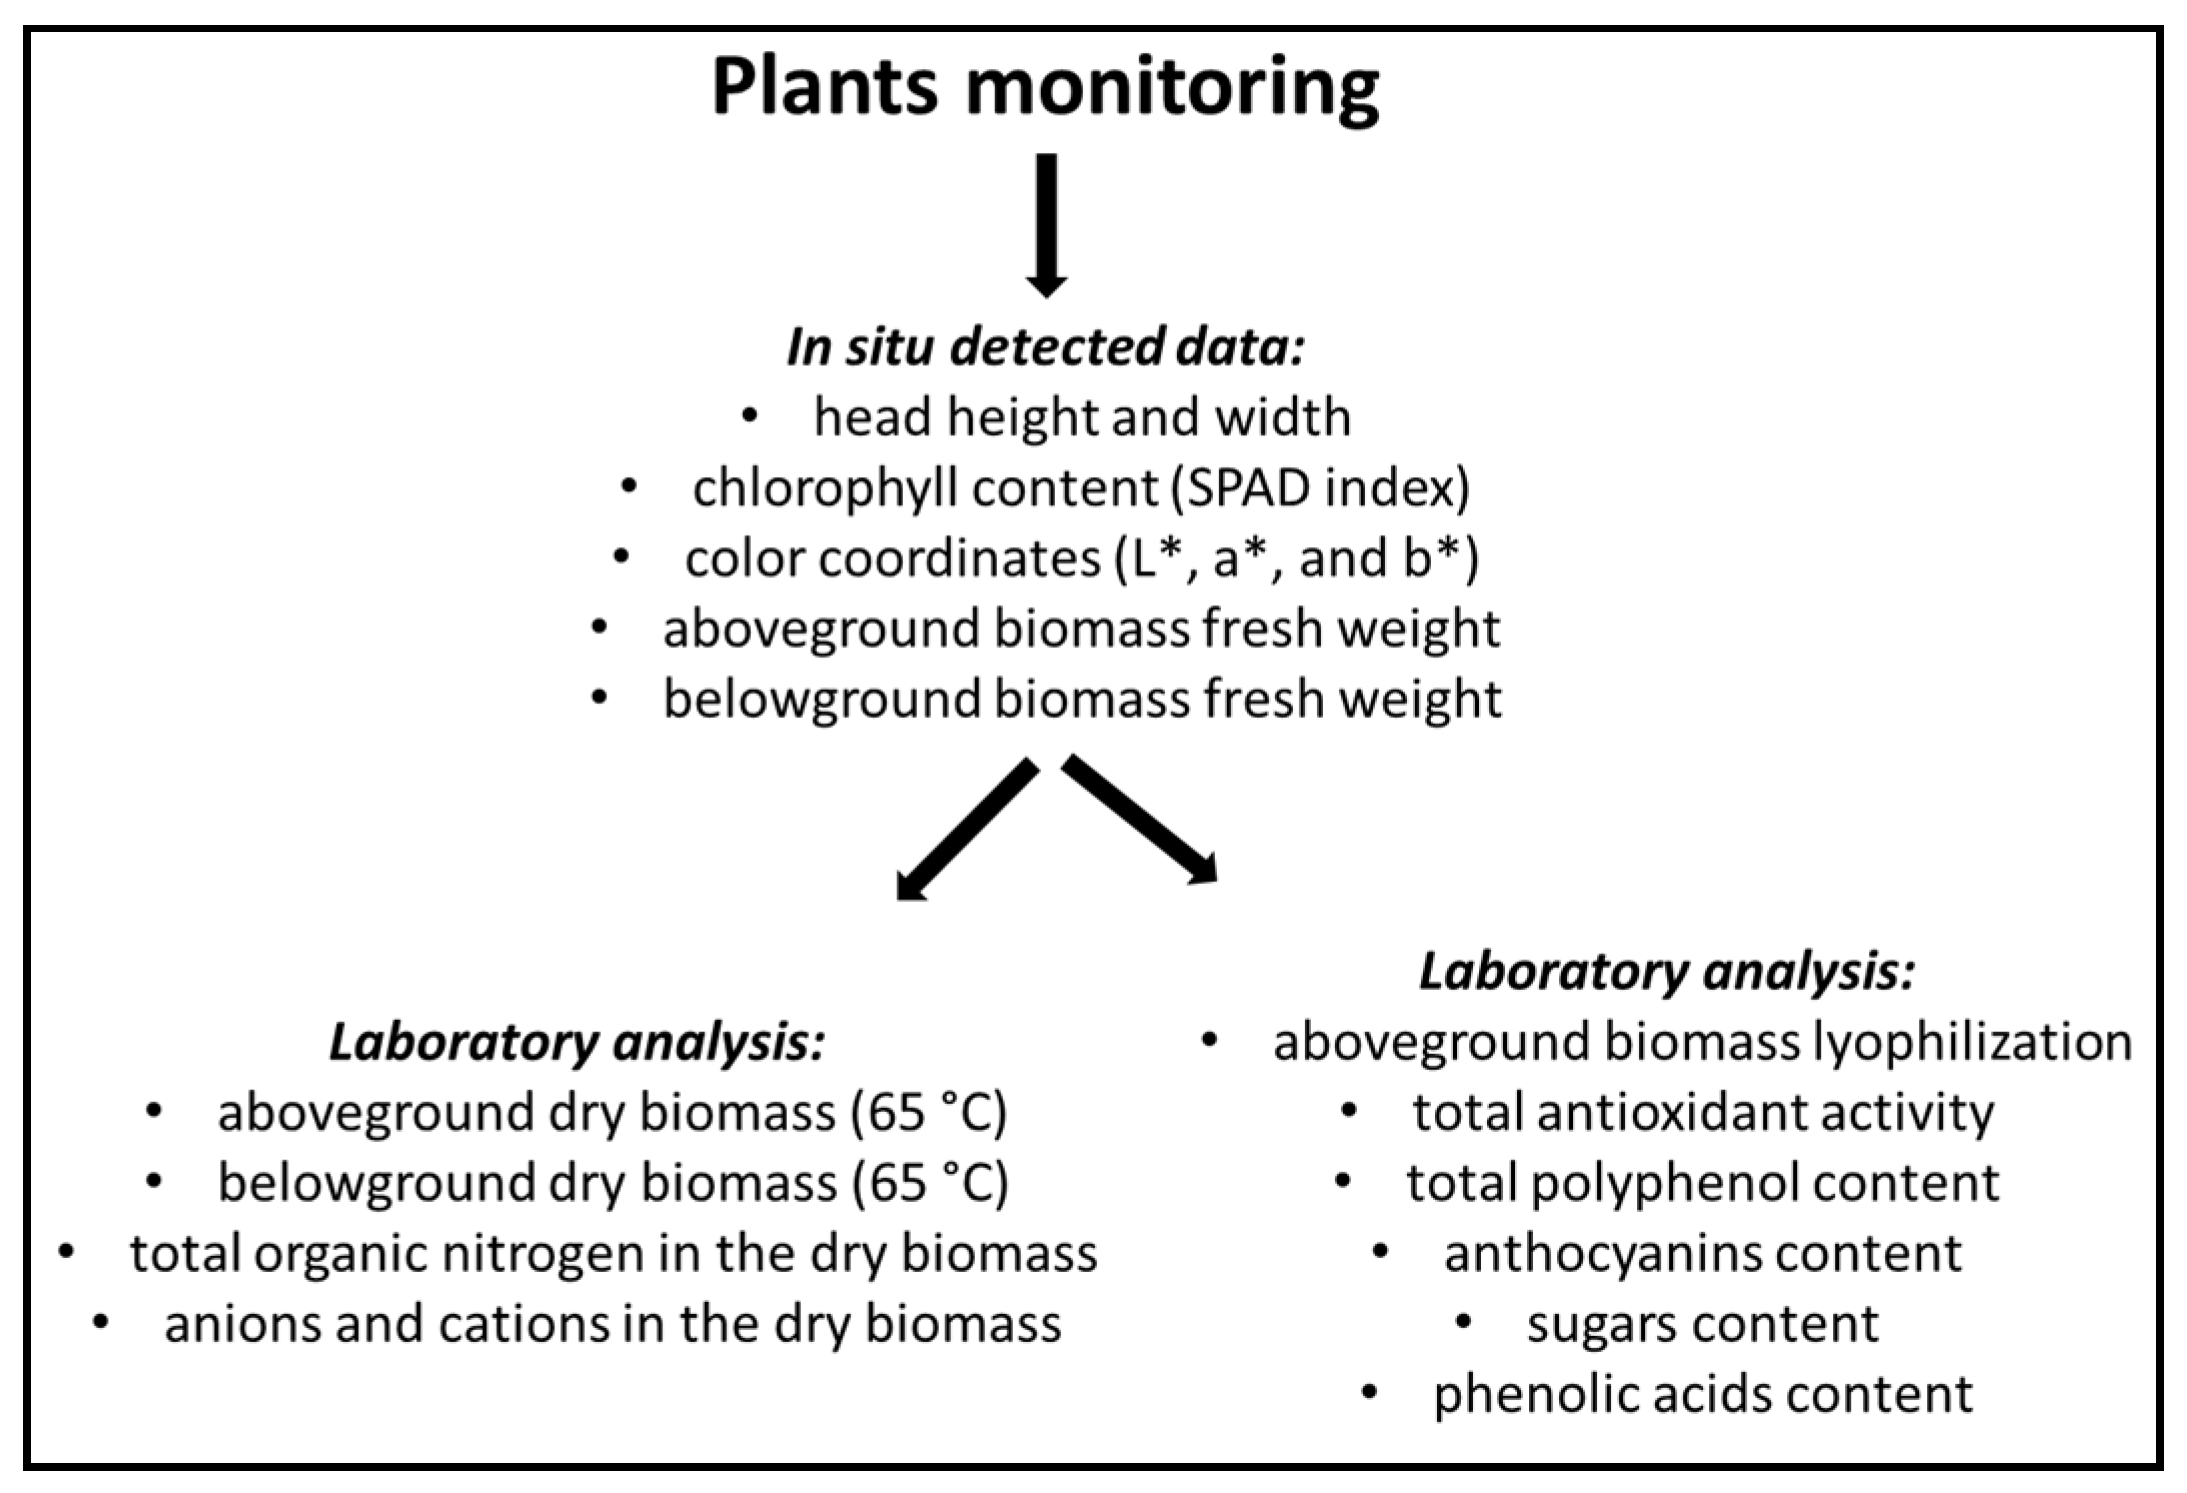
Thirty seedlings per system were transplanted into NFT channels on 31 October 2016 and were harvested on 12 December 2016, by removing two plants at five points on each NFT channel (Figure 3), for a total of 10 and 20 plants for each monoculture and intercropping system, respectively. Monitoring of plants is schematized in Figure 4.
Plants selected for sampling were morpho-biometrically characterized for head height and width, chlorophyll content (SPAD index), and color coordinates (L*, a*, and b*—explained in Section 4.4.1), one day before harvest. At harvest time, one plant per sampling point (in total 5 and 10 plants for each monoculture and intercropping system, respectively) was divided into aboveground and belowground biomasses, and the fresh weights of both were determined. The dry matter content was determined by drying samples in a thermo-ventilated oven at 65 °C until a constant weight was achieved (i.e., two days). Total organic nitrogen (Kjeldahl method), anion and cation contents (method explained in Section 4.4.5) in the dry biomasses were measured. Another plant per sampling point (in total 5 and 10 plants for each monoculture and intercropping system, respectively) was lyophilized and analyzed to determine total antioxidant activity, polyphenol content, anthocyanins, sugars and phenolic acid content.
4.4.1. SPAD Index and Plant Color
The leaf chlorophyll content was indirectly measured through the SPAD index, with three readings per plant, using a portable chlorophyll meter (SPAD-502, Minolta, Japan). For both species leaf color was measured via a Minolta colorimeter CR-300 (Minolta Camera Co., Osaka, Japan) to obtain L*, a* and b* values. L* indicated lightness, read from 0 (completely opaque or “black”) to 100 (completely transparent or “white”). A positive a* value indicated redness (−a* is greenness) and a positive b* value indicated yellowness (−b* is blueness) on the hue-circle. Measurements were made in the distal parts of leaves, avoiding leaf veins.
4.4.2. Extraction and Analysis of Phenols
Plant tissues (0.2 g) were homogenized in methanol (20 mL) with an Ultra Turrax T25, until reaching uniform consistency, at 13,500 rpm. Samples were filtered (filter paper, 589 Schleicher) and appropriate aliquots of extracts were assayed by the Folin–Ciocalteau (FC) assay for total phenol content. For the HPLC analysis, extracts were further filtered through cellulose acetate syringe filters (0.45 µm). For each sample, triplicate extractions and analyses were carried out. Results are reported on a dry matter basis.
The content of total phenols was determined by the FC assay [38], with gallic acid as the calibration standard, using a Shimadzu UV-1800 spectrophotometer (Columbia, MD, USA). The FC assay was carried out by pipetting 200 µL of plant tissue extract into a 10 mL PP tube. This was followed by the addition of 1 mL FC reagent (Labochimica s.r.l.). The mixture was vortexed for 20–30 s and 800 µL of filtered 20% sodium carbonate solution was added 8 minutes after the addition of the FC reagent. This was recorded as time zero; the mixture was then vortexed for 20–30 s. After 2 h at room temperature, the absorbance of the colored reaction product was measured at 765 nm. Total phenol content in the extracts was calculated from a standard calibration curve, built with different concentrations of gallic acid, ranging from 0 to 400 µg mL−1 (correlation coefficient: R2 = 0.9988). Results were expressed as milligrams of gallic acid equivalent per kg (mg GAE kg−1) of dry matter.
Phenolic acids were separated and quantified by an HPLC diode array detection using a Jasco X-LC system, consisting of a model PU-2080 pump, a multi-wavelength detector (model MD-2015), autosampler (model AS-2055) and column oven (model CO-2060). ChromNAV Chromatography Data System software was used for the analysis of results. The separation of phenolic acids was achieved on a Tracer Extrasil OSD2 column (5 µm, 250 × 4.6 mm), operating at 35 °C, at a flow rate of 1 mL min−1. The mobile phase consisted of two solvents: 0.1% formic acid (A) and methanol (B). Gradient elution was as follows: 0–100% B over 50 min and held at 100% B for an additional 10 min to clean up the column. Two wavelengths (310 and 325 nm), were used to detect eluent composition. HPLC analysis at 325 nm was used for the quantification of chlorogenic acid, caffeic acid, and ferulic acid. Quantification of p-coumaric acid was performed at 310 nm. Phenolic acids were quantified following a calibration method. Four standards ranging from 0.3 to 30 mg L−1 of chlorogenic acid hemihydrate, p-coumaric acid, caffeic acid, and ferulic acid were used.
4.4.3. Determination of Antioxidant Activity by Ferric Reducing Antioxidant Power (FRAP)
The assay was based on the methodology of Benzie and Strain [39]. The FRAP reagent was prepared fresh so that it contained 1 mm 2,4,6-tripyridyl-2-triazine (TPTZ) and 2 mm ferric chloride in 0.25 m sodium acetate at pH 3.6. A 100 µL aliquot of the methanol extract prepared as above was added to 1900 µL FRAP reagent and thoroughly mixed. After leaving the mixture at 20 °C for 4 min, the absorbance at 593 nm was determined. Data were determined by using a calibration curve (0–6000 µg mL−1 ferrous ion), produced by the addition of freshly prepared ammonium ferrous sulfate. FRAP values were calculated as µg mL−1 ferrous ion (ferric reducing power) from three determinations and are presented as mg kg−1 Fe2+E (ferrous ion equivalent).
4.4.4. Quantitative Determination of Sugars by HPLC
The sugar content was determined by liquid chromatography. The Jasco X-LC system consisted of a pump (model PU-2080), refractive index detector (RI-2031), autosampler (AS-2055) and column (CO-2060). The software used was a ChromNAV Chromatography Data System. The separation of sugars was achieved on a HyperRez XP Carbohydrate Pb++ analytical column (7.7 × 300 mm; Thermo Scientific, Milan), operating at 80 °C. Isocratic elution was effected using water at a flow rate of 0.6 mL min−1. d-(+)-glucose and d-(−)-fructose were quantified following a calibration method. The calibration curves were generated with concentrations of standards ranging from 100 to 1000 mg L−1.
4.4.5. Quantitative Determination of Anions and Cations by Ion Chromatography (IC)
IC was performed using an ICS-900 system (Dionex Corp., Milan). Chromeleon 6.5 Chromatography Management software was used for system control and data processing. A Dionex IonPac AS23 analytical column (4 × 250 mm) and guard column (4 × 50 mm) were used for anion separation, whereas a Dionex IonPac CS12A analytical column (4 × 250 mm) and guard column (4 × 50 mm) were used for cation separation. The eluent consisted of 4.5 mmol L−1 sodium carbonate and 0.8 mmol L−1 sodium bicarbonate at a flow rate of 1 mL min−1 for anions and of 20 mmol L−1 methanesulfonic acid for cations at the same flow rate. For the calibration, Dionex solutions containing seven anions at different concentrations and five cations were taken as standards and the calibration curves were generated with concentrations ranging respectively from 0.4 to 20 mg L−1 and 0.5 to 50 mg L−1.
4.5. Statistical Analysis
Statistical analysis was performed according to a randomized block design with three treatments in triplicate. Data were normally distributed (Shapiro–Wilk’s W test), and so they were analyzed by analysis of variance (ANOVA). In the case of a significant F-value, the means were compared using Tukey’s Honest Significant Difference (HSD) test.
5. Conclusions
This paper tested the hypothesis that intercropping lettuce and red chicory in aquaponic systems would have a positive effect on vegetable yields and quality, and on the growth of fish. No significant effect due to intercropping was observed on the vegetables' yield whereas species-specific responses on the vegetables’ qualitative traits were observed. In particular, intercropping increased the glucose and fructose contents and reduced the caffeic acid content in the lettuce. No unique response for red chicory with intercropping cultivation was obtained in regards to the main bitter taste chemical compounds, with a significant increase in dihydrolactucin and decrease in dihydro-lactucopicrin + lactucopicrin and 8-deoxy-lactucin + dihydro-lactucopicrin oxalate in intercropped plants. There was a positive effect from the presence of red chicory in aquaponic system on fish growth parameters. Our results suggest that: (1) the intercropping technique is a possible solution to improve vegetable quality in aquaponic systems; (2) intercropping of lettuce and red chicory affects the typical taste of these vegetables (sweetness and bitter taste for lettuce and red chicory, respectively). Although the results are interesting they have been obtained in a relatively short period; further studies for a longer period are needed to confirm our findings and to validate the observed effects on fish growth.
Acknowledgments
This research was supported by COST Action FA1305 “The EU Aquaponics Hub; Realising Sustainable Integrated Fish and Vegetable Production for the EU”. Carmelo Maucieri’s work was supported by grant COST-STSM-ECOST-STSM-FA1305-011016-080268 and by Department of Agronomy, Food, Natural resources, Animals and Environment research grant “Aquaponic—Sustainable management of aquaculture effluent as an unconventional source for irrigation and fertilization of crops”.
Author Contributions
C.M., C.N., M.B. and R.J. conceived and designed the experiments; C.M., Z.S. and C.N. performed the experiments; C.M. and C.N. analyzed the data; R.J., M.B. and P.S. contributed reagents/materials/analysis tools; C.M., C.N., Z.S., T.K. and R.J. wrote the paper.
Conflicts of Interest
The authors declare no conflict of interest.
References
- FAO (Food and Agriculture Organization of the United Nations). The State of World Fisheries and Aquaculture. 2016. Available online: http://www.fao.org/3/a-i5555e.pdf (accessed on 31 July 2017).
- Islam, M.S. Nitrogen and phosphorus budget in coastal and marine cage aquaculture and impacts of effluent loading on ecosystem: Review and analysis towards model development. Mar. Environ. Res. 2005, 50, 48–61. [Google Scholar] [CrossRef] [PubMed]
- Hu, Z.; Lee, J.W.; Chandran, K.; Kim, S.; Brotto, A.C.; Khanal, S.K. Effect of plant species on nitrogen recovery in aquaponics. Bioresour. Technol. 2015, 188, 92–98. [Google Scholar] [CrossRef] [PubMed]
- Junge, R.; König, B.; Villarroel, M.; Komives, T.; Jijakli, M.H. Strategic points in aquaponics. Water 2017, 9, 182. [Google Scholar] [CrossRef]
- Brooker, R.W.; Bennett, A.E.; Cong, W.F.; Daniell, T.J.; George, T.S.; Hallett, P.D.; Iannetta, P.P.M.; Jones, H.G.; Karley, A.J.; Li, L.; et al. Improving intercropping: A synthesis of research in agronomy, plant physiology and ecology. New Phytol. 2015, 206, 107–117. [Google Scholar] [CrossRef] [PubMed] [Green Version]
- Ding, H.; Cheng, Z.; Liu, M.; Hayat, S.; Feng, H. Garlic exerts allelopathic effects on pepper physiology in a hydroponic co-culture system. Biol. Open 2016, 5, 631–637. [Google Scholar] [CrossRef] [PubMed]
- Shibli, R.A.; Smith, M.A.L. Capacity for biocompatibility assessment in tissue culture and hydroponic systems. J. Plant Nutr. 1999, 22, 1529–1540. [Google Scholar] [CrossRef]
- Mortley, D.G.; Loretan, P.A.; Hill, W.A.; Bonsi, C.K.; Morris, C.E.; Hall, R.; Sullen, D. Biocompatibility of sweetpotato and peanut in a hydroponic system. HortScience 1998, 33, 1147–1149. [Google Scholar] [PubMed]
- Hauggaard-Nielsen, H.; Jensen, E.S. Facilitative root interactions in intercrops. Plant Soil 2005, 274, 237–250. [Google Scholar] [CrossRef]
- Llorach, R.; Tomás-Barberán, F.A.; Ferreres, F. Lettuce and chicory byproducts as a source of antioxidant phenolic extracts. J. Agric. Food Chem. 2004, 52, 5109–5116. [Google Scholar] [CrossRef] [PubMed]
- Street, R.A.; Sidana, J.; Prinsloo, G. Cichorium intybus: Traditional uses, phytochemistry, pharmacology, and toxicology. Evid. Based Complent. Altern. Med. 2013. [Google Scholar] [CrossRef] [PubMed]
- Kuzyakov, Y.; Ehrensberger, H.; Stahr, K. Carbon partitioning and below-ground translocation by Lolium perenne. Soil Biol. Biochem. 2001, 33, 61–74. [Google Scholar] [CrossRef]
- Tyson, R.V.; Treadwell, D.D.; Simonne, E.H. Opportunities and challenges to sustainability in aquaponic systems. HortTechnology 2011, 21, 6–13. [Google Scholar]
- Zou, Y.; Hu, Z.; Zhang, J.; Xie, H.; Guimbaud, C.; Fang, Y. Effects of pH on nitrogen transformations in media-based aquaponics. Bioresour. Technol. 2016, 210, 81–87. [Google Scholar] [CrossRef] [PubMed]
- Tyson, R.V. Reconciling water quality parameters impacting nitrification in aquaponics: The pH levels. Proc. Fla. State Hortic. Soc. 2004, 117, 79–83. [Google Scholar]
- Goddek, S.; Delaide, B.; Mankasingh, U.; Ragnarsdottir, K.V.; Jijakli, H.; Thorarinsdottir, R. Challenges of sustainable and commercial aquaponics. Sustainability 2015, 7, 4199–4224. [Google Scholar] [CrossRef]
- Tyson, R.V.; Simonne, E.H.; Treadwell, D.D.; Davis, M.; White, J.M. Effect of water pH on yield and nutritional status of greenhouse cucumber grown in recirculating hydroponics. J. Plant Nutr. 2008, 31, 2018–2030. [Google Scholar] [CrossRef]
- Tyson, R.V.; Simonne, E.H.; Treadwell, D.D.; White, J.M.; Simonne, A. Reconciling pH for ammonia biofiltration and cucumber yield in a recirculating aquaponic system with perlite biofilters. HortScience 2008, 43, 719–724. [Google Scholar]
- Da Silva Cerozi, B.; Fitzsimmons, K. The effect of pH on phosphorus availability and speciation in an aquaponics nutrient solution. Bioresour. Technol. 2016, 219, 778–781. [Google Scholar] [CrossRef] [PubMed]
- Rakocy, J.E. Aquaponics-Integrating Fish and Plant Culture; Wiley-Blackwell: Hoboken, NJ, USA, 2012; pp. 344–386. [Google Scholar]
- Szwerinski, H.; Arvin, E.; Harremoës, P. pH-decrease in nitrifying biofilms. Water Res. 1986, 20, 971–976. [Google Scholar] [CrossRef]
- Raven, J.; Caldeira, K.; Elderfield, H.; Hoegh-Guldberg, O.; Liss, P.; Riebesell, U.; Shepherd, J.; Turley, C.; Watson, A. Ocean Acidification Due to Increasing Atmospheric Carbon Dioxide; The Royal Society: London, UK, 2005; p. 68. [Google Scholar]
- Liang, J.Y.; Chien, Y.H. Effects of feeding frequency and photoperiod on water quality and crop production in a tilapia–water spinach raft aquaponics system. Int. Biodeterior. Biodegrad. 2013, 85, 693–700. [Google Scholar] [CrossRef]
- Somerville, C.; Cohen, M.; Pantanella, E.; Stankus, A.; Lovatelli, A. Small-Scale Aquaponic Food Production. Integrated Fish and Plant Farming; Technical Paper No. 589; FAO Fisheries and Aquaculture 2014, FAO: Rome, Italy, 2014; p. 262. [Google Scholar]
- Nicoletto, C.; Santagata, S.; Zanin, G.; Sambo, P. Effect of the anaerobic digestion residues use on lettuce yield and quality. Sci. Hortic. 2014, 180, 207–213. [Google Scholar] [CrossRef]
- Sabat, T.; Kaniszewski, S.; Dysko, J. Effect of flood fertigation on yield of greenhouse lettuce grown in different substrates. J. Elementol. 2015, 20, 407–416. [Google Scholar] [CrossRef]
- Kim, H.; Jeong, H.; Jeon, J.; Bae, S. Effects of irrigation with saline water on crop growth and yield in greenhouse cultivation. Water 2016, 8, 127. [Google Scholar] [CrossRef]
- Ahmad, I.; Cheng, Z.; Meng, H.; Liu, T.; Nan, W.; Khan, M.A.; Khan, A.R. Effect of intercropped garlic (Allium sativum) on chlorophyl. Pak. J. Bot. 2013, 45, 1889–1896. [Google Scholar]
- Nicoletto, C.; Maucieri, C.; Sambo, P. Effects on water management and quality characteristics of ozone application in chicory forcing process: A pilot system. Agronomy 2017, 7, 29. [Google Scholar] [CrossRef]
- Graziani, G.; Ferracane, R.; Sambo, P.; Santagata, S.; Nicoletto, C.; Fogliano, V. Profiling chicory sesquiterpene lactones by high resolution mass spectrometry. Food Res. Int. 2015, 67, 193–198. [Google Scholar] [CrossRef]
- Van Beek, T.A.; Maas, P.; King, B.M.; Leclercq, E.; Voragen, A.G.; De Groot, A. Bitter sesquiterpene lactones from chicory roots. J. Agric. Food Chem. 1990, 38, 1035–1038. [Google Scholar] [CrossRef]
- Filippini, M.F.; Nicoletto, C.; Sambo, P.; Cavagnaro, J.B.; Pimpini, F. Influence of fertilization on the growth of radicchio “Rosso di Chioggia”cultivated in two different environments. Rev. Fac. Cienc. Agrar. Univ. Nac. 2011, 43, 111–131. [Google Scholar]
- Islam, M.S.; Huq, K.A.; Rahman, M.A. Polyculture of Thai pangus (Pangasius hypophthalmus, Sauvage 1878) with carps and prawn: A new approach in polyculture technology regarding growth performance and economic return. Aquac. Res. 2008, 39, 1620–1627. [Google Scholar] [CrossRef]
- Sayeed, M.A.B.; Hossain, G.S.; Mistry, S.K.; Huq, K.A. Growth performance of thai pangus (Pangasius hypophthalmus) in polyculture system using different supplementary feeds. Univ. J. Zool. Rajshahi Univ. 2008, 27, 59–62. [Google Scholar] [CrossRef]
- Phumee, P.; Hashim, R.; Aliyu-Paiko, M.; Shu-Chien, A.C. Effects of dietary protein and lipid content on growth performance and biological indices of iridescent Shark (Pangasius hypophthalmus, Sauvage 1878) fry. Aquac. Res. 2009, 40, 456–463. [Google Scholar] [CrossRef]
- Asdari, R.; Aliyu-Paiko, M.; Hashim, R.; Ramachandran, S. Effects of different dietary lipid sources in the diet for Pangasius hypophthalmus (Sauvage, 1878) juvenile on growth performance, nutrient utilization, body indices and muscle and liver fatty acid composition. Aquac. Nutr. 2011, 17, 44–53. [Google Scholar] [CrossRef]
- Lam, S.S.; Ma, N.L.; Jusoh, A.; Ambak, M.A. Biological nutrient removal by recirculating aquaponic system: Optimization of the dimension ratio between the hydroponic and rearing tank components. Int. Biodeterior. Biodegrad. 2015, 102, 107–115. [Google Scholar] [CrossRef]
- Singleton, V.L.; Orthofer, R.; Lamuela-Raventós, R.M. Analysis of total phenols and other oxidation substrates and antioxidants by means of Folin-Ciocalteu reagent. Meth. Enzymol. 1999, 299, 152–178. [Google Scholar]
- Benzie, I.F.; Strain, J.J. The ferric reducing ability of plasma (FRAP) as a measure of “antioxidant power”: The FRAP assay. Anal. Biochem. 1996, 239, 70–76. [Google Scholar] [PubMed]
Figure 1.
Water temperature, dissolved oxygen (O2), pH, electrical conductivity (EC) and redox potential (ORP) in differently planted aquaponic systems during the study period.
Figure 1.
Water temperature, dissolved oxygen (O2), pH, electrical conductivity (EC) and redox potential (ORP) in differently planted aquaponic systems during the study period.

Figure 2.
Total phenol content and antioxidant activity (FRAP) measured in lettuce and red chicory in three experimental treatments. L = lettuce; L+ = lettuce intercropped with red chicory; R = red chicory; R+ = red chicory intercropped with lettuce. Different letters (a, b) indicate significant differences (p < 0.01) among treatments for each parameter, according to the Tukey’s HSD test.
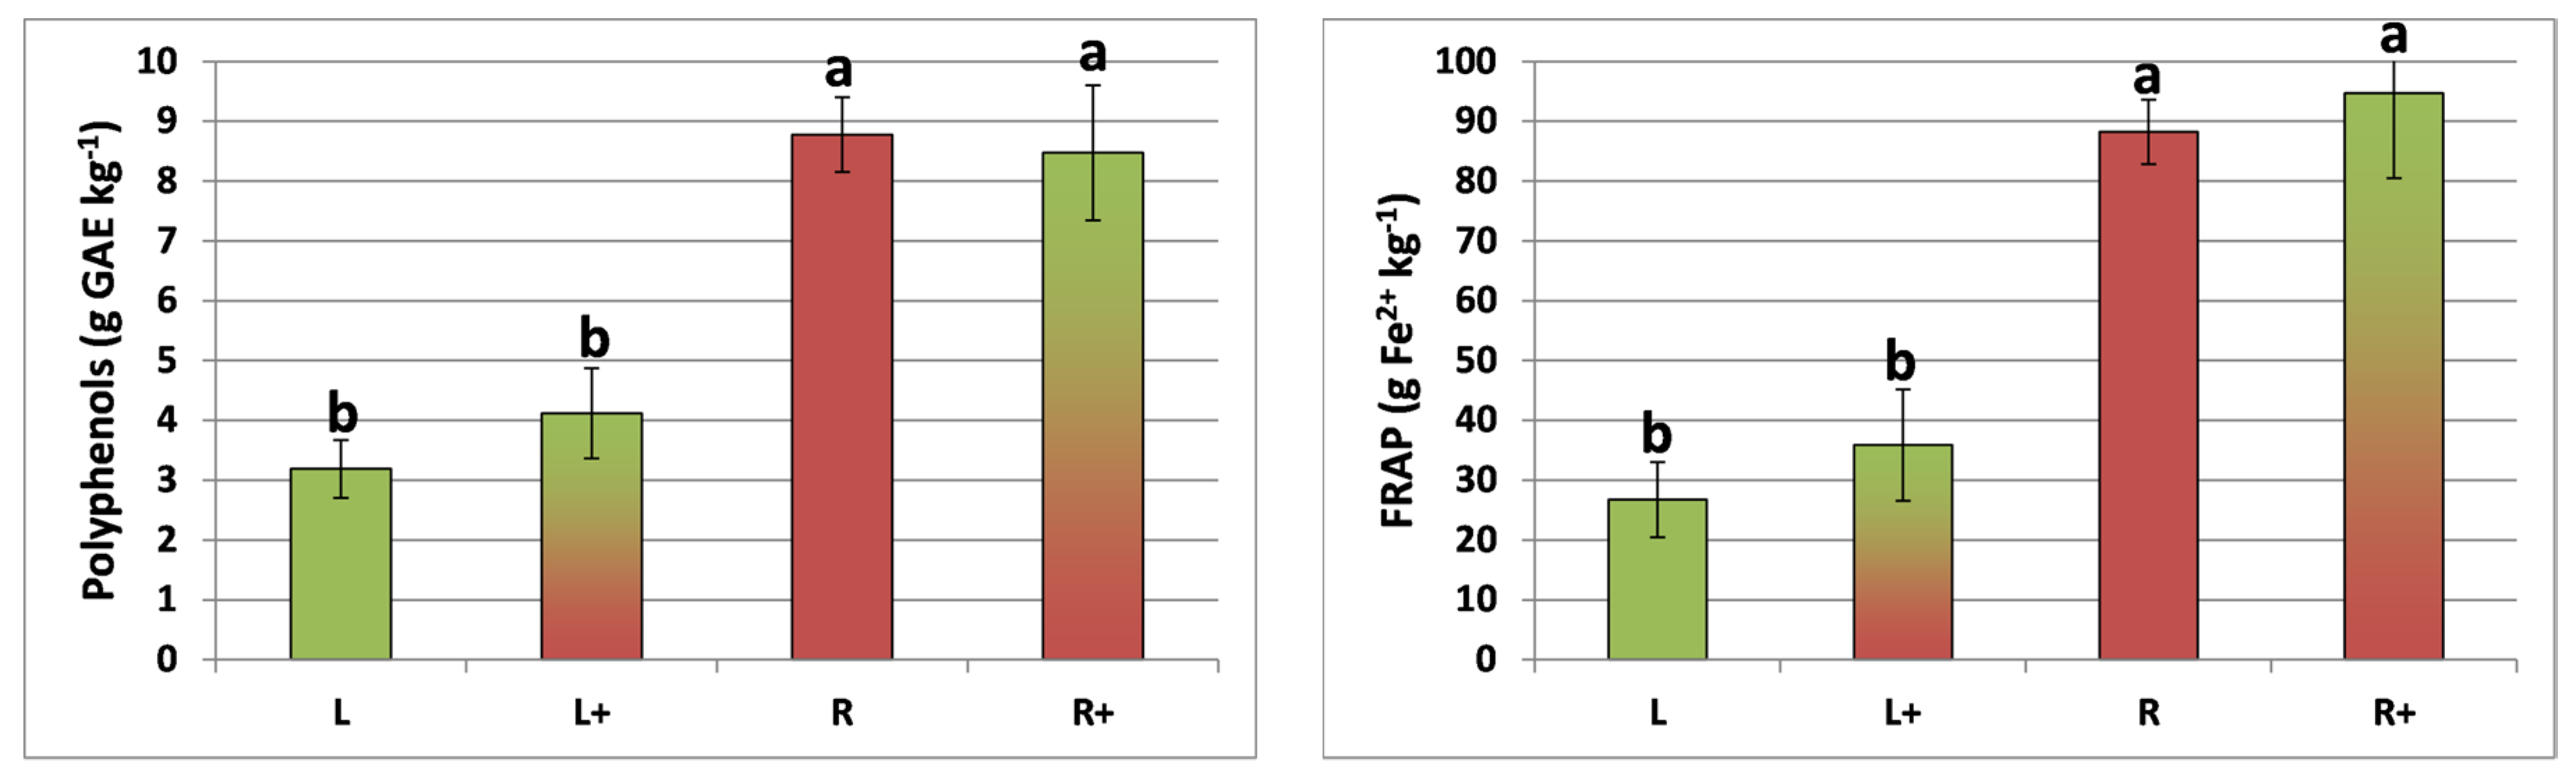
Figure 3.
Experimental unit layout. X indicates the sampling points of plants at the harvest time.
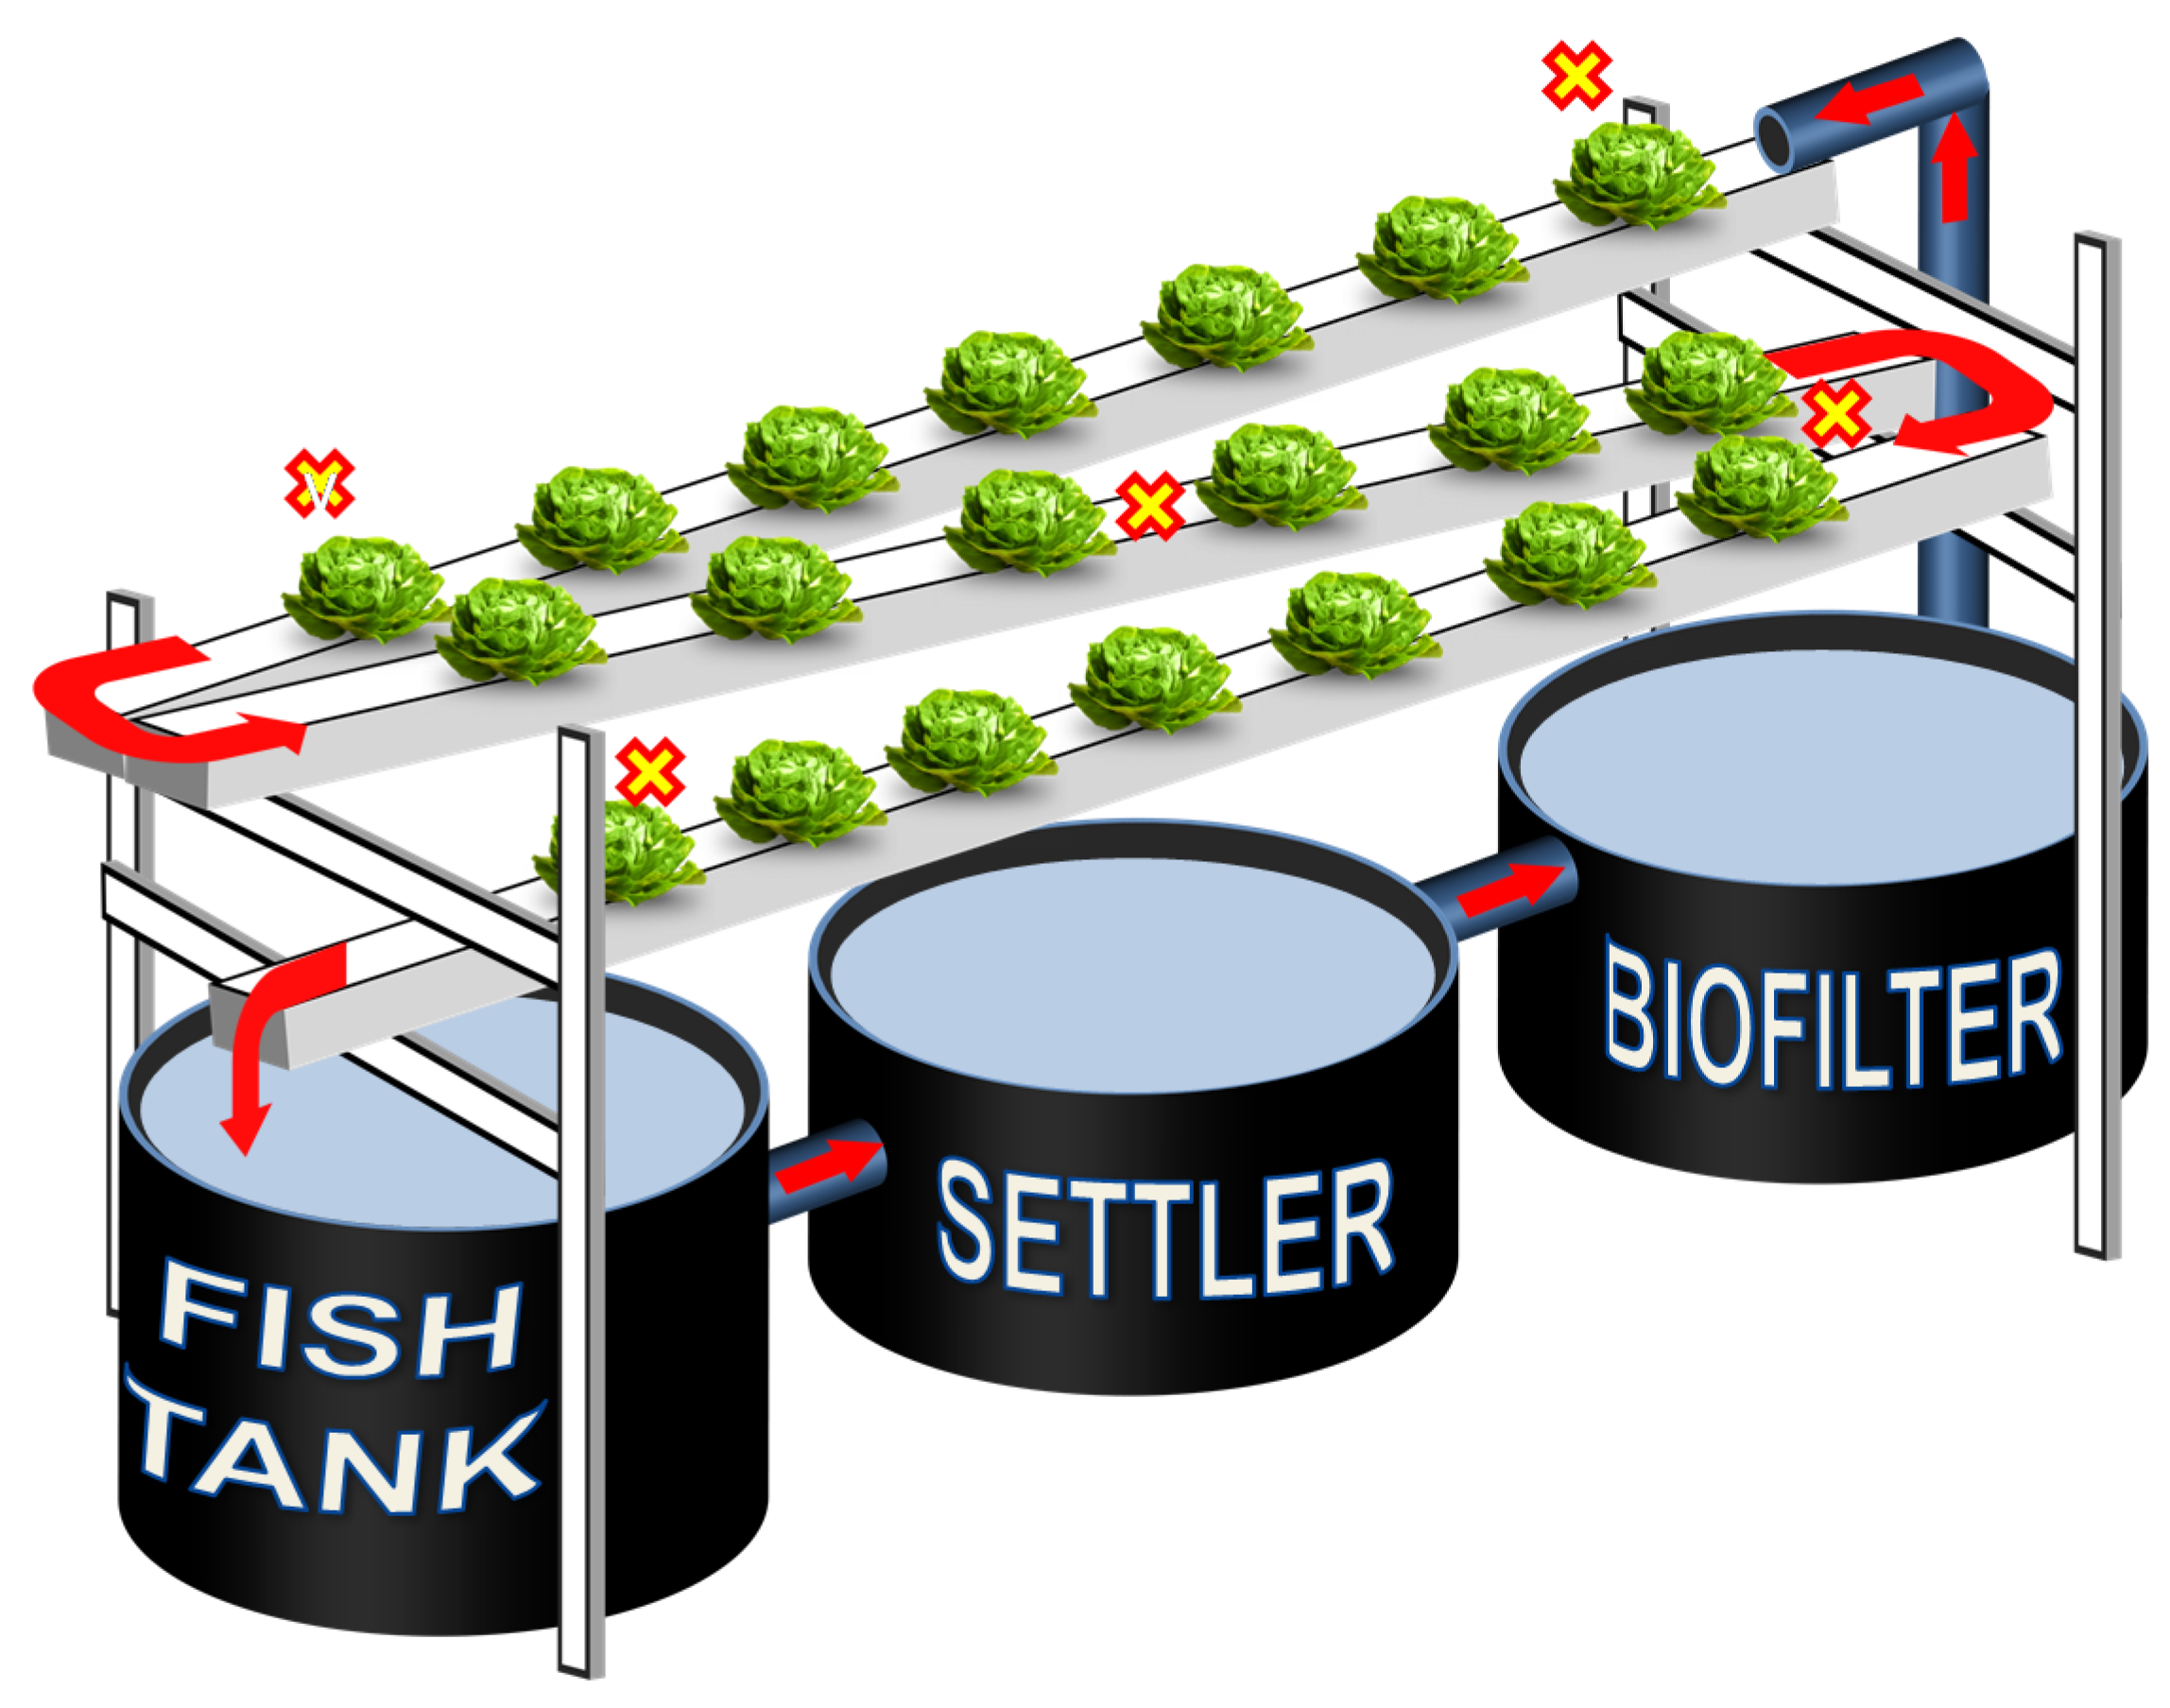
Figure 4.
Plant monitoring scheme.

Table 1.
Morpho-biometric and physiological characteristics of plants in monoculture, and in intercropping treatments. Different letters (a, b) indicate significant differences (p < 0.05) among treatments for each parameter, according to the Tukey’s Honest Significant Difference (HSD) test. ns = not significant differences.
| Parameters | Treatments | ||||||||
|---|---|---|---|---|---|---|---|---|---|
| L | L+ | R | R+ | ||||||
| Head height (cm) | 9.5 ± 2.2 | a | 10.2 ± 2.7 | a | 7.6 ± 1.3 | b | 7.5 ± 0.9 | b | |
| Head width (cm) | 18.8 ± 2.8 | ns | 19.8 ± 2.7 | ns | 19.9 ± 1.7 | ns | 18.5 ± 2.0 | ns | |
| Head FW (g) | 36.3 ± 16.8 | a | 37.3 ± 12.4 | a | 24.2 ± 6.9 | b | 24.1 ± 8.4 | b | |
| Root FW (g) | 3.6 ± 1.6 | ns | 3.1 ± 1.5 | ns | 2.3 ± 1.4 | ns | 3.3 ± 2.6 | ns | |
| Head DM (%) | 5.9 ± 0.4 | b | 5.8 ± 0.3 | b | 6.7 ± 0.6 | a | 6.7 ± 0.5 | a | |
| Root DM (%) | 4.1 ± 0.4 | b | 4.2 ± 0.4 | b | 5.0 ± 1.2 | a | 4.9 ± 0.9 | a | |
| Head:root DW ratio | 14.2 ± 2.1 | ns | 19.2 ± 7.4 | ns | 18.3 ± 8.3 | ns | 15.2 ± 11.6 | ns | |
| SPAD | 7.8 ± 2.3 | b | 9.6 ± 2.4 | b | 15.3 ± 4.9 | a | 14.4 ± 5.1 | a | |
| Color parameters | L* | 63.7 ± 3.5 | a | 62.1 ± 3.2 | a | 45.1 ± 2.9 | b | 46.1 ± 4.1 | b |
| a* | −11.0 ± 2.6 | b | −11.3 ± 2.3 | b | 6.7 ± 4.5 | a | 6.1 ± 4.5 | a | |
| b* | 22.8 ± 3.9 | a | 22.5 ± 3.2 | a | 5.2 ± 3.5 | b | 6.2 ± 4.8 | b | |
L = lettuce; R = red chicory; L+ = lettuce intercropped with red chicory; R+ = red chicory intercropped with lettuce; FW = fresh weight; DM = dry matter; SPAD = index of relative chlorophyll content.
Table 2.
Sugars and phenolic acid content in the dry biomasses of the monocultured and intercropped lettuces. Different letters indicate significant differences (p < 0.05) among treatments for each parameter, according to the Tukey’s HSD test. ns = not significant differences.
Table 2.
Sugars and phenolic acid content in the dry biomasses of the monocultured and intercropped lettuces. Different letters indicate significant differences (p < 0.05) among treatments for each parameter, according to the Tukey’s HSD test. ns = not significant differences.
| Compounds | Treatments | |||
|---|---|---|---|---|
| L | L+ | |||
| Glucose (g kg−1) | 14.88 ± 1.75 | b | 17.26 ± 1.94 | a |
| Fructose (g kg−1) | 18.51 ± 3.26 | b | 23.19 ± 1.86 | a |
| Chlorogenic acid (mg kg−1) | 317.1 ± 26.8 | ns | 356.3 ± 31.9 | ns |
| Caffeic acid (mg kg−1) | 10.7 ± 0.7 | a | 8.9 ± 0.7 | b |
L = lettuce; L+ = lettuce intercropped with red chicory.
Table 3.
Sugars and phenolic acid content in the dry biomasses of monocultured and intercropped red chicory. Different letters indicate significant differences (p < 0.05) among treatments for each parameter, according to the Tukey’s HSD test. ns = not significant differences.
Table 3.
Sugars and phenolic acid content in the dry biomasses of monocultured and intercropped red chicory. Different letters indicate significant differences (p < 0.05) among treatments for each parameter, according to the Tukey’s HSD test. ns = not significant differences.
| Compounds | Treatments | |||
|---|---|---|---|---|
| R | R+ | |||
| Glucose (g kg−1) | 18.56 ± 0.20 | ns | 14.76 ± 2.17 | ns |
| Fructose (g kg−1) | 22.96 ± 3.40 | ns | 25.76 ± 2.76 | ns |
| Chlorogenic acid (g kg−1) | 2.97 ± 0.17 | ns | 2.64 ± 0.19 | ns |
| Chicoric acid (g kg−1) | 1.56 ± 0.34 | ns | 1.07 ± 0.26 | ns |
R = red chicory; R+ = red chicory intercropped with lettuce.
Table 4.
Main bitter taste chemical compounds (mg kg−1) in the dry biomasses of monocultured and intercropped lettuce. Different letters indicate significant differences (p < 0.05) among treatments for each parameter, according to the Tukey’s HSD test. ns = not significant differences.
Table 4.
Main bitter taste chemical compounds (mg kg−1) in the dry biomasses of monocultured and intercropped lettuce. Different letters indicate significant differences (p < 0.05) among treatments for each parameter, according to the Tukey’s HSD test. ns = not significant differences.
| Compounds | Treatments | |||
|---|---|---|---|---|
| L | L+ | |||
| Dihydrolactucin | 12.5 ± 3.1 | ns | 15.0 ± 1.1 | ns |
| Lactucin | 3.9 ± 0.5 | ns | 3.2 ± 0.9 | ns |
| Dihydro-lactucopicrin + lactucopicrin | 26.9 ± 2.0 | a | 15.6 ± 1.1 | b |
L = lettuce; L+ = lettuce intercropped with red chicory.
Table 5.
Main anthocyanidins and bitter taste chemical compounds (mg kg−1) in the dry biomasses of monocultured and intercropped red chicory. Different letters indicate significant differences (p < 0.05) among treatments for each parameter, according to the Tukey’s HSD test. ns = not significant differences.
| Anthocyanidin Compounds | Treatments | |||
|---|---|---|---|---|
| R | R+ | |||
| Cyanidin-3-glucoside | 67.2 ± 11.8 | ns | 76.3 ± 11.6 | ns |
| Cyanidin-3-malonyl–glucoside | 1323.7 ± 7.8 | ns | 1391.8 ± 117.8 | ns |
| Bitter taste compounds | ||||
| Dihydrolactucin | 16.0 ± 1.7 | b | 22.5 ± 1.2 | a |
| Lactucin | 28.7 ± 2.4 | ns | 29.7 ± 1.4 | ns |
| Dihydro-lactucopicrin + lactucopicrin | 29.6 ± 3.2 | a | 23.1 ± 2.1 | b |
| 8-deoxy-lactucin + dihydro-lactucopicrin oxalate | 30.0 ± 2.0 | a | 24.4 ± 1.5 | b |
| Jaquinellin | 10.6 ± 0.8 | ns | 11.7 ± 1.3 | ns |
R = red chicory; R+ = red chicory intercropped with lettuce.
Table 6.
Anion and cation contents in the dry biomasses of monocultured and intercropped lettuce and red chicory. Different letters indicate significant differences (p < 0.05) among treatments for each parameter, according to the Tukey’s HSD test. ns = not significant differences.
Table 6.
Anion and cation contents in the dry biomasses of monocultured and intercropped lettuce and red chicory. Different letters indicate significant differences (p < 0.05) among treatments for each parameter, according to the Tukey’s HSD test. ns = not significant differences.
| Parameters | Treatments | |||||||
|---|---|---|---|---|---|---|---|---|
| L | L+ | R | R+ | |||||
| Cl− (g kg−1) | 11.37 ± 0.88 | b | 11.95 ± 1.76 | b | 41.96 ± 4.59 | a | 48.16 ± 5.02 | a |
| NO2− (g kg−1) | 0.04 ± 0.03 | b | 0.00 ± 0.00 | b | 0.37 ± 0.23 | b | 0.98 ± 0.43 | a |
| NO3− (g kg−1) | 58.82 ± 2.96 | a | 48.49 ± 7.58 | a | 29.05 ± 3.83 | b | 24.98 ± 6.90 | b |
| PO43− (g kg−1) | 14.36 ± 1.54 | b | 13.41 ± 0.52 | b | 18.63 ± 0.56 | a | 17.93 ± 1.12 | a |
| SO42− (g kg−1) | 4.04 ± 0.42 | b | 3.49 ± 0.59 | b | 15.47 ± 3.64 | a | 15.55 ± 6.42 | a |
| Na+ (g kg−1) | 6.56 ± 2.04 | ns | 7.02 ± 0.94 | ns | 7.06 ± 0.55 | ns | 6.72 ± 1.30 | ns |
| NH4+ (g kg−1) | 0.94 ± 0.15 | bc | 0.78 ± 0.02 | c | 1.12 ± 0.06 | ab | 1.45 ± 0.32 | a |
| K+ (g kg−1) | 32.37 ± 5.01 | c | 31.04 ± 3.15 | c | 58.39 ± 2.09 | b | 66.64 ± 3.17 | a |
| Mg2+ (g kg−1) | 9.60 ± 0.51 | a | 8.85 ± 0.25 | a | 6.22 ± 0.52 | b | 4.99 ± 0.30 | c |
| Ca2+ (g kg−1) | 41.35 ± 1.71 | a | 39.01 ± 1.76 | a | 21.69 ± 2.36 | b | 21.34 ± 2.00 | b |
L = lettuce; R = red chicory; L+ = lettuce intercropped with red chicory; R+ = red chicory intercropped with lettuce.
Table 7.
Pangasius production parameters (average ± standard deviation). ns = not significant differences.
Table 7.
Pangasius production parameters (average ± standard deviation). ns = not significant differences.
| Parameters | Treatments | |||||
|---|---|---|---|---|---|---|
| L | R | L + R | ||||
| Fish (number) | 16.0 ± 0.0 | ns | 16.3 ± 0.6 | ns | 16.0 ± 0.0 | ns |
| Initial fish weight (g) | 539.7 ± 41.1 | ns | 544.0 ± 22.6 | ns | 559.7 ± 46.1 | ns |
| Final fish weight (g) | 766.7 ± 64.3 | ns | 820.0 ± 52.9 | ns | 820.0 ± 52.9 | ns |
| Weight gain (%) | 42.0 ± 1.9 | ns | 51.2 ± 15.7 | ns | 46.8 ± 6.6 | ns |
| SGR (%) | 0.82 ± 0.03 | ns | 0.95 ± 0.25 | ns | 0.89 ± 0.10 | ns |
| DGR (g d−1) | 5.28 ± 0.57 | ns | 6.42 ± 1.75 | ns | 6.05 ± 0.64 | ns |
| FCR | 1.71 ± 0.17 | ns | 1.48 ± 0.47 | ns | 1.49 ± 0.17 | ns |
| FER | 0.59 ± 0.06 | ns | 0.72 ± 0.20 | ns | 0.67 ± 0.07 | ns |
L = lettuce; R = red chicory; L+R = intercropping of lettuce and red chicory; SGR = specific growth rate DGR = daily growth rate; FCR = feed conversion ratio; FER = feed efficiency ratio.
© 2017 by the authors. Licensee MDPI, Basel, Switzerland. This article is an open access article distributed under the terms and conditions of the Creative Commons Attribution (CC BY) license (http://creativecommons.org/licenses/by/4.0/).
Share and Cite
MDPI and ACS Style
Maucieri, C.; Nicoletto, C.; Schmautz, Z.; Sambo, P.; Komives, T.; Borin, M.; Junge, R. Vegetable Intercropping in a Small-Scale Aquaponic System. Agronomy 2017, 7, 63. https://doi.org/10.3390/agronomy7040063
AMA Style
Maucieri C, Nicoletto C, Schmautz Z, Sambo P, Komives T, Borin M, Junge R. Vegetable Intercropping in a Small-Scale Aquaponic System. Agronomy. 2017; 7(4):63. https://doi.org/10.3390/agronomy7040063
Chicago/Turabian StyleMaucieri, Carmelo, Carlo Nicoletto, Zala Schmautz, Paolo Sambo, Tamas Komives, Maurizio Borin, and Ranka Junge. 2017. "Vegetable Intercropping in a Small-Scale Aquaponic System" Agronomy 7, no. 4: 63. https://doi.org/10.3390/agronomy7040063
Note that from the first issue of 2016, this journal uses article numbers instead of page numbers. See further details here.