Article

A Dynamic Decision-Making Tool for Calculating the Optimal Rates of N Application for 40 Annual Crops While Minimising the Residual Level of Mineral N at Harvest

1
AGROIMPACT, INRA, 180 rue Pierre-Gilles de Gennes, Barenton-Bugny, 02000 Laon, France
2
LDAR, 180 rue Pierre-Gilles de Gennes, Barenton-Bugny, 02000 Laon, France
3
ITB, 45 rue de Naples, 75008 Paris, France
4
FARE Laboratory, INRA, URCA, 2, Esplanade R. Garros, 51100 Reims, France
*
Author to whom correspondence should be addressed.
Agronomy 2017, 7(4), 73; https://doi.org/10.3390/agronomy7040073
Submission received: 20 July 2017 / Revised: 16 October 2017 / Accepted: 7 November 2017 / Published: 14 November 2017

Abstract

:
Adequate nitrogen (N) fertilisation is an important component of sustainable management in agricultural systems because it reduces the environmental impacts of agriculture. However, taking into account the varied sources of soil N remains a challenge, and farmers require robust decision-making tools to manage increasingly diverse growing conditions. To address these issues, we present the AzoFert® decision support system for farmers and extension services. This tool is capable of providing N recommendations at the field scale for 40 main field crops. It is based on a full inorganic N balance sheet and integrates the dynamic modelling of N supply from soil and various organic sources. Because of the choice of formalisms and parameters and the structure and modularity of the computer design, the tool is easily adaptable to new crops and cropping systems. We illustrate the application of Azofert® through a range of N fertilisation experiments conducted on cereals, sugar beet and vegetables in France.

1. Introduction

In 1991, the European Union adopted the Nitrates Directive (91/676/EEC) to protect water from agricultural nitrate pollution. This directive required member states to monitor drinking water, established nitrate leaching vulnerable zones, and produced a Code of Good Agricultural Practice by 1993. Action plans for vulnerable zones had to be established by 1995 and be fully implemented by 1999. Among these actions, the management of nitrogen (N) fertilisation was considered important. Calculation of the N fertiliser amount is required to adjust the inputs of mineral or organic fertilisers to satisfy the crop N requirements by considering other N sources, and the following important objectives need to be achieved: (i) sustain crop production; (ii) promote product quality (protein content of cereals, technological quality of sugar beet, nitrate content of vegetables, etc.); (iii) preserve the quality of water and air by minimising nitrate leaching, volatilisation, denitrification and nitrous oxide (N2O) losses; and (iv) improve the energetic performance of farms considering the energy cost of mineral N fertilisers. Due to the evolution of agricultural practices, particularly the increase and diversification of organic inputs, farmers in Western Europe are forced to be increasingly precise with respect to N fertilisation.
Decision-making tools for predicting N fertilisation are frequently based on an empirical approach, i.e., fixed rates, which are normally obtained after regional field trials to estimate the average optimum N dose for a given crop under specific soil and climate conditions, or highly simplified N balances. Examples of these types of tools include the Nmin method (used in Switzerland and Germany) and the corrected norms method (used in Switzerland), which are used to calculate the annual N fertilisation of main field crops [1,2]. Strategic crop model-based approaches have also been used to evaluate the impacts of various N management strategies. For example, climatic risk assessment using the STICS (Simulateur mulTIdisciplinaire pour les Cultures Standard) model [3] and variations in the nitrate leaching and yield of different crops supplied with N using a net N mineralisation model [4] have been studied; however, a decision-making tool for N fertilisation has not been derived from these studies. Other works have determined how to adapt N recommendations to cultural techniques, such as tillage and irrigation systems [5]. Certain tools are specific to particular crops, such as maize [6], tomato [7], durum wheat [8], or wheat [9] or are specific to certain processes of the N cycle [10]. Finally, benchmark-type studies have assessed the effects of N management on the environment in northwestern Europe in association with the Nitrates Directive [11]. These studies have not directly developed operational tools for consulting services and farmers, although they have influenced the evolution of agricultural practices. Thus, an engineering approach that can help farmers make decisions regarding N fertilisation is still required. These tools should (i) cover a wide range of agricultural situations encountered by farmers in cropping systems; (ii) require a reasonable number of data inputs that can be provided by the farmer or consulting services and (iii) have the ability to integrate new information (new parameters, new modules) over time, which is important in the context of the rapid evolution of environmental concerns and national policies linked to N management in agriculture.
The “mineral N balance sheet” method proposed in France in the early 1970s aimed to calculate the total amount of fertiliser N to apply to a crop as the difference between the crop N total requirement (to reach a given yield) and the soil N supply; the latter is estimated at different points of the soil N cycle [12,13]. This method, which is widely used for fertilisation management in France, was evaluated under a wide range of environmental conditions [14]. Over the past twenty years, research findings on the following have provided a basis for improving fertilisation recommendation tools, particularly when considering the dynamics of the soil N cycle over time: characteristics of animal and organic waste and crop residues recycled to soils and their potential mineralisation [15,16] and the dynamics of fertiliser N after application, as well as the determinants of fertiliser N recovery in crops, particularly using nitrogen-15 (15N) techniques [17,18]. The objective of this study was to develop AzoFert® software to improve the calculations underlying fertiliser N recommendations, in order to reduce excess mineral nitrogen fertilisation without affecting crop yields, by making dynamic use of the balance sheet method for a wide range of crops, soils, organic and mineral fertilisers and pedoclimatic conditions. This paper describes the scientific and technical design of AzoFert® for achieving this purpose. Insights into the functions of the model are provided for each process simulated by the model. To illustrate this design, we focused specifically on how the model simulates the evolution of organic products in the soil by varying the chemical composition and date of application, using normalised time and calculating the net contribution of these products to the soil mineral N pool. The outputs simulated using the estimated parameter values for organic products and various crop species were validated against independent datasets. Finally, the current dissemination of the AzoFert® tool in France and its potential for evolution are discussed.

2. Model Description

2.1. General Presentation

2.1.1. A Full Inorganic N Balance Sheet

AzoFert® is based on a full inorganic N balance sheet [12,13] applied at the field scale for main field crops. This balance sheet is applied to the inorganic N pool in soil considering the rooting zone depth of the crop and the entire growth cycle of that crop. Equation 1 states that the variation in soil inorganic N between the opening and closing dates for calculating the soil N balance sheet equals the difference between the N inputs and outputs to/from the inorganic N pool (Equation (1)):
R f R i = ( M n + X + A p + F n s + F s + I r ) ( P f P i + I x + G x + L x + G s + L s )
where M n = M h + M r + M a + M c c + M g .
The balance sheet opening date is usually at the end of winter for winter crops and at sowing for spring crops. The closing date is usually at the time when the N uptake by the crop stops, e.g., at harvest for sugar beet and field vegetables or before harvest for rape, cereals and maize. In the time period [opening date–closing date] covered by the calculation of the N balance sheet, Rf is the soil inorganic N at the closing date (at harvest or at the end of crop N uptake), and Ri is the soil inorganic N at the opening date. The inputs are as follows: Mn is the sum of the net N mineralisation from humus (Mh), crop residues (Mr), organic products (Ma), catch crops (Mcc) and meadow residues (Mg); X is the amount of fertiliser N applied; Ap is the N wet deposition; Fns is non-symbiotic fixation; Fs is symbiotic fixation; and Ir is the N added through irrigation. The outputs are as follows: the net crop N uptake is Pf (the total N uptake by the crop at the closing date) minus Pi (the N uptake by the crop at the opening date); Ix is the amount of fertiliser N immobilised; Gx and Lx represent the fertiliser N lost by gas emissions and leaching, respectively; and Gs and Ls represent the soil inorganic N lost through gas emissions and leaching, respectively.

2.1.2. Dynamic Simulation of Soil N Supply

N supply from soil and various organic sources (crop residues from the preceding crop, catch crop residues, and organic products) is simulated dynamically, for example, from the harvest time of the preceding crop to the date at which the fertilised crop stops taking up N. A dynamic approach, compared to a static balance, makes it possible to significantly improve the accuracy of the balance sheet terms; this is important for a tool that takes into account a large number of crops with very different sowing dates and growing periods, as well as a variety of organic products that can be recycled on the soil. Beginning the simulation at the harvest time of the preceding crop is essential for calculating the supplement from mineralisation, which occurs between the opening and the closure of the balance sheet and is generated from the main crop or cover crop residues and organic products applied before the opening of the balance sheet.
To perform these simulations dynamically, we introduced the concept of “normalised time”, which considers temperature (T) and moisture content (W) changes over time. This approach, which was adapted from Andrén and Paustian [19], expresses each day with a given T and W as a function of a normalised day based on the reference T and W (Equation (2)):
Normalised   time   ( day   i ,   day   j ) = i j f ( Τ ) × g ( W )
f ( Τ ) = e K × ( T m o y T r e f )
where f(T) represents the temperature factor, K = 0.115 represents the Van’t Hoff coefficient, and Tmoy and Tref represent the mean and reference temperature, respectively.
g ( W ) = 0.2 + 0.8 × [ ( W s l W w p ) ÷ ( W r e f W w p ) ]
where g(W) represents the moisture factor, Wsl represents the moisture content of the soil layer, and Wref and Wwp represent the reference moisture and the wilting point moisture, respectively. In AzoFert®, Tref is 15 °C and Wref is field capacity [20].
Consequently, the model calculates (i) the contribution of these sources to mineral N from the harvest of the previous crop until the opening date of the balance sheet using observed climatic data from the area and (ii) the N mineralised from these organic sources between the opening and closing dates of the balance sheet using mean climatic data from the area (calculated over the last 15, 20, and even 30 years according to the weather station). This means that there is no uncertainty associated to “past” climatic conditions, between the previous harvest and the opening of the balance sheet, but the model is predictive after opening the balance sheet with uncertainty related to future weather conditions. The climatic conditions are taken into account over 10-day intervals throughout the year.

2.2. Module Content and Parameterisation

The objective of the use of the balance sheet is to supply the minimum amount of N fertiliser needed to obtain the maximum crop yield for a given agricultural situation.

2.2.1. Crop N Requirements

The estimated crop N requirement is different between plants harvested for grain and plants harvested at a vegetative stage. The N uptake of plants harvested for grain is calculated as the product of the objective grain yield (Mg ha−1) and the N requirement per unit of grain production (kg N Mg−1 DM). The N requirement per unit of grain is calculated from the quantity of N accumulated by crop for a given grain yield, and these data are obtained from field experiments conducted by technical institutions. For other crops, the N requirement is considered constant per area unit (kg N ha−1) and according to the crop, i.e., a potential yield is not considered when calculating the N requirements. For winter crops, whose growth cycle starts before the period in which the N balance sheet is calculated, the N that has already been taken up by the crop (which varies with the stage of crop development) is included in the term Pi and is subtracted from the total N required by the crop. The values used for the different variables characterising the crops, i.e., yield objective for plants harvested for grain, N requirements, maximum rooting depth, default date of crop harvest, and N uptake by the crop at the opening date of the balance sheet, are available in the crop catalogue of the software and are presented in Table A1 in Appendix A.

2.2.2. Mineralisation of Organic Sources

• Soil organic matter (Mh)
Humified organic matter is mineralised in the upper layer, the depth of which corresponds to the ploughing depth and ranges from 20 to 30 cm depending on the soil type. In soils in which organic matter accumulates below the ploughed layer, the extra N mineralisation is calculated as a fixed extra 10% of the N mineralised in the ploughed layer. The potential rate of mineralisation is calculated from the organic N pool of the considered soil layer (Norg) and the rate of mineralisation of this pool (k2), which depends on the clay and limestone concentrations in the soil [21,22,23].
V p = k 2 × N o r g
k 2 = 22 ÷ [ ( 125 + %   C l a y ) × ( 545 + %   l i m e s t o n e ) ]
The organic N pool is divided into two fractions, an active fraction (FNact) and an inert fraction (Finert), and only the active fraction contributes to mineralisation (the ratio of the inert: active fractions is available in the soil catalogue). The mineralisation rate also considers the cultural history (Fsyst) of the plot, such as the long-term effect of crop residue management; organic product application, frequency and nature; and catch crop species. The mineralisation rate (Mh) of these layers is the product of the potential rate of mineralisation (Vp), the T (f(T)) and W (g(W)) factors, and the FNact and Fsyst factors.
M h = V p × f ( Τ ) × g ( W ) × F N a c t × F s y s t
Therefore, AzoFert® requires different variables, such as the clay (g 1000 g−1 soil), limestone (g 1000 g−1 soil) and total N (g 1000 g−1 soil) contents, W at field capacity and wilting point, and parameters pertaining to “cultural history”. Some input data are provided by the farmer, while others are available in the soil catalogue (default data; see Table A2 in Appendix B).
• Organic products (Mr, Ma, Mcc, Mg)
The decay of crop residues (main crops, cover crops, plant residues from grassland ploughing) and organic products in the soil results in either the net mineralisation or the net immobilisation of soil N. The decay rate of these products depends on the nature of organic residues (chemical characteristics and C:N ratio) and the T and W soil conditions. The kinetics of mineralisation were determined using a large dataset of laboratory incubations conducted under controlled and optimal decomposition conditions (constant soil W and T; non-limiting N conditions) [24,25,26] and using field experiments measuring the N mineralisation of crop residues or organic products. We used a single generic formalism that describes the dynamics of either the nitrogen (Equation (8)) or carbon (Equation (9)) of these various organic sources.
The net mineralisation rates of N and C are described by the following double exponential equations:
N = N R 0 × ( a N b N e k t c N e l t )
C = C R 0 × ( a C b C e k t c C e l t )
where N and C are the amounts of mineralised N and C, respectively, at time t; NRO and CRO are the initial amounts of N and C in the crop residues or organic products, respectively; and aN, bN, cN, aC, bC, cC, l and 
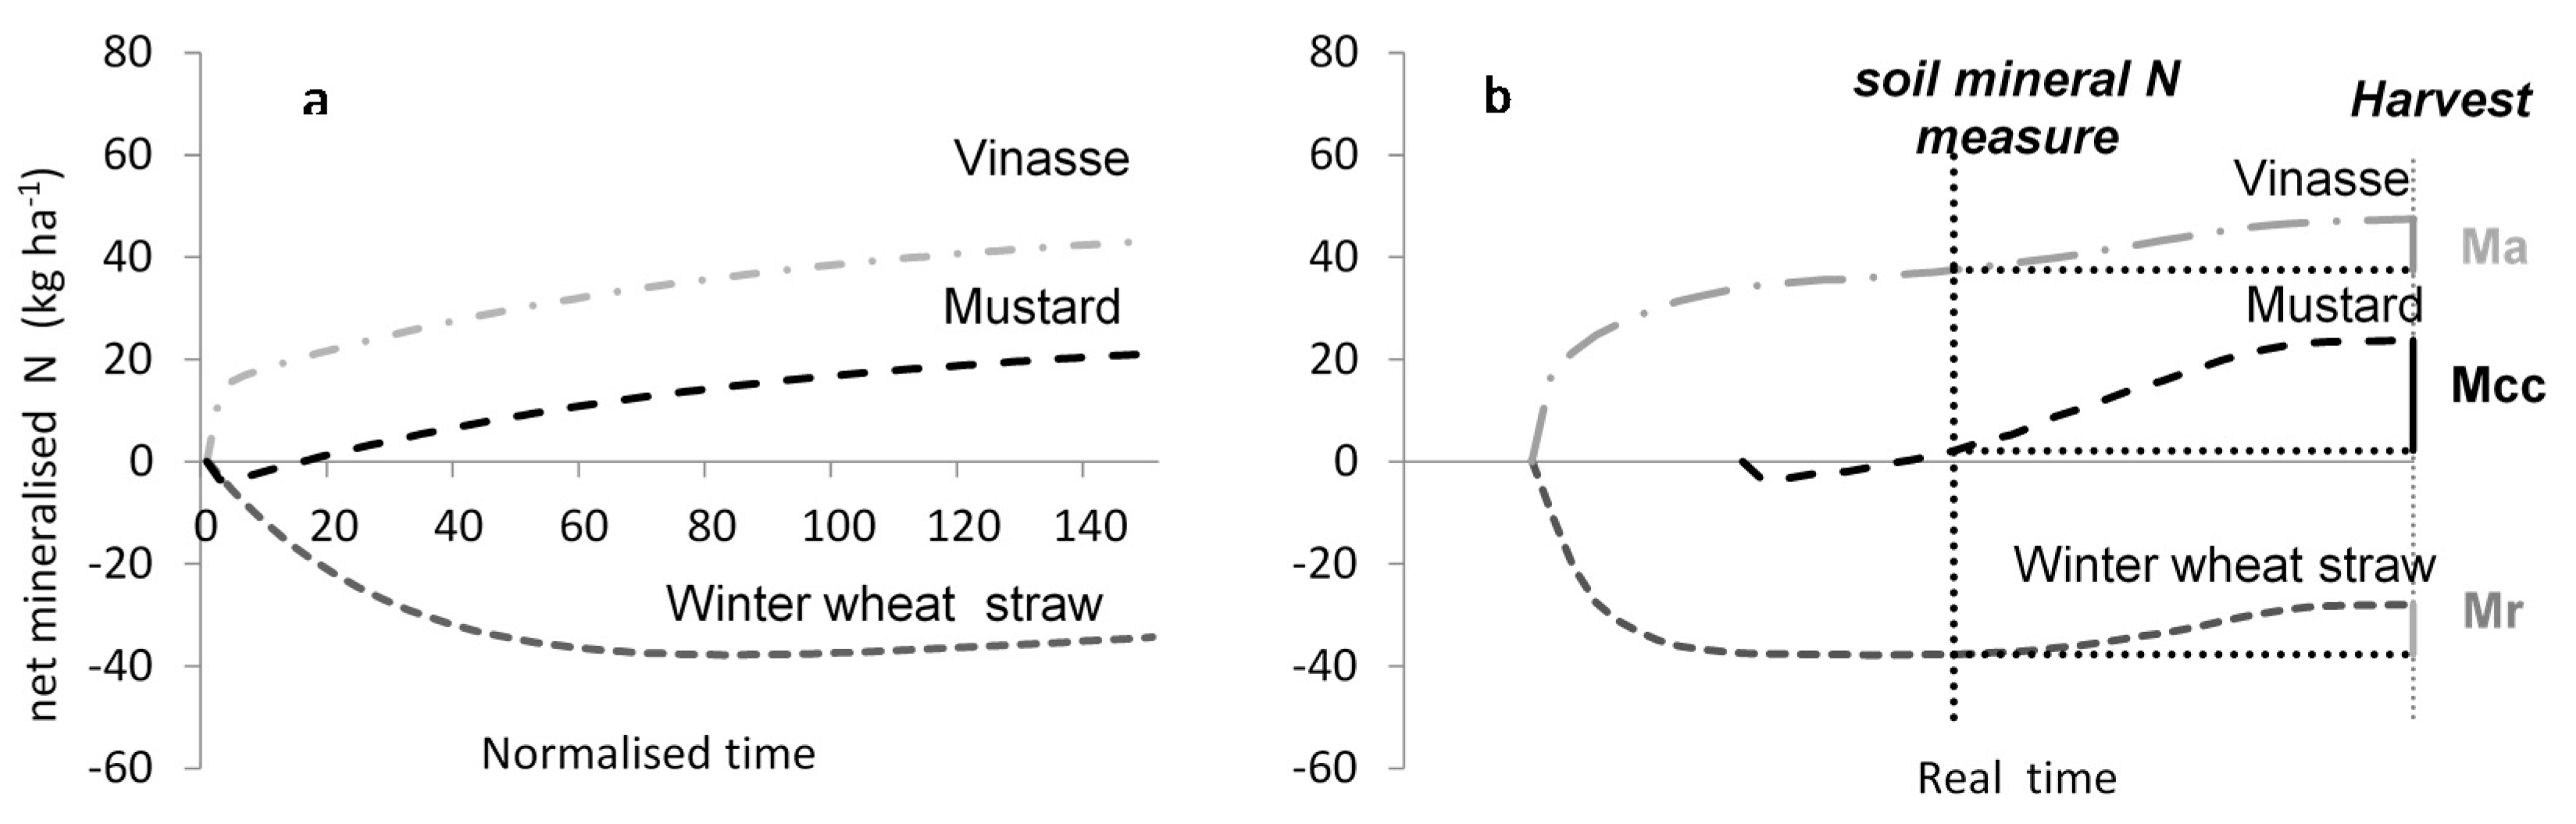
k are coefficients that describe the mineralisation kinetics of N and C of the crop residues and organic products. The coefficient values are expressed using normalised time. Three examples of the kinetics of net N mineralisation for crop residues and organic products are given in Figure 1 to illustrate how the kinetics of potential mineralisation in the laboratory (expressed in normalised days, Figure 1a) are used by AzoFert® to dynamically determine the respective contribution of each organic source to the mineral N pool at balance opening and closing, with the net differences between the two dates being the values of the Mr, Ma or Mcc terms of the calculation (Figure 1b).
The equations have been parameterised for different types of crop residues, i.e., the straw of cereals, the tops of sugar beets and potatoes, and the residues of catch crops (see previous crop and catch crop catalogues, Appendix C and Appendix D). The parameters for organic products, such as solid and liquid manures, poultry droppings, agro-industry effluents and urban effluents, are available in the organic products catalogue (Table A5 in Appendix E). Because the kinetics of crop residue and organic product mineralisation are calculated over normalised time, their decomposition can be modelled over time. For example, Table 1 shows the N contribution of vinasse applied before a sugar beet crop according to the date of application. Vinasse is a by-product of the sugar industry applied during the intercropping period between cereal harvest and the establishment of the sugar beet crop. The application rate was 3 Mg ha−1 of vinasse, which had C and N contents of 16.4% and 2.4%, respectively. Earlier application dates correspond to lower Ma values in the balance sheet.

2.2.3. Processes affecting the Availability of Fertiliser N

AzoFert® considers three processes that affect the availability of fertiliser N applied to a crop, i.e., nitrogen leaching, microbial N immobilisation and the volatilisation of ammonia from fertiliser; the denitrification losses from fertiliser N are not yet included in the model. This is due to the history of this balance sheet approach [12,13], which considered that N losses through gas emissions were generally compensated by non-symbiotic N fixation inputs. The scientific knowledge gained over the last decades has shown that farming practices and climate significantly change the losses resulting from volatilisation and denitrification, and these processes can no longer be considered negligible and/or compensated for by a fixed (and not adequately quantified) term of non-symbiotic fixation. While we have developed a simple module for volatilisation for this tool, we have not yet developed a module for denitrification, which remains a complex and difficult process to predict.
The functions used for N immobilisation and volatilisation of ammonia were derived from 15 N experiments that demonstrated the microbial immobilisation of added fertiliser N and the incomplete recovery of the added N by different crops in the temperate climate of northwestern Europe [17,18].
The amount of microbially immobilised fertiliser N depends on the N immobilisation capacity and the soil N availability [27]. In AzoFert®, the immobilisation capacity is calculated from the availability of C in the ploughed layer using Equation (9), which predicts the C evolution from crop residues and organic products, and an immobilisation ratio:
Y = ( 0.06 × X ) + 13
I x = Y × ( Q C ÷ 1000 )
where Y is the immobilisation ratio, X is the amount of fertiliser N, QC is the amount of decomposed organic C, and Ix is the immobilised fertiliser N.
The immobilisation ratio, i.e., the immobilised N per decomposed C, varies with soil N availability. Mary et al. [28] showed that microbial N immobilisation during wheat straw decomposition ranged from 13 kg N per ton of C for a N-“poor” environment (0 kg added N ha−1) to 32 kg N per ton of C for a N-“rich” environment (up to 300 kg added N ha−1). In AzoFert®, the immobilisation ratio is linearly related to the amount of fertiliser N added, ranging from 13 to 25 kg N per ton of C.
The volatilisation of ammonia (VOL) is estimated from the combined effects of soil factors (pH and cation exchange capacity), type of fertiliser considered as a whole (form of fertiliser marketed) and application method (on the soil surface or incorporated into the soil), and crop status at the time of fertiliser N application. VOL is nil if soil pH < 5.5, CEC > 40, fertiliser N is incorporated into the soil or fertiliser N is applied only as NO3–N. For each type of fertiliser N, a maximum VOL rate (VMAX) is defined in the model. VMAX varies exponentially with soil pH between pH 5.5 and 8.5 [29]. The VOL factor V is given by the relationship:
V = V M A X ÷ 500 × e x p [ 0.6 × ( p H 5.5 ) ] 1
G x = V × X N H 4 N
where XNH4-N is the amount of fertiliser NH4-N, and Gx is the amount of volatilised fertiliser N. When fertiliser N is applied to a crop, the VOL rate decreases by 50% compared to that of bare soil, considering that the N uptake by a crop reduces the risk of volatilisation.
The losses of soil nitrate (Ls) by leaching due to rain, beyond the rooting depth of the crop, concern soil inorganic N at the opening of the balance sheet (Ri) and can occur between the opening of the balance sheet and the date of the end of the leaching period, which depends on crop type and climate. The proportion of mineral N leached is estimated using a simple approach: the transfer of water and nitrate into the soil is calculated for each elementary layer of 1 cm, by analogy with a reservoir. Incoming water fills the layer similar to a cascade, and the upper limit of each individual reservoir is the field capacity of the layer. Water and nitrate transfer then occurs after a homogeneous mixing of the layer with the underneath layer. Nitrate losses are dependent on effective rainfall and soil type (soil water content at field capacity). Effective rainfall (QPLUEFF) during the period (opening of the balance sheet and the end of leaching) is given by the relationship:
QPLUEFF = QPLU − 0.5 * ETP
where QPLU is the amount of rainfall and ETP is potential evapotranspiration.
Unlike Ls, which can occur at the end of winter and can affect the residual mineral N (Ri), fertiliser N lost through leaching (Lx) is generally non-existent (end of the drainage period), and Lx = 0, which has been confirmed by 15N experiments.

3. Software Characteristics

3.1. Software Accessibility

  • Software name: AZOFERT® V2, Year first available: 2014
  • Operating system required for software: Run under MS Windows XP or higher on PC, Program language: VB.net Framework 4.0, 260 ko
  • Software developer and contact address: Pascal Dubrulle, [email protected]. Address: 2, Chaussée Brunehaut-Estrées-Mons, CS 50136, 80203 Péronne CEDEX, France

3.2. General Structure

The AzoFert® tool is a stand-alone application designed to be easily integrated into various soil laboratory data systems and applied in various agricultural contexts. AzoFert® can be used in different modes, and a farmer can use the product directly by applying the results sheet sent by the laboratory or by accessing web platforms for each field or group of fields on his/her farm. For this purpose, the computer programme is composed of several parts (Figure 2).

3.3. Calculation Engine

Calculations are performed using data obtained from the farmer and specific agronomic parameters included in the model equations. To increase the operational capability of AzoFert® for extension services and farmers, data inputs provided by the farmer must be simple so that they can be collected at the field scale, and they must also be limited in number. These data consist of (i) the measured or estimated initial mineral N content and moisture in the soil profile on the opening date of the balance sheet and (ii) technical information pertaining to the plots to be fertilised. These latter data are obtained from a paper sheet filled out by the farmer.
The calculation engine provides each item of the balance sheet, the N recommendations for crop fertilisation to meet the yield objectives, comments on the calculation (i.e., abnormally high or low values, use of default values, etc.), and recommendations for the timing of fertiliser application. The calculation engine considers a wide range of crops, which is a key issue for farmers and advisors. For easier maintainability and scalability of the software, each balance sheet item is the subject of a computer code module. Collaboration between computer scientists and agronomists has focused on the generalisation of formalisms of crop-related processes; however, several formalisms are inherent in the diversity of the considered crops. Therefore, several formalisms are included in AzoFert® depending on the type of crop. Formalisms that are highly specific to a type of culture are the subject of specific computer modules that are triggered according to this culture type. For example, crop N requirements are calculated based on the yield objective, defined by the period and duration of the growth cycle, or correspond to a fixed value.
The direct users of the software include soil-testing laboratories that provide access to farmers through their own laboratory information management system. The link between such management systems and AzoFert® is provided by the input file and the output file, and the file format is defined by AzoFert®. The calculation for one plot can be performed in approximately 90 milliseconds.

3.4. Regional References and Parameters

The calculation engine uses different catalogues (soil, crop, organic product, catch crop, and previous crop), and each catalogue lists and describes the entities according to the regional context. For each component of a catalogue, the first part of the information consists of default values such that the software can still perform calculations in case of a lack of data provided by the farmers. The second part of the information consists of agronomical parameters that are used in different equations and are not directly accessible by the practitioner (i.e., characteristic moisture and bulk densities of soil, coefficients that describe the decomposition kinetics of organic sources, etc.). The last part of the information consists of codes used to trigger specific calculation modules.
The calculation engine also uses parameters in grids. For example, the calculation for soil organic matter mineralisation considers the cultural history of the plot (Fsyst in Equation (7)) according to the crop residue management; the organic product application, frequency and nature; and the catch crop species. Finally, the calculation engine uses a climatic file linked to the geographical location of the plot. The climatic data include decadal mean temperature, cumulative rainfall, evapotranspiration and global radiation. The graphical user interface (GUI) allows users to manage catalogues and grids by modifying their contents. To facilitate the management of the entirety of the catalogues, grids and climatic data, the software uses domains of settings. This type of data organisation can process batches of plots issued from a wide range of areas. For a given region, a domain of settings consists of a set of catalogues and grids, as well as a climate file that is associated with each plot used in the calculation.

4. Evaluation of Model Performances

4.1. Materials and Methods

4.1.1. Experimental Data Sets

To test the performance of the AzoFert® software, several databases of field trials were used (Table 2). Different criteria were tested: the prediction of soil N supply under a wide range of cultural conditions (dataset 1) and organic amendments (dataset 2) and the environmental impacts of AzoFert® N use (dataset 3). Each field trial of these datasets consisted of a response curve to fertiliser N using 4 to 6 different N doses and a control treatment with no fertilisation (0 kg N ha−1), with 4 replicates per N dose. Previous crops included winter and spring cereals, sugar beet, oil plants and field vegetables. The experiments were essentially located in northern France and used different soil types, i.e., mainly silt, clay loam and chalky soils.

4.1.2. Measurements and Calculations

At harvest time, the yield was measured for the different treatments of each trial. Crop samples were collected from control plots to measure the N content of the different parts of the plants (i.e., straw and grain for cereals or leaves and roots for sugar beet). The inorganic N in the soils was measured on different dates and always at the opening and closing of the balance sheet.
It is almost impossible to quantify the individual soil N mineralisation fluxes (Mh, Ma, Mr, Mcc) in cropped soils; therefore, it is impossible to experimentally “validate” the predicted values for these balance sheet terms. Consequently, we used the N accumulated by non-fertilised crops as a proxy of these values considered together. Therefore, the quality of the predicted soil N supply was verified by comparing the soil N supply calculated by AzoFert® with the plant N uptake (including N in roots) measured in control plots without fertilisation. This calculation assumes that soil N supply is not affected by the addition of fertiliser N (or the lack thereof). The AzoFert® N supply was calculated from the general Equation (1) by considering the net N mineralisation of organic sources (Equations (7) and (8)), mineral N in the soil at the opening and closing of the balance sheet, the N uptake by the crop on the opening date, the N added by wet deposition, irrigation and symbiotic fixation, and the N lost via leaching (Equation (14)). This approach was also used to predict the net N mineralisation in situations with organic amendments but without mineral fertiliser application using the field dataset 2. Finally, the environmental impact of AzoFert® N recommendations was estimated from trials with increasing N doses (dataset 3). These experiments included measurements of the crop yield and residual mineral N in the soil at harvest for the various doses, which were applied to establish the optimum yield. The optimum yield was determined graphically and corresponded to the yield at which additional statistically significant increases did not occur according to the N dose.

4.1.3. Analytical Procedures

At harvest, crop samples were collected from the control plots to measure the total N concentration in the different plant parts (i.e., straw and grain for cereals or leaves and roots for sugar beet) using an elemental analyser (NA 1500, Carlo Erba). These values were combined with the dry matter measurements to calculate the amount of N uptake by plants.
The inorganic N content in the soil (NO3 and NH4+) at depths of 90 or 120 cm was determined at the opening of the balance sheet and at harvest. Soil was sampled in three or four soil layers at 30-cm depths by mixing eight separate cores collected using an 18-mm diameter driller. The soil inorganic N was determined via KCl extraction through the addition of 150 mL 1 M KCl per 50 g fresh soil followed by shaking for 30 min. The solution was then centrifuged for 20 min (5800 g), and the supernatant was filtered through a 45-µm pore diameter sieve. The NO3 and NH4+ in the soil extracts were measured by a continuous flow colorimeter (TRAACS 2000, Bran + Luebbe, Norderstedt, Germany) using an adaptation of the method proposed by Kamphake et al. [30] for nitrate and nitrite and a method derived from Krom [31] for ammonium. The soil mineral N index at harvest (harvest SMN index) was calculated as the quantity of mineral N in the soil of the treatment at harvest divided by the quantity of mineral nitrogen in the soil of the treatment without nitrogen.

4.1.4. Statistics

The simulated soil N supplies were evaluated and compared to the experimental value based on the plant N uptake in control plots, and the results were analysed using the following statistical indicators. The root mean squared error (RMSE) indicates an estimation of model error:
RMSE = ( x i x ^ i ) 2 n ,
where x i represents one simulated value, x i ^ represents one measurement and n represents the number of situations. The median gap (MG) indicates whether the model overestimates or underestimates the studied variable. MG is the mean of the gaps.

4.2. Results

4.2.1. Estimation of Soil N Supply

The N supply estimated by AzoFert® for control treatments (0 N) was compared to the plant N uptake measured in the same control plots (dataset 1). The experiments covered a wide range of agricultural situations; the N absorption in the control plots ranged from 21 to 259 kg N ha−1. AzoFert® reproduced both the differences observed at different sites, with estimated values ranging from 26 to 288 kg N ha−1, and the average soil N supply, with a significant linear correlation between the measured and estimated N supply (Y = 0.9601X, r2 = 0.76; p < 0.01) (Figure 3). To determine the effect of crop type, the different crops were ranked according to the length of their growing periods (4 months for spring barley and 7 months for sugar beet) and the potential capture of annual soil mineralisation. The RMSE and MG values were 2.69 and −1.00 kg N ha−1, respectively, which are relatively low. A similar comparison was carried out in Wallonia (Belgium) on vegetables (bean, spinach and carrot) growing in loamy soil. A very high correlation (r2 = 0.95) was observed between the N absorbed by plants growing in a non-fertilised plot and the N supply estimated using AzoFert® [32].
Under conditions with organic amendments, soil mineral N availability often leads to a substantial contribution of organic sources (such as catch crops and organic products) to the N nutrition of main crops. Thus, an accurate estimate of their contribution is necessary to improve N recommendations. In sugar beet trials receiving no mineral fertiliser (T0), the differences in crop N uptake were attributed to differences in the net N mineralisation of organic products (dataset 2). N uptake by sugar beets in the different treatments ranged from 120 to 280 kg N ha−1 (Figure 4). Comparatively, the N supply simulated by AzoFert® ranged from 110 to 260 kg N ha−1. The observed difference between the measured and estimated N supply was, on average, −5 kg N ha−1. Although the simulated and measured N supply was similar for the control plots and the plots with only vinasse, AzoFert® tended to overestimate the N supply in the plots with both catch crops and vinasse. Under culture conditions with organic amendments, the r2 coefficient reached 0.45, and the RMSE and MG were 5.47 and 1.00 kg N ha−1, respectively.

4.2.2. Residual N at Crop Harvest Based on AzoFert®

The residual N at crop harvest is an important criterion for determining the risk of nitrate leaching during the intercropping period [33]. The residual mineral N at harvest calculated using AzoFert® was evaluated in trials conducted on winter and spring crops as well as field vegetables. The trials included increasing N doses, with measures of yield and residual mineral N in the soil at harvest (dataset 3). To compare the various treatments, the results were normalised using the yield and residual soil mineral N of the control treatments as a reference. The residual soil mineral N rapidly increased under an excessive fertiliser N dose, i.e., greater than the dose that resulted in optimal yield (Figure 5); the increase was equal to 4 kg and 6 kg of N per 10 kg N ha−1 of extra fertiliser N applied to winter and spring crops, respectively. For winter crops (winter wheat, barley, and rape), the rate calculated by AzoFert® was able to generate the optimal yield. A similar result was observed for spring crops (spring barley and grain maize). For field vegetables, a fertiliser N dose higher than that calculated by AzoFert® led to a strong increase in the soil mineral N at harvest. The field vegetables with a shallow rooting depth probably had a lower absorption efficiency than the winter and spring crops. For all crops, increased soil mineral N at harvest would inevitably result in an increased risk of nitrate leaching losses during the intercropping period for bare soils or those with low ground cover. In the treatments explored, calculating the fertiliser N doses using AzoFert® reduced the risk of extra mineral N accumulating in the soil after harvest, thereby decreasing the risk of nitrate leaching during the intercropping period.

4.2.3. Evolution of Recommended Fertiliser N doses after the Release of AzoFert®

The evolution of recommended N rates after the release of AzoFert® is a consequence of its use. From 1993–2004, prior to AzoFert® development, a static balance sheet (Azobil method), Reference [34] was used to recommend N doses for specific crops in a given area. In 2005, AzoFert® software replaced Azobil. Table 3 shows the evolution of the mean recommended N doses for three main crops in a large number of fields in northern France. From 2005 to 2015, the number of recommendations using AzoFert® increased. Currently, annual recommendations for 85,000 fields are based on AzoFert®, involving 25,000 farmers and approximatively 1,000,000 ha. For winter wheat, a comparison between the 1993–2004 period and the 2005–2015 period showed an increase of +22 kg fertiliser N ha−1 for the recommended N rate, while during the same period, the objective yields of the farms increased by +0.8 Mg ha−1. Therefore, the increase in the mean recommended N rate corresponded to an increase in the expected winter wheat yield. For spring barley, there was a slight decrease in the mean recommended N rate based on AzoFert® compared to Azobil, with a +0.4 Mg ha−1 increase in the objective yield.
For the sugar beet crop, the recommended N rates decreased significantly between the two periods and reached −30 kg N ha−1. Fertiliser N recommendations for the sugar beet crop in France greatly improved via the use of AzoFert® compared with other decision support systems because the N recommended dose was closer to the optimum dose, and a significant decrease was observed in the number of over-fertilisation cases [35].

5. Discussion

The dynamic modelling of soil N supply, which starts from the time of harvest of the preceding crop and uses normalised time, is a key component of AzoFert®, and it allows this tool to be used for a wide range of crops that vary in growth length and potential capture of annual soil mineralisation. For example, up to 70% of the N requirement of sugar beet is provided by soil sources; thus, accurately predicting N supply is important, particularly for the large number of crops (40 crops) considered by the tool. Our results also showed that the relatively accurate predictions of the optimal N dose by AzoFert® decreased the environmental N impacts by minimising the amount of soil mineral N at crop harvest and the risk of nitrate leaching during the fallow period.
Another advantage of AzoFert® is its generic concept. The formalisms and the set of parameters describing the different processes in AzoFert® were derived from models generated by academic research, particularly from STICS [23] and LIXIM [36,37]. The number of parameters was kept to a minimum, and input data (27 to 40, depending on the crop) were selected according to their availability at the farm level and, of course, their importance. Formalisms were chosen to integrate a wide range of agricultural situations and good accuracy for N fertilisation recommendations. Because this tool is generic, AzoFert® is adaptable to other cropping systems via the inclusion of plant parameters for new crops in the crop catalogue (e.g., N requirements, objective yield, dates and duration of crop growth, and rooting depth) or parameters for new soils or new organic sources in their respective catalogues. For example, AzoFert® can be used in low-input or even organic systems and, depending on the source of soil N supply, can recommend no mineral fertilisation.
The high-performance computer design of the software is related to its structure and modularity. The software can easily be used to (i) improve the formalisms that describe the processes and calculations of the different items of the balance sheet; (ii) modify the parameterisation in the domain of settings, catalogues and grids; and (iii) permit the implementation of new processes, such as by estimating N loss by denitrification and including new references for the parameters and input variables. The multi-local evaluation of AzoFert® and its use by laboratories and extension services in several regions have generated adaptations in the software parameters to the regional diversity of agricultural conditions, such as those encountered in the loamy soils of Picardie, the calcareous soils of Champagne, and the soils of Belgium [32] and Switzerland [1].
With regard to the future development of AzoFert®, its adaptations may be studied under different pedoclimatic and cultural situations. The AzoFert® model assumes that mineral N in the soil (residual N, mineralised N and fertiliser N) is fully available to the crop both temporally (between the opening of the balance sheet and crop harvest) and spatially (regardless of the distribution of water, nitrogen and roots in the soil profile). This assumption was verified for the N fertilisation of annual crops in northern Europe, where drainage stops at the end of winter and where water availability frequently does not limit N uptake over the growing season [17,18]. However, this condition is not always met in other climates, such as during droughts under Mediterranean conditions or under rainy conditions. In addition, AzoFert® is a predictive model, which, by definition, is based on the prediction of unknown climatic conditions during the growth of the crop to be fertilised. Furthermore, temperature and rainfall have strong effects on the microbial processes determining the dynamics of soil N supply (decomposition, mineralisation, nitrification), as well as the availability of mineral N to crops and the intensity of losses (leaching and gaseous emissions). Therefore, such a tool dedicated to the strategic management of fertiliser N should be ideally supplemented with tools for N diagnostics during plant growth [38]. A promising development for the tool is its ability to evolve towards other cropping systems, e.g., the current adaptation of AzoFert® for the fertilisation of perennial crops, particularly fruit-growing and vine-growing systems, which implies a specific adaptation of the plant N requirements of these crops, including the pluri-annual dynamics of N storage and remobilisation. The generic formalism and modularity of the software allow such evolution. Moreover, AzoFert® has been implemented as a teaching tool [39].

6. Conclusions

The scientific knowledge of C and N cycles acquired during the two last decades has led to the development of numerous mechanistic crop models that simulate the dynamics of crop N requirements and N supply in the soil. These models cannot be directly used by extension services to predict N fertilisation because they generally require a large number of inputs and parameters that may not be easily accessible at the field level. Thus, the AzoFert® model was created to meet the need to integrate recently acquired knowledge into a more simplistic tool that can be readily used by farmers and extension services. The AzoFert® model was developed within the conceptual scope of the predictive balance sheet method, although it differs greatly by considering the concept of “normalised days” and by integrating past real and future climatic data according to the characteristics of the year. After 13 years of using AzoFert®, the mean recommended N application rate has decreased for many crops, and therefore an economic gain has been observed in the agricultural areas where it is used. Although each individual equation of the calculation model is based on existing knowledge, it is the assembly and parameterisation, resulting in the simplest and also the most generic form possible, that makes it feasible to envisage the use of this tool and its future evolution across a wide range of cultural and pedoclimatic conditions. The work carried out to simulate and provide information on a wide range of crops, organic products and plant residues is particularly useful in the context of the evolution of the management of crop nutrition based increasingly on the recycling of organic forms of N, allowing the reduction or elimination of synthetic mineral N fertilisers.

Acknowledgments

This work was funded by INRA (Institut National de la Recherche Agronomique, France), LDAR (Laboratoire Départemental d’Analyses et de Recherche de l’Aisne) and ITB (Institut Technique de la Betterave), who also provided the numerous datasets that were used to evaluate the model. The authors thank B. Mary, B. Nicolardot, V. Parnaudeau, the partners of the RMT Fertilisation & Environment, France, for fruitful scientific exchanges on the formalisms of soil and crop processes, and C. Le Roux, B. Verbeque, and V. Ruas for their early involvement in the testing and improvement of the first versions of the software. We also thank A. Dupont for his contribution to the software programming. TEREOS and VIVESCIA are acknowledged for their contribution to the datasets for sugar beet and cereal crops. AzoFert® is a registered trademark of INRA.

Author Contributions

J.-M.M., N.D. and S.R. developed the agronomic bases and parameterisation of the decision-support tool; P.D. developed the software; N.D., R.D. and J.-L.J. evaluated the tool, particularly using the sugar beet experiments, and contributed to AZOFERT distribution to stakeholders; J.-M.M., P.D., N.D. and S.R. wrote the paper.

Conflicts of Interest

The authors declare no conflict of interest. The founding sponsors had no role in the design of the study; in the collection, analyses, or interpretation of data; in the writing of the manuscript, and in the decision to publish the results.

Appendix A

Table A1. Crop catalogue.
CodeWordingN RequirementsMax RSFCREMax FSThreshold (kg N/ha)
kg N/ha (1)kg N/q (2)(3)(4)(5)(6)(7)1 (8)2 (9)
“AVH”Winter oats02.2120080160180130
“AVP”Spring oats02.290080140160130
“BEF”Fodder beet2600900100180000
“BER”Red beet2600500100180000
“BET”Sugar beet22001200100160000
“BETT”Silver beet260040050200000
“BLDP”Spring durum wheat03.590080180100
“BLE”Winter wheat031200802801130220
“BLEP”Spring wheat0390080160160130
“BRO”Broccoli230040070180000
“CAD”Small carrot140040070100000
“CAG”Large carrot200090070150000
“CAN”Carrot nantaise180050070120000
“CHI”Chicory2000900100160000
“COL”Winter rape071200100250180160
“COLP”Spring rape05.290080180000
“END”Witloof chicory110090010080000
“EPI”Spring spinach260040050230000
“ESC”Winter barley02.41200802001100150
“ESCB”Brewing winter barley02.41200801801100150
“FLA”Flageolet bean2000403050120000
“HAM”Snap bean1800402050100000
“HAV”French bean160040105080000
“LIF”Fibre flax019007050000
“LIG”Oilseed flax04.590070130000
“MAF”Fodder maize01.4900802201100150
“MAG”Grain maize02.2900702201100150
“OIG”Onion160030080140000
“ORCP”Spring barley in chalky soils02.575080160160130
“ORP”Spring barley 02.290080160160130
“PTC”Food potato0060020220000
“PTF”Starch potato0060020220000
“PTPR”Early potato0050020140000
“SEI”Rye02.31200801501100150
“TOU”Sunflower04.59007080000
“TRI”Triticale02.61200801801130220
(1) Constant N Requirement (kg N/ha); (2) N requirement by production unit (kg N/q); (3) Maximum rooting depth (cm); (4) Symbiotic fixation (kg N/ha); (5) Coefficient of rooting exploration (%); (6) Maximum N fertiliser rate (kg N/ha); (7) Splitting (0 = no; 1 = splitting); (8) Threshold 1 for splitting (kg N/ha); (9) Threshold 2 for splitting (kg N/ha).

Appendix B

Table A2. Soil Catalogue.
CodeWordingD g/cm3 (1)Clay g/kg (2)Sand g/kg (3)CaCO3 g/kg (4)C g/kg (5)N g/kg (6)pH (7)PlD cm (8)PRD cm (9)St % (10)SMFC % (11)SMWP % (12)UW (13)DCML % (14)NO3 mg/L (15)
ACClay-lime1.4300110320161.88.12390033201.8010
APHeavy clay1.4540025025161.67.82390037251.85108
LAPDeep clayey loam1.42307010111.27.8261200271321012
LMPDeep med. loam1.4170801010.11.17.826120023101.81012
SPDeep sand1.35608001090.97.525900830.7010
RGRChalk champagne1.28090670181.88.3239002682.81018
(1) Bulk density g/cm3; (2) Clay g/kg; (3) Sand g/kg; (4) CaCO3 g/kg; (5) Organic C g/kg; (6) Total N g/kg; (7) pH; (8) Ploughing depth cm; (9) Potential rooting depth cm; (10) Stone content of upper layer (%); (11) Soil moisture at field capacity (%); (12) Soil moisture at wilting point (%); (13) useful water (mm/cm of soil); (14) Depth coefficient of mineralising layer (%); (15) Minimum soil N-NO3 content (mg/L).

Appendix C

Table A3. Previous Crop Catalogue.
CodeWordingDM HI RNC/N of ResiduesMin. Constants of C and NN min. ParametersC min. Parameters
% %Low High k l aN bN cNaC bC cC
(1)(2)(3)(4)(5)(6)(7)(8)(9)(10)(11)(12)(13)(14)
“AVP”Spring oats851151.855800.0300.008−0.43−1.0850.650.750.330.42
“BEF”Fodder beet2035121250.1480.0080.404−0.2250.6290.640.360.28
“BET”Sugar beet204.55121250.8600.0130.5−0.050.550.650.360.29
“BLD”Durum wheat851152.4751100.0300.008−0.43−1.0850.650.750.330.42
“BLE”Winter wheat851152751100.0300.008−0.43−1.0850.650.750.330.42
“BLEP”Spring wheat851152751100.0300.008−0.43−1.0850.650.750.330.42
“CAD”Small carrot1255110150.1480.0080.404−0.2250.6290.640.360.28
“CAG”Large carrot1275110150.1480.0080.404−0.2250.6290.640.360.28
“COL”Rape88330345900.0850.008−0.35−1.210.870.720.340.38
“END”Witloof chicory 25550.917250.1480.0080.404−0.2250.6290.640.360.28
“EPI”Spinach70.5103.512140.8600.0090.750.150.60.570.370.2
“ESC”Winter barley851151.7651000.0300.008−0.43−1.0850.650.740.330.41
“FEV”Pigen bean851203.515500.10050.0070.3−0.660.960.690.350.34
“FLA”Flageolet bean430.5101.613200.12420.0080.09−0.0960.180.650.360.29
“HAV”French bean100.210313200.8600.0130.5−0.050.550.650.360.29
“JAC”Fallow851200.870700.0300.008−0.43−1.0850.650.750.330.42
“LIF”Fibre flax859103.525450.0300.008−0.43−1.0850.650.750.330.42
“LIG”Oilseed flax850.7103.525450.0300.008−0.43−1.0850.650.750.330.42
“LUZD”Alfalfa230.2543.222340.13060.0080.31−0.250.570.640.360.28
“MAF”Fodder maize659201.360900.0030.008−0.35−1.210.870.720.340.38
“MAG”Grain maize851.120260900.0030.008−0.35−1.210.870.720.340.38
“OIG”Onion15801.413190.860.01210.60.320.280.570.370.2
“ORG”Spring barley851151.740800.030.008−0.43−1.0850.650.740.330.41
“POC”Pea100.1103.513180.860.01210.060.10.50.650.360.29
“POF”Grey pea851.3153.515500.10050.0080.01−0.620.630.690.350.34
“PRP”Perm. meadow01001100000000
“PTC”Food potato2045140700.08120.008−0.46−1.410.950.730.340.39
“PTF”Starch potato2045140700.08120.008−0.46−1.410.950.730.340.39
“PTP”Early potato2065140700.08120.008−0.46−1.410.950.730.340.39
“SEI”Rye851151.8751100.030.008−0.43−1.0850.650.750.330.42
“TOU”Sunflower650.4152.235550.0850.016−0.010−0.010.720.340.38
TRITriticale850.8151.8751100.030.008−0.43−1.0850.650.750.330.42
(1) Dry matter rate of exported component (%); (2) Harvest index of dry matter; (3) Root contribution to biomass at harvest (%); (4) N content of exported component (%); (5) C/N ratio of low residue option; (6) C/N ratio of high residue option; (7) Mineralisation constant (k) of N and C; (8) Mineralisation constant (l) of N and C; (9) N mineralisation parameter aN; (10) N mineralisation parameter bN; (11) N mineralisation parameter cN, (12) C mineralisation parameter aC, (13) C mineralisation parameter bC, (14) C mineralisation parameter cC.

Appendix D

Table A4. Catch Crop Catalogue.
CodeWordingR C/N of ResidueMin. Constants of C and NN min. ParametersC min. Parameters
Low High K l aN bN cNaC bC cC
(1)(2) (3)(4) (5)(6) (7)(8)(9) (10)(11)
“GRA”Graminea3020270.12420.0080.27−0.290.560.650.360.29
“LEG”Leguminosae2013200.860.01210.68−0.060.740.650.360.29
“MOUT”Mustard2020270.860.01210.5−0.10.60.670.350.31
“PHAC”Phacelia2020300.130.0080.35−0.250.580.660.350.31
“RAD”Radish3013230.13630.0080.38−0.240.580.640.360.28
(1) Rooting contribution at biomass (%); (2) C/N ratio of residue, low option; (3) C/N ratio of residue, high option; (4) Mineralisation constant (k) of N and C; (5) Mineralisation constant (l) of N and C; (6) N mineralisation parameter aN; (7) N mineralisation parameter bN; (8) N mineralisation parameter cN; (9) C mineralisation parameter aC; (10) C mineralisation parameter bC; (11) C mineralisation parameter cC.

Appendix E

Table A5. Organic Product Catalogue.
CodeWordingC NN minMin. Constants of C and NN min. ParametersC min. ParametersV
klaNbNcNaCbCcC
(1)(2)(3)(4)(5)(6)(7)(8)(9)(10)(11)(12)
“BOPA”Mud from paper mill10520.10.07950.002−1.1−2.61.50.390.20.190
“CDV”Compost of plant waste material1188.40.400.010.200.20.1700.170
“FBD”Decomposed cattle manure907.510.0250.00151010.580.370.210
“FBP”Strawy cattle manure9040.50.1170.0080.21−0.40.560.660.310.280
“FIV”Poultry dung2112440.860.01210.570.230.340.570.370.230
“LPO”Pig slurry103.120.860.01210.570.230.340.570.370.230
“VINA”Vinasse from sugar factory162240.80.860.01210.70.210.490.620.20.420
(1) Total C g/kg; (2) Total N g/kg; (3) Inorganic N (N–NH4) g/kg; (4) Mineralisation constant (k) of N and C; (5) Mineralisation constant (l) of N and C; (6) N mineralisation parameter aN; (7) N mineralisation parameter bN; (8) N mineralisation parameter cN; (9) C mineralisation parameter aC; (10) C mineralisation parameter bC; (11) C mineralisation parameter cC; (12) Maximum volatilisation of inorganic N.

References

  1. Maltas, A.; Charles, R.; Pellet, D.; Dupuis, B.; Levy, L.; Baux, L.; Jeangros, A.; Sinaj, B. Evaluation de deux méthodes pour optimiser la fertilisation azotée des grandes cultures. Agrarforschung Schweiz 2015, 6, 84–93. [Google Scholar]
  2. Sinaj, S.; Richner, W.; Flisch, R.; Charles, R. Données de base pour la fumure des grandes cultures et des herbages (DBF-GCH). Rev. Suisse Agric. 2009, 41, 1–98. [Google Scholar]
  3. Dumont, B.; Basso, B.; Bodson, B.; Destain, J.-P.; Destain, M.-F. Climatic risk assessment to improve nitrogen fertilisation recommendations: A strategic crop model-based approach. Eur. J. Agron. 2015, 65, 10–17. [Google Scholar] [CrossRef]
  4. Heumann, S.; Fier, A.; Haßdenteufel, M.; Höper, H.; Schäfer, W.; Eiler, T.; Böttcher, J. Minimizing nitrate leaching while maintaining crop yields: Insights by simulating net N mineralization. Nutr. Cycl. Agroecosyst. 2013, 95, 395–408. [Google Scholar] [CrossRef]
  5. Khan, Q.A.; McVay, K.A. Impact of tillage, irrigation method, and nitrogen rate on sugar beet productivity. Agron. J. 2014, 106, 1717–1721. [Google Scholar] [CrossRef]
  6. Li, F.Y.; Johnstone, P.R.; Pearson, A.; Fletcher, A.; Jamieson, P.D.; Brown, H.E.; Zyskowski, R.F. AmaizeN: A decision support system for optimizing nitrogen management of maize. NJAS Wageningen J. Life Sci. 2009, 57, 93–100. [Google Scholar] [CrossRef]
  7. Gallardo, M.; Thompson, R.B.; Giménez, C.; Padilla, F.M.; Stöckle, C.O. Prototype decision support system based on the VegSyst simulation model to calculate crop N and water requirements for tomato under plastic cover. Irrig. Sci. 2014, 32, 237–253. [Google Scholar] [CrossRef]
  8. Guillaume, S.; Bruzeau, C.; Justes, E.; Lacroix, B.; Bergez, J.E. A conceptual model of farmers’ decision-making process for nitrogen fertilization and irrigation of durum wheat. Eur. J. Agron. 2016, 73, 133–143. [Google Scholar] [CrossRef]
  9. Dumont, B.; Basso, B.; Bodson, B.; Destain, J.-P.; Destain, M.-F. Assessing and modeling economic and environmental impact of wheat nitrogen management in Belgium. Environ. Model. Softw. 2016, 79, 184–196. [Google Scholar] [CrossRef]
  10. Johnsson, H.; Larsson, M.; Mårtensson, K.; Hoffmann, M. SOILNDB: A decision support tool for assessing nitrogen leaching losses from arable land. Environ. Model. Softw. 2002, 17, 505–517. [Google Scholar] [CrossRef]
  11. Van Grinsven, H.J.M.; ten Berge, H.F.M.; Dalgaard, T.; Fraters, B.; Durand, P.; Hart, A.; Hofman, G.; Jacobsen, B.H.; Lalor, S.T.J.; Lesschen, J.P.; et al. Management, regulation and environmental impacts of nitrogen fertilization in northwestern Europe under the nitrates Directive; A benchmark study. Biogeosciences 2012, 9, 5143–5160. [Google Scholar] [CrossRef] [Green Version]
  12. Hébert, J. La fumure azotée du blé tendre d’hiver. Bull. Tech. d'Inf. 1969, 244, 755–766. [Google Scholar]
  13. Rémy, J.C.; Hébert, J. Le devenir des engrais azotés dans le sol. C. R. Acad. Agric. Fr. 1977, 63, 700–714. [Google Scholar]
  14. Meynard, J.M.; Justes, E.; Machet, J.M.; Recous, S. Fertilisation azotée des cultures annuelles de plein champ. In Maîtrise de l’azote dans les Agrosystèmes, Les Colloques de l'INRA; Lemaire, G., Nicolardot, B., Eds.; INRA: Paris, France, 1997; Volume 83, pp. 183–200. [Google Scholar]
  15. Cabrera, M.L.; Kissel, D.E.; Vigil, M.F. Nitrogen mineralization from organic residues: Research opportunities. J. Environ. Qual. 2005, 34, 75–79. [Google Scholar] [CrossRef] [PubMed]
  16. Lashermes, G.; Nicolardot, B.; Parnaudeau, V.; Thuriès, L.; Chaussod, R.; Guillotin, M.L.; Linères, M.; Mary, B.; Metzger, L.; Morvan, T.; et al. Typology of exogenous organic matters based on chemical and biochemical composition to predict potential nitrogen mineralization. Bioresour. Technol. 2010, 101, 157–164. [Google Scholar] [CrossRef] [PubMed]
  17. Powlson, D.S.; Hart, P.B.S.; Poulton, P.R.; Johnston, A.E.; Jenkinson, D.S. Influence of soil type, crop management and weather on the recovery of 15N-labelled fertilizer applied to winter wheat in spring. J. Agric. Sci. 1992, 118, 83–100. [Google Scholar] [CrossRef]
  18. Recous, S.; Machet, J.M. Short-term immobilisation and crop uptake of fertiliser-N applied to winter wheat: Effect of date of application in spring. Plant Soil 1998, 206, 137–149. [Google Scholar] [CrossRef]
  19. Andrén, O.; Paustian, K. Barley straw decomposition in the field: A comparison of models. Ecology 1987, 68, 1190–1200. [Google Scholar] [CrossRef]
  20. Rodrigo, A.; Recous, S.; Néel, C.; Mary, B. Modelling temperature and moisture effects on C–N transformations in soils: Comparison of nine models. Ecol. Model. 1997, 102, 325–339. [Google Scholar] [CrossRef]
  21. Chaussod, R.; Nicolardot, B.; Catroux, G.; Chretien, J. Relations entre les caractéristiques physico-chimiques et microbiologiques de quelques sols cultivés. Science du Sol 1986, 2, 213–226. [Google Scholar]
  22. Delphin, J.E.; Huck, C.; Tiquet, J. Evaluation du pouvoir minéralisateur de sols agricoles en fonction de leurs caracteristiques physico-chimiques. Agronomie 1986, 6, 453–458. [Google Scholar] [CrossRef]
  23. Mary, B.; Beaudoin, N.; Justes, E.; Machet, J.M. Calculation of nitrogen mineralization and leaching in fallow soil using a simple dynamic model. Eur. J. Soil Sci. 1999, 50, 549–566. [Google Scholar] [CrossRef]
  24. Recous, S.; Robin, D.; Darwis, D.; Mary, B. Soil inorganic N availability: Effect on maize residue decomposition. Soil Biol. Biochem. 1995, 27, 1529–1538. [Google Scholar] [CrossRef]
  25. Parnaudeau, V.; Génermont, S.; Hénault, C.; Farrugia, A.; Robert, P.; Nicolardot, B. Measured and simulated nitrogen fluxes after field application of food-processing and municipal organic wastes. J. Environ. Qual. 2009, 38, 268–280. [Google Scholar] [CrossRef] [PubMed]
  26. Trinsoutrot, I.; Recous, S.; Bentz, B.; Linères, M.; Cheneby, D.; Nicolardot, B. Relationships between biochemical quality of crop residues and C and N mineralisation kinetics under non-limiting N conditions. Soil Sci. Soc. Am. J. 2000, 64, 918–926. [Google Scholar] [CrossRef]
  27. Recous, S.; Loiseau, P.; Machet, J.M.; Mary, B. Transformations et devenir de l’azote de l’engrais sous cultures annuelles et sous prairies. In Maîtrise de l’azote dans les Agrosystèmes, Les Colloques de l’INRA; Lemaire, G., Nicolardot, B., Eds.; INRA: Paris, France, 1997; Volume 83, pp. 105–120. [Google Scholar]
  28. Mary, B.; Recous, S.; Darwis, D.; Robin, D. Interactions between decomposition of plant residues and nitrogen cycling in soil. Plant Soil 1996, 181, 71–82. [Google Scholar] [CrossRef]
  29. Genermont, S. Modélisation de la Volatilisation D’ammoniac Après Epandage de Lisier sur Parcelle Agricole. Ph.D. Thesis, Université Paul Sabatier, Toulouse, France, 1996. [Google Scholar]
  30. Kamphake, L.J.; Hannah, S.A.; Cohen, J.M. Automated analysis for nitrate by hydrazine reduction. Water Res. 1967, 1, 205–216. [Google Scholar] [CrossRef]
  31. Krom, M.D. Spectrophotometric determination of ammonia: A study of a modified Berthelot reaction using salicylate and dichloroisocyanurate. Analyst 1980, 105, 305–316. [Google Scholar] [CrossRef]
  32. Abras, M.; Goffart, J.P.; Destain, J.P. Perspectives d’amélioration du conseil prévisionnel de fertilisation azotée à la parcelle en Wallonie par l’utilisation du logiciel AzoFert®. Biotechnol. Agron. Soc. Environ. 2013, 17, 215–220. [Google Scholar]
  33. Machet, J.M.; Laurent, F.; Chapot, J.Y.; Doré, T.; Dulout, A. Maîtrise de l’azote dans les intercultures et les jachères. In Maîtrise de l’azote dans les Agrosystèmes, Les Colloques de l'INRA; Lemaire, G., Nicolardot, B., Eds.; INRA: Paris, France, 1997; Volume 83, pp. 271–288. [Google Scholar]
  34. Machet, J.M.; Dubrulle, P.; Louis, P. Azobil®: A computer program for fertiliser N recommendations based on a predictive balance sheet method. In Proceedings of the 1st Congress of the European Society of Agronomy, Paris, France, 5–7 December 1990; European Society of Agronomy: Colmar, France. [Google Scholar]
  35. Duval, R.; Machet, J.M. Fertilizer N recommendation for sugar beet crop: A validation of Azofert calculation software. In Proceedings of the 15th European N Workshop, Lleida, Spain, 28–30 May 2007; Available online: http://www.npc.inra.fr/Le-centre-Les-recherches/Impacts-environnementaux/Azofert-une-aide-pour-raisonner-la-fertilisation-des-cultures (accessed on 23 August 2016).
  36. Brisson, N.; Mary, B.; Ripoche, D.; Jeuffroy, M.H.; Ruget, F.; Nicoullaud, B.; Gate, P.; Devienne-Barret, F.; Antonioletti, R.; Dürr, C.; et al. STICS: A generic model for the simulation of crops and their water and nitrogen balances. I. Theory and parameterization applied to wheat and corn. Agronomie 1998, 18, 311–346. [Google Scholar] [CrossRef]
  37. Nicolardot, B.; Recous, S.; Mary, B. Simulation of C and N mineralisation during crop residue decomposition: A simple dynamic model based on the C: N ratio of the residues. Plant Soil 2001, 228, 83–103. [Google Scholar] [CrossRef]
  38. Lemaire, G.; Jeuffroy, M.H.; Gastal, F. Diagnosis tool for plant and crop N status in vegetative stage. Eur. J. Agron. 2008, 28, 614–624. [Google Scholar] [CrossRef]
  39. Educagri Editions, Ressources Pédagogiques pour le Projet N’Edu-Gestion de l’azote en Agriculture. Available online: http://editions.educagri.fr/num/NEDU/N0-Portail/co/N0-1-1.html (accessed on 7 November 2017).
Figure 1. Examples of the net N contribution of organic inputs to soil mineral N. (a) Potential net N mineralisation curves for vinasse, mustard residue (catch crop) and winter wheat straw modelled using AzoFert® (organic product, residue and catch crop catalogues). Net mineralisation is expressed as a function of normalised time (equivalent days at 15 °C and field capacity). (b) Calculation of the net contribution of vinasse (Ma), mustard residues (Mcc) and wheat straw (Mr) during plant growth. The net contribution is calculated as the difference between net mineralisation at balance opening and closing. This contribution considers the actual date of the application of the various inputs.
Agronomy 07 00073 g001
Figure 2. Diagram of the AzoFert® software and its integration in a data management system.
Agronomy 07 00073 g002
Figure 3. Comparison of the N uptake by plants in the control plots (no fertiliser) and the N supply estimated using AzoFert® software. The 133 data points include several crops (winter wheat, winter and spring barley, and field vegetables).
Agronomy 07 00073 g003
Figure 4. Comparison of the N uptake by plants in the control plots (no mineral fertiliser) receiving different organic sources and the N supply estimated using AzoFert® software. T0: no organic application, CC: cover crop, VA: vinasse applied in August, VA + CC: vinasse applied in August + cover crop, VP: vinasse applied in February, VO: vinasse applied in October.
Agronomy 07 00073 g004
Figure 5. Relative changes in yield and soil mineral N at harvest time as a function of the fertiliser N dose. (a) winter crops; (b) spring crops; (c,d) field vegetables. The data are the mean of 23 field trials. The yield and soil mineral N (SMN) indices are expressed relative to the control treatments (0 N = 100). The AzoFert®-recommended N rate for each crop is represented by empty circles.
Agronomy 07 00073 g005
Table 1. Calculation of the net N contribution (Ma) from vinasse between the opening and closing dates of the N balance for sugar beet crops using AzoFert® according to the date of application.
Date of Application of Vinasse to SoilsVinasse N Contribution (Ma) kg N ha−1
Mid-August3
Mid-September9
Mid-October13
Mid-November17
Mid-March48
Table 2. Characteristics of the datasets used to test AzoFert®.
DatasetInstitutionTrial NumberPeriodLocationSoil TypesCropsTreatments Studied
1LDAR (1) & different services1332005–2014Northsilty clay loam chalkywinter wheat winter & spring barley field vegetables
-
Fertiliser rate
2TEREOS Sugar Group, LDAR92006–2014North, Picardyloamysugar beet
-
Vinasse (2)
-
Catch crops
-
No N mineral fertiliser
3LDAR232005–2011Champagne Picardy, Northloamy sandy chalkywinter crops spring crops field vegetables
-
Fertiliser rate
(1) LDAR: Laboratoire Départemental d’Analyses et de Recherche (Aisne, France); (2) Spreading of vinasse (applied in August, October or March)
Table 3. Evolution of the N rates recommended by Laboratoire Départemental d’Analyses et de Recherche (LDAR) for different main crops in northern France.
Crop Period
1993–20042005–2015
Winter wheatNumber of fields78949201
Objective yield (Mg ha−1)8.59.3
Recommended N rate (kg N ha−1)169191
Ratio N rate: yield19.920.5
Spring barleyNumber of fields28003229
Objective yield (Mg ha−1)6.97.3
Recommended N rates (kg N ha−1)107104
Ratio N rate: yield15.514.2
Sugar beetNumber of fields49257334
Recommended N rates (kg N ha−1)11080

