Article

Determination of Micronutrient Accumulation in Greenhouse Cucumber Crop Using a Modeling Approach

by
Lino J. Ramírez-Pérez
1,
América Berenice Morales-Díaz
2,
Karim De Alba-Romenus
3,
Susana González-Morales
4,
Adalberto Benavides-Mendoza
1 and
Antonio Juárez-Maldonado
5,*
1
Departamento de Horticultura, Universidad Autónoma Agraria Antonio Narro, 25315 Saltillo, Coahuila, Mexico
2
Robótica y Manufactura Avanzada, Centro de Investigación y de Estudios Avanzados del Instituto Politécnico Nacional Unidad Saltillo, 25900 Ramos Arizpe, Coahuila, Mexico
3
Informática y Telecomunicaciones, Universidad Autónoma Agraria Antonio Narro, 25315 Saltillo, Coahuila, Mexico
4
Cátedras CONACyT, Departamento de Horticultura, Universidad Autónoma Agraria Antonio Narro, 25315 Saltillo, Coahuila, Mexico
5
Departamento de Botánica, Universidad Autónoma Agraria Antonio Narro, 25315 Saltillo, Coahuila, Mexico
*
Author to whom correspondence should be addressed.
Agronomy 2017, 7(4), 79; https://doi.org/10.3390/agronomy7040079
Submission received: 21 September 2017 / Revised: 1 November 2017 / Accepted: 21 November 2017 / Published: 23 November 2017

Abstract

:
The control of micronutrient application in cucumber cultivation has great importance as they participate in many functions of metabolism. In addition, micronutrient application efficiency is fundamental to avoid periods of overconsumption or deficits in the crop. To determine micronutrient accumulation using a dynamic model, two cycles of Vitaly and Luxell cucumber crops were grown. During the development of the crop, micronutrient content (Fe, B, Mn, Cu, and Zn) in the different organs of the cucumber plant was quantified. The model dynamically simulated the accumulation of biomass and micronutrients using climatic variables recorded inside the greenhouse as inputs. It was found that a decrease in photosynthetically active radiation and temperature significantly diminished the accumulation of biomass by the cucumber plants. On the other hand, the results demonstrated that the model efficiently simulated both the accumulation of biomass and micronutrients in a cucumber crop. The efficiency evaluation showed values higher than R2 > 0.95. This dynamic model can be useful to define adequate strategies for the management of cucumber cultivation in greenhouses as well as the application of micronutrients.

1. Introduction

At present, increasing crop productivity along with quality is essential for greater profitability. Protected agriculture (PA) is the most effective means of overcoming climate diversity, increasing yields, and at the same time significantly improving product quality as requested by market demand [1]. PA can be defined as an agricultural system that specializes in soil and climate ecosystem control where changes to certain conditions (soil, temperature, solar radiation, wind, humidity, and air composition) can be made, for example, greenhouses, shade houses, and macro tunnels. Cucumber (Cucumis sativus L.) is one of the most commonly produced crops under PA as it achieves higher yields, quality, and safety. In addition, the value of cucumber also lies in its form of consumption, since it can be consumed fresh or processed [2]. However, to obtain the greatest potential of this crop under PA, it is necessary to be aware of the requirements concerning various climatic, water, and nutritional factors.
Macro and micronutrients are the essential elements found in plant tissues, but macronutrients are normally found in relatively higher concentrations than micronutrients. However, the essentiality of nutrients is so important, and this is not dependent on their concentration of dry biomass [3]. An adequate supply of nutrients according to the demand of each crop is essential to obtain higher yields and quality [4]. Therefore, the supply of nutrients must be carried out with higher efficiency [5,6] to maximize crop potential and avoid excessive application of chemical fertilizers that can cause environmental issues [7,8,9]. In addition, an adequate supply of nutrients avoids the toxic effects that reduce photosynthetic activity as well as damage the cell membranes and suppress enzyme activity [10]. Micronutrients participate in various physiological processes. For example, the biological significance of Fe results from its reversible oxidation state changes over a wide range of redox potentials. In addition, Fe is a component of a number of enzymes involved in various biological processes including respiration and photosynthesis [11]. Zn is an important component of many enzymes, and a structural stabilizer of proteins and plant membranes [12]. Mn is an active component of the water-splitting system of photosystem II, which provides the electrons necessary for photosynthesis [13]. In addition, Mn plays an important role in the biosynthesis of secondary metabolites such as flavonoids and lignin [14]. Cu is a redox transition element with an important function in photosynthesis, respiration, and metabolism of C and N. Cu also induces protection against oxidative stress. Like Fe, Cu forms highly stable complexes and participates in electron transfer reactions [15]. B participates in the transport of sugars, cell wall synthesis, lignification, carbohydrate and RNA metabolism, indole acetic acid metabolism (IAA), and phenols. Given their importance, the application of micronutrients to crops should be defined according to the characteristics of the crop of interest [16]. To assess the micronutrient demand, the accumulation of dry biomass to quantify the nutritional demand has been used [17]. However, biomass accumulation varies from cycle to cycle as crop growth is heavily dependent on climatic factors. Therefore, it is necessary to consider climatic characteristics when a crop is in a specific development stage, namely the vegetative, reproductive, fruit set, and harvest stages, to define the nutritional needs. Juárez-Maldonado et al. [18] showed that it was possible to accurately determine the demand of macronutrients (N, P, K, Ca, Mg, and S) in tomato cultivation from dynamic models that considered climate effects on crop growth. These models applied to crops under greenhouse could function as effective tools to increase crop productivity [19]. Among other things, mathematical models allow us to evaluate strategies for the possible management of a greenhouse without the need for expensive experiments [20]. However, it is important that these models are simple and easy to use. One way to do this is to use linear models, as they are simpler and can be very precise. The availability of nutrients is a factor that determines the growth and productivity of plants. With high availability, plants will perform mineral absorption according to their demand [21]. Under this condition, the nutrient uptake will remain constant according to the accumulation of biomass [22]. Moreover, it has been demonstrated that a high correlation exists between the accumulations of some macronutrients (N and P) with the amount of biomass [23,24]. Therefore, it is possible to use linear models to describe the nutrient accumulation in relation to biomass accumulation.
Although several models for essential macronutrients (N, P, K, Ca, Mg, and S), as well as for non-essential nutrients (Si, Se), in different crops (tomato, cucumber, peppers, lettuce, rice) have been developed and tested, there is little information about micronutrient modeling [25,26]. Therefore, the objectives of the present study were (1) to determine the micronutrient content in the cucumber crop throughout its growth, (2) to determine the correlation between micronutrient accumulation and amount of biomass, and (3) to use a dynamic model to determine micronutrient accumulation by the cucumber crop as a function of the climate variables.

2. Results and Discussion

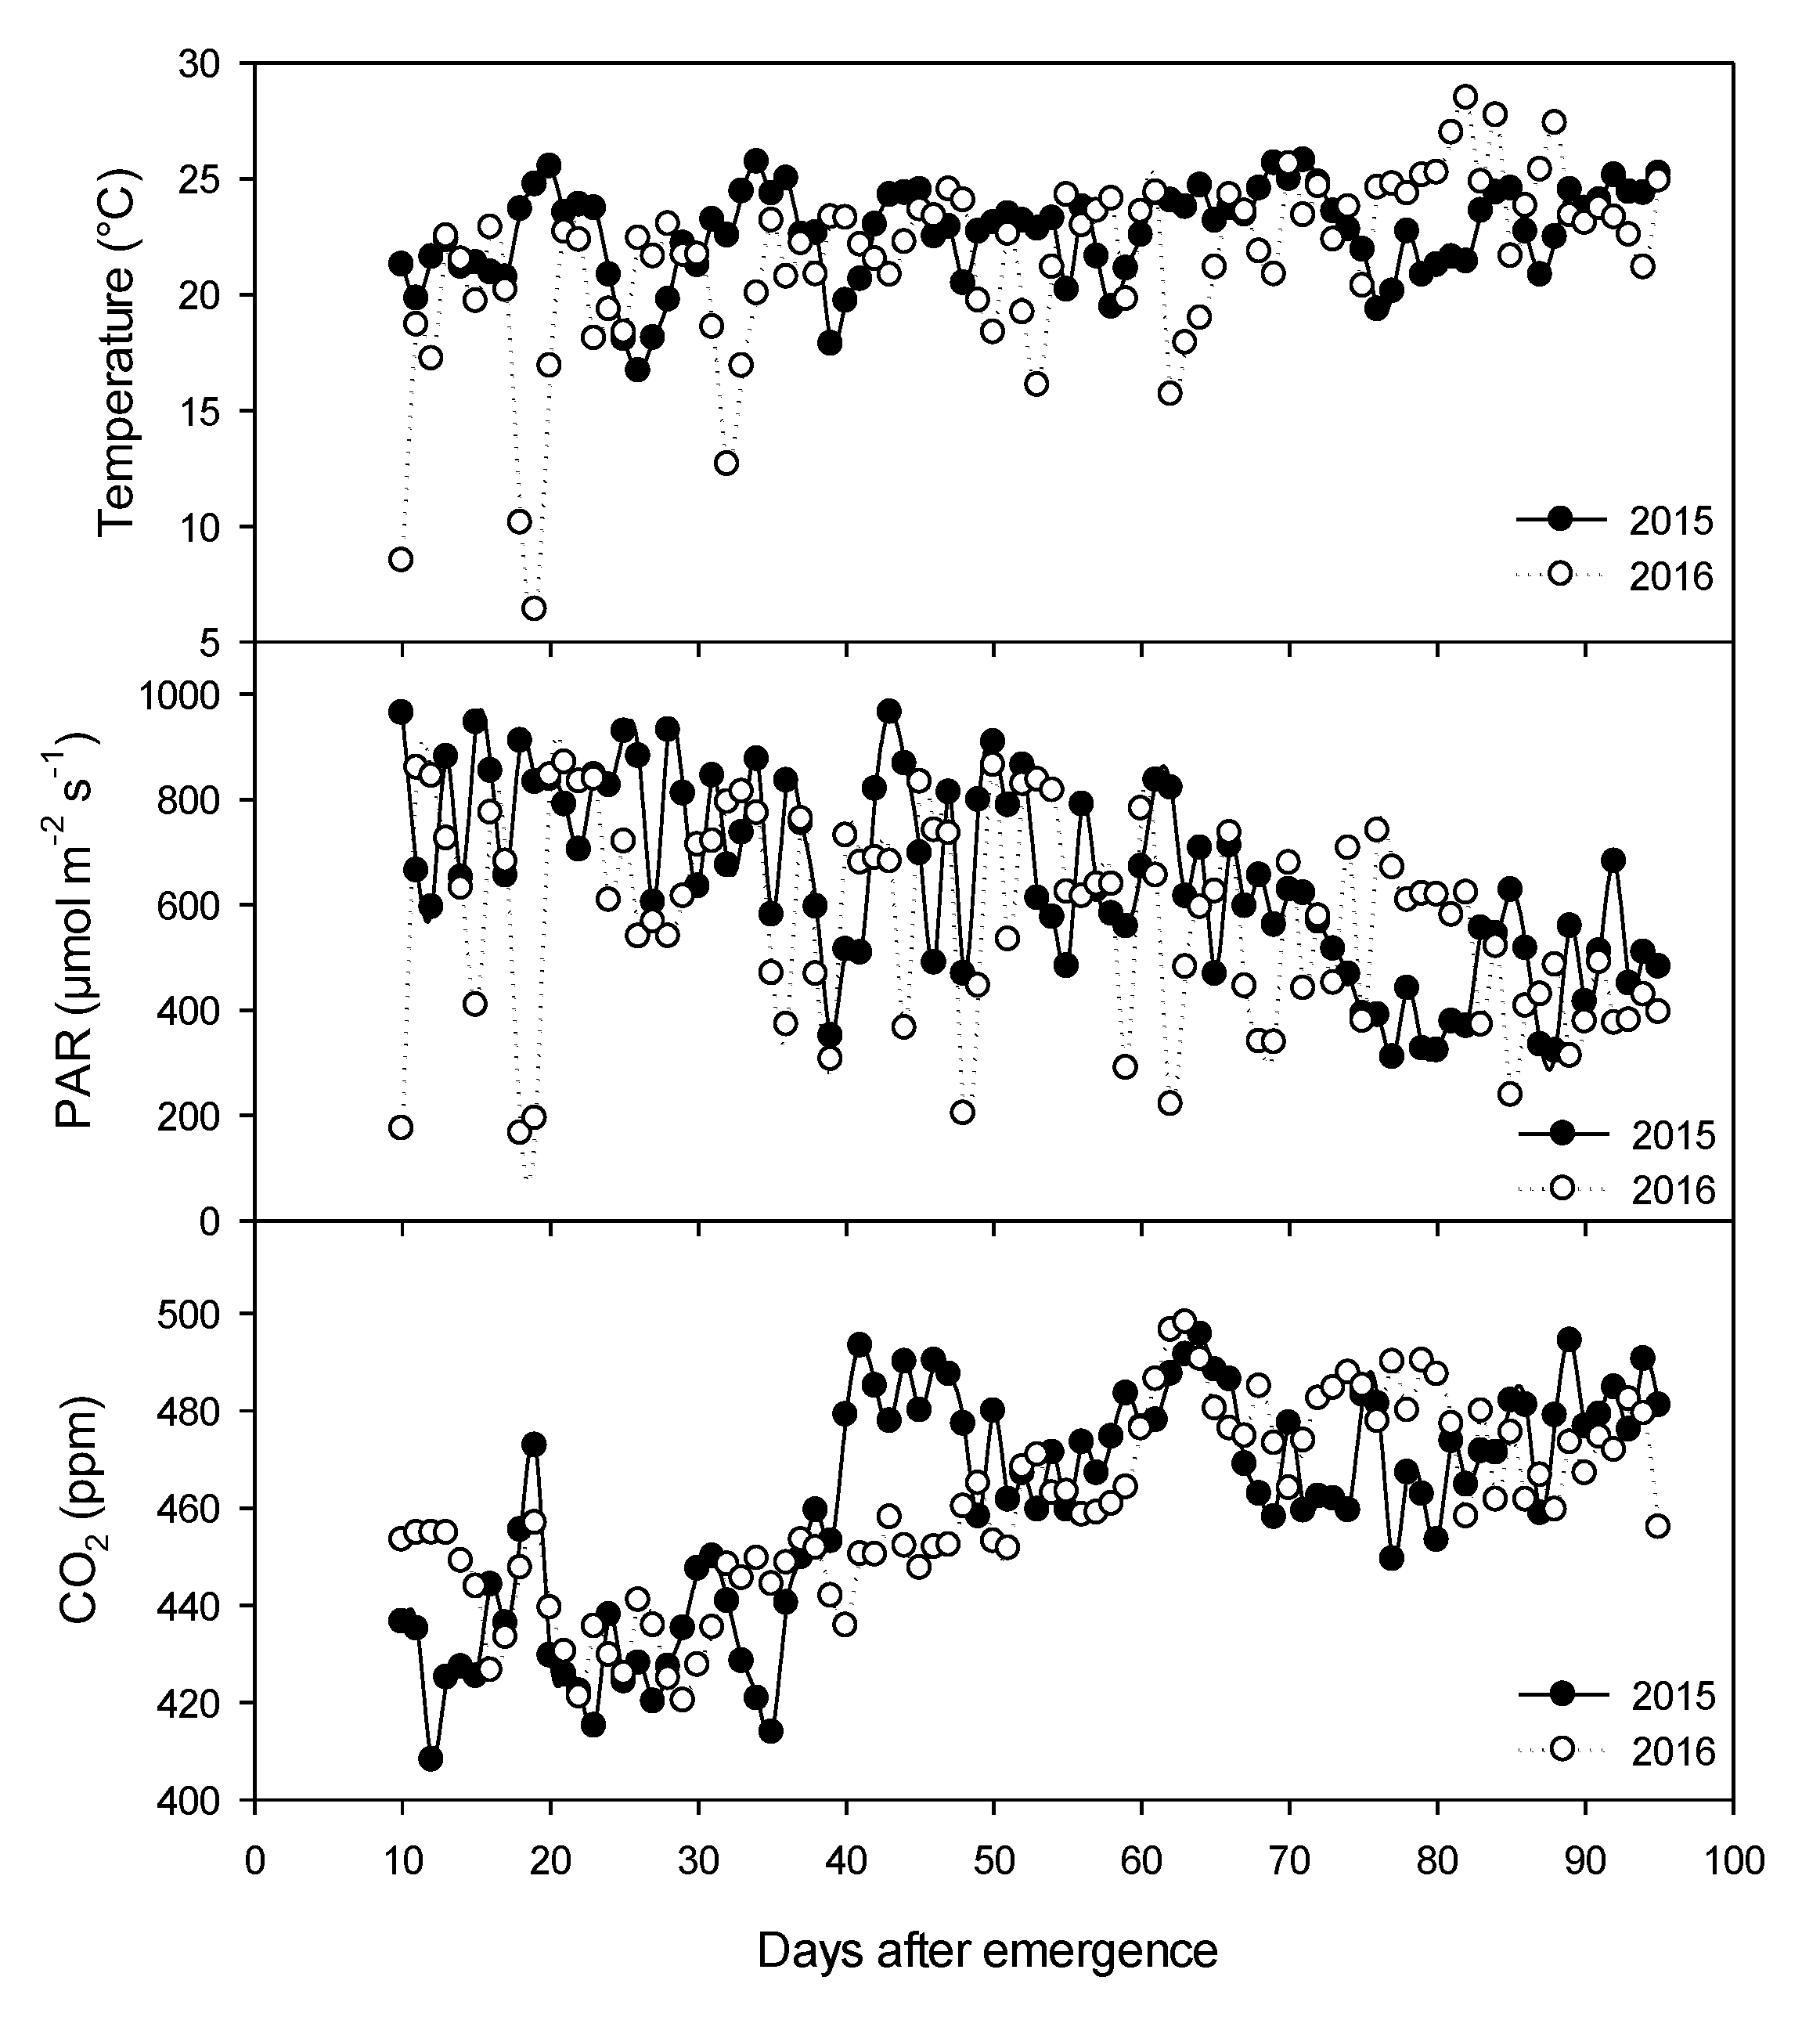
2.1. Climatic Variables

Figure 1 shows the daily average climate data recorded inside the greenhouse during the development of the crops. In the second crop cycle, a clear decrease of the photosynthetically active radiation PAR and temperature could be observed. This represents a direct effect on crop biomass accumulation since both the PAR and temperature are environmental factors that directly influence photosynthesis [27,28,29,30]. It can be seen that PAR and temperature can proportionally decrease the accumulation of biomass.

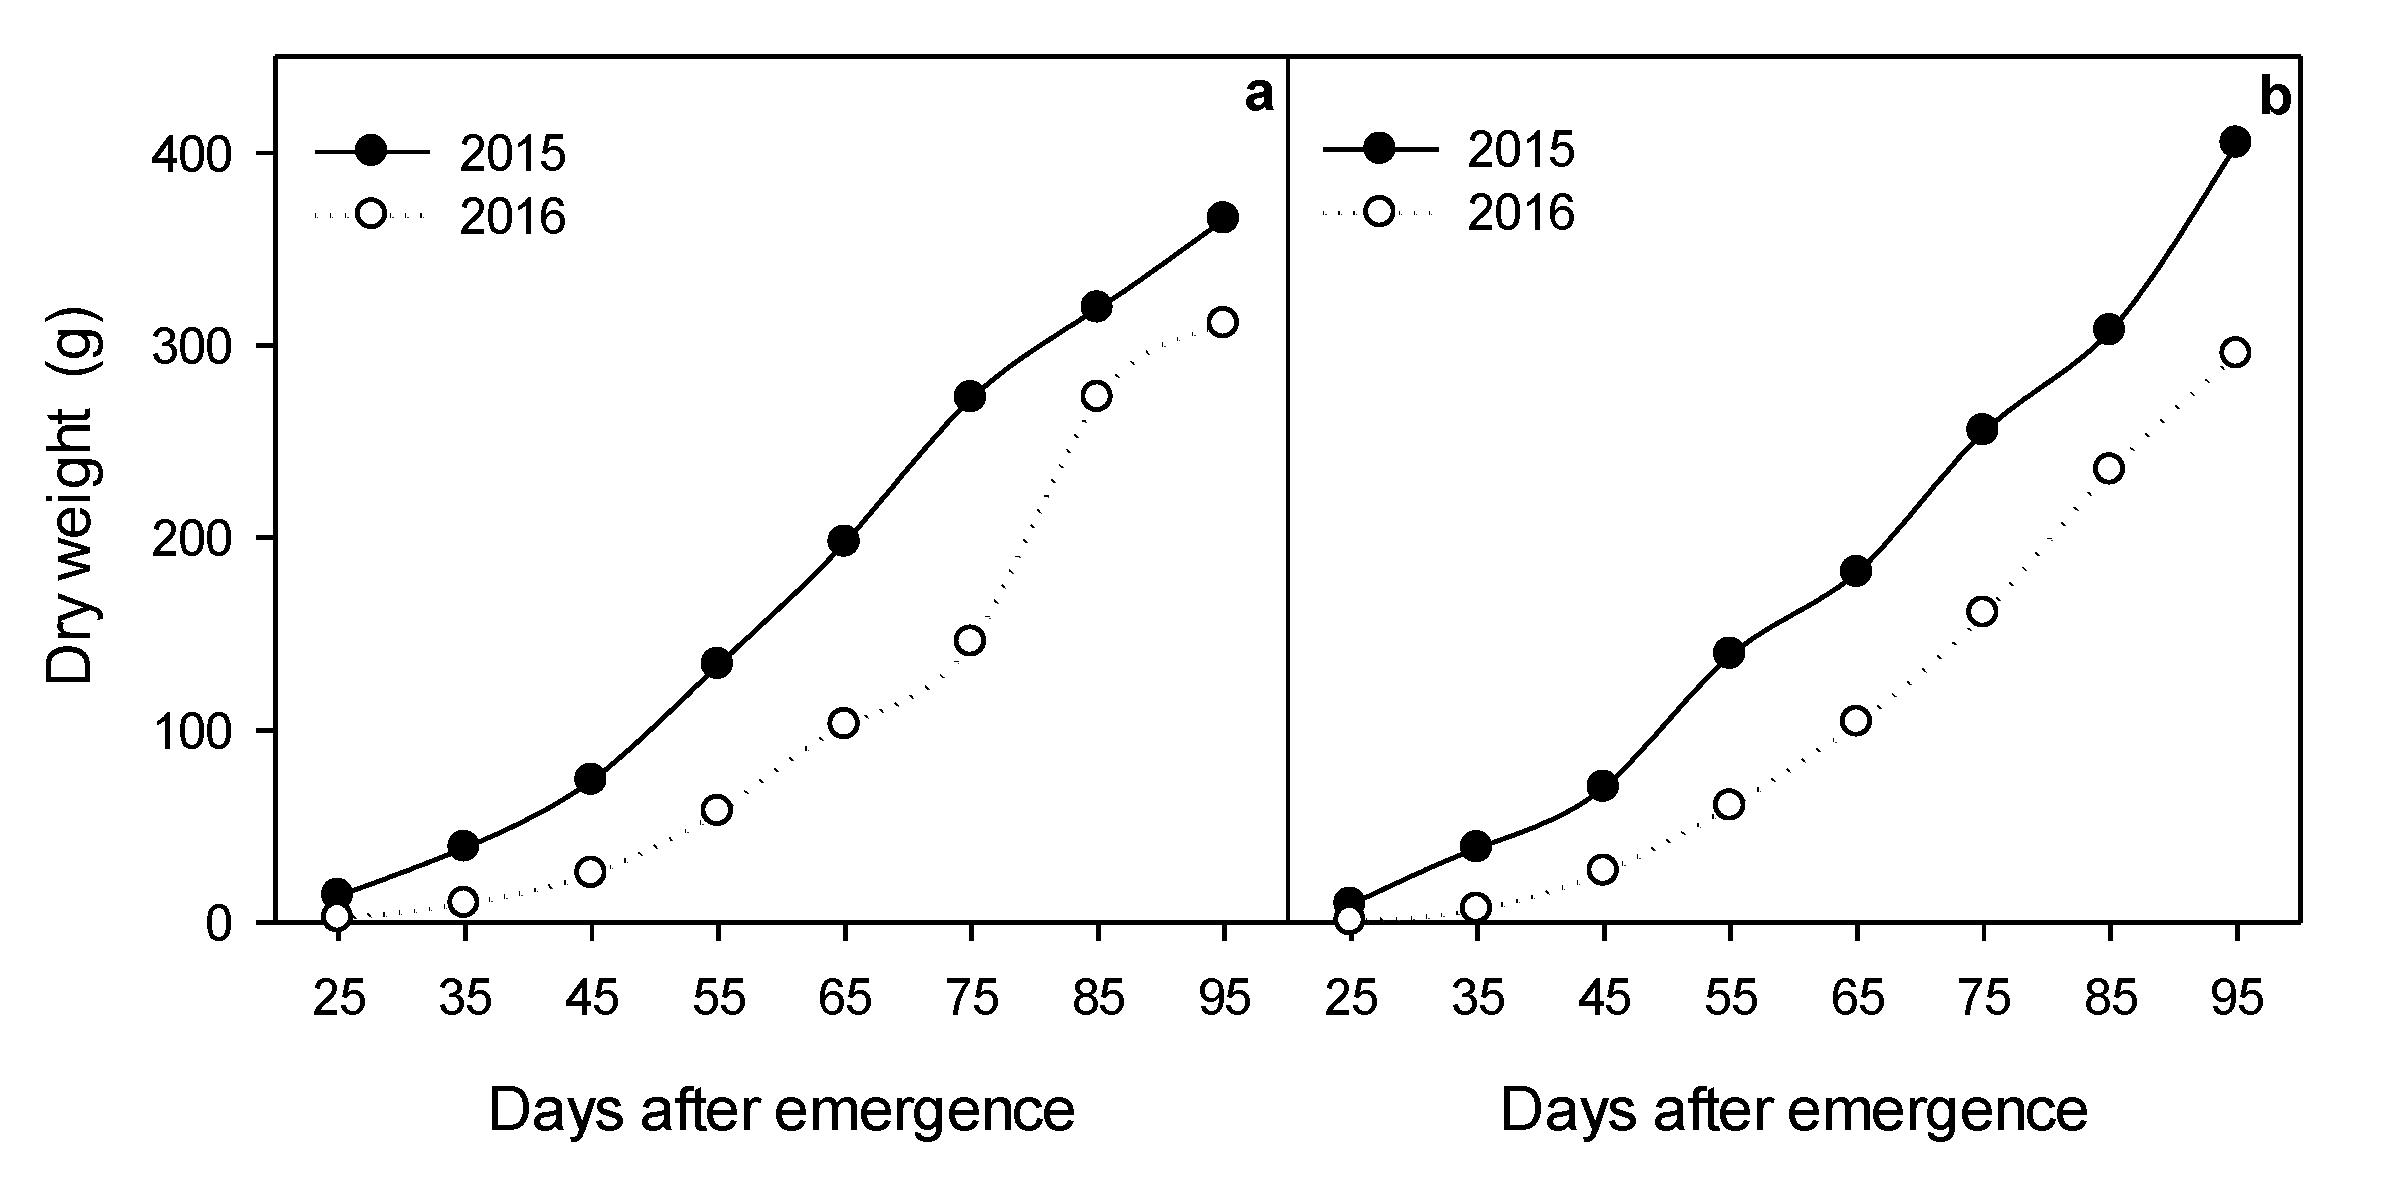
2.2. Biomass Accumulation

Figure 2 shows the total dry biomass accumulation for both cucumber varieties (Vitaly and Luxell) evaluated during the two cycles. The trend in biomass accumulation was similar across the varieties. However, the accumulation of biomass in the second cycle of study for both evaluated varieties decreased due to the effect of the climatic conditions recorded in 2016, as they directly influenced the rate of photosynthesis [31,32]. The climate conditions during 2016 were lower than in the 2015 cycle (Figure 1), which resulted in a reduction of biomass accumulation. Particularly, the PAR influenced photosynthetic activity leading to a reduction of the biomass production in the crop [27,28,29,30]. In addition, temperature also directly influenced plant growth, since there is a linear relationship between them [33]. This explains the accumulated biomass reduction observed in the 2016 crop cycle when compared to the previous cycle.

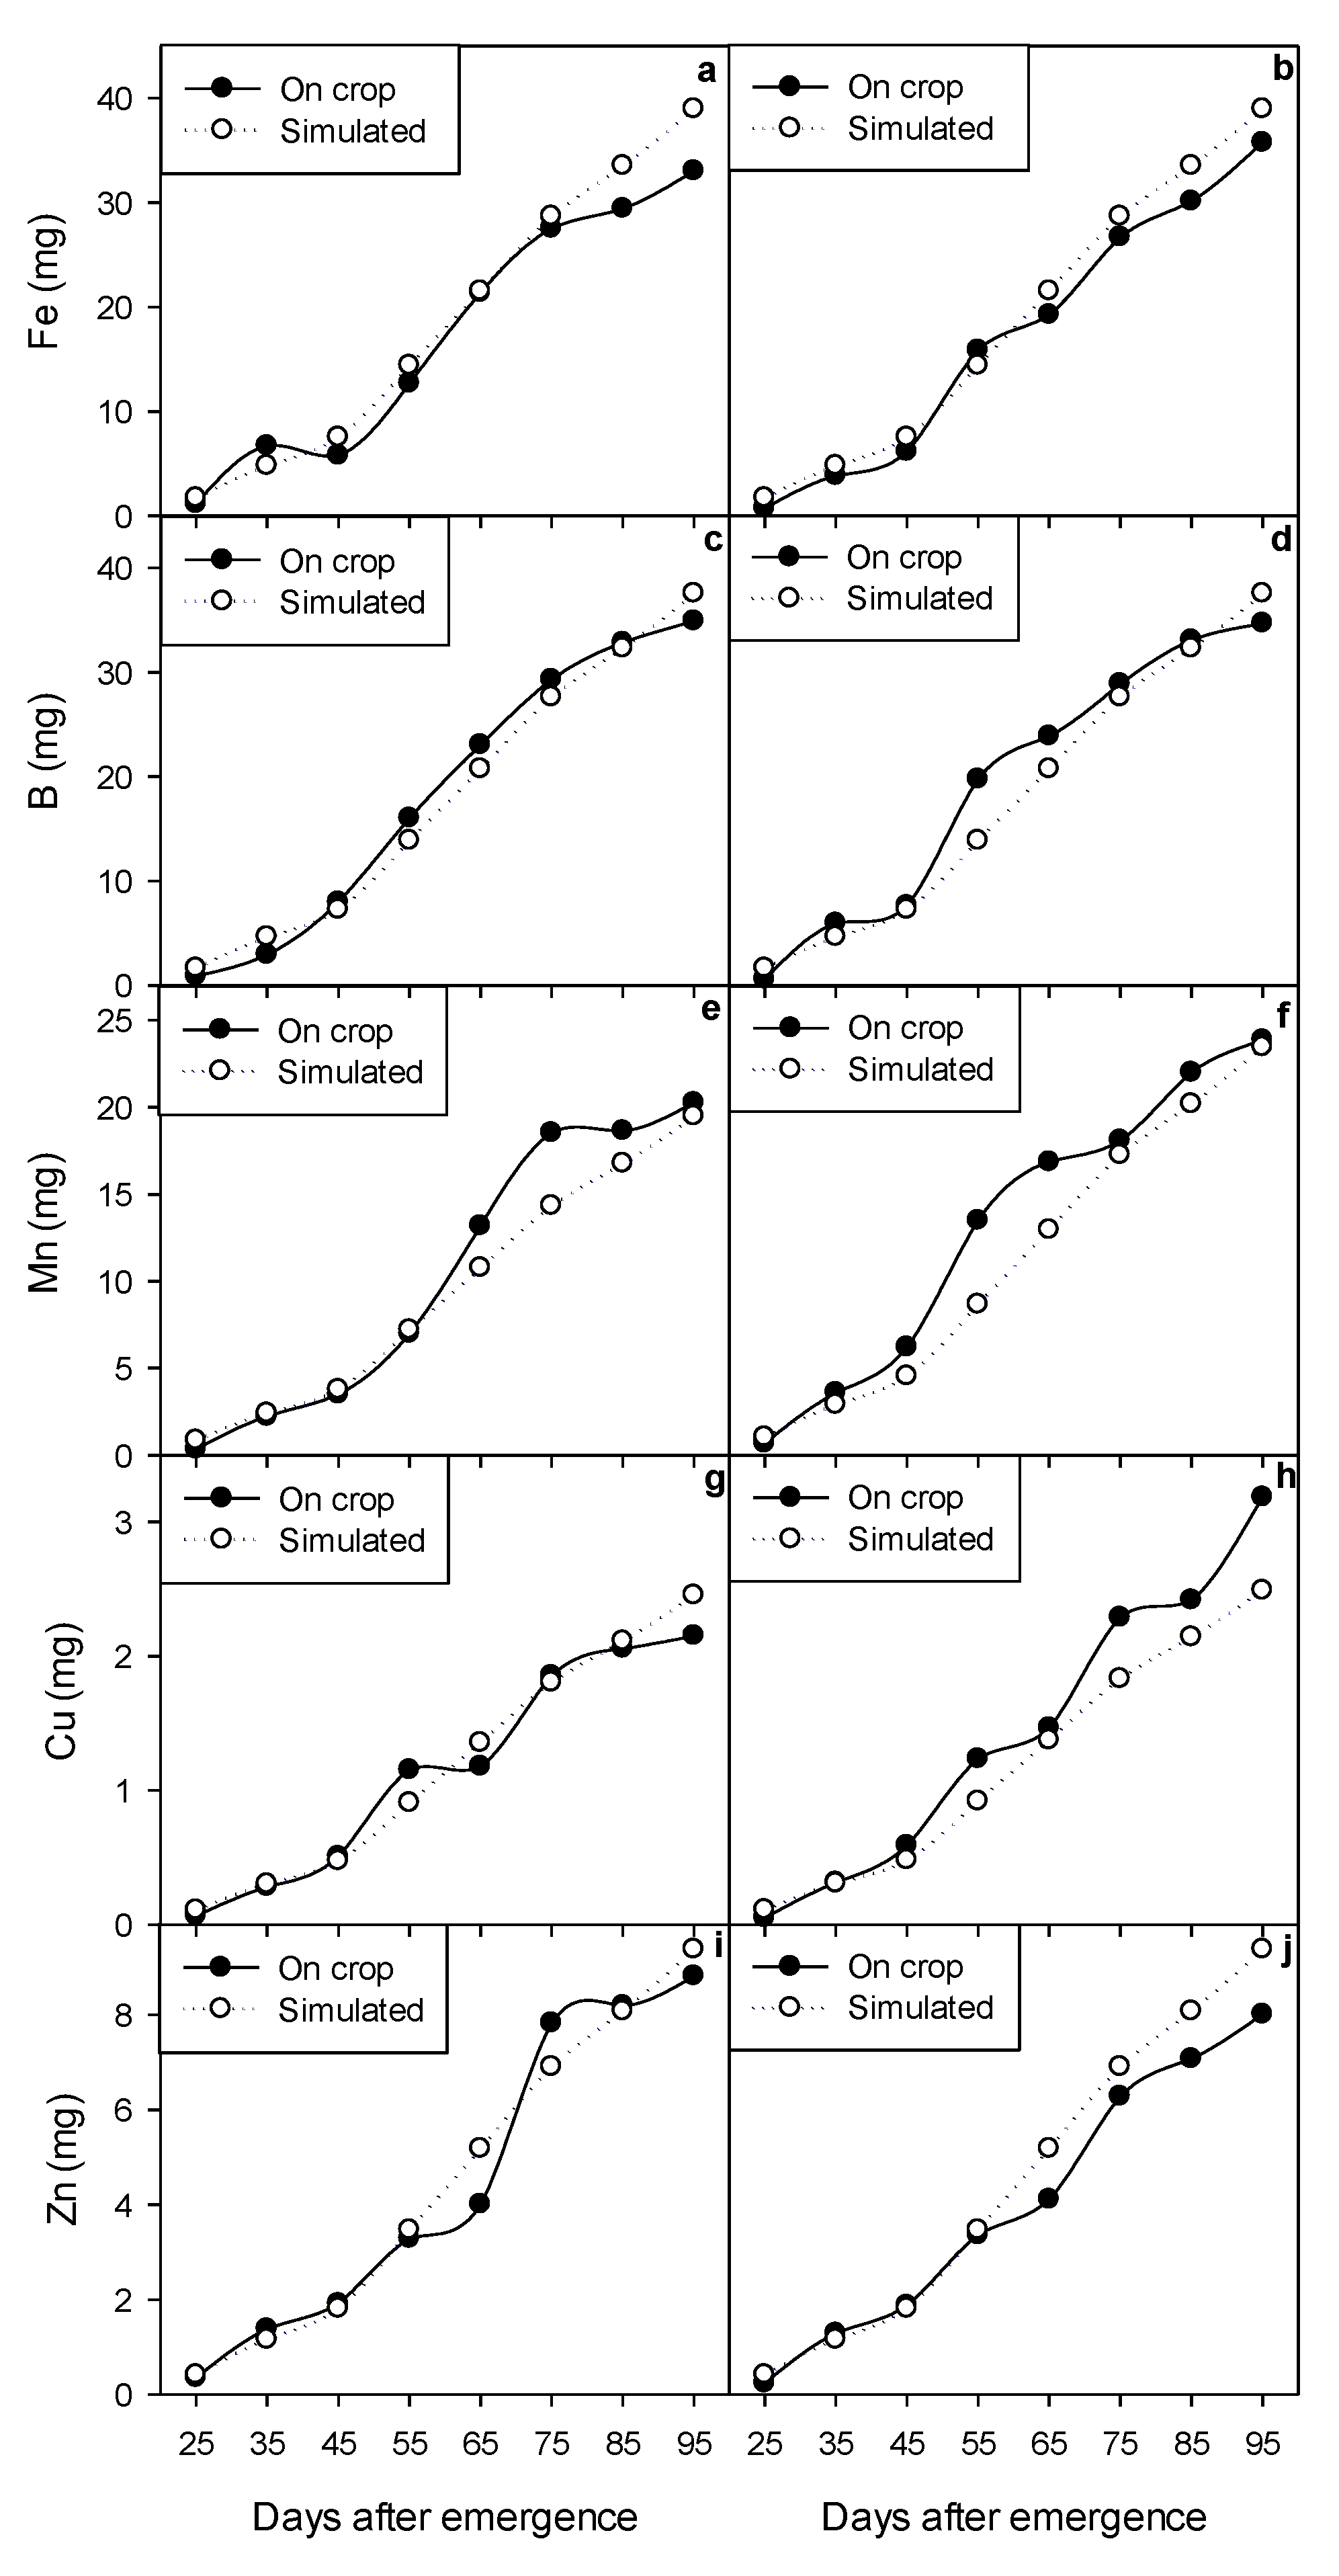
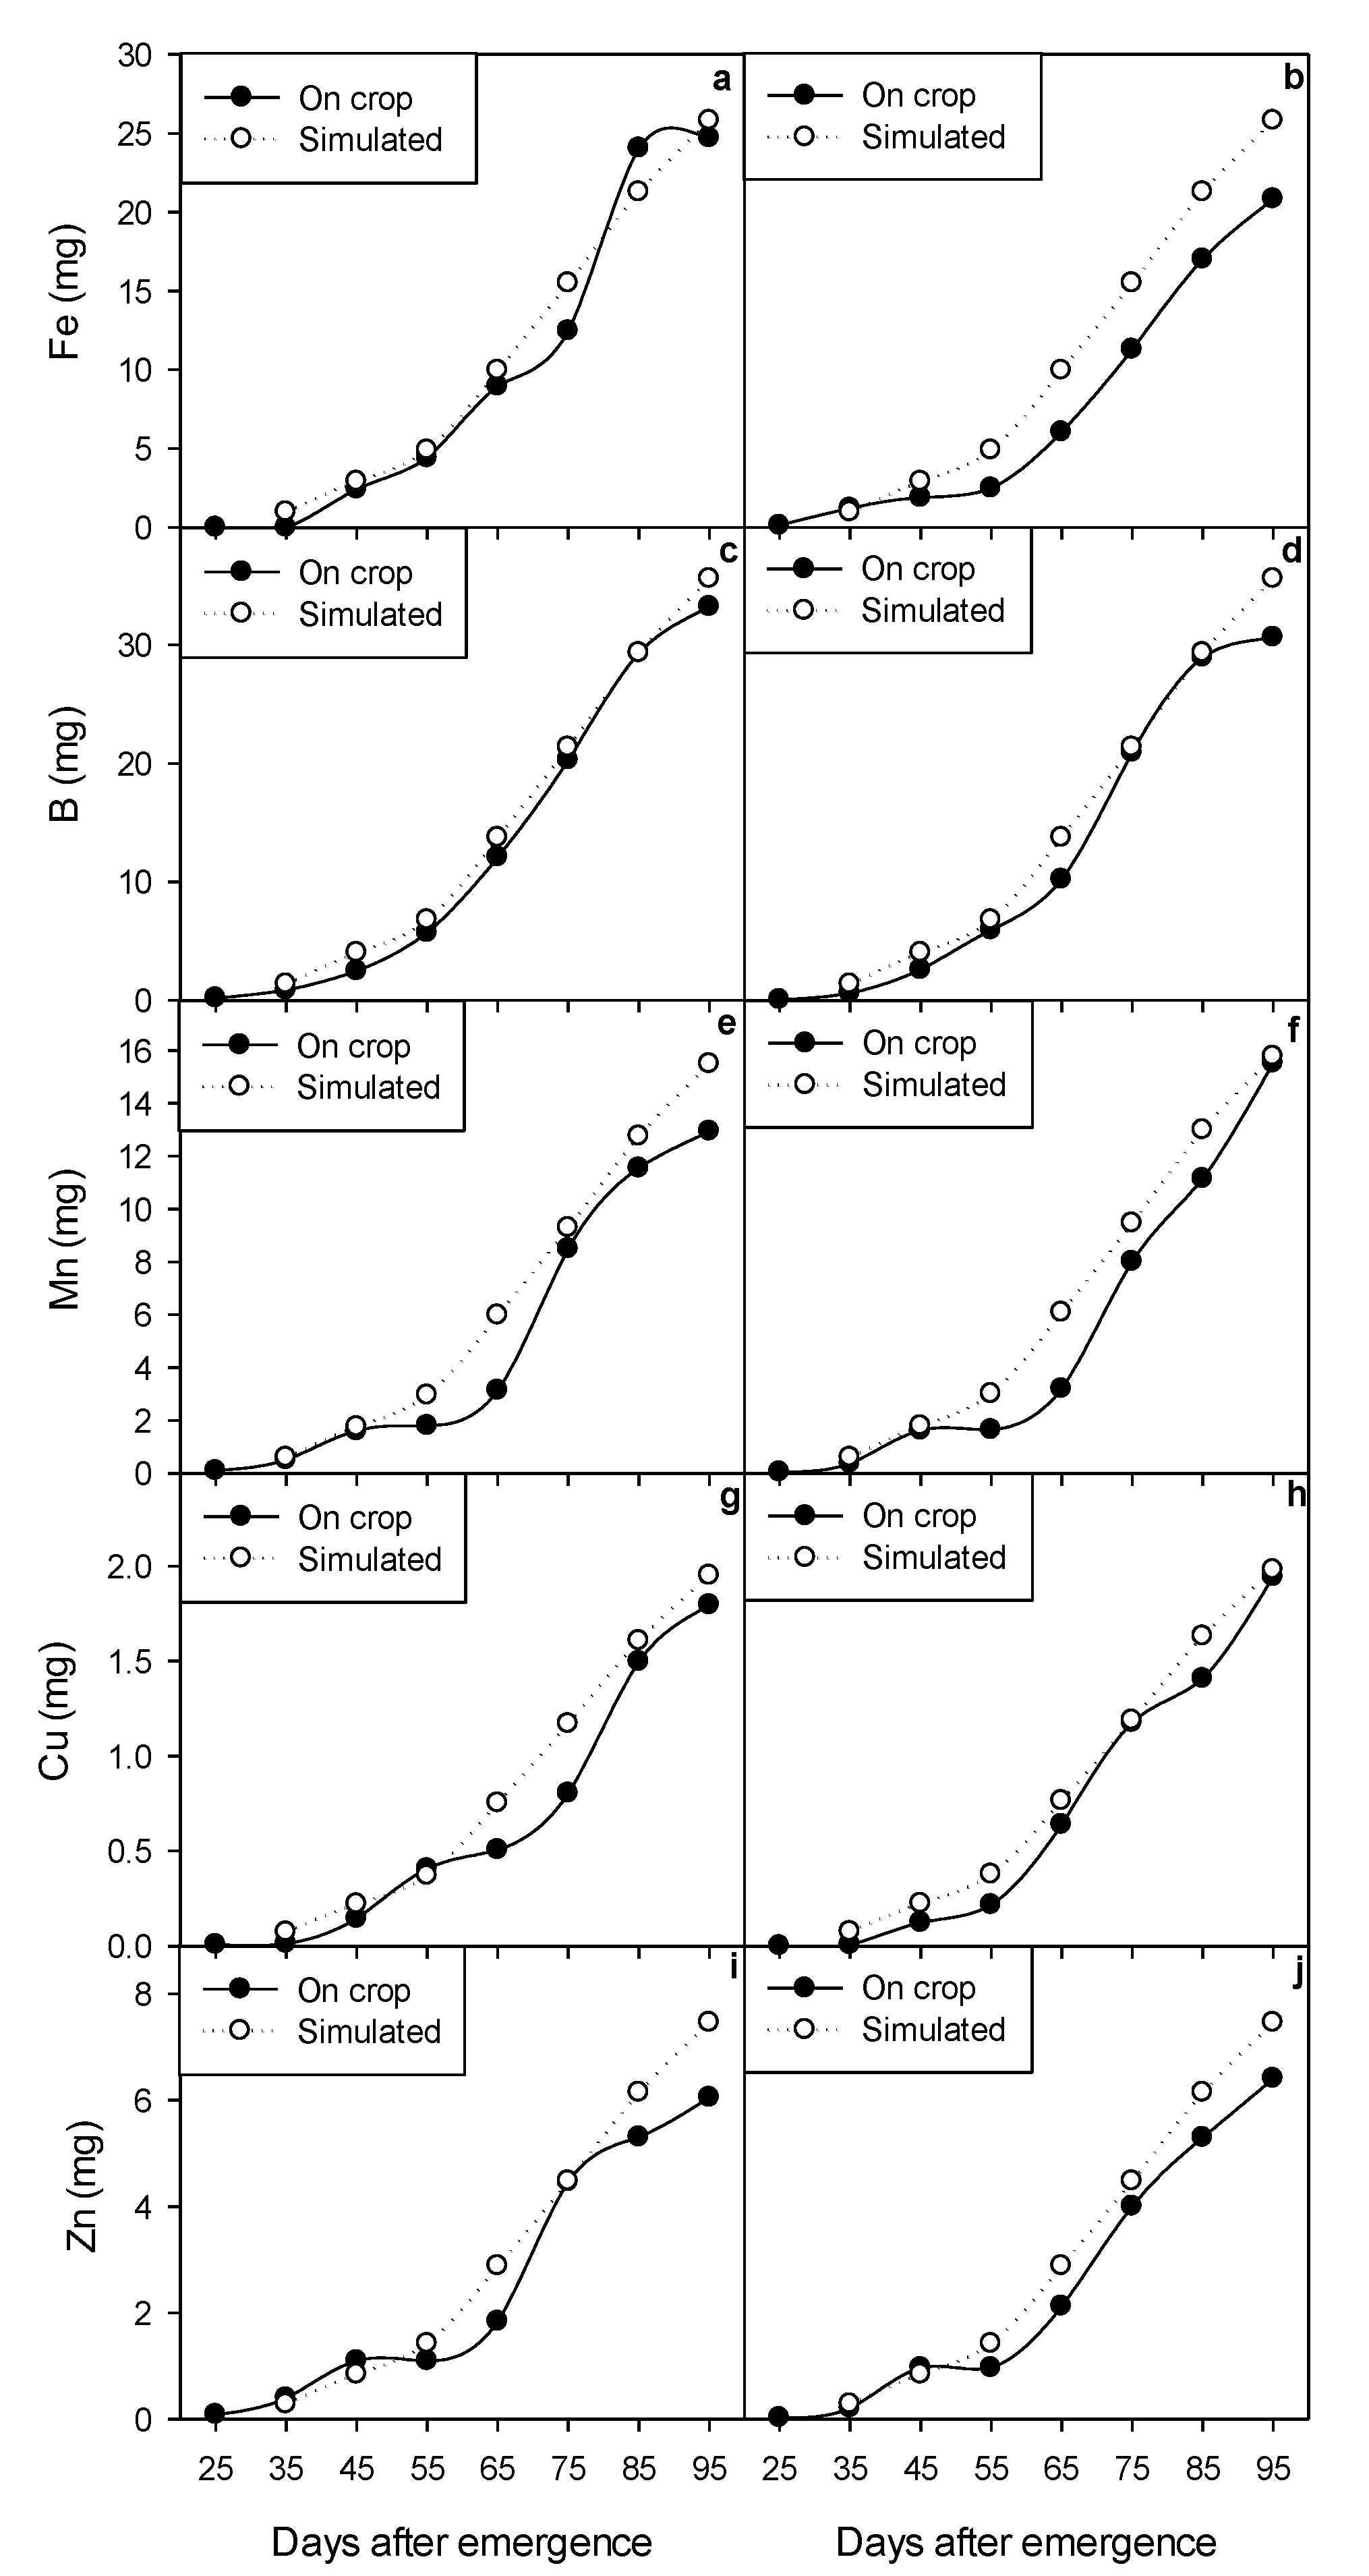
2.3. Micronutrient Accumulation

In Table 1, the concentrations of Fe, B, Mn, Cu, and Zn obtained during the different sampling periods in the two crop cycles (2015 and 2016) for both varieties of cucumber, are shown. The concentration of Fe in the Vitaly variety was maintained between 105.86 ± 25.49 and 106.12 ± 38.45 mg kg−1 of dry weight (DW) during the 2015 and 2016 cycles, respectively. Regarding the Luxell variety, the Fe content was maintained at 100.18 ± 9.11 and 94.82 ± 56 mg kg−1 DW during the 2015 and 2016 cycles, respectively. At the end of both crop cycles, the Fe accumulation was 34 mg and 25 mg per plant in the Vitaly variety, and 36 mg and 21 mg per plant in the Luxell variety. The reduction of Fe accumulation during the 2016 cycle was mainly due to the climatic conditions that prevailed during this cycle, which influenced the reduction in the rate of biomass accumulation. The concentrations of Fe were lower than those reported by Ghehsareh and Samadi [34], Kreij et al. [35], and Patidar et al. [1] as they found concentrations higher than 85 mg per plant. Although there is a high availability of this element in the applied nutrient solution, the plants did not accumulate higher concentrations. This was probably because cucumber plants optimize the use of Fe when the source is chelated [36,37].
The percentage of B was very similar for both varieties of cucumber, showing that for the Vitaly variety the concentration was 101.95 ± 17.1 and 109.27 ± 14.2 mg kg−1 DW, and for the Luxell variety, 116.08 ± 29.8 and 107.37 ± 12.62 mg kg−1 DW during the 2015 and 2016 cycles, respectively. At the end of both cycles, 37 mg and 32 mg B per plant accumulated in the Vitaly variety, and 35 mg and 31 mg B per plant accumulated in the Luxell. The concentration of B observed was 30% less than that reported by Ghehsareh and Samadi [34]. Despite this contrast, no symptoms of deficiency were observed, indicating that the concentrations throughout the growing cycle were within the range suitable for cucumber growth. In addition, the concentration found in this work agreed with that reported by Patidar et al. [1].
The concentration of Mn in the Vitaly variety was maintained between 55.73 ± 12.9 and 48.27 ± 11.6 mg kg−1 DW, and for the Luxell variety, 83.01 ± 14.5 and 50.03 ± 14.2 mg kg−1 DW during the 2015 and 2016 cycles, respectively. At the end of both cycles, 21 mg and 13 mg Mn per plant accumulated in the Vitaly variety, and 24 mg and 16 mg Mn per plant accumulated in the Luxell variety. The accumulation of Mn observed in this work was inferior to that reported by Ghehsareh and Samadi [34]. However, no symptoms of deficiency (chlorosis) were observed. Gopal [38] observed that increasing the concentration of Mn did not generate positive effects, possibly given that the plant will only take the amount of Mn it requires to perform its functions.
The concentration of Cu was maintained at 6.90 ± 1.2 and 5.06 ± 1.6 mg kg−1 DW in the Vitaly variety, and 8.26 ± 1.0 and 4.79 ± 2.3 mg kg−1 DW in the Luxell variety for the 2015 and 2016 cycles, respectively. At the end of both cycles, 3 mg and 2 mg per plant accumulated in the Vitaly variety, and 3.1 mg and 1.9 mg per plant in the Luxell variety. These results were lower than those reported by Ghehsareh and Samadi [34] and Kreij et al. [35] as they reported 5 mg per plant. However, during the experimental development no chlorosis was observed, indicating that the accumulated concentration was sufficient to carry out the physiological processes involving Cu [39], and reported that increasing the concentration of Cu did not show an increase in cucumber yield. This indicates that once the plant has met its needs, it is not necessary to accumulate more Cu in its tissues.
The concentration of Zn was maintained at 27.22 ± 5.1 and 30.16 ± 12.5 mg kg−1 DW in the Vitaly variety and 25.92 ± 4.84 and 27.45 ± 8.6 mg kg−1 DW in the Luxell variety for the 2015 and 2016 cycles, respectively. At the end of both cycles, Zn accumulated 9 mg and 6 mg per plant in the Vitaly variety, and 8 mg and 7 mg per plant in the Luxell variety. The observed Zn concentrations were lower than those reported by Ghehsareh and Samadi [34]. However, no deficiency symptoms were observed, indicating that the ability of plants to control Zn accumulation and avoid toxic effects depends on the plant genotype and that in the absence of high concentrations of Zn in the solution, the plant will activate the absorption channels according to Zn demand [40,41].

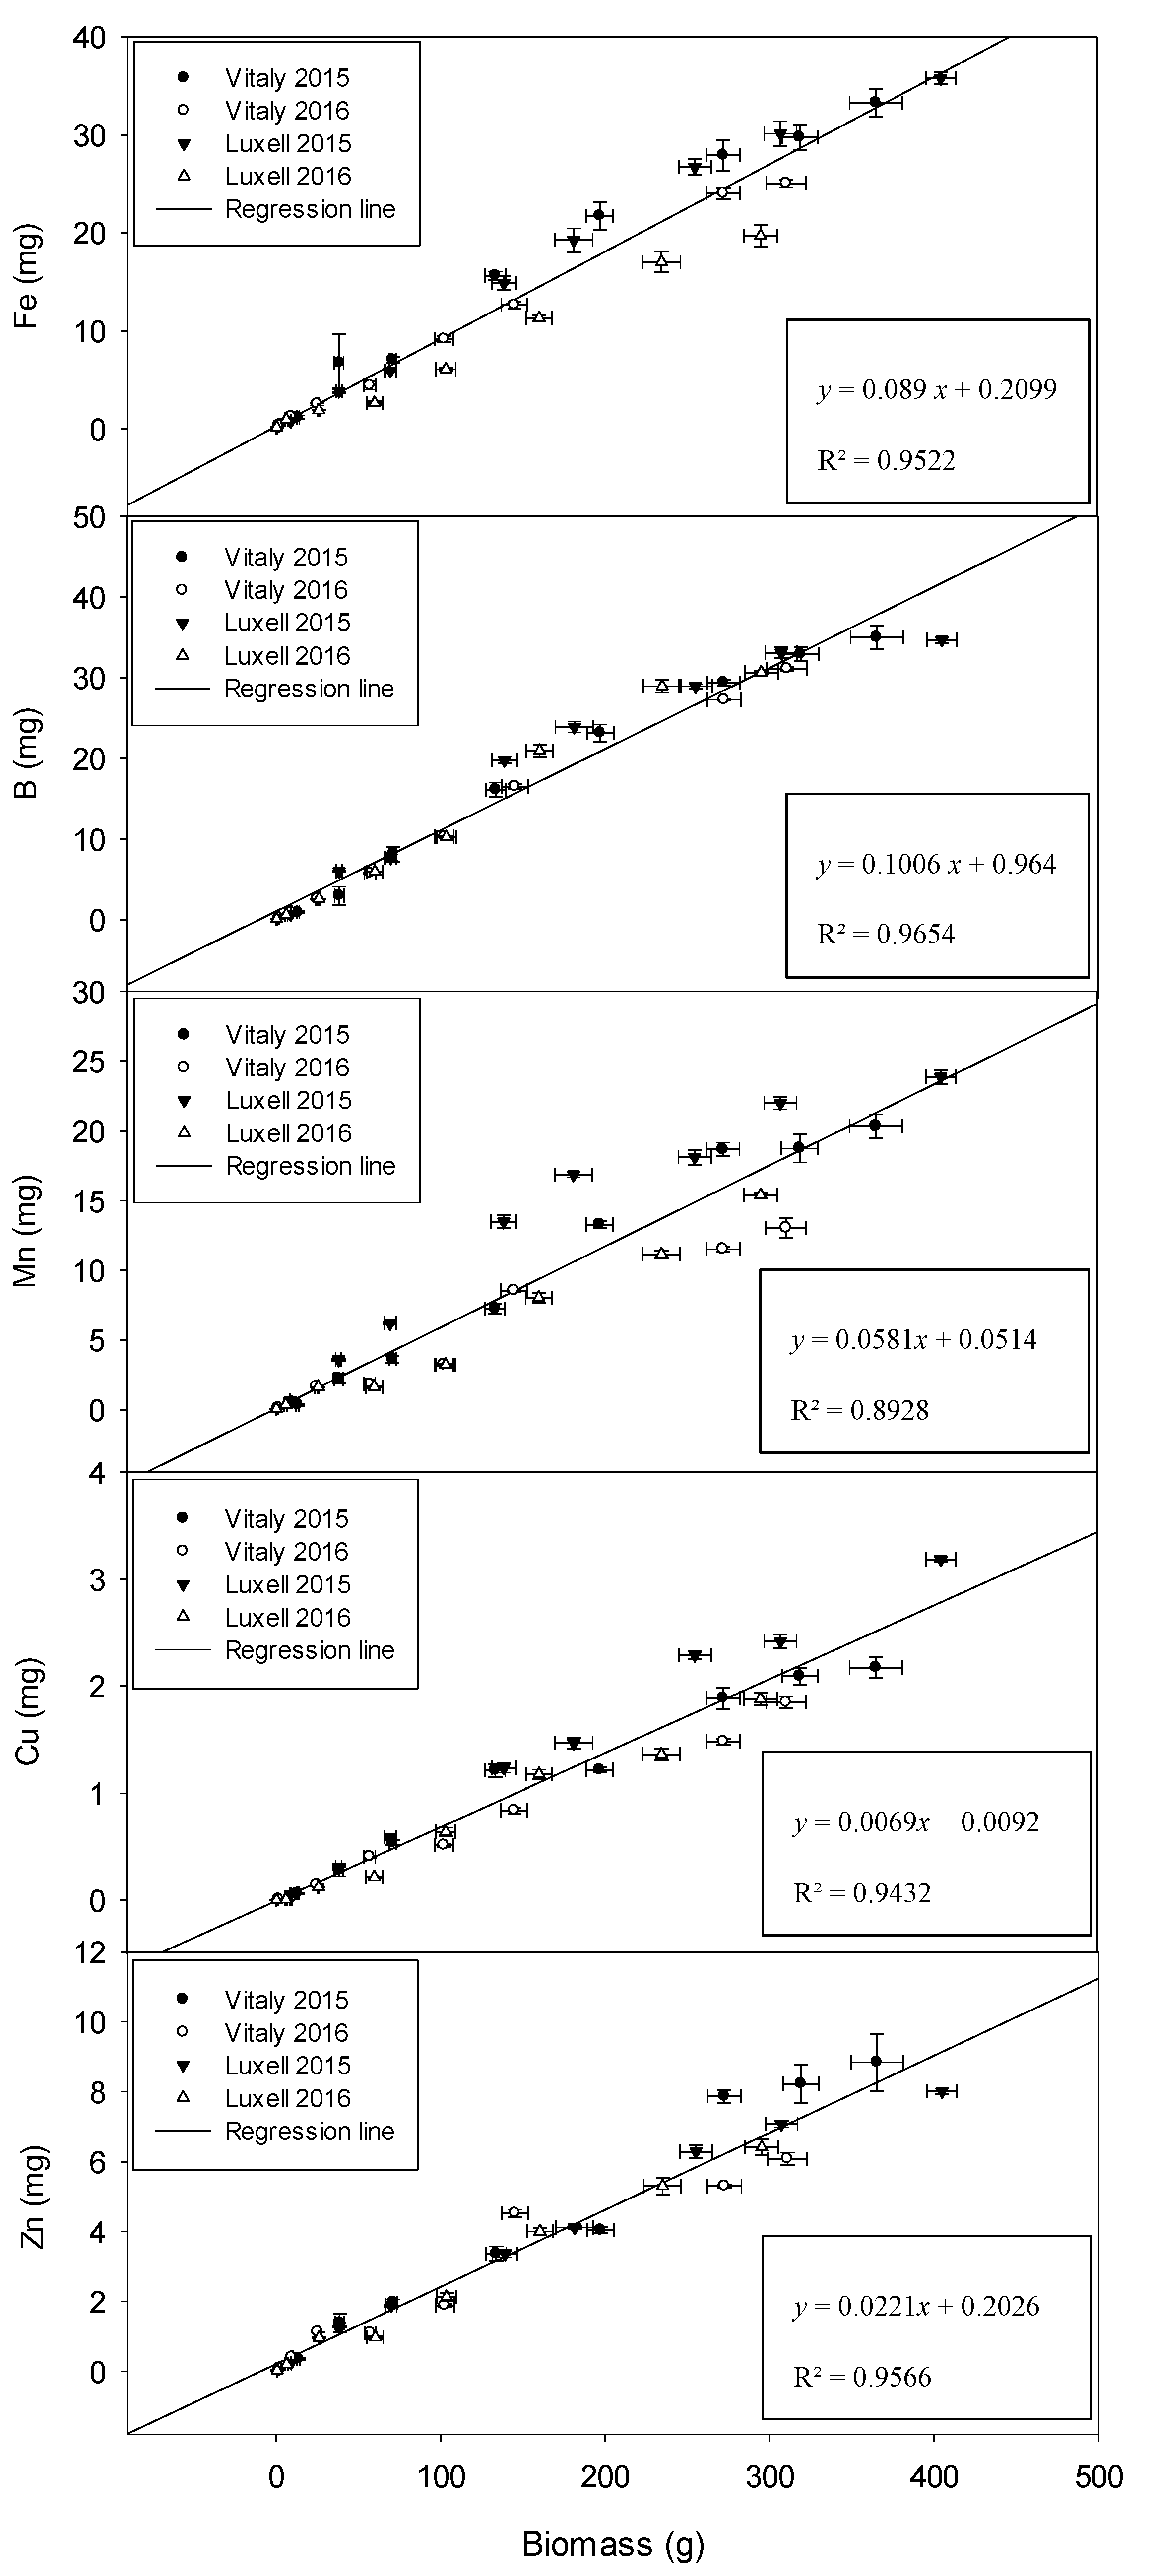
2.4. Relation between Biomass and Micronutrients

Table 2 shows the correlation matrix obtained between the accumulated biomass and the micronutrients Fe, B, Mn, Cu, and Zn accumulated during the 2015 and 2016 cycles. It can be observed that there is a highly significant correlation (r ≥ 0.97) between the accumulation of biomass and the accumulation of all micronutrients. The high correlation observed showed that micronutrient accumulation had a directly proportional relationship to the accumulation of biomass as previously reported in Osvalde [22]. This means that a greater accumulation of biomass will result in a greater accumulation of nutrients by the plant. The accumulation of biomass depends on the photosynthetic activity which in turn is influenced by the climatic conditions. The accumulation of biomass requires the absorption of micronutrients since they are necessary in all physiological processes involved in growth and development [42].
Figure 3 shows the linear relationship between the accumulated micronutrients Fe, B, Mn, Cu, and Zn and the biomass of both the Vitaly and Luxell varieties considering all data. The linear relationship between all micronutrients and biomass were very high with R2 values > 0.94. Although the relationship between Mn and biomass was R2 = 8928, even so, this was a good fit to line. This relationship has also been demonstrated in macronutrients as N and P [23,24]. These results showed that the accumulation of micronutrients is highly dependent on cucumber growth, regardless of the variety or even the climate effects. Therefore, the micronutrient uptake remains constant according to the accumulation of cucumber biomass, as mentioned Osvalde [22]. Considering this relationship, it is possible to estimate the accumulation of micronutrients from biomass accumulation with great precision.

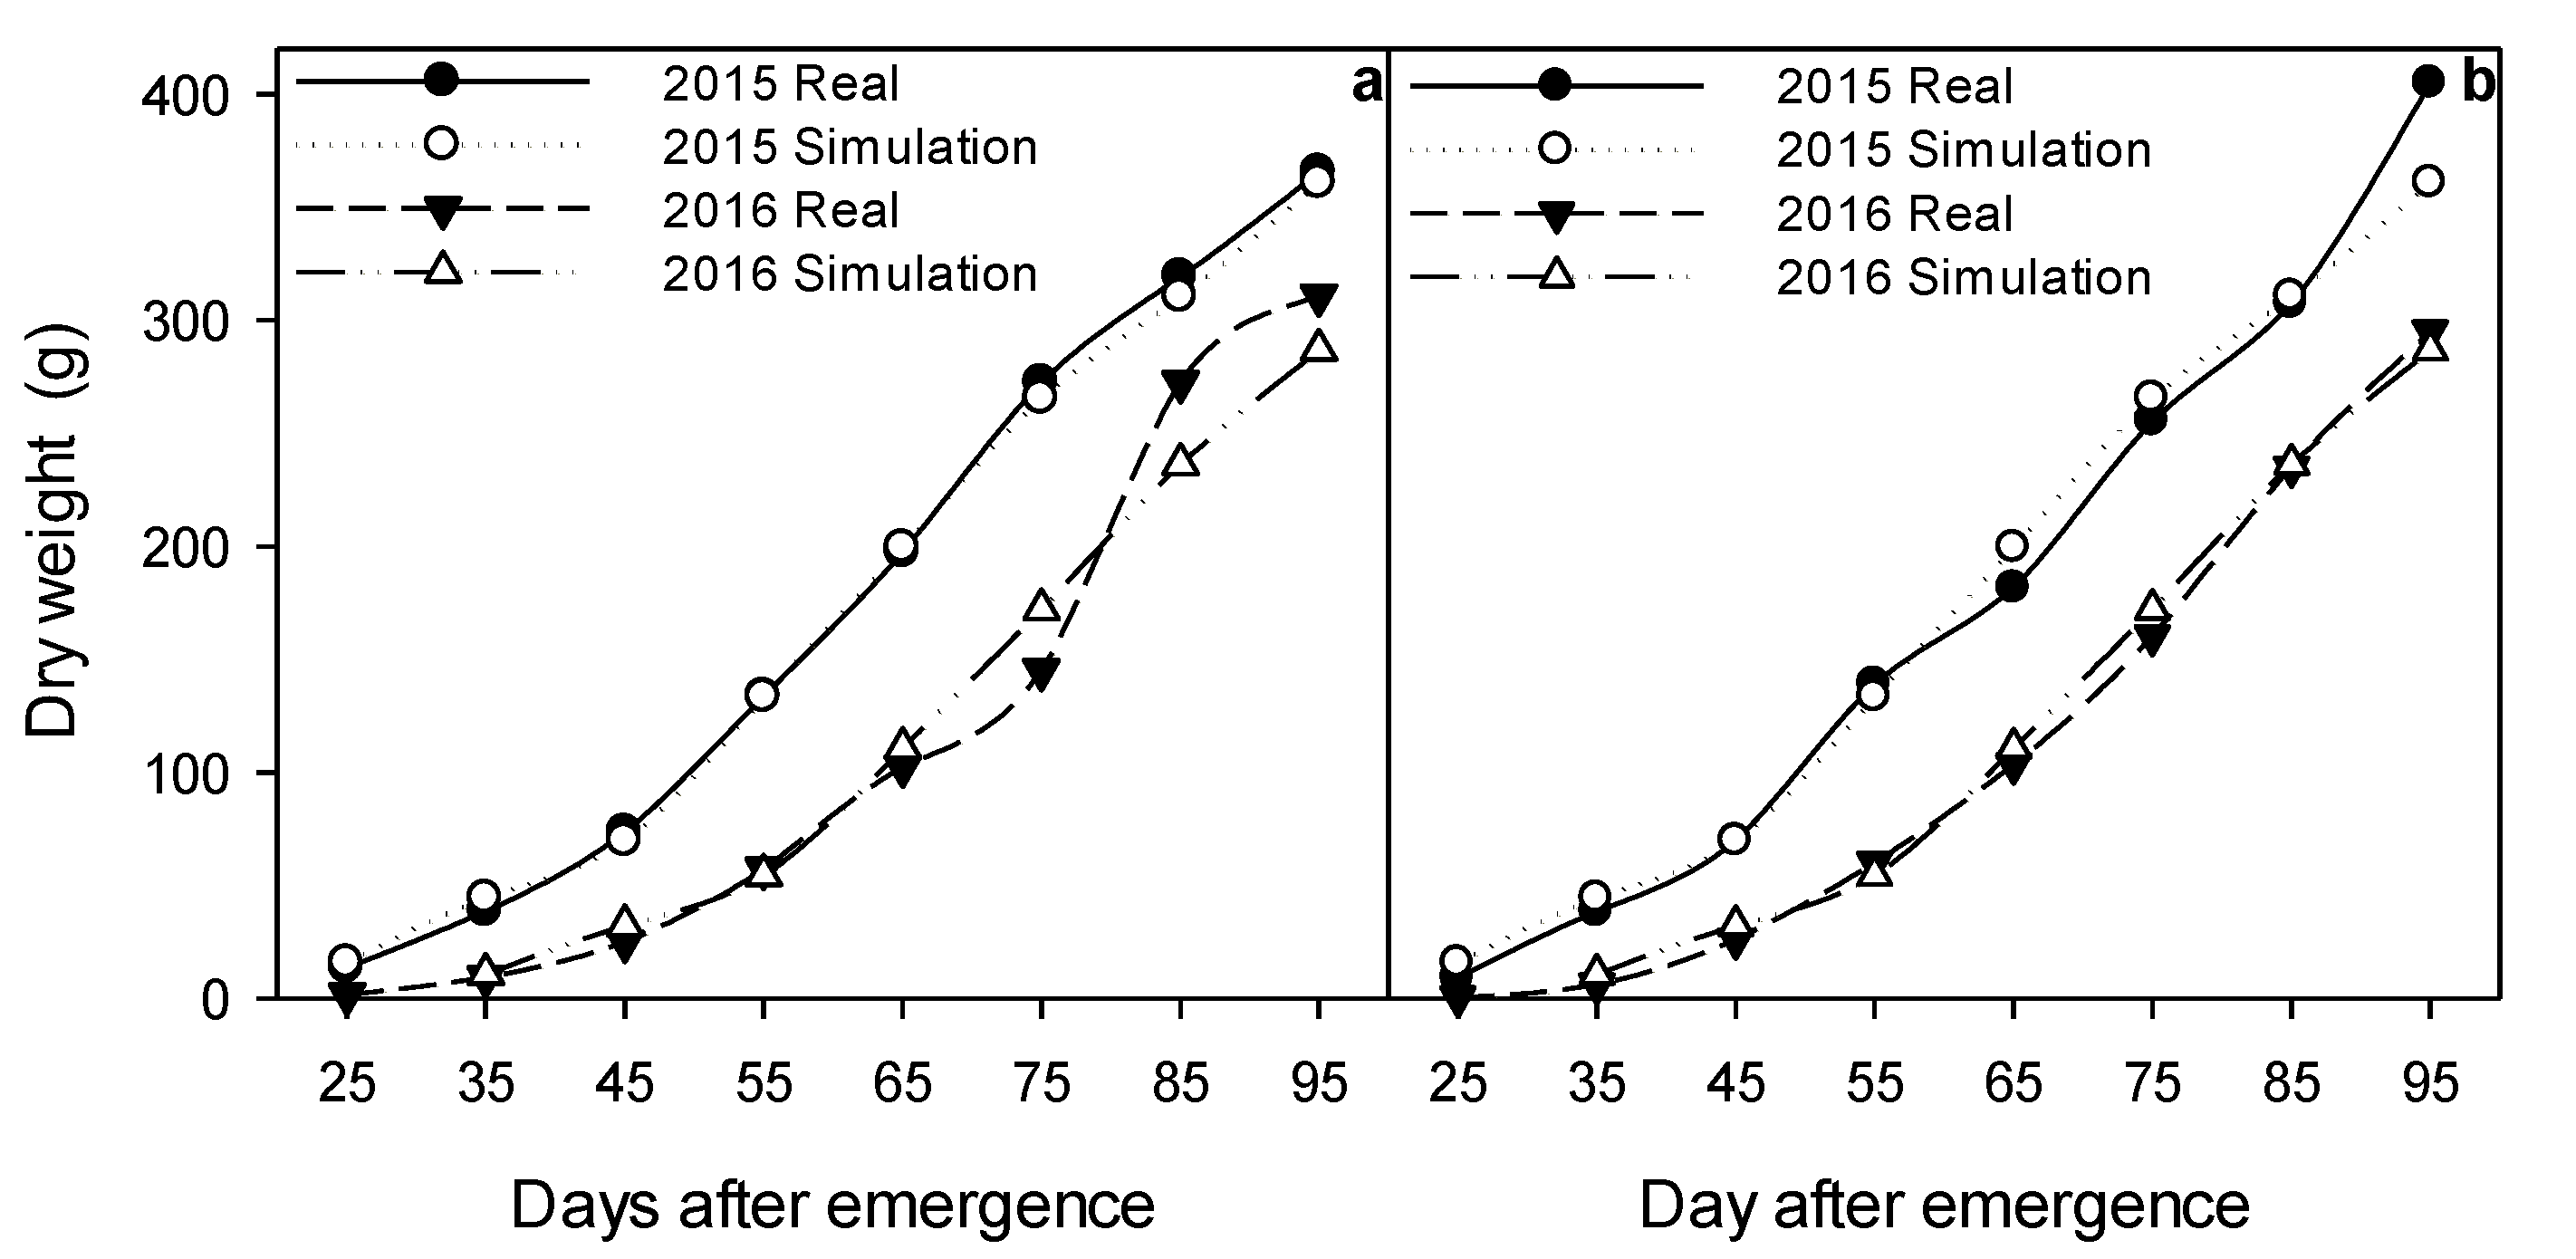
2.5. Dynamic Modeling of Growth and Micronutrient Accumulation

Figure 4 presents the actual data corresponding to the accumulated total biomass and the resulting data of the simulation from the dynamic model. Figure 4a shows data from the Vitaly variety, while Figure 4b shows data from the Luxell variety. In both varieties, R2 values greater than 0.98 (Table 3) were obtained for both calibration and validation, which represents a good fit between the simulated data and the actual data [18]. This demonstrated that the efficiency of crop growth simulation by the dynamic model used was very precise and can be used to predict the accumulation of biomass in the cucumber crop using the climatic variables (PAR, temperature, and concentration of CO2). This is an important feature in dynamic models due to the variability of climatic conditions, where crop growth is also affected [43].
Figure 5 and Figure 6 show the comparison between the actual accumulation of the micronutrients and the simulated output of the dynamic model. For both the calibration (Figure 5) and validation (Figure 6) process, R2 values > 0.97 were observed. According to Wallach [44], a perfect efficiency is equal to 1, so the obtained efficiency was very good. This demonstrated that the dynamic model used could properly simulate the accumulation of micronutrients by cucumber plants. The efficiency indexes observed in this study (Table 3) were similar to those reported by Juárez-Maldonado et al. [18], who obtained an efficiency greater than 0.95 for the accumulation of N, P, K, and S by a tomato crop. Although regression models have been obtained for the accumulation of macro and micronutrients in zucchini, tomato, thistle, and cereals [45,46,47,48] with good efficiency, this work used a dynamic model that considered the climatic variables measured inside the greenhouse (PAR, temperature and CO2 concentration) as input variables, therefore enabling a more robust model for the determination of micronutrient accumulation.
Considering the results found here, it is possible to plan the application of micronutrients (Fe, B, Mn, Cu, and Zn) in cucumber plants under greenhouse conditions more efficiently. This is possible as the accumulation of biomass and therefore the demand of micronutrients, as proposed by Bugarín-Montoya et al. [17], can be quantified per day using the dynamic model. In this way, it is possible to avoid the excess of micronutrients in cucumber plants, while increasing the efficiency in their use.

3. Materials and Methods

3.1. Greenhouse Description

The experiment was carried out in a multi-tunnel greenhouse oriented from north to south, with an area of 392 m2, covered with polyethylene (25% shade) and side windows that were opened and closed manually. The windows were opened in the morning when the temperature of the greenhouse reached 24 °C and closed in the afternoon when the temperature dropped to 18 °C. The greenhouse is located within the facilities of the Universidad Autonoma Agraria Antonio Narro located in Saltillo, Coahuila, Mexico (25°21′ N, 101°01′ W).

3.2. Development of Cucumber Crop

Two cycles of cucumber cultivation were established in the greenhouse during 2015 and 2016. The first cycle started on 1 April and ended on 7 July 2015, while the second cycle was from 1 March to 7 June 2016. The cucumber varieties used in the experiment were Vitaly (Syngenta, Basel, Switzerland) and Luxell (Nunhems, Nunhem, The Netherlands), both of the slicer type. These varieties were selected as they have great performance and quality traits for the international export market. Direct seeding was carried out in 4-L black polyethene bags containing a mixture of peat moss-perlite as a substrate in a 1:1 (v:v) ratio. A seed density of five plants per square meter was implemented with an irrigation system. During the development of both cultures, four irrigations were performed at 9, 12, 15, and 18 h during the day. Irrigation was applied according to each phenological stage of crop, reaching approximately 2.2 L per plant in the higher consumption stages. Nutrients were applied based on Steiner’s nutrient solution [49]. Different concentrations of Steiner’s nutrient solution [49] were used according to the phenological stages of the crop following the nutrient requirements of these: 25% in vegetative growth 1–20 days after emergence (DAE), 50% in flowering (20–30 DAE), and 100% in fruiting (30–95 DAE). The plants were maintained with a single stem by pruning (removing the axillary buds). In addition, the first four flowers were removed, and from the fifth flower on, one for each leaf in the plant was left. Plant growth was limited to 75 days after emergence, eliminating apical growth. At this time, the plants had an average height of 3.5 m.

3.3. Recording Climate Variables

Climatic variables were measured inside the greenhouse during the development of both crop cycles. Sensors were installed 30 cm below growth apex and kept at that height to follow the development of the crop. A photosynthetic active radiation sensor (PAR) (LightScout Quantum Meter 3668I, Spectrum Technologies, Inc., Aurora, IL, USA) and an external temperature sensor (WatchDog External Temperature Sensor 3667-20, Spectrum Technologies, Inc., Plainfield, IL, USA) were connected to a datalogger (WatchDog 1650 Data Logger, Spectrum Technologies, Inc., Plainfield, IL, USA). To measure CO2 concentration in the air, a CO2 sensor (WatchDog A160 Temp/RH/CO2 logger, Spectrum Technologies, Inc., Plainfield, IL, USA) was used. The PAR, temperature and CO2 concentration data were recorded every 15 min.

3.4. Accumulated Biomass

The total accumulated biomass of cucumber crops was determined from the sum of the biomass of each plant organ (fruit, leaf, stem, and root). For this, destructive sampling was performed and the total accumulated biomass was quantified starting at 25 days after emergence, and every 10 days during the development of each crop. Four plants were taken at random and separated into leaves, stems, fruits, and roots. Each organ was dehydrated in a drying oven at a constant temperature of 80 °C for four days to obtain the dry weight. The pruning and harvested fruits were also quantified to obtain the dry weights, and these were added to the weights of the total leaves and fruits.

3.5. Determination of Micronutrient Accumulation

The total micronutrient accumulation (Fe, B, Mn, Cu, and Zn) was determined by the sum of the content of these in each organ (leaf, stem, fruit, and root):
T M A = C M O L + C M O S + C M O F + C M O R
where TMA is the total accumulation of the micronutrient, and CMO is the content of the micronutrient in each organ: leaf (L), stem (S), fruit (F), and root (R). To determine CMO, the dry biomass per plant (DW, kg) and the micronutrient concentration (CM, mg kg−1) of each organ were considered according to Quesada-Roldan and Bertsch-Hernández [46].
C M O = C M D W
CMO is expressed in milligrams (mg), and TMA is expressed in milligrams per plant (mg plant).
The micronutrient concentration in whole plant (MCP) was determined using TMA and the dry weight per plant as follows, and the units are in milligrams per kilogram of dry weight (mg kg−1 DW):
M C P = T M A D W
The determination of the micronutrients started 25 days after emergence, and every 10 days during the development of the crop. Quantification of Fe, B, Mn, Cu, and Zn was performed on an Inductively Coupled Plasma (Optima 8300 ICP-OES, PerkinElmer, Inc., Waltham, MA, USA). For this process, one gram of each sample was digested with HNO3 and H2O2 at 400 °C following the standard method.

3.6. Description of the Dynamic Model

The dynamic tomato growth model proposed by Tap [43] and adapted by Juárez-Maldonado et al. [18] was used. This model starts at the flowering stage and consists of six state variables: mass balance for the buffer of assimilates (B), dry fruit weight (WF), leaf dry weight (WL), plant development (DP), dry weight of fruit harvest (WHF), and dry weight of harvested leaves (WHL). The full description of the model is presented in Juárez-Maldonado et al. [18].
Climate variables measured inside the greenhouse (temperature, PAR, and concentration of CO2) were used as input variables for the model. The dry weight of leaves (g), the dry weight of fruits (g), the dry weight of harvested leaves (g), the dry weight of harvested fruits (g), and total biomass (g) were the output variables according to Juárez-Maldonado et al. [18]. As the growth and accumulation of biomass in cucumber fruits is greater than that of the tomato, a harvest parameter for cucumber fruit (yFc) was incorporated to the WHF in the model adapted by Juárez-Maldonado et al. [18] as follows:
W HF =   h F W F y F c
where hF is the fruit harvest coefficient function; and yFc represents a proportion of total fruit weight in relation to total leaf weight.
To determine the accumulation of micronutrients by cucumber plants as a function of crop growth in the dynamical model, a linear relationship between them was considered. To verify this, a correlation analysis was performed between the accumulation of Fe, B, Mn, Cu, and Zn with the total biomass at each sampling moment. Furthermore, the linear adjustment between Fe, B, Mn, Cu, and Zn accumulated and the amount of biomass was verified. The Pearson correlation coefficient and linear adjustment were obtained using the SigmaPlot© 12.0 program. Based on this linear relationship, the average content of each micronutrient (Fe, B, Mn, Cu, and Zn) (Table A1 in Appendix A) was used throughout the development of the crop and the total biomass (Equation (5)).
T A M = B T A C M
where TAM is the total accumulation of each micronutrient for a given time; BT is the total biomass of a plant for the corresponding time (kg); and ACM is the average content of the micronutrient based on dry weight (mg kg−1). This applies when there is no nutrient limitation since the concentration of each micronutrient in the plant is equal to its demand [7,21]. Equation (5) was added to the growth model to simulate the accumulation of each micronutrient by the cucumber plants.

3.7. Calibration and Validation of the Dynamic Model

The calibration of the model consisted of fine tuning parameters to obtain a good fit between the simulated and real data [18]. The dynamic model was calibrated for the accumulation of crop biomass as well as for micronutrient accumulation (Fe, B, Mn, Cu, and Zn). This process was carried out during the 2015 cycle using the climatic variables measured inside the greenhouse (PAR, temperature, and concentration of CO2) as the inputs of the dynamic model. Table A1 in Appendix A shows the complete list of the nominal and calibrated parameter values of the dynamic model.
The validation of the dynamic model was through a process that compared the simulated data to the real data and the adjustment between them was verified [18]. To validate the dynamic model, the climatic variables measured inside the greenhouse corresponding to the second crop cycle (year 2016) were taken as model inputs. After the simulation, the model outputs were compared with the actual data obtained from the second cycle of cucumber cultivation (biomass and micronutrient accumulation).
To evaluate the fit between the simulated data and the actual data in the calibration and validation of the dynamic model, the “EF” and “Index” indices proposed by Wallach et al. [44], described below, were used.
EF = 1 i = 1 N ( Y i Y ˇ i ) 2 i = 1 N ( Y i Y ˇ ) 2
Index = 1 i = 1 N ( Y i Y ˇ i ) 2 i = 1 N ( | Y i Y ˇ | ) + ( | Y i Y ˇ | ) 2
where Y i is a value measured at moment i; and Y ˇ i is the corresponding value calculated by the model. These values vary between 0 and 1, where 1 is considered the perfect efficiency. A R2 value of 0.98 was used to consider a model as calibrated. For validation, a R2 value of 0.95 was considered a very good fit as per Juárez-Maldonado et al. [18] given that a value of 1 represents a perfect fit between the simulated and actual data [44].

4. Conclusions

Changes in the climatic conditions recorded inside the greenhouse directly influenced the accumulation of biomass by the cucumber plants. When the PAR and temperature decreased, the total biomass accumulation also decreased.
The accumulation of micronutrients by cucumber plants was directly proportional to the accumulation of biomass. Therefore, the accumulation of micronutrients was also directly influenced by changes in the climatic conditions recorded inside the greenhouse.
The dynamical model used simulated both the accumulation of biomass and the accumulation of micronutrients by the cucumber plants with great precision, since the indexes used presented values higher than 0.95.
The dynamic model used in this study can be used as a practical tool for planning the management of cucumber cultivation in greenhouses. In addition, from this model, it is possible to determine the micronutrient requirements (Fe, B, Mn, Cu, and Zn) of the cucumber plants, which allows a more adequate management of their application.

Acknowledgments

UAAAN Proyecto interno 38111-425104001-2113: “Manejo nutricional del pimiento (Capsicum annuum L.) en invernadero basado en modelos matemáticos.”

Author Contributions

A.J.-M. and A.B.-M.conceived and designed the experiments; L.J.R.-P. and A.B.M.-D. performed the analysis of laboratory and field experiments; S.G.-M. and K.d.A.-R. contributed reagents and materials. All authors were responsible for processing information and manuscript writing. All authors read and approved the final manuscript.

Conflicts of Interest

The authors declare no conflict of interest.

Appendix A

Table A1. Description of model parameters, nominal value and calibrated value.
ParametersNominal Value Calibrated ValueUnitsDescription
b12.7 m2 g−1Coefficient of the change buffer function
d12.13 × 10−75.9332 × 10⁻⁷s−1Growth Rate Parameter
d22.47 × 10−75.4664 × 10⁻⁷s−1Growth Rate Parameter
d320 °CGrowth Rate Parameter
d47.50 × 10−113.46 × 10⁻¹³-Growth Rate Parameter
F1.21.5-Ratio of assimilated fruit requirements
f18.10 × 10−76.1 × 10⁻⁶s−1Fruit growth rate coefficient
f24.63 × 10−6 s−1Fruit growth rate coefficient
M2.511 -Correction-LAI function parameter
mF1.157 × 10−71.5 × 10⁻⁶s−1Breathing coefficient of maintenance of the fruit
mL2.894 × 10−72.89 × 10⁻⁹s−1Breathing coefficient of vegetative maintenance
p3577 W m2Net photosynthesis parameter
p4221 g s−1 m−2Net photosynthesis parameter
Pm2.25 × 10−32.6 × 10⁻³g s−1 m−2Maximum photosynthesis
QG1 -Temperature of the rate of growth of the fruit
QR2 -Respiration maintenance
T86,400 SWeather
TG20 °CReference temperature of the growth rate
TR25 °CReference temperature for maintenance breath
V1.232.23-Ratio of requirements of vegetative assimilates
v11.37740.45-Relationship of growth vegetative fruit
v2−0.168 °C−1Relationship of growth vegetative fruit
v31920°CRelationship of growth vegetative fruit
WR32.23 g m−2Parameter of the LAI correction function
yF0.59831.05-Parameter of the fruit harvest coefficient
yFc 5.3g m−2Parameter of cucumber fruit harvest
yL0.59830.35-Leaf Harvest Coefficient Parameter
z0.6081 -Fraction of vegetative dry weight leaf
Fe 108mg kg−1Average content of Fe on dry matter base
B 104mg kg−1Average content of B on dry matter base
Mn 54mg kg−1Average content of Mn on dry matter base
Cu 6.8mg kg−1Average content of Cu on dry matter base
Zn 26mg kg−1Average content of Zn on dry matter base

References

  1. Patidar, D.K.; Maurya, I.B.; Singh, P. Effect of micronutrients on yield and economics of gynoecious cucumber (Cucumis sativus L.) var Kian under naturally-ventilated polyhouse. Int. J. Farm Sci. 2017, 7, 29–32. [Google Scholar]
  2. USDA, United States Deparment of Agriculture. Vegetables and Outlook. Available online: http://usda.mannlib.cornell.edu/MannUsda/viewDocumentInfo.do?documentID=1401 (accessed on 11 August 2017).
  3. Hao, H.; Wei, Y.; Yang, X.; Feng, Y.; Wu, C. Effects of different nitrogen fertilizer levels on Fe, Mn, Cu and Zn concentrations in shoot and grain quality in rice (Oryza sativa). Rice Sci. 2007, 14, 289–294. [Google Scholar] [CrossRef]
  4. Hanjagi, P.S.; Singh, B. Interactive regulation of iron and zinc nutrition in wheat (Triticum aestivum L.). Indian J. Plant Physiol. 2017, 22, 70–78. [Google Scholar] [CrossRef]
  5. Fan, Z.; Lin, S.; Zhang, X.; Jiang, Z.; Yang, K.; Jian, D.; Chen, Y.; Li, J.; Chen, Q.; Wang, J. Conventional flooding irrigation causes an overuse of nitrogen fertilizer and low nitrogen use efficiency in intensively used solar greenhouse vegetable production. Agric. Water Manag. 2014, 144, 11–19. [Google Scholar] [CrossRef]
  6. Wang, C.; Gu, F.; Chen, J.; Yang, H.; Jiang, J.; Du, T.; Zhang, J. Assessing the response of yield and comprehensive fruit quality of tomato grown in greenhouse to deficit irrigation and nitrogen application strategies. Agric. Water Manag. 2015. [Google Scholar] [CrossRef]
  7. Marcelis, L.F.M.; Brajeul, E.; Elings, A.; Garate, A.; Heuvelink, E.; de Visser, P.H.B. Modelling nutrient uptake of sweet pepper. Acta Hortic. 2005, 691, 285–292. [Google Scholar] [CrossRef]
  8. Du, T.; Kang, S.; Zhang, X.; Zhang, J. China’s food security is threatened by the unsustainable use of water resources in North and Northwest China. Food Energy Secur. 2013, 3, 7–18. [Google Scholar] [CrossRef]
  9. Cao, J.; Lee, J.; Six, J.; Yan, Y.; Zhang, F.; Fan, M. Changes in potential denitrification-derived N2O emissions following conversion of grain to greenhouse vegetable cropping systems. Eur. J. Soil Biol. 2015, 68, 94–100. [Google Scholar] [CrossRef]
  10. Alaoui-Sossé, B.; Genet, P.; Vinit-Dunand, F.; Toussaint, M.L.; Epron, D.; Badot, P.M. Effect of copper on growth in cucumber plants (Cucumis sativus) and its relationships with carbohydrate accumulation and changes in ion contents. Plant Sci. 2004, 166, 1213–1218. [Google Scholar] [CrossRef]
  11. Briat, J.F.; Ravet, K.; Arnaud, N.; Duc, C.; Boucherez, J.; Touraine, B.; Cellier, F.; Gaymard, F. New insights into ferritin synthesis and function highlight a link between iron homeostasis and oxidative stress in plants. Ann. Bot. 2010, 105, 811–822. [Google Scholar] [CrossRef] [PubMed]
  12. Aravind, P.; Prasad, M.N.V. Zinc protects chloroplasts and associated photochemical functions in cadmium exposed Ceratophyllum demersum L., a freshwater macrophyte. Plant Sci. 2004, 166, 1321–1327. [Google Scholar] [CrossRef]
  13. Goussias, C.; Boussac, A.; Rutherford, A.W. Photosystem II and photosynthetic oxidation of water: An overview. Philos. Trans. R. Soc. Lond. B Biol. Sci. 2002, 357, 1369–1420. [Google Scholar] [CrossRef] [PubMed]
  14. Millaleo, R.; Reyes-Diaz, M.; Ivanov, A.G.; Mora, M.L.; Alberdi, M. Manganese as essential and toxic element for plants: Transport, accumulation and resistance mechanisms. J. Soil Sci. Plant Nutr. 2010, 10, 470–481. [Google Scholar] [CrossRef]
  15. Broadley, M.; Brown, P.; Cakmak, I.; Rengel, Z.; Zhao, F. Function of Nutrients: Micronutrients. In Mineral Nutrition of Higher Plants; Marschner, P., Ed.; Academic Press: Amsterdam, The Netherlands, 2012; pp. 191–248. [Google Scholar]
  16. Enriquez-Reyes, S.A.; Alcántar-González, G.; Castellanos-Ramos, J.Z.; Suárez, E.A.; González-Eguiarte, D.; Lazcano-Ferrat, I. Mineral Nutrición mineral acoplada al crecimiento (NUMAC): Nutrición con n para tomate en invernadero 3. Evaluación del Modelo. Terra Latinoam. 2003, 21, 167–175. [Google Scholar]
  17. Bugarín, M.; Galvis, S.; Sánchez, G.; García, P. Acumulación diaria de materia seca y de potasio en la biomasa aerea total de tomate. Terra Latinoam. 2002, 20, 401–409. [Google Scholar]
  18. Juárez-Maldonado, A.; Benavides-Mendoza, A.; de-Alba-Romenus, K.; Morales-Díaz, A.B. Dynamic modeling of mineral contents in greenhouse tomato crop. Agric. Sci. 2014, 5, 114–123. [Google Scholar] [CrossRef]
  19. Bar-Yosef, B.; Fishman, S.; Kläring, H.P. A model-based decision support system for closed irrigation loop greenhouses. Acta Hortic. 2004, 654, 107–122. [Google Scholar] [CrossRef]
  20. López-Cruz, I.L.; Ramírez-Arias, A.; Rojano-Aguilar, A. Modelos matemáticos de hortalizas en invernadero: Trascendiendo la contemplación de la dinámica de cultivos. Rev. Chapingo Ser. Hortic. 2005, 11, 257–267. [Google Scholar] [CrossRef]
  21. Kiba, T.; Krapp, A. Plant nitrogen acquisition under low availability: Regulation of uptake and root architecture. Plant Cell Physiol. 2016, 57, 707–714. [Google Scholar] [CrossRef] [PubMed]
  22. Osvalde, A. Optimization of plant mineral nutrition revisited: The roles of plant requirements, nutrient interactions, and soil properties in fertilization management. Environ. Exp. Biol. 2011, 9, 1–8. [Google Scholar]
  23. Zhu, L.; Li, Z.; Ketola, T. Biomass accumulations and nutrient uptake of plants cultivated on artificial floating beds in China’s rural area. Ecol. Eng. 2011, 37, 1460–1466. [Google Scholar] [CrossRef]
  24. Liu, J.; Qiu, C.; Xiao, B.; Cheng, Z. The role of plants in channel-dyke and field irrigation systems for domestic wastewater treatment in an integrated eco-engineering system. Ecol. Eng. 2000, 16, 235–241. [Google Scholar] [CrossRef]
  25. Marcelis, L.F.M.; Heuvelink, E.; Goudriaan, J. Modelling biomass production and yield of horticultural crops: A review. Sci. Hortic. 1998, 74, 83–111. [Google Scholar] [CrossRef]
  26. Sakurai, G.; Yamaji, N.; Mitani-Ueno, N.; Yokozawa, M.; Ono, K.; Ma, J.F. A model of silicon dynamics in rice: An analysis of the investment efficiency of Si transporters. Front. Plant Sci. 2017, 8, 1–11. [Google Scholar] [CrossRef] [PubMed]
  27. Rao, L.J.; Mittra, B.N. Growth and yield of peanut as influenced by degree and duration of shading. J. Agron. Crop Sci. 1988, 160, 260–265. [Google Scholar] [CrossRef]
  28. Alsadon, A.; Al-Helal, I.; Ibrahim, A.; Abdel-Ghany, A.; Al-Zaharani, S.; Ashour, T. The effects of plastic greenhouse covering on cucumber (Cucumis sativus L.) growth. Ecol. Eng. 2016, 87, 305–312. [Google Scholar] [CrossRef]
  29. Krizek, D.T. Influence of PAR and UV-A in determining plant sensitivity and photomorphogenic responses to UV-B radiation. Photochem. Photobiol. 2004, 79, 307–315. [Google Scholar] [CrossRef] [PubMed]
  30. Haque, M.M.; Hasanuzzaman, M.; Rahman, M.L. Morpho-physiology and yield of cucumber (Cucumis sativa) under varying light intensity. Acad. J. Plant Sci. 2009, 2, 154–157. [Google Scholar]
  31. Falk, S.; Maxwell, D.P.; Laudenbach, D.E.; Huner, N.P. Photosynthetic adjustment to temperature. In Photosynthesis and the Environment; Baker, N.R., Ed.; Kluwer Academic Publishers: Dordrecht, The Netherlands, 1996; pp. 36–385. [Google Scholar]
  32. Li, H.; Min, X.; Chen, L.; Jalal, G.; Jian, X.; Shi, K.; Considine, M.J.; Quan, J.; Hong, Y. Plant Physiology and Biochemistry Growth temperature-induced changes in biomass accumulation, photosynthesis and glutathione redox homeostasis as in fluenced by hydrogen peroxide in cucumber. Plant Physiol. Biochem. 2013, 71, 1–10. [Google Scholar] [CrossRef] [PubMed]
  33. Parthasaranthi, T.; Velu, G.; Jeyakumar, P. Impact of crop heat units on growth and developmental physiology of future crop production: A Review. Res. Rev. J. Crop Sci. Technol. 2013, 2, 11–18. [Google Scholar]
  34. Ghehsareh, A.M.; Samadi, N. Effect of soil acidification on growth indices and microelements uptake by greenhouse cucumber. Afr. J. Agric. Res. 2012, 7, 1659–1665. [Google Scholar]
  35. Kreij De, C.; Sonneveld, C.; Warmenhoven, M.G.; Straver, N.A. Guide Values for Nutrient Element Contents of Vegetables and Flowers under Glass; No. 15; Research Station for Floriculture and Greenhouse Vegetables Report; Proefstation voor Tuinbouw onder Glas te Naaldwijk: Naaldwijk, The Netherlands, 1992. [Google Scholar]
  36. Bacaicoa, E.; Garcia-Mina, J.M. Iron Efficiency in Different Cucumber Cultivars: The Importance of Optimizing the Use of Foliar Iron. J. Am. Soc. Hortic. Sci. 2009, 134, 405–416. [Google Scholar]
  37. Zanin, L.; Tomasi, N.; Rizzardo, C.; Gottardi, S.; Terzano, R.; Alfeld, M.; Janssens, K.; De Nobili, M.; Mimmo, T.; Cesco, S. Iron allocation in leaves of Fe-deficient cucumber plants fed with natural Fe complexes. Physiol. Plant. 2015, 154, 82–94. [Google Scholar] [CrossRef] [PubMed]
  38. Gopal, R. Manganese and Oxidative Damage in Cucumber. Int. J. Veg. Sci. 2008, 14, 55–66. [Google Scholar] [CrossRef]
  39. Zheng, Y.; Wang, L.; Dixon, M. Greenhouse pepper growth and yield response to copper application. HortScience 2005, 40, 2132–2134. [Google Scholar]
  40. Soydam, A.S.; Gökçe, E.; Büyük, İ.; Aras, S. Characterization of stress induced by copper and zinc on cucumber (Cucumis sativus L.) seedlings by means of molecular and population parameters. Mutat. Res. Toxicol. Environ. Mutagen. 2012, 746, 49–55. [Google Scholar] [CrossRef] [PubMed]
  41. Tzerakis, C.; Savvas, D.; Sigrimis, N.; Mavrogiannopoulos, G. Uptake of Mn and Zn by cucumber grown in closed hydroponic systems as influenced by the Mn and Zn concentrations in the supplied nutrient solution. HortScience 2013, 48, 373–379. [Google Scholar]
  42. Engels, C.; Kirkby, E.; White, P. Mineral Nutrition, Yield and Source–Sink Relationships. In Marschner’s Mineral Nutrition of Higher Plants; Marschner, P., Ed.; Academic Press: Amsterdam, The Netherlands, 2012; pp. 85–133. [Google Scholar]
  43. Tap, R.F. Economics-Based Optimal Control of Greenhouse Tomato Crop Production; Wageningen Agricultural University: Wageningen, The Netherlands, 2000. [Google Scholar]
  44. Wallach, D.; Makowski, D.; Jones, J.W.; Brun, F. Working with Dynamic Crop Models; Academic Press: Amsterdam, The Netherlands, 2014. [Google Scholar]
  45. Abdel-Rahman, E.M.; Mutanga, O.; Odindi, J.; Adam, E.; Odindo, A.; Ismail, R. Estimating Swiss chard foliar macro- and micronutrient concentrations under different irrigation water sources using ground-based hyperspectral data and four partial least squares (PLS)-based (PLS1, PLS2, SPLS1 and SPLS2) regression algorithms. Comput. Electron. Agric. 2017, 132, 21–33. [Google Scholar] [CrossRef]
  46. Quesada-Roldán, G.; Bertsch-Hernández, F. Obtención de la curva de extracción nutrimental del híbrido de tomate FB-17. Terra Latinoam. 2013, 31, 1–7. [Google Scholar]
  47. Rodas-Gaitán, H.A.; Rodríguez-Fuentes, H.; Ojeda-Zacarías, M.C.; Vidales-Contreras, J.A.; Luna-Maldonado, A.I. Macronutrients absorption curves in italian squash (Cucurbita pepo L.). Rev. Fitotec. Mex. 2012, 35, 57–60. [Google Scholar]
  48. Lombnæs, P.; Singh, B.R. Predicting Zn and Cu status in cereals—Potential for a multiple regression model using soil parameters. J. Agric. Sci. 2003, 141, 349. [Google Scholar] [CrossRef]
  49. Steiner, A.A. A universal method for preparing nutrient solutions of a certain desired composition. Plant Soil 1961, 15, 134–154. [Google Scholar] [CrossRef]
Figure 1. Climate data recorded during the development of tomato crops. The daily average is presented in the figure.
Agronomy 07 00079 g001
Figure 2. Accumulation of dry biomass recorded during the development of the cucumber crops Vitaly (a) and Luxell (b) varieties. The data are the average of four plants.
Agronomy 07 00079 g002
Figure 3. Linear relationship between the accumulated Fe, B, Mn, Cu, and Zn and the biomass of both Vitaly and Luxell varieties obtained from the 2015 to 2016 cycles. Data are the mean of four replicates ± standard error of the mean. The lineal model is included and the corresponding determination coefficient (R2).
Agronomy 07 00079 g003
Figure 4. Comparison between the real and dynamically simulated data for the accumulation of dry biomass in cucumber plants for Vitaly (a) Luxell (b) varieties. The real data is the average of four replicates.
Agronomy 07 00079 g004
Figure 5. Comparison between the real and dynamically simulated data for micronutrient accumulation in the Vitaly (a,c,e,g,i) and Luxell (b,d,f,h,j) cucumber plant varieties. The data corresponding to the culture cycle used for the calibration are presented. The real data are the average of four replicates.
Agronomy 07 00079 g005
Figure 6. Comparison between the real and dynamically simulated data for micronutrient accumulation in the Vitaly (a,c,e,g,i) and Luxell (b,d,f,h,j) cucumber plant varieties. The data corresponding to the cultivation cycle used for the validation are presented. The real data are the average of four replicates.
Agronomy 07 00079 g006
Table 1. Concentration of micronutrients in whole plant determined during the development of cucumber in Vitaly and Luxell varieties.
Fe (mg kg−1 DW)B (mg kg−1 DW)Mn (mg kg−1 DW)Cu (mg kg−1 DW)Zn (mg kg−1 DW)
cvDAE2015201620152016201520162015201620152016
Vitaly2591.5 ± 13.6187.0 ± 8.071.4 ± 9.1100.0 ± 0.227.8 ± 4.253.1 ± 1.65.2 ± 0.34.4 ± 0.527.7 ± 1.344.0 ± 1.6
35167.0 ± 9.7141.5 ± 3.882.0 ± 20.3100.0 ± 0.863.3 ± 5.958.8 ± 2.37.8 ± 1.01.5 ± 0.238.3 ± 4.545.8 ± 2.1
4596.3 ± 10.799.1 ± 17.4112.8 ± 22.5100.0 ± 0.950.7 ± 6.563.3 ± 1.17.6 ± 0.75.8 ± 0.927.5 ± 2.143.7 ± 0.5
5595.5 ± 5.2576.8 ± 29.6120.2 ± 9.3100.0 ± 0.953.9 ± 5.634.2 ± 1.89.1 ± 0.77.1 ± 0.525.1 ± 2.419.3 ± 2.5
65110.0 ± 12.589.2 ± 12.2117.1 ± 8.7118.9 ± 5.867.3 ± 2.433.8 ± 1.86.2 ± 0.35.0 ± 0.620.4 ± 0.718.3 ± 1.9
75102.4 ± 8.086.8 ± 9.0107.7 ± 1.7140.5 ± 15.968.5 ± 2.458.8 ± 2.96.9 ± 0.55.8 ± 0.728.8 ± 0.831.1 ± 2.8
8593.2 ± 5.988.1 ± 7.6103.1 ± 4.1107.7 ± 3.558.7 ± 4.642.3 ± 2.36.6 ± 0.45.3 ± 0.425.8 ± 2.519.4 ± 0.5
9591.0 ± 4.380.5 ± 3.1101.3 ± 4.5107.0 ± 4.855.7 ± 2.642.0 ± 5.95.9 ± 0.35.7 ± 0.524.2 ± 2.519.5 ± 1.5
Luxell2587.3 ± 6.1207.6 ± 23.472.6 ± 6.7100.0 ± 2.281.3 ± 7.267.5 ± 1.36.1 ± 0.51.8 ± 0.328.7 ± 1.440.6 ± 2.1
35106.2 ± 9.9155.0 ± 11.0164.7 ± 5.2100.0 ± 1.999.0 ± 5.660.2 ± 2.58.7 ± 0.31.2 ± 0.135.7 ± 1.033.6 ± 1.8
4595.2 ± 2.674.1 ± 4.3110.0 ± 11.8100.0 ± 1.990.1 ± 2.862.4 ± 2.48.8 ± 0.34.7 ± 0.627.8 ± 0.937.5 ± 0.9
55111.6 ± 9.345.4 ± 7.7142.7 ± 5.6100.0 ± 2.197.9 ± 6.227.8 ± 1.79.2 ± 0.63.6 ± 0.224.7 ± 1.516.8 ± 1.7
65108.0 ± 10.461.4 ± 2.6131.7 ± 5.8100.0 ± 2.493.5 ± 1.931.4 ± 1.58.3 ± 0.56.7 ± 0.922.8 ± 0.321.1 ± 2.3
75105.4 ± 8.271.7 ± 4.1113.4 ± 2.9131.1 ± 10.571.3 ± 5.750.2 ± 4.89.1 ± 0.47.4 ± 0.524.7 ± 1.925.2 ± 1.4
8599.1 ± 12.974.8 ± 9.2107.9 ± 7.0123.8 ± 6.972.0 ± 4.748.3 ± 2.38.0 ± 0.76.3 ± 0.523.2 ± 1.022.9 ± 2.1
9588.6 ± 6.768.5 ± 12.085.8 ± 4.0104.1 ± 2.259.0 ± 5.552.5 ± 2.37.9 ± 0.36.6 ± 0.719.8 ± 0.721.9 ± 2.6
cv: cucumber variety. DAE: days after seed emergence. DW: Dry weight. 2015 and 2016 represent the year of crop development. The data are the mean of four replicates ± standard error of the mean.
Table 2. Pearson correlation matrix for biomass and micronutrients accumulation in cucumber.
BioFeBMnCuZn
DAE201520162015201620152016201520162015201620152016
BioV110.990.990.990.990.990.980.980.990.990.97
L110.990.990.990.970.990.970.990.990.990.99
FeV 110.990.990.990.980.990.990.980.97
L 110.990.990.990.990.990.990.990.99
BV 110.990.990.990.990.970.98
L 110.980.990.980.980.990.98
MnV 110.980.980.980.99
L 110.990.980.990.98
CuV 110.980.97
L 110.990.99
ZnV 11
L 11
Bio: dry biomass. DAE: days after seed emergence. V and L represent the Vitaly and Luxell varieties, respectively. 2015 and 2016 represent the year of crop development. In all cases, a highly significant correlation was obtained (r ≥ 0.97).
Table 3. Values of the indices used to evaluate the simulation efficiency of the dynamic model during the calibration and validation process using the data obtained from the 2015 to 2016 crop cycles, respectively.
BiomassFeBMnCuZn
cvEFIndexEFIndexEFIndexEFIndexEFIndexEFIndex
2015V0.990.990.990.990.990.990.990.990.990.990.990.99
L0.990.990.990.990.990.990.980.990.970.990.980.99
2016V0.990.990.990.990.950.990.930.990.950.990.960.99
L0.990.990.840.980.980.990.950.990.980.990.960.99
cv: variety. “EF” and “Index” are the indices proposed by Wallach et al. [44]. V and L represent the Vitaly and Luxell varieties, respectively. 2015 and 2016 represent the year of crop development. A R2 value of 1 represents a perfect fit between the simulated and the actual data [44].

