Utilizing Process-Based Modeling to Assess the Impact of Climate Change on Crop Yields and Adaptation Options in the Niger River Basin, West Africa


Abstract
:1. Introduction
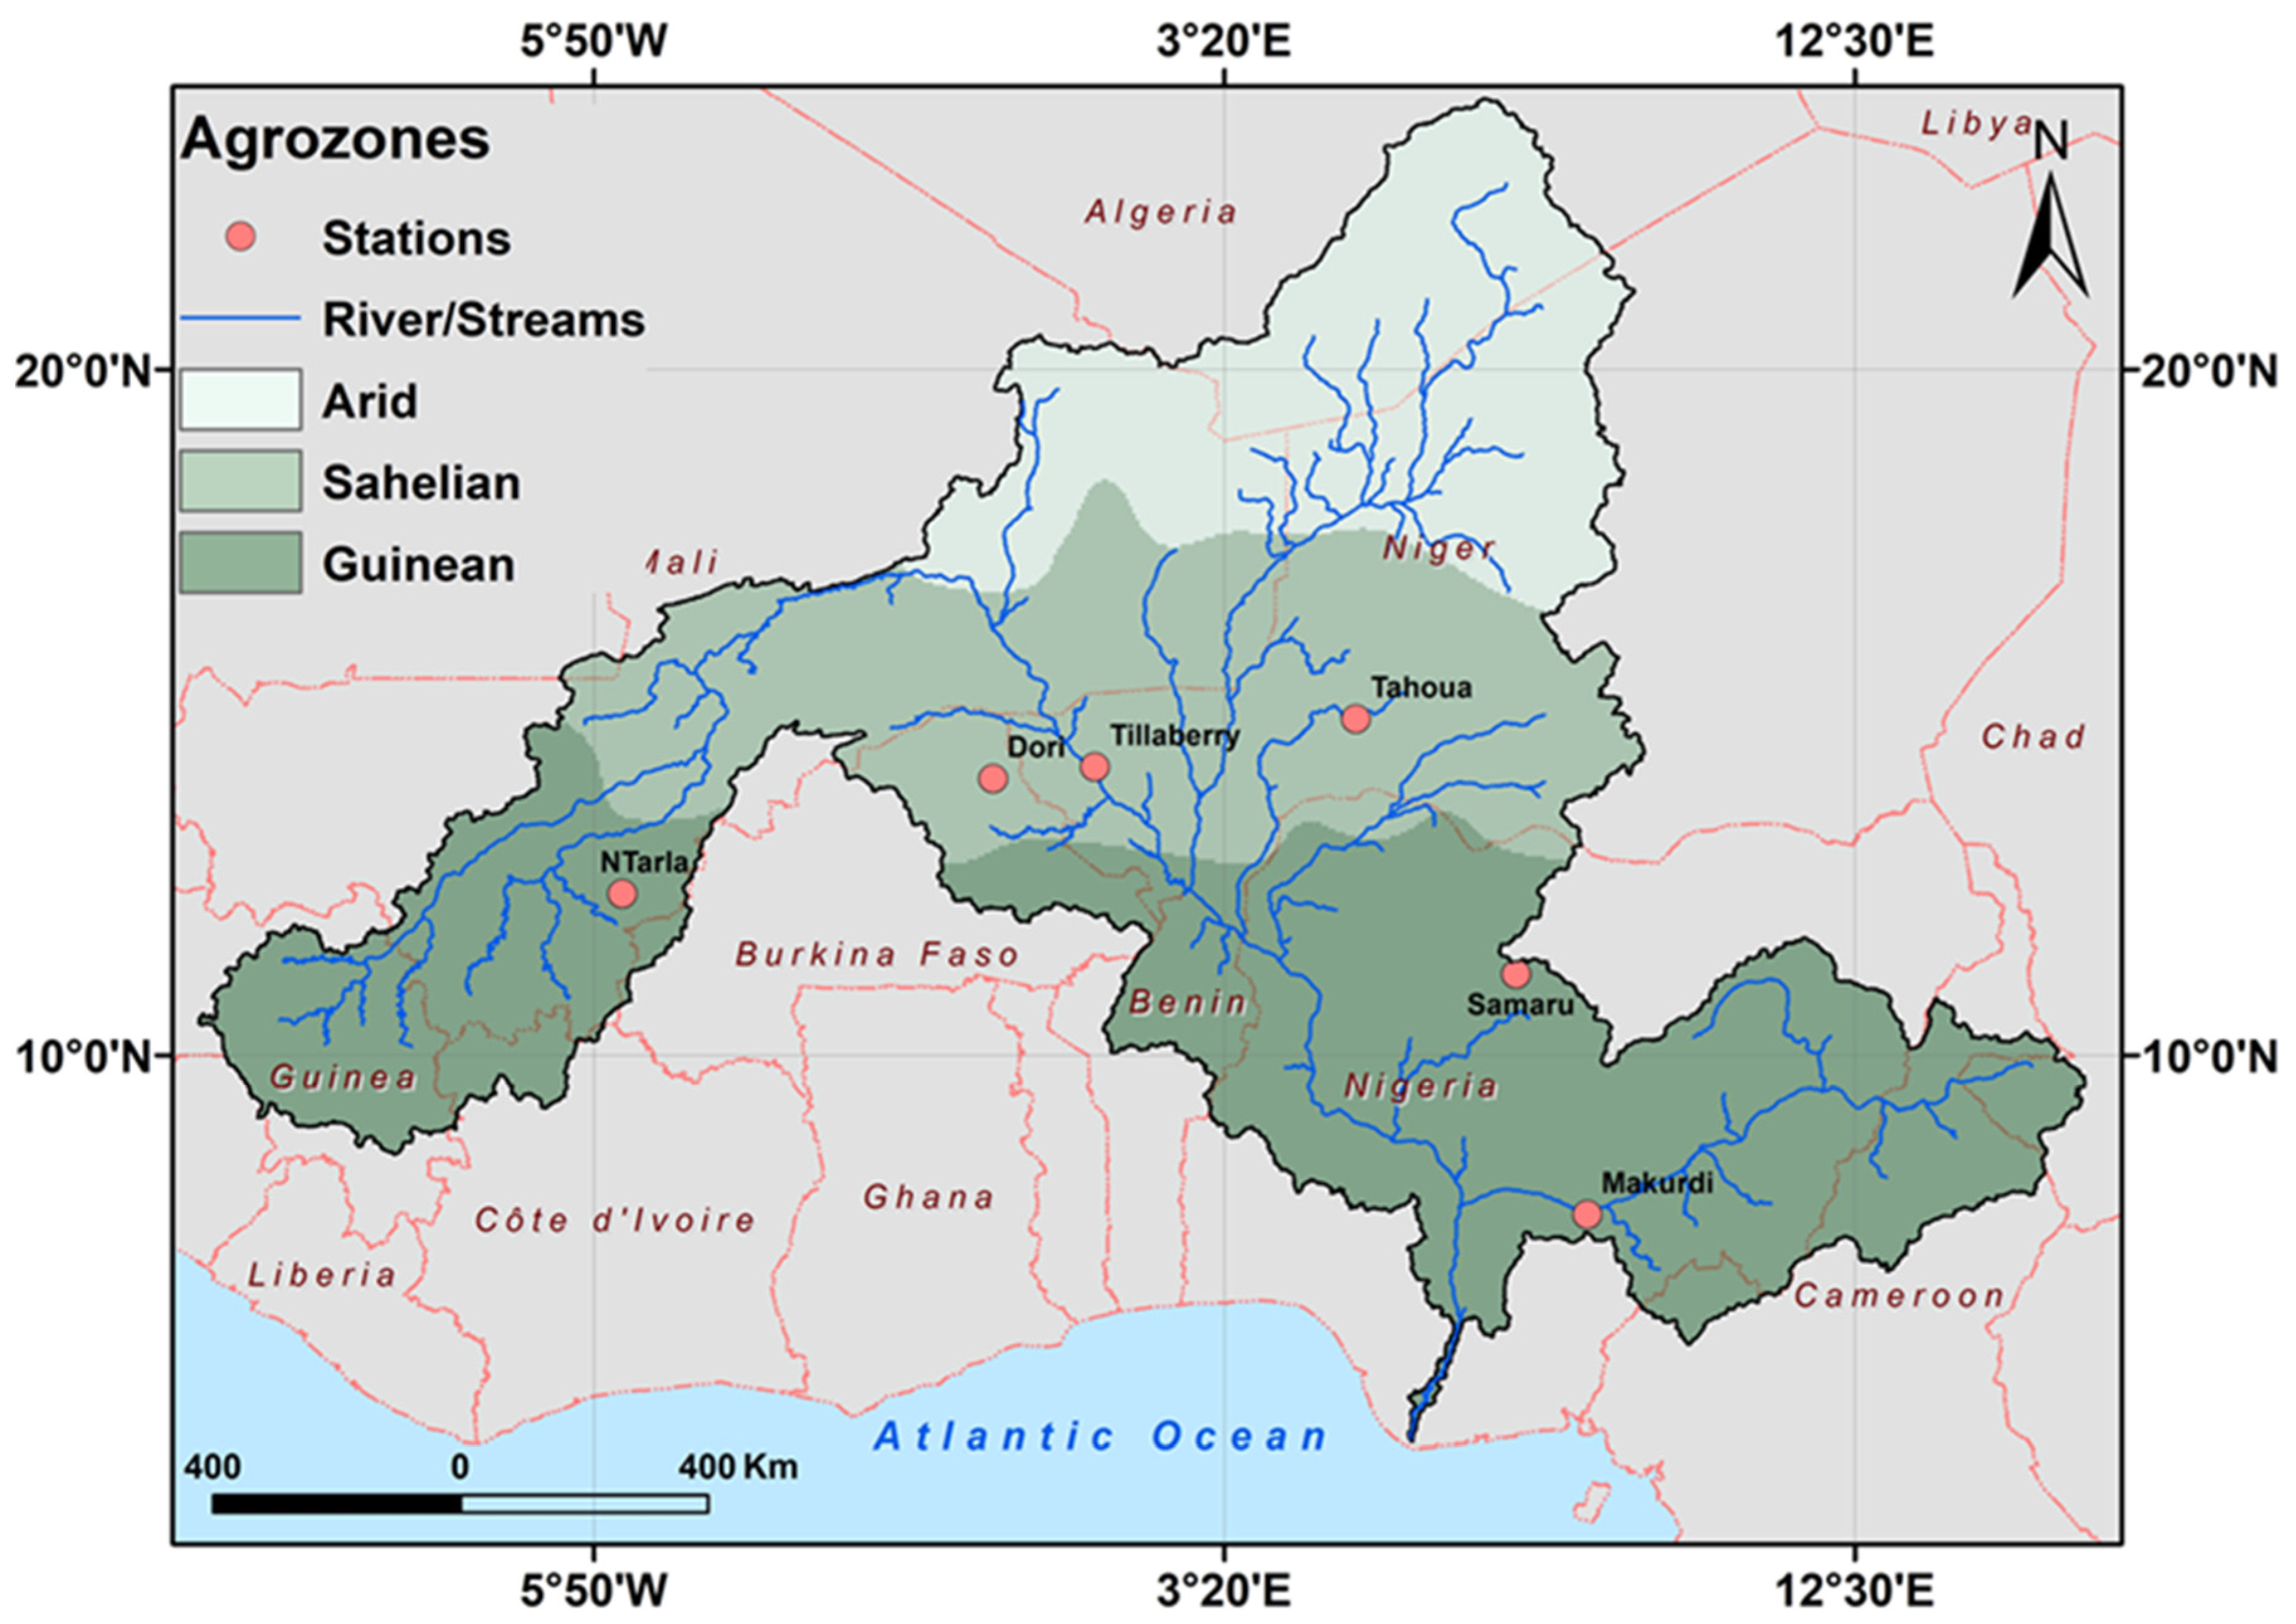
2. Study Area
3. Materials and Methods
3.1. AquaCrop Model Description
3.2. Climate Scenarios and Bias Correction Technique
- For each station, the nearest model grid point is identified and used for the bias correction process. This approach has been shown to be superior to averaging multiple grid point time series which degrades the statistics, in particular at the high intensity end of the distribution [33].
- The bias correction is done separately for each individual month. That is, all daily values corresponding to a given calendar month, for the observed and the historical simulation, over the observational period are collected in two time series of equal length. For example, all the 31 daily precipitation values for the month of January from 1976 to, and including 2005, are used to calculate the January bias correction parameters. The years 1976 to 2005 are used for the bias correction of the stations of Samaru, Tahoua and Dori, while the years 1980 to 2005 are used for Makurdi, N’Tarla, and Tillabery. In each case we used all available observational data. For the analysis of the impact of climate change on crop yield, we used the historical climate data and different historical periods corresponding to the available historical crop yield data for the baseline (1981/85–2010).
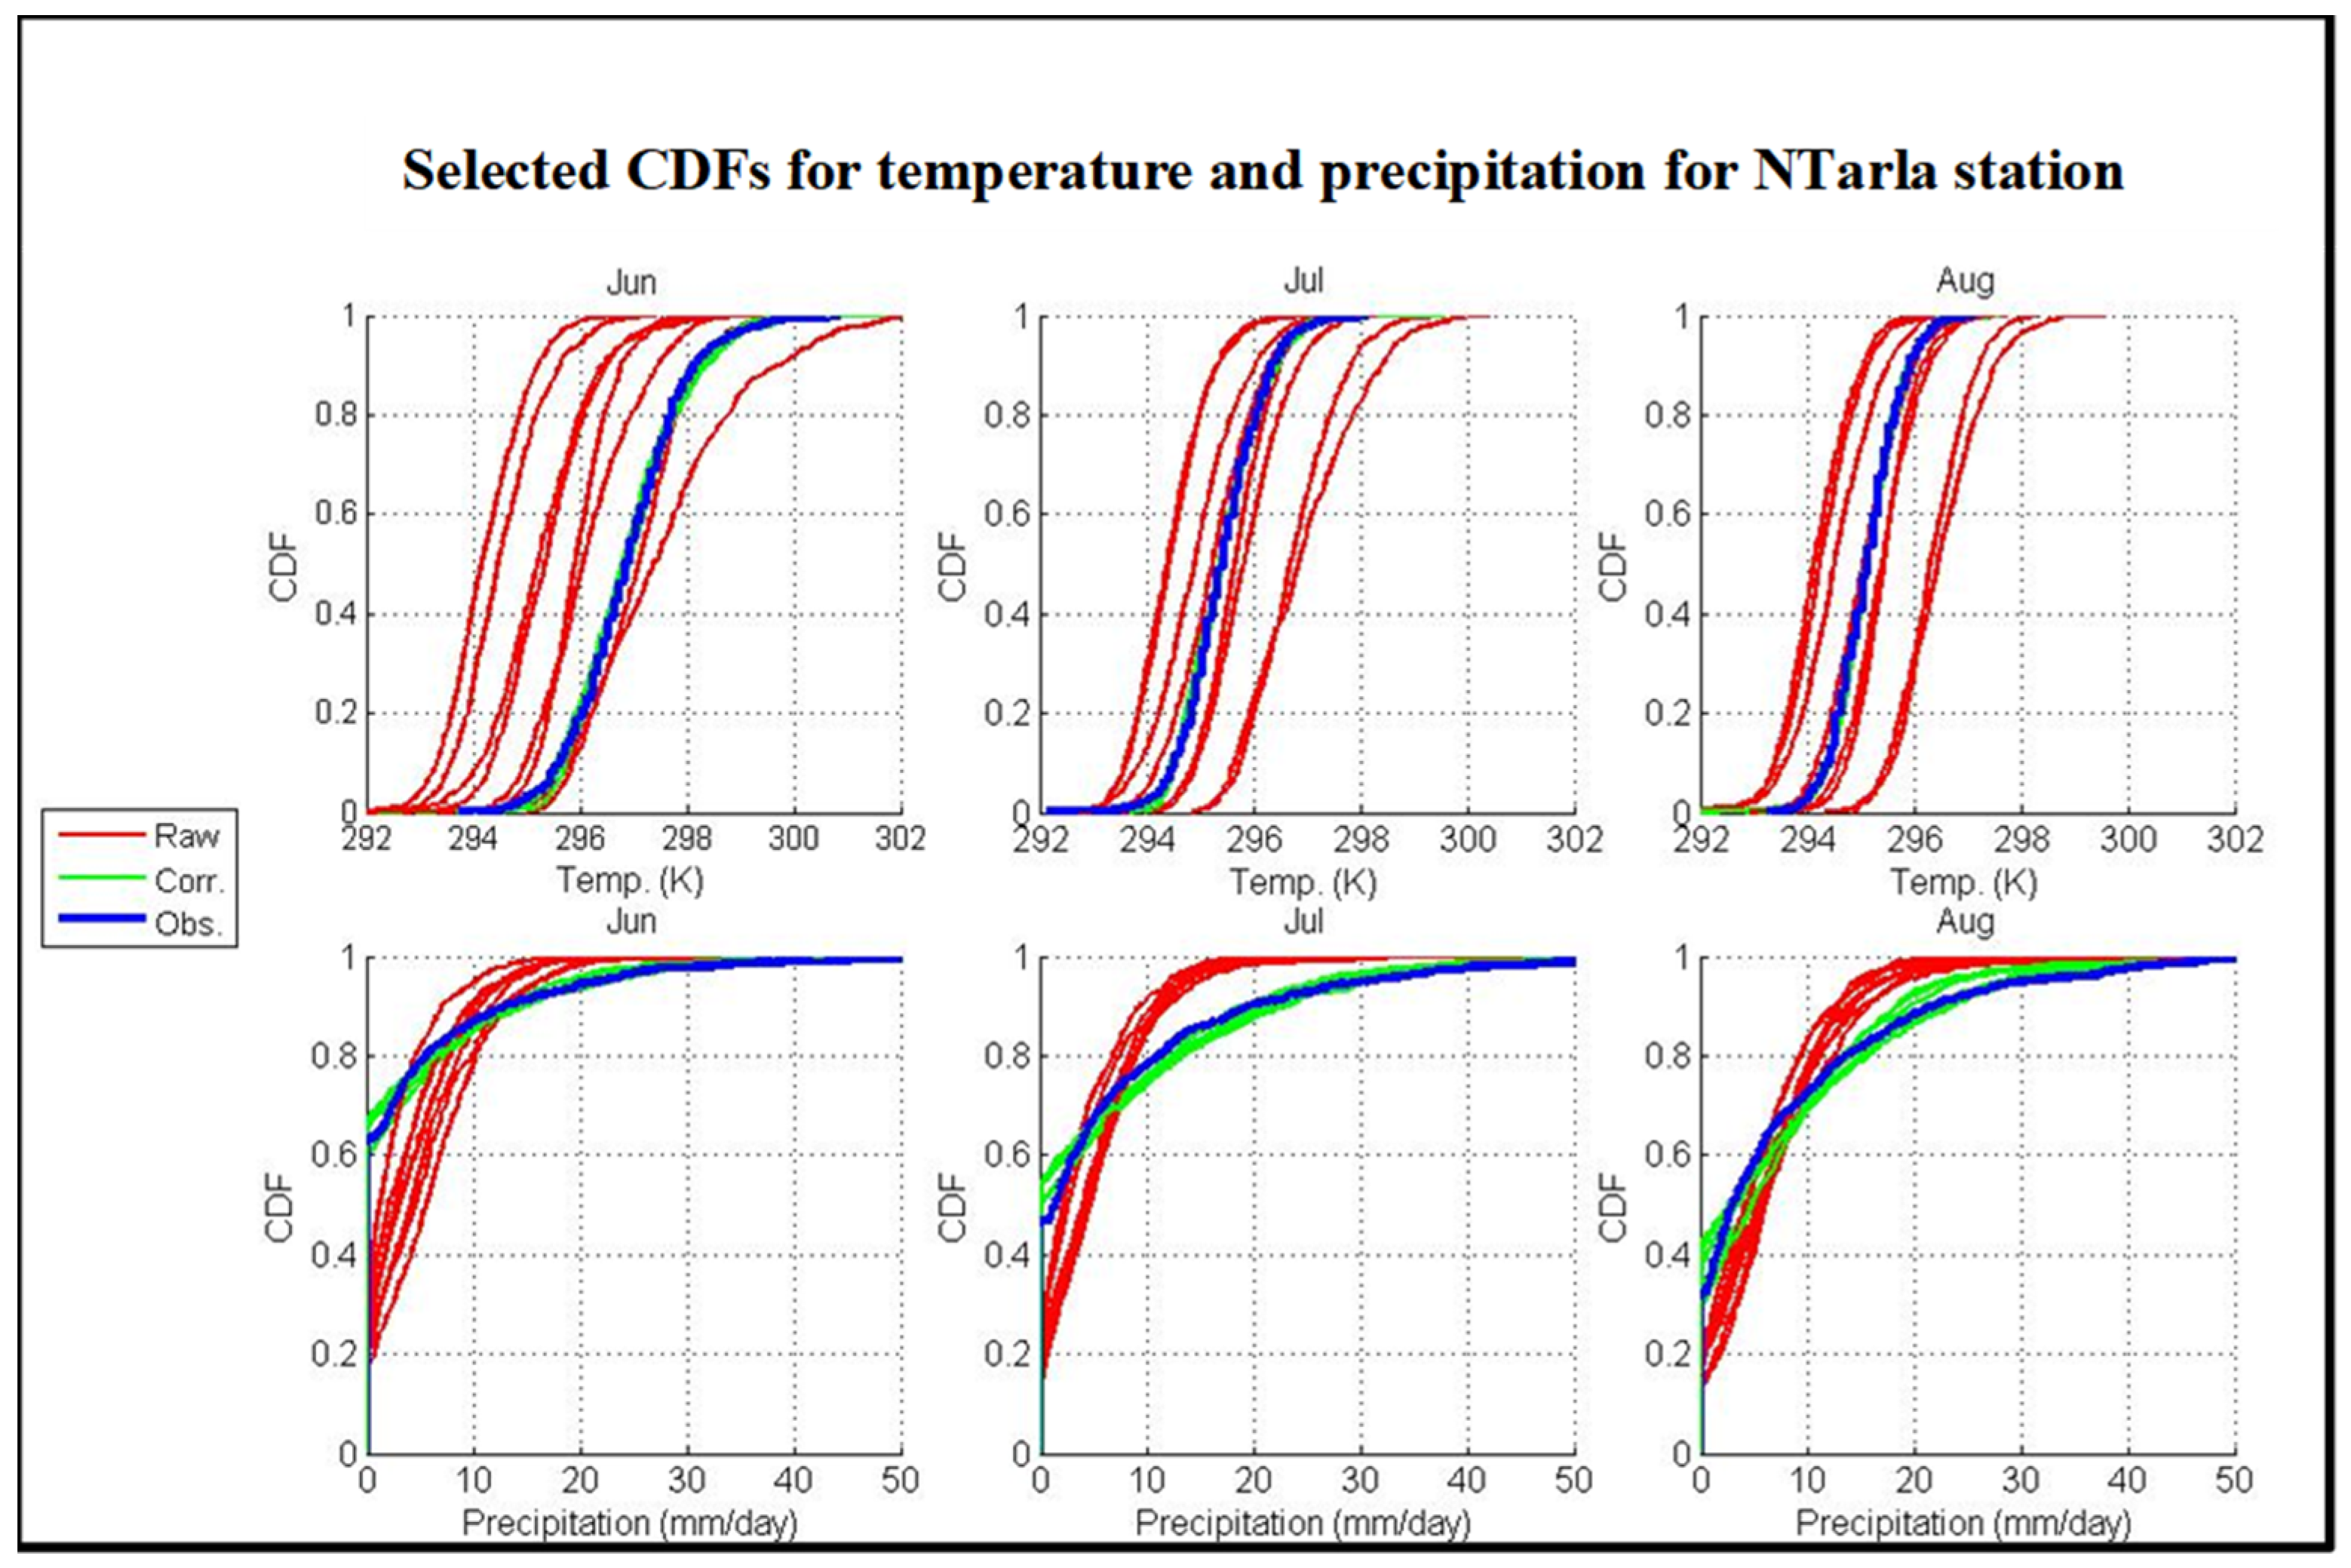
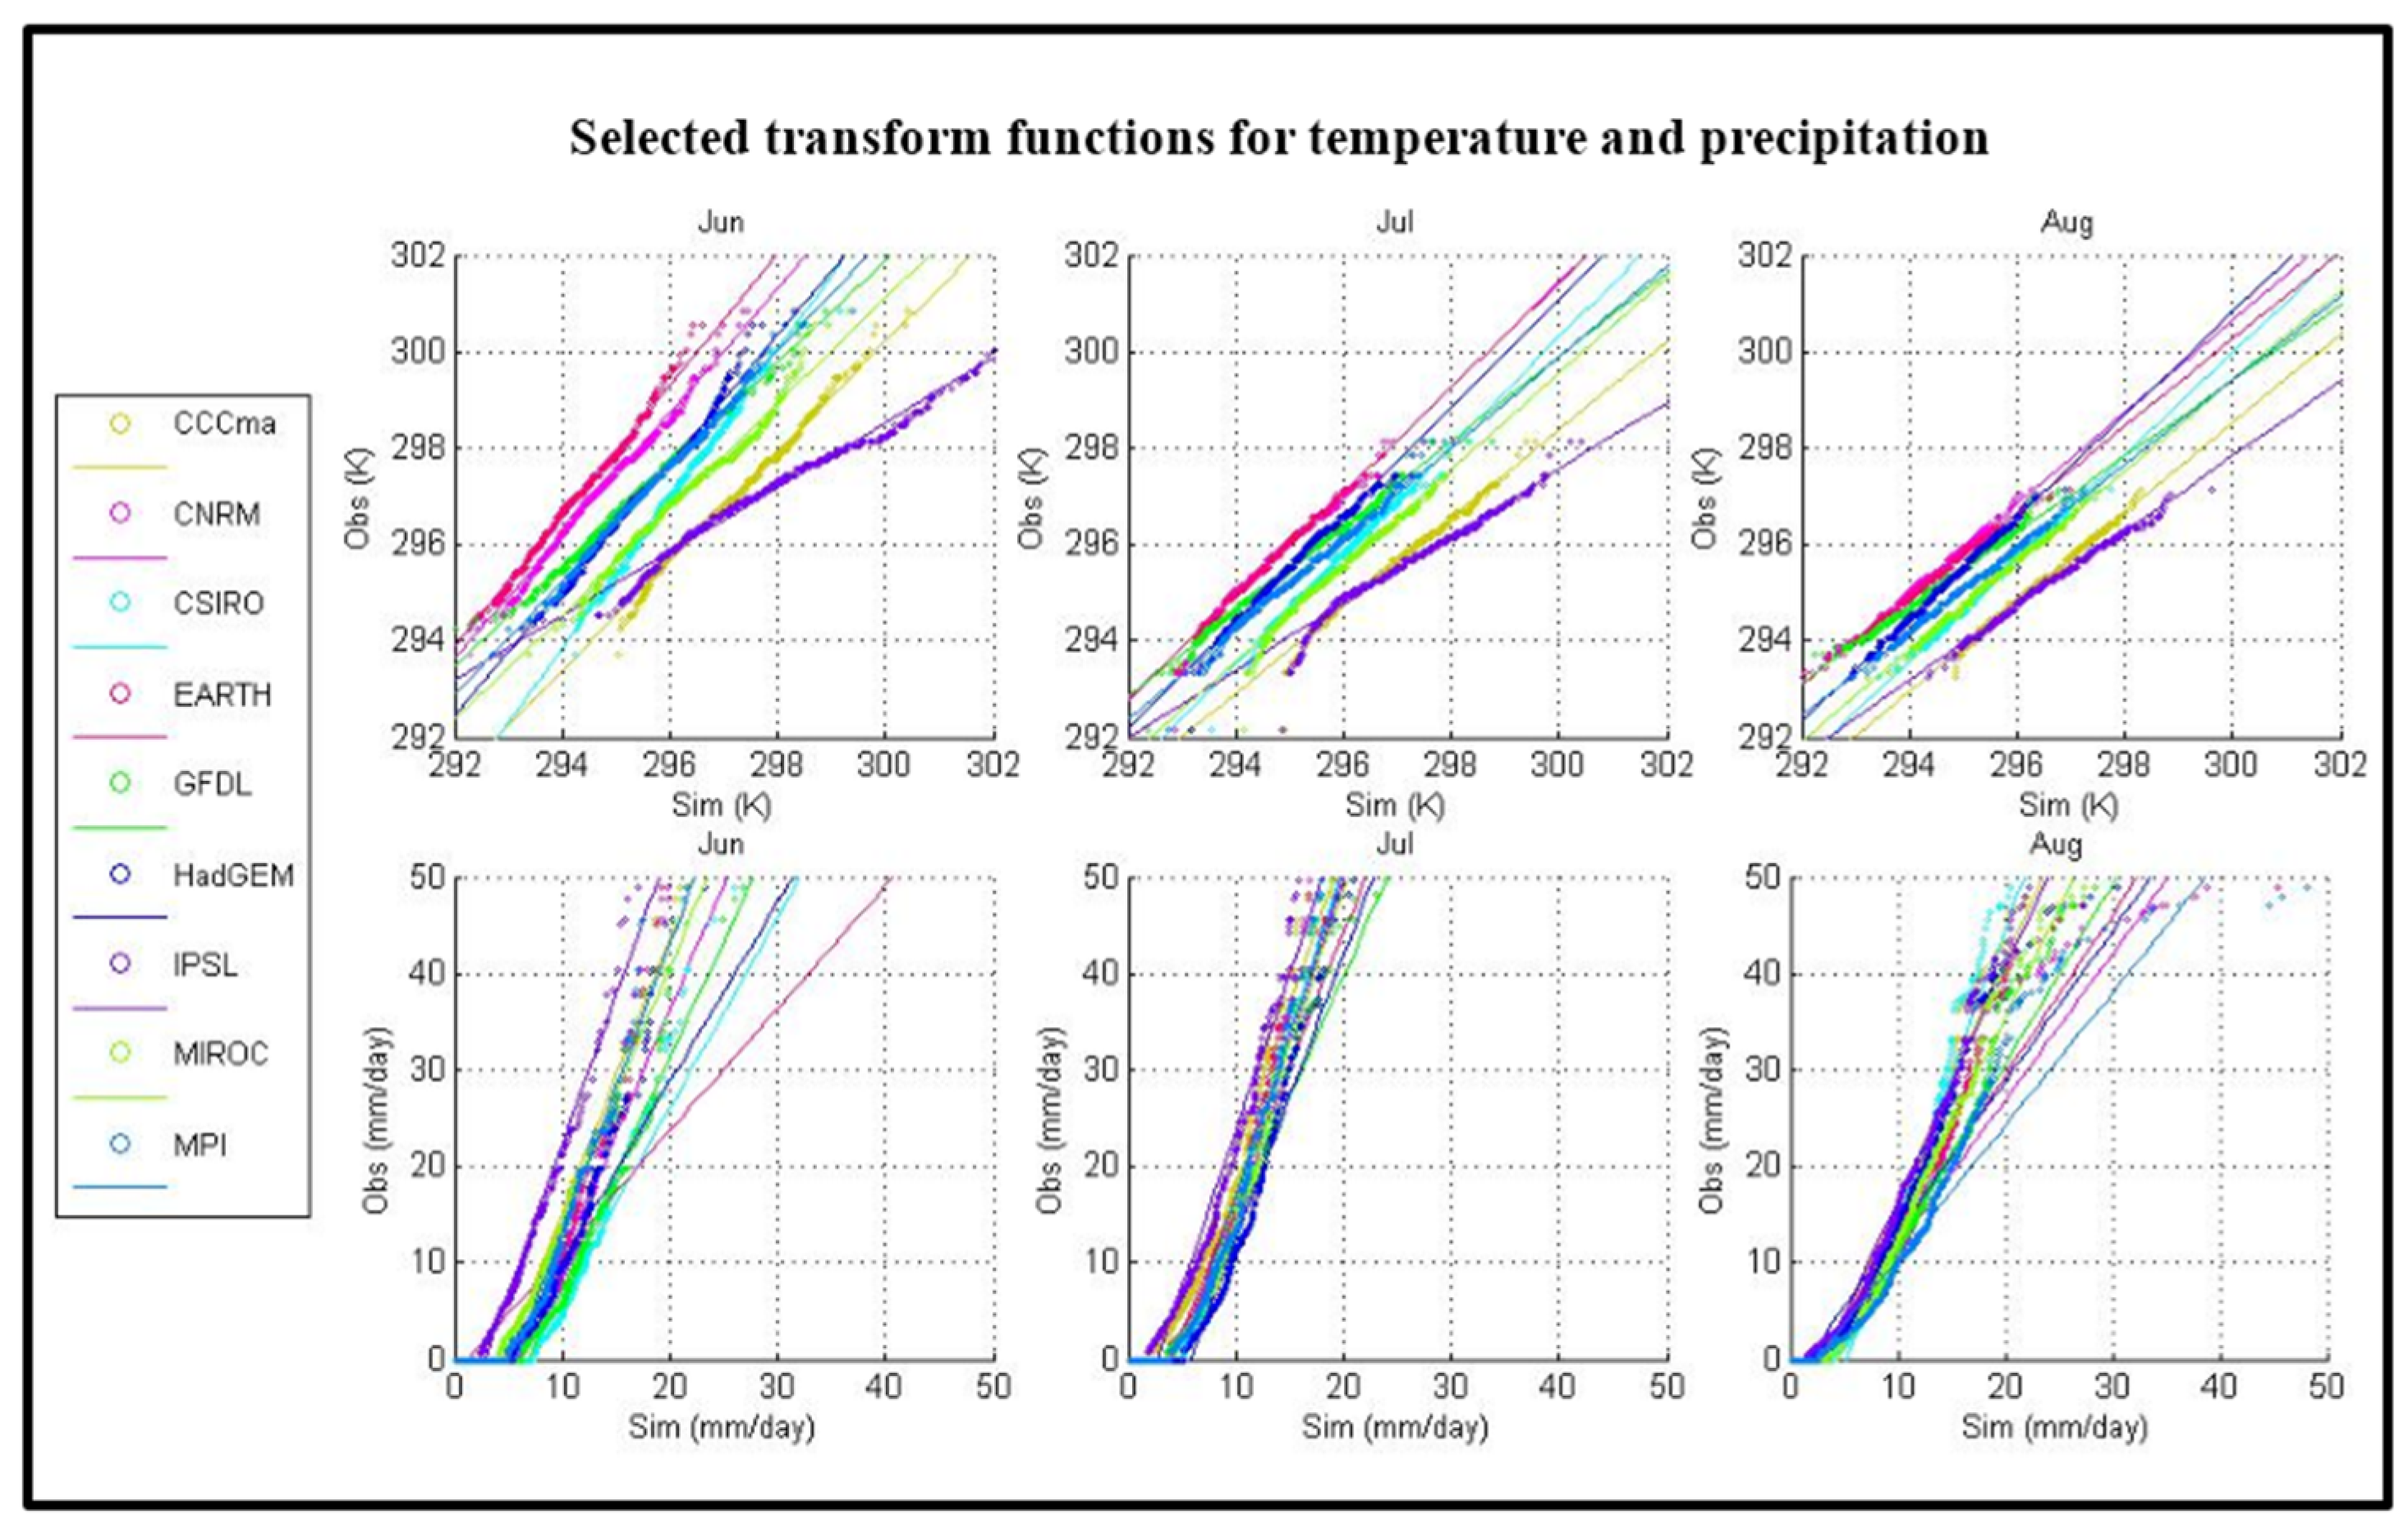
- The two time series are sorted in order of increasing intensity from lowest, generally corresponding to zero precipitation or “dry days”, to most intense. Then the observed time series is plotted against the simulated. The resulting plot is sometimes referred to as the emerging perfect transform function [32] or simply the perfect transform function (PTF). Note that a straightforward plot of the intensity-sorted time series of precipitation yields its cumulative distribution function (CDF). Examples of the PTF for precipitation for June, July and August for selected stations are shown in the bottom panel of Figure 2. A considerable portion of the PTF is contained near the origin (0,0) because the initial sections of the sorted precipitation time series are dominated by zeros. Furthermore, since it is often the case that models have considerably less dry days than the observations and correspondingly more days of light precipitation, the PTFs usually lie along the x-axis close to the origin.
- The portion of the perfect transform function that lies off the x-axis, is fitted with an analytic function of choice, in this case a first degree polynomial. The fact that we consider only the portion of the PTF that lies off the x-axis is mathematically similar, though not identical, to applying what many authors call a “dry day correction” and is standard practice.
- The fitted TF can then be used to correct projections of future scenario precipitation values. The corrected values will have, by construction, the same CDF as the observations to the extent that the PTF is well approximated by a first-degree polynomial (Figure 3). In essence, the fact that the nine bias-corrected CDFs in Figure 3 (green lines) are almost perfectly superimposed onto the observed CDF (blue line) while the non-bias-corrected CDFs (red lines) are spread out, shows that the PTF is well approximated by a linear fit.
3.3. Crop Model Calibration and Evaluation
3.4. Climate Change Adaptation and Management Scenarios
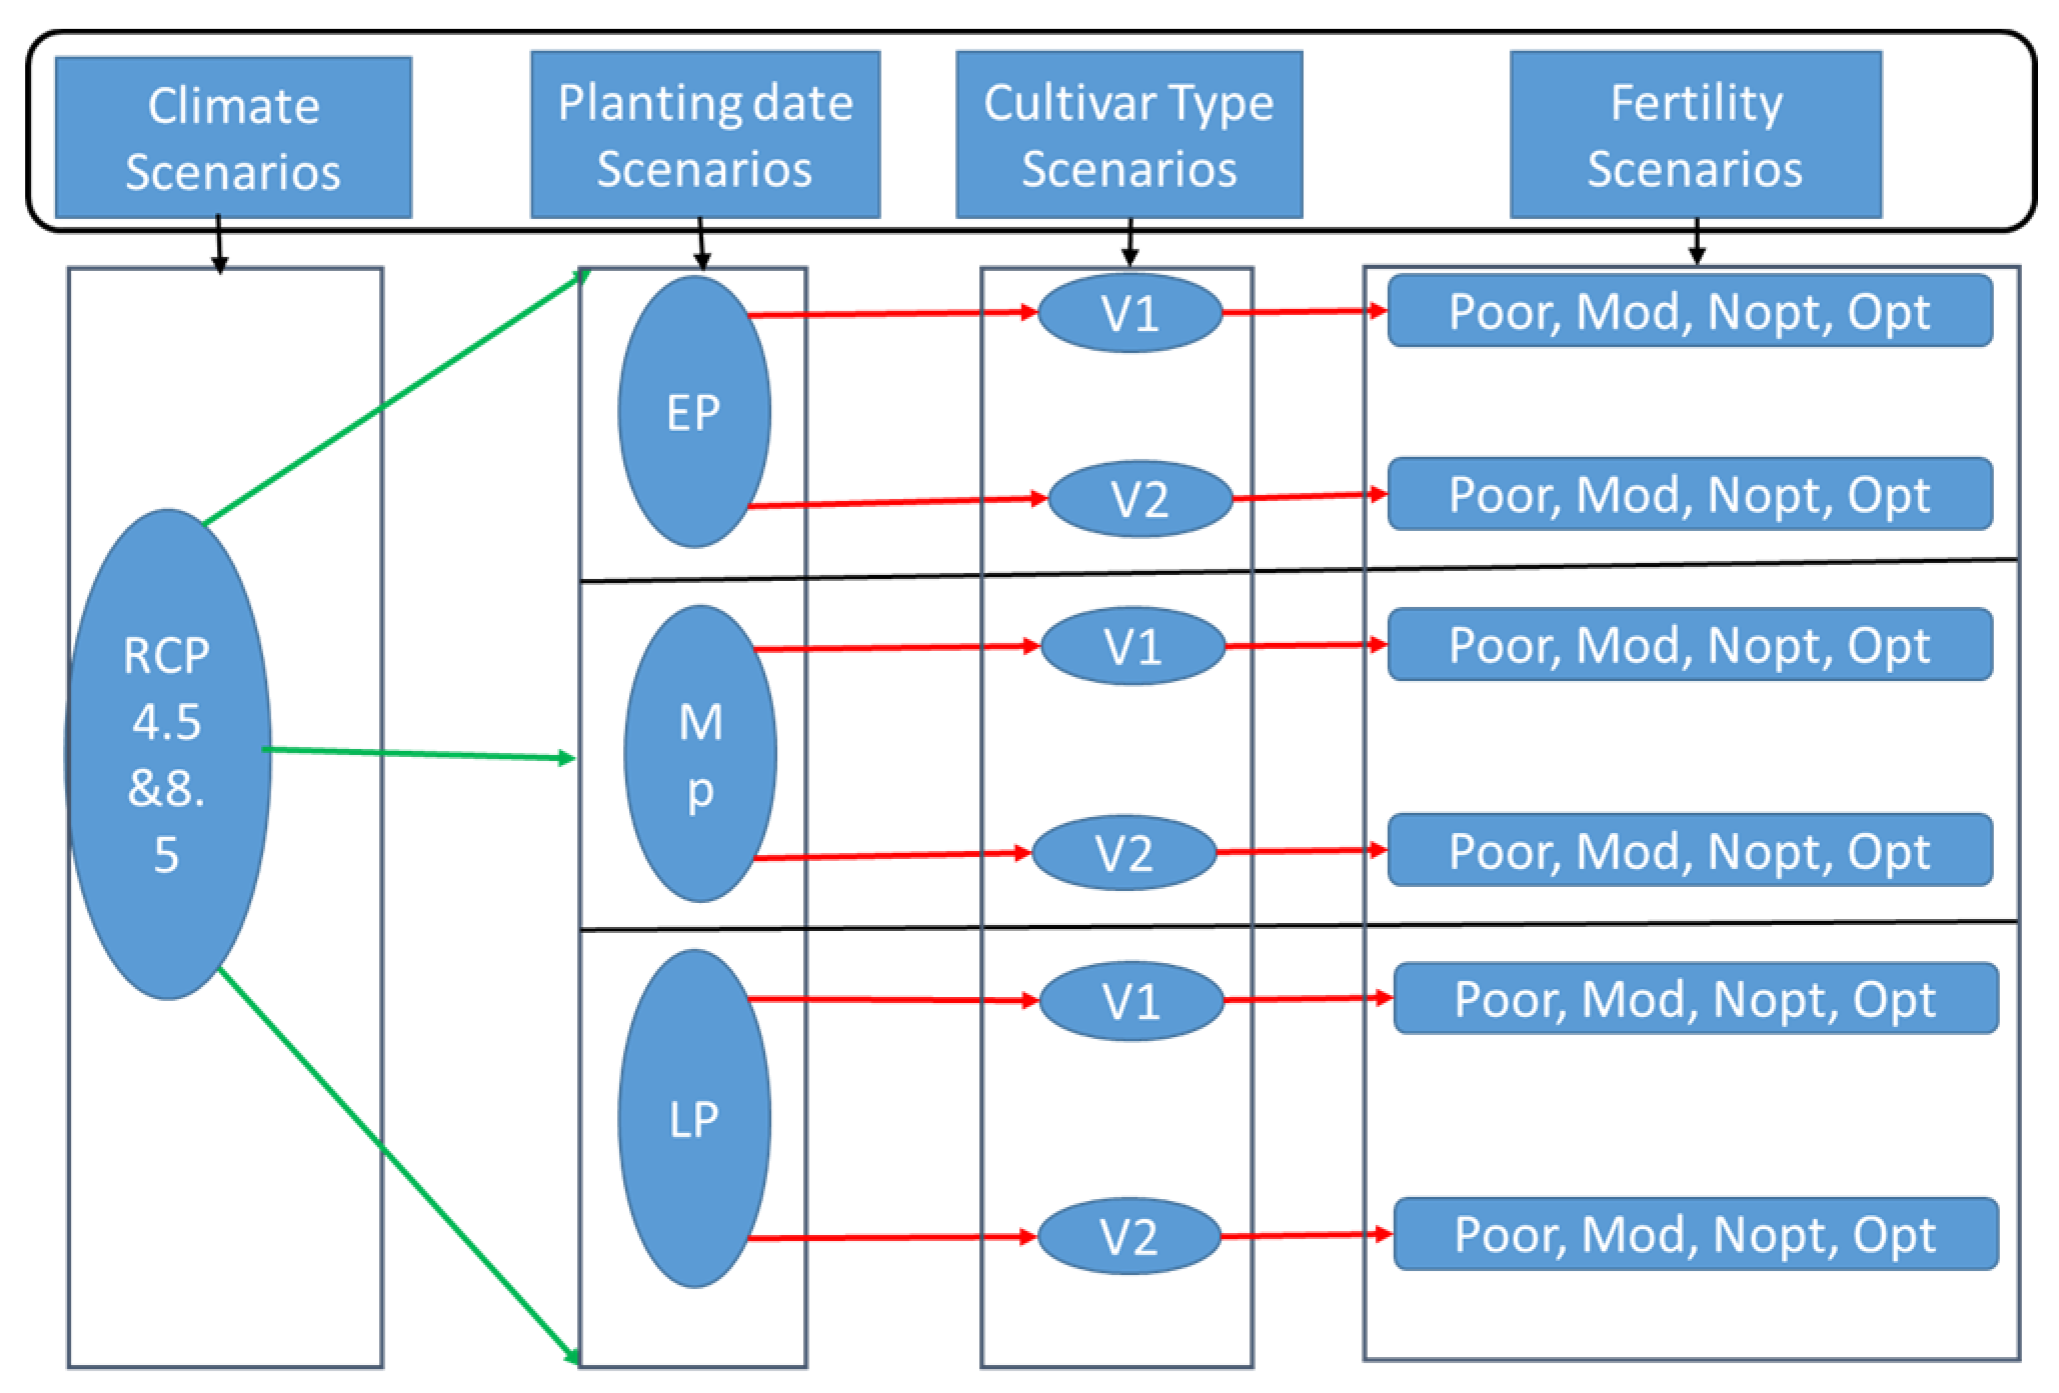
- Adjusting sowing dates: Climate change may result in an increase or decrease in the length of the growing season relative to the historical period. We investigate the effects of these changes using three planting windows defined by the FAO crop calendar for the various locations and agro ecological zones. These are: early planting date (EP), mid planting date (MP) and late planting date (LP). Note, EP = 15–25/May, MP = 9–19/June and LP = 9–19/July for Samaru and N’Tarla locations (i.e., Northern Guinea), EP = 15–25/April, MP = 15–25/May, LP = 15–25/June for Makurdi location (i.e., Southern Guinea) while for Dori, Tillabery and Tahoua locations (i.e., Sahelian zone), EP = 1/June, MP = 20/June and LP = 10/July.
- Increased soil nutrients: AquaCrop does not explicitly consider nutrient cycles or balances. However, soil fertility stress is determined by its expected effect on crop biomass production, using a semi-quantitative assessment to establish the degree of stress resulting from various levels of nutrient deficiency. This approach produces a ratio (Brel). This ratio is calculated as the total dry above ground biomass at the end of the growing season in a field with soil fertility stress (Bstress) divided by the dry above ground biomass at the end of the growing season in a field without soil fertility stress (Bref) [20]. AquaCrop model has four levels of soil fertility: Poor (P), moderate (M), near optimal (NP) and optimal (OP) soil fertility levels corresponding to the nitrogen rates of 0 kg/ha, 60 kg/ha, 90 kg/ha and 120 kg/ha respectively [21]. We have associated these inbuilt soil fertility levels in AquaCrop with the four levels of nitrogen treatments based on the Brel calculated from the various growing seasons and treatments in the experiment (see more details in [21]). We tested the fertility levels for each location. Assuming that climate change reduces crop yields, could an increase in soil fertility compensate for that decrease, ameliorating the impacts of the expected climate change induced yield loss? To investigate this scenario, we simulated future crop yield for the periods 2021/25–2050 for each of the fertility levels and then compared the results with the historical yield.
- Change in cultivar: We used two cultivars, long duration (V1) and medium duration (V2) cultivars to determine the yield and response of each crop variety to climate change. For adaptation policy formulation, these scenarios will determine the most suitable varieties to be used under changing climate conditions.
4. Results and Discussion
4.1. Evaluation of the Simulated Crop Yields under the Historical Period
4.2. Precipitation and Temperature Change in the Niger River Basin
4.3. Assessing Climate Change Impact and the Adaptation Options on Cereal Yields
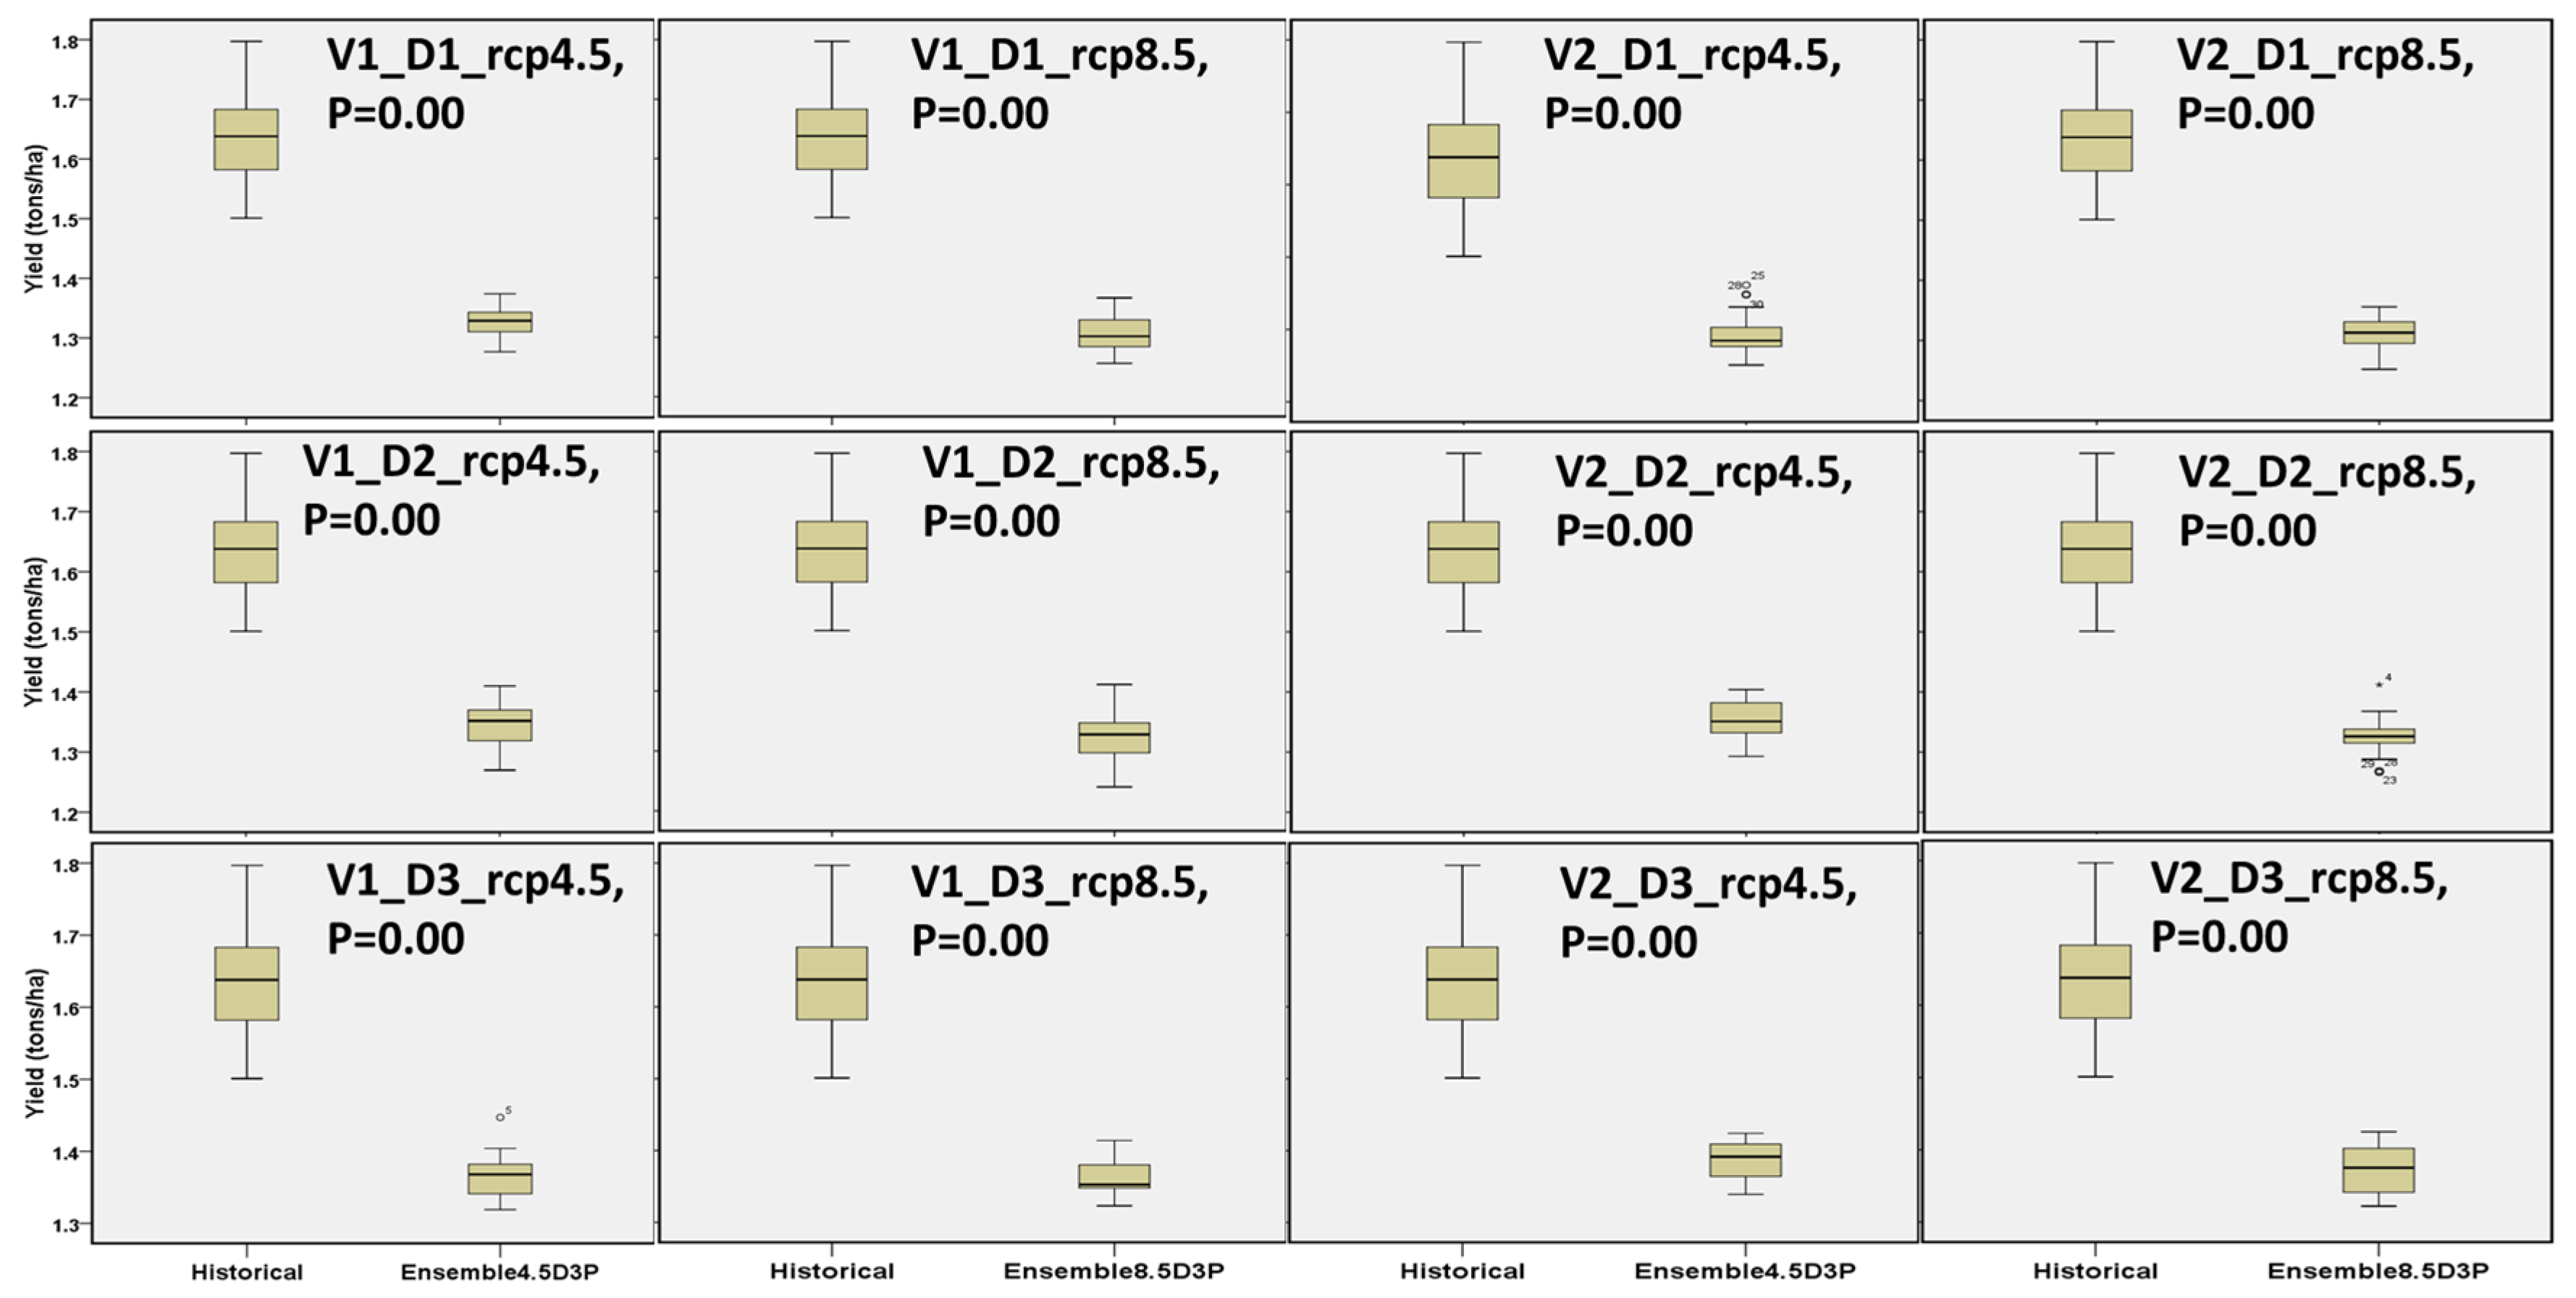
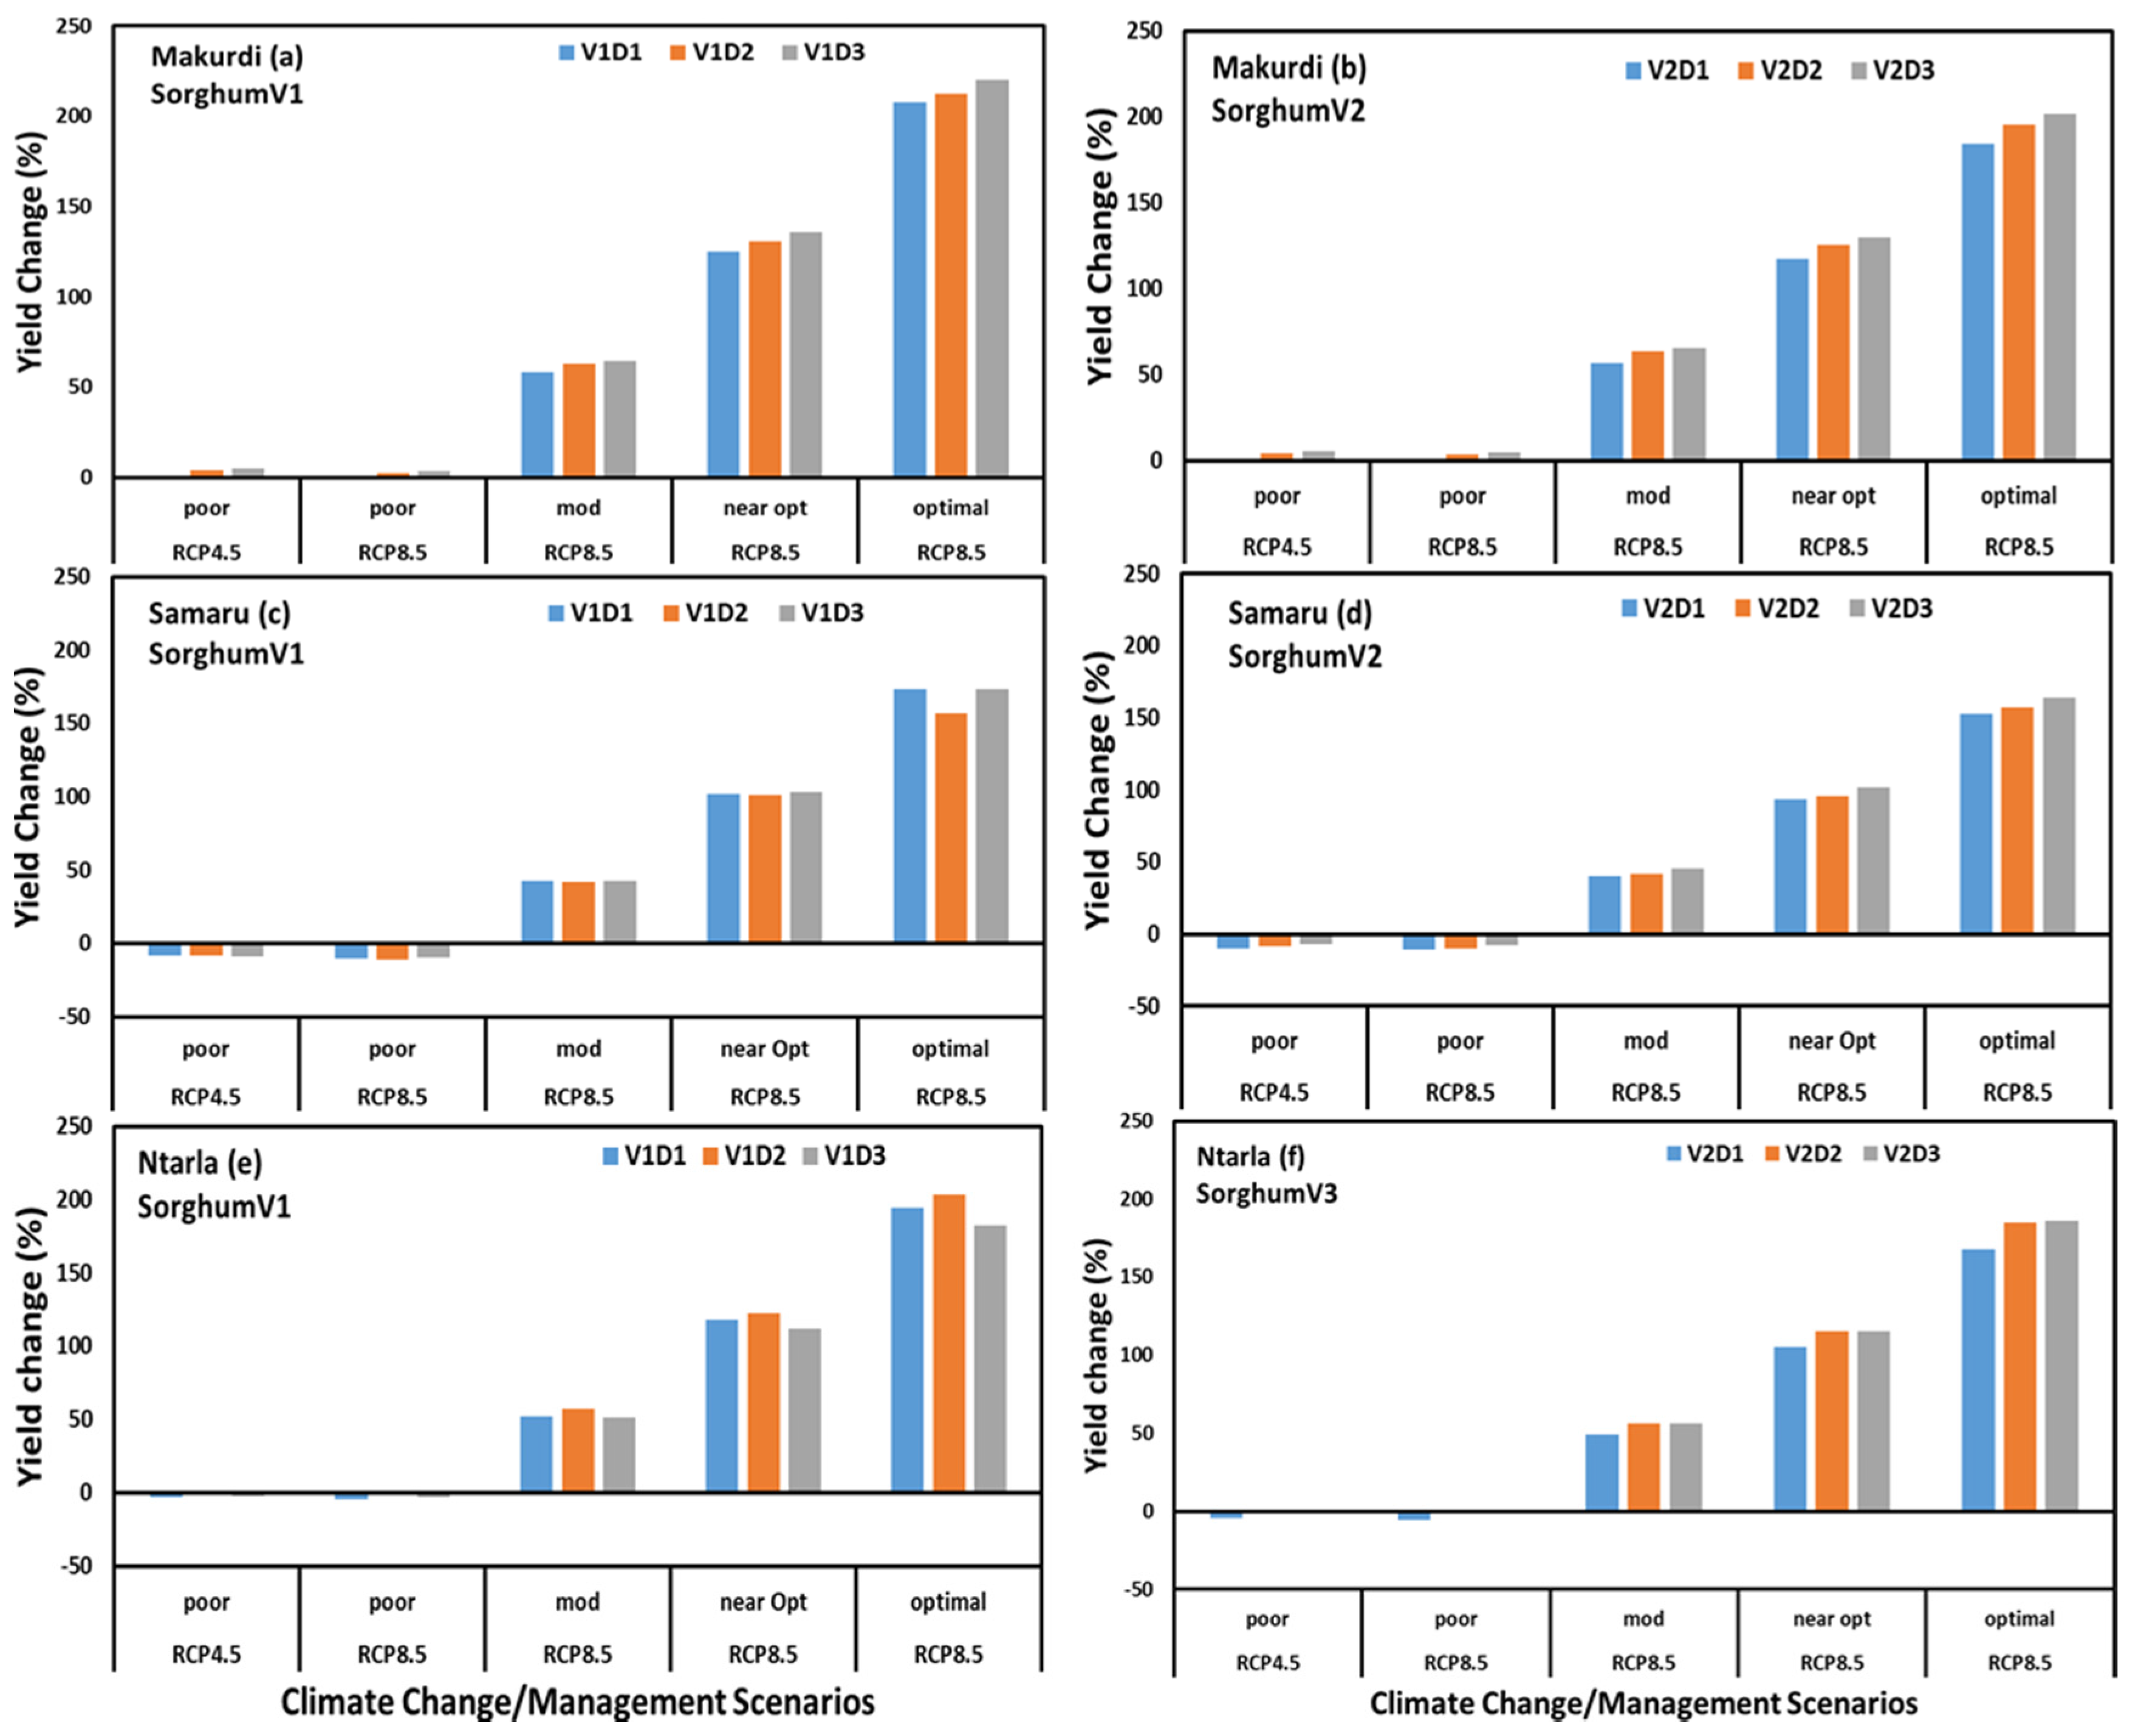
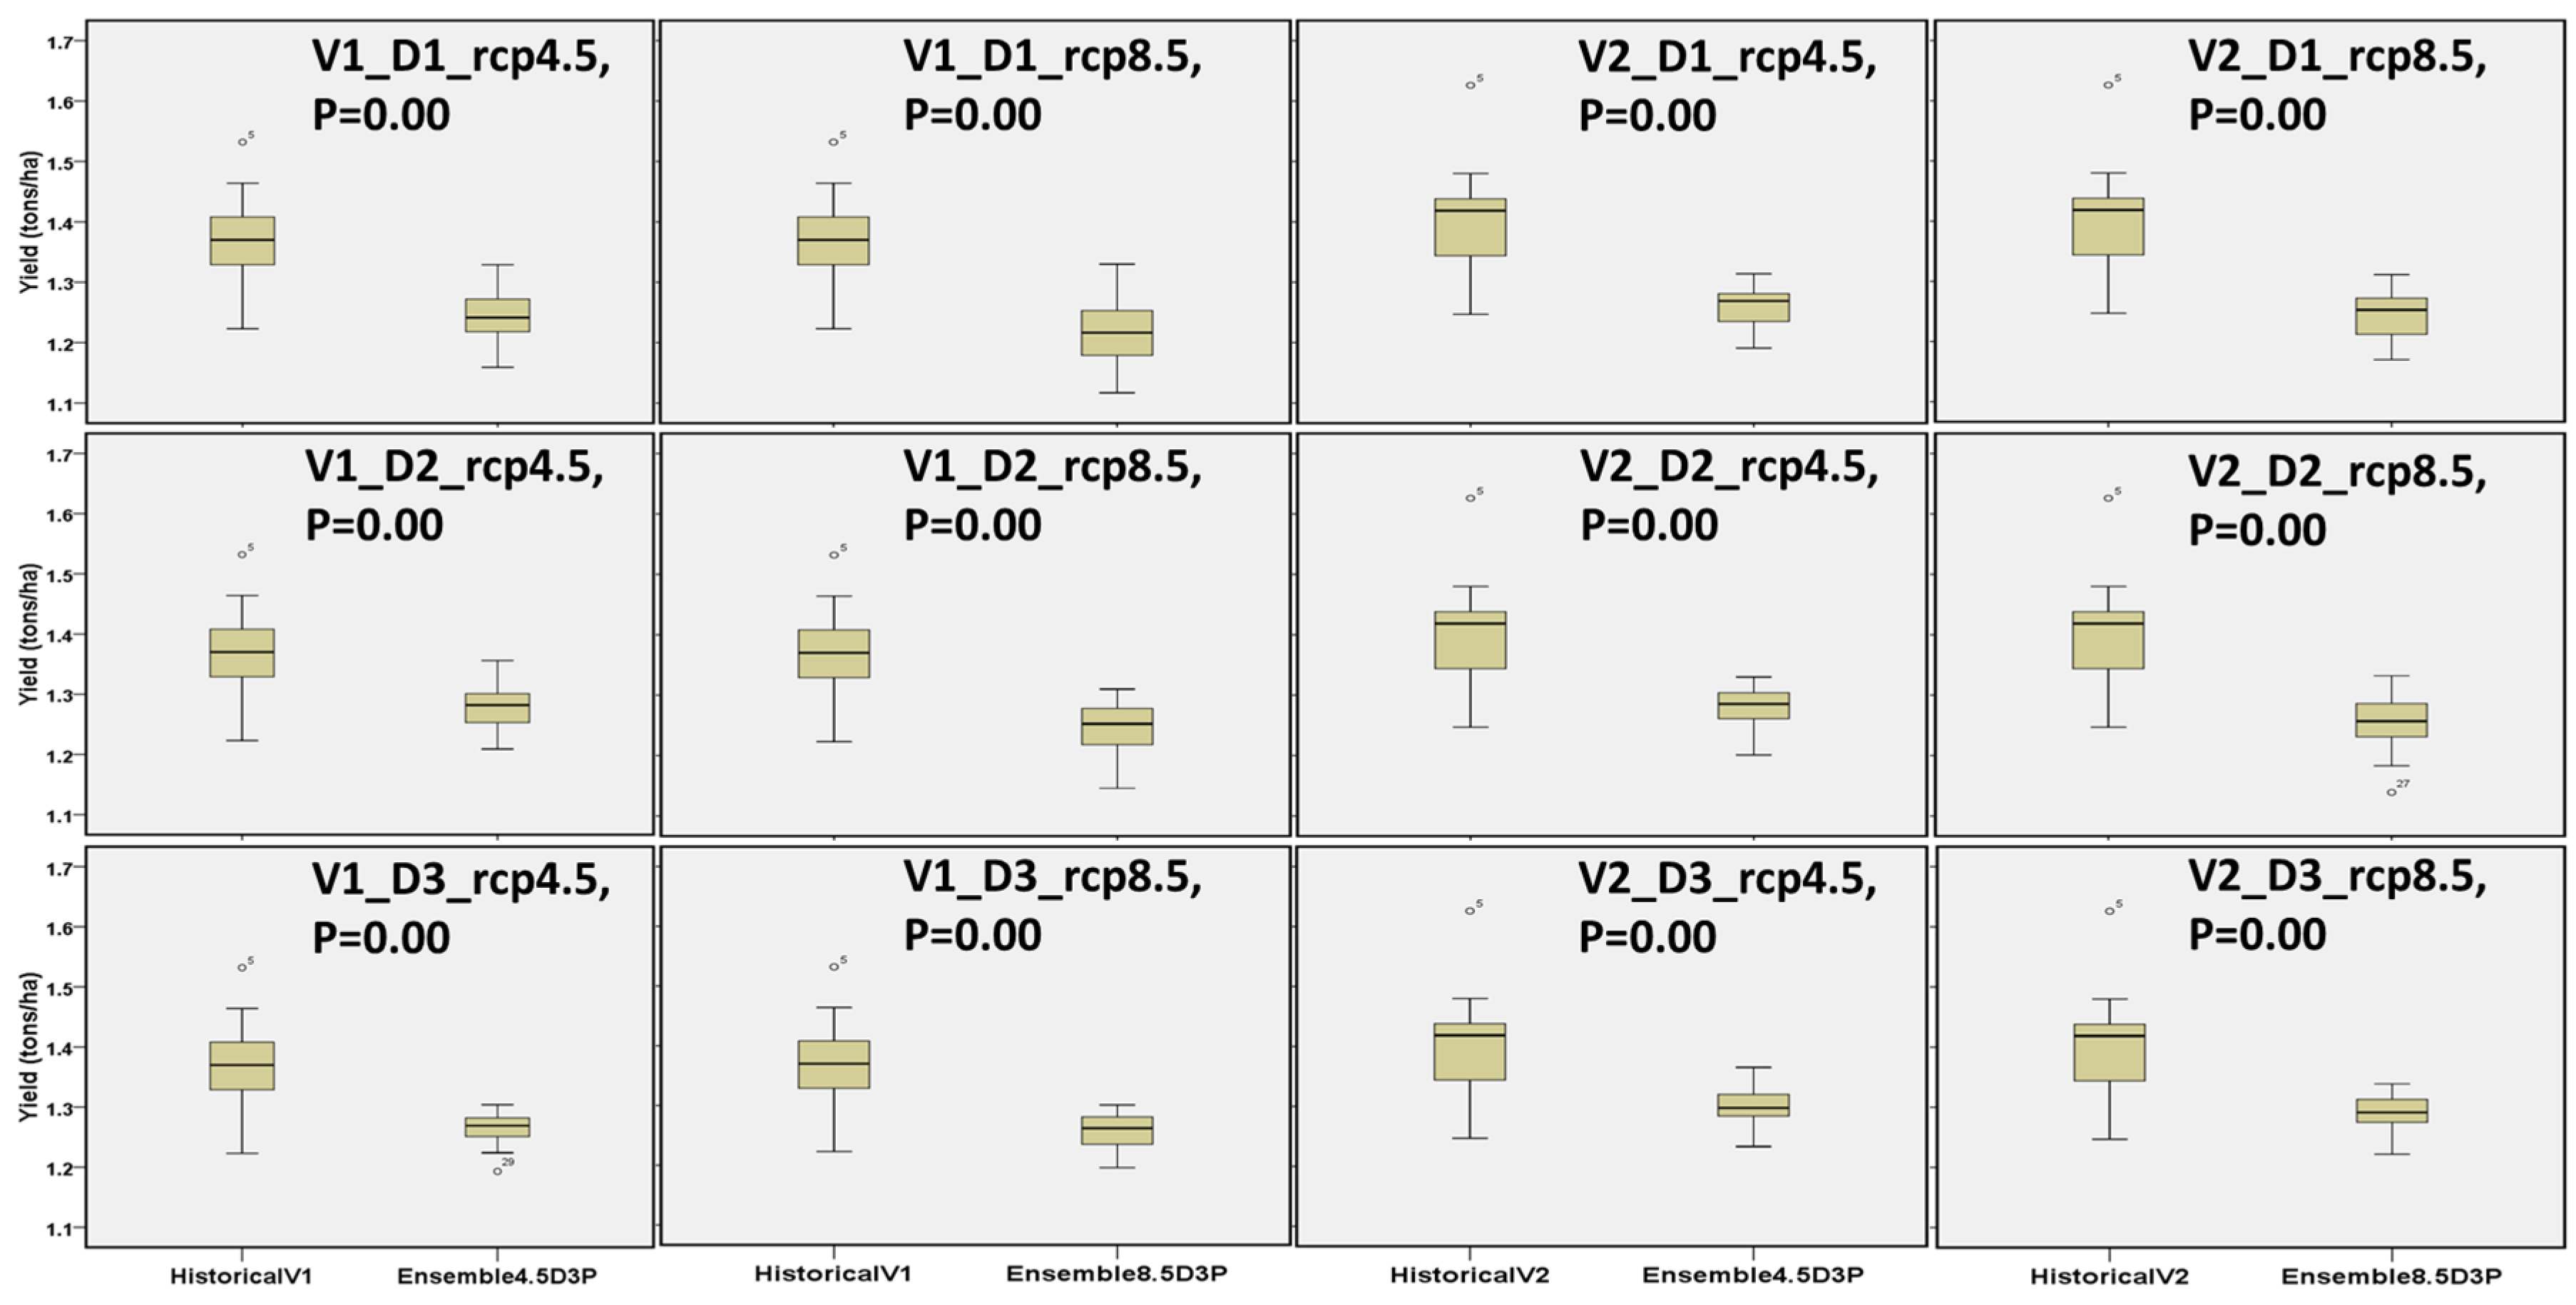
4.3.1. Guinea Agro-Ecological Zones (Southern and Northern Guinea)
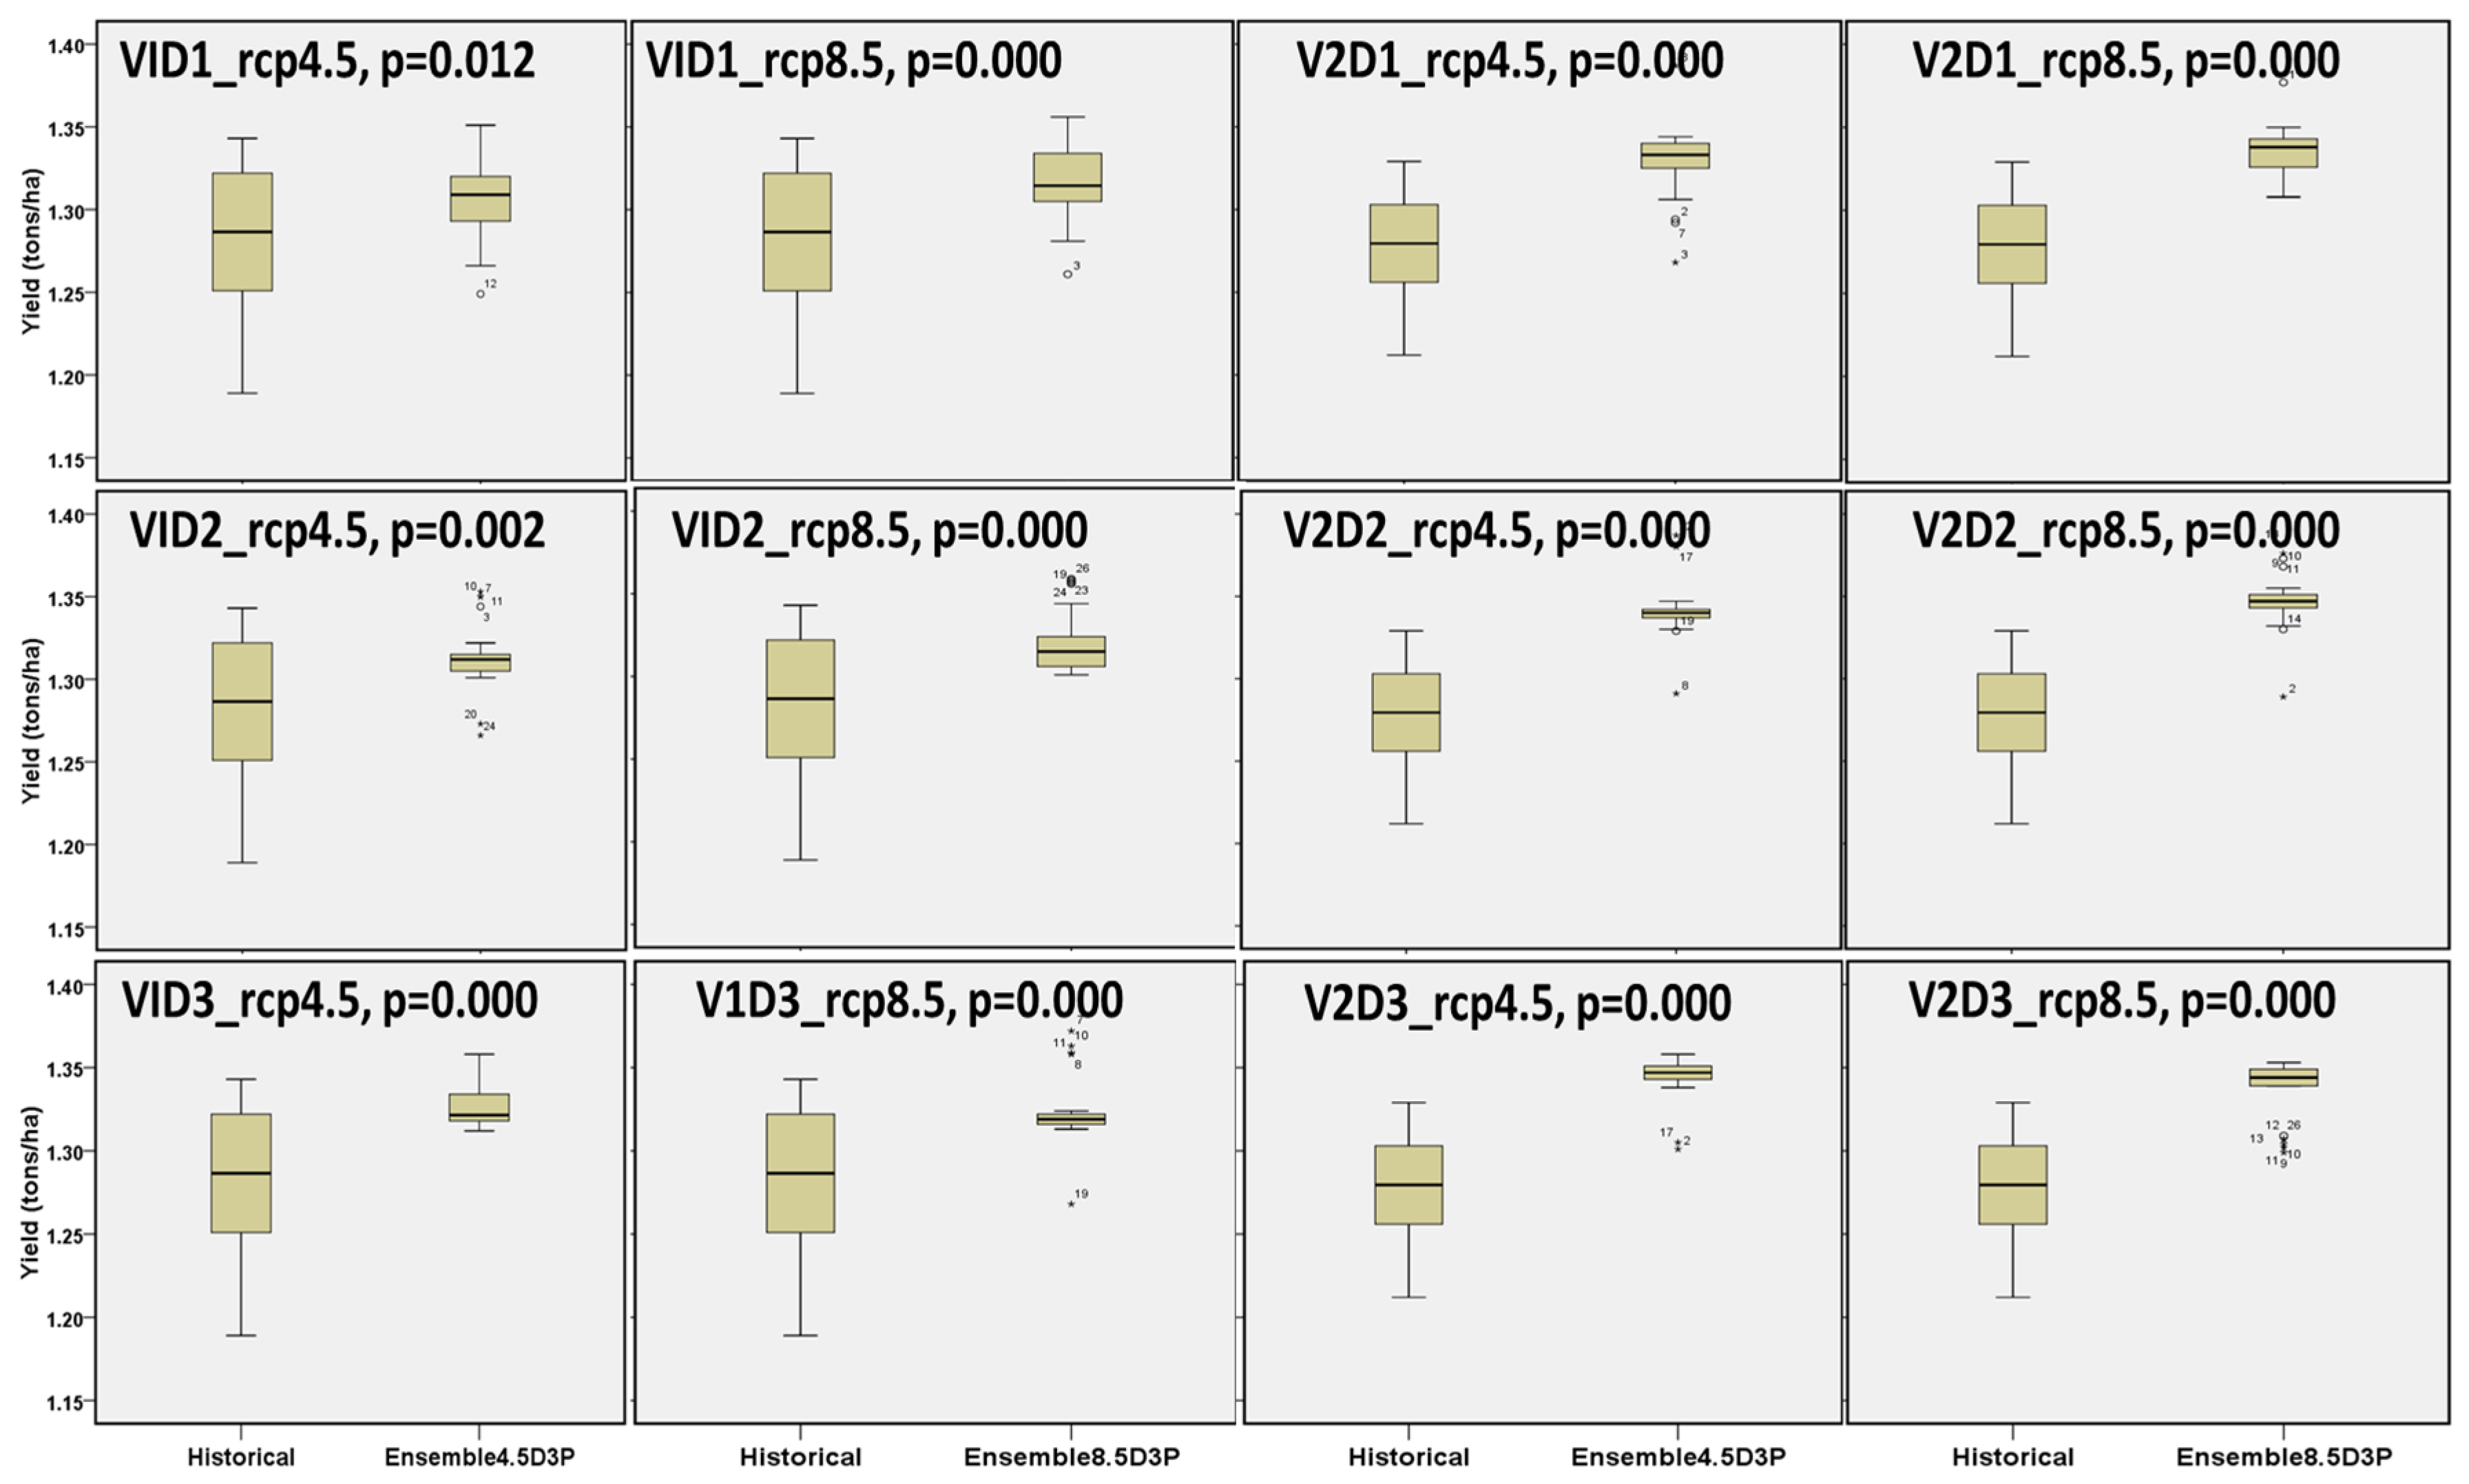
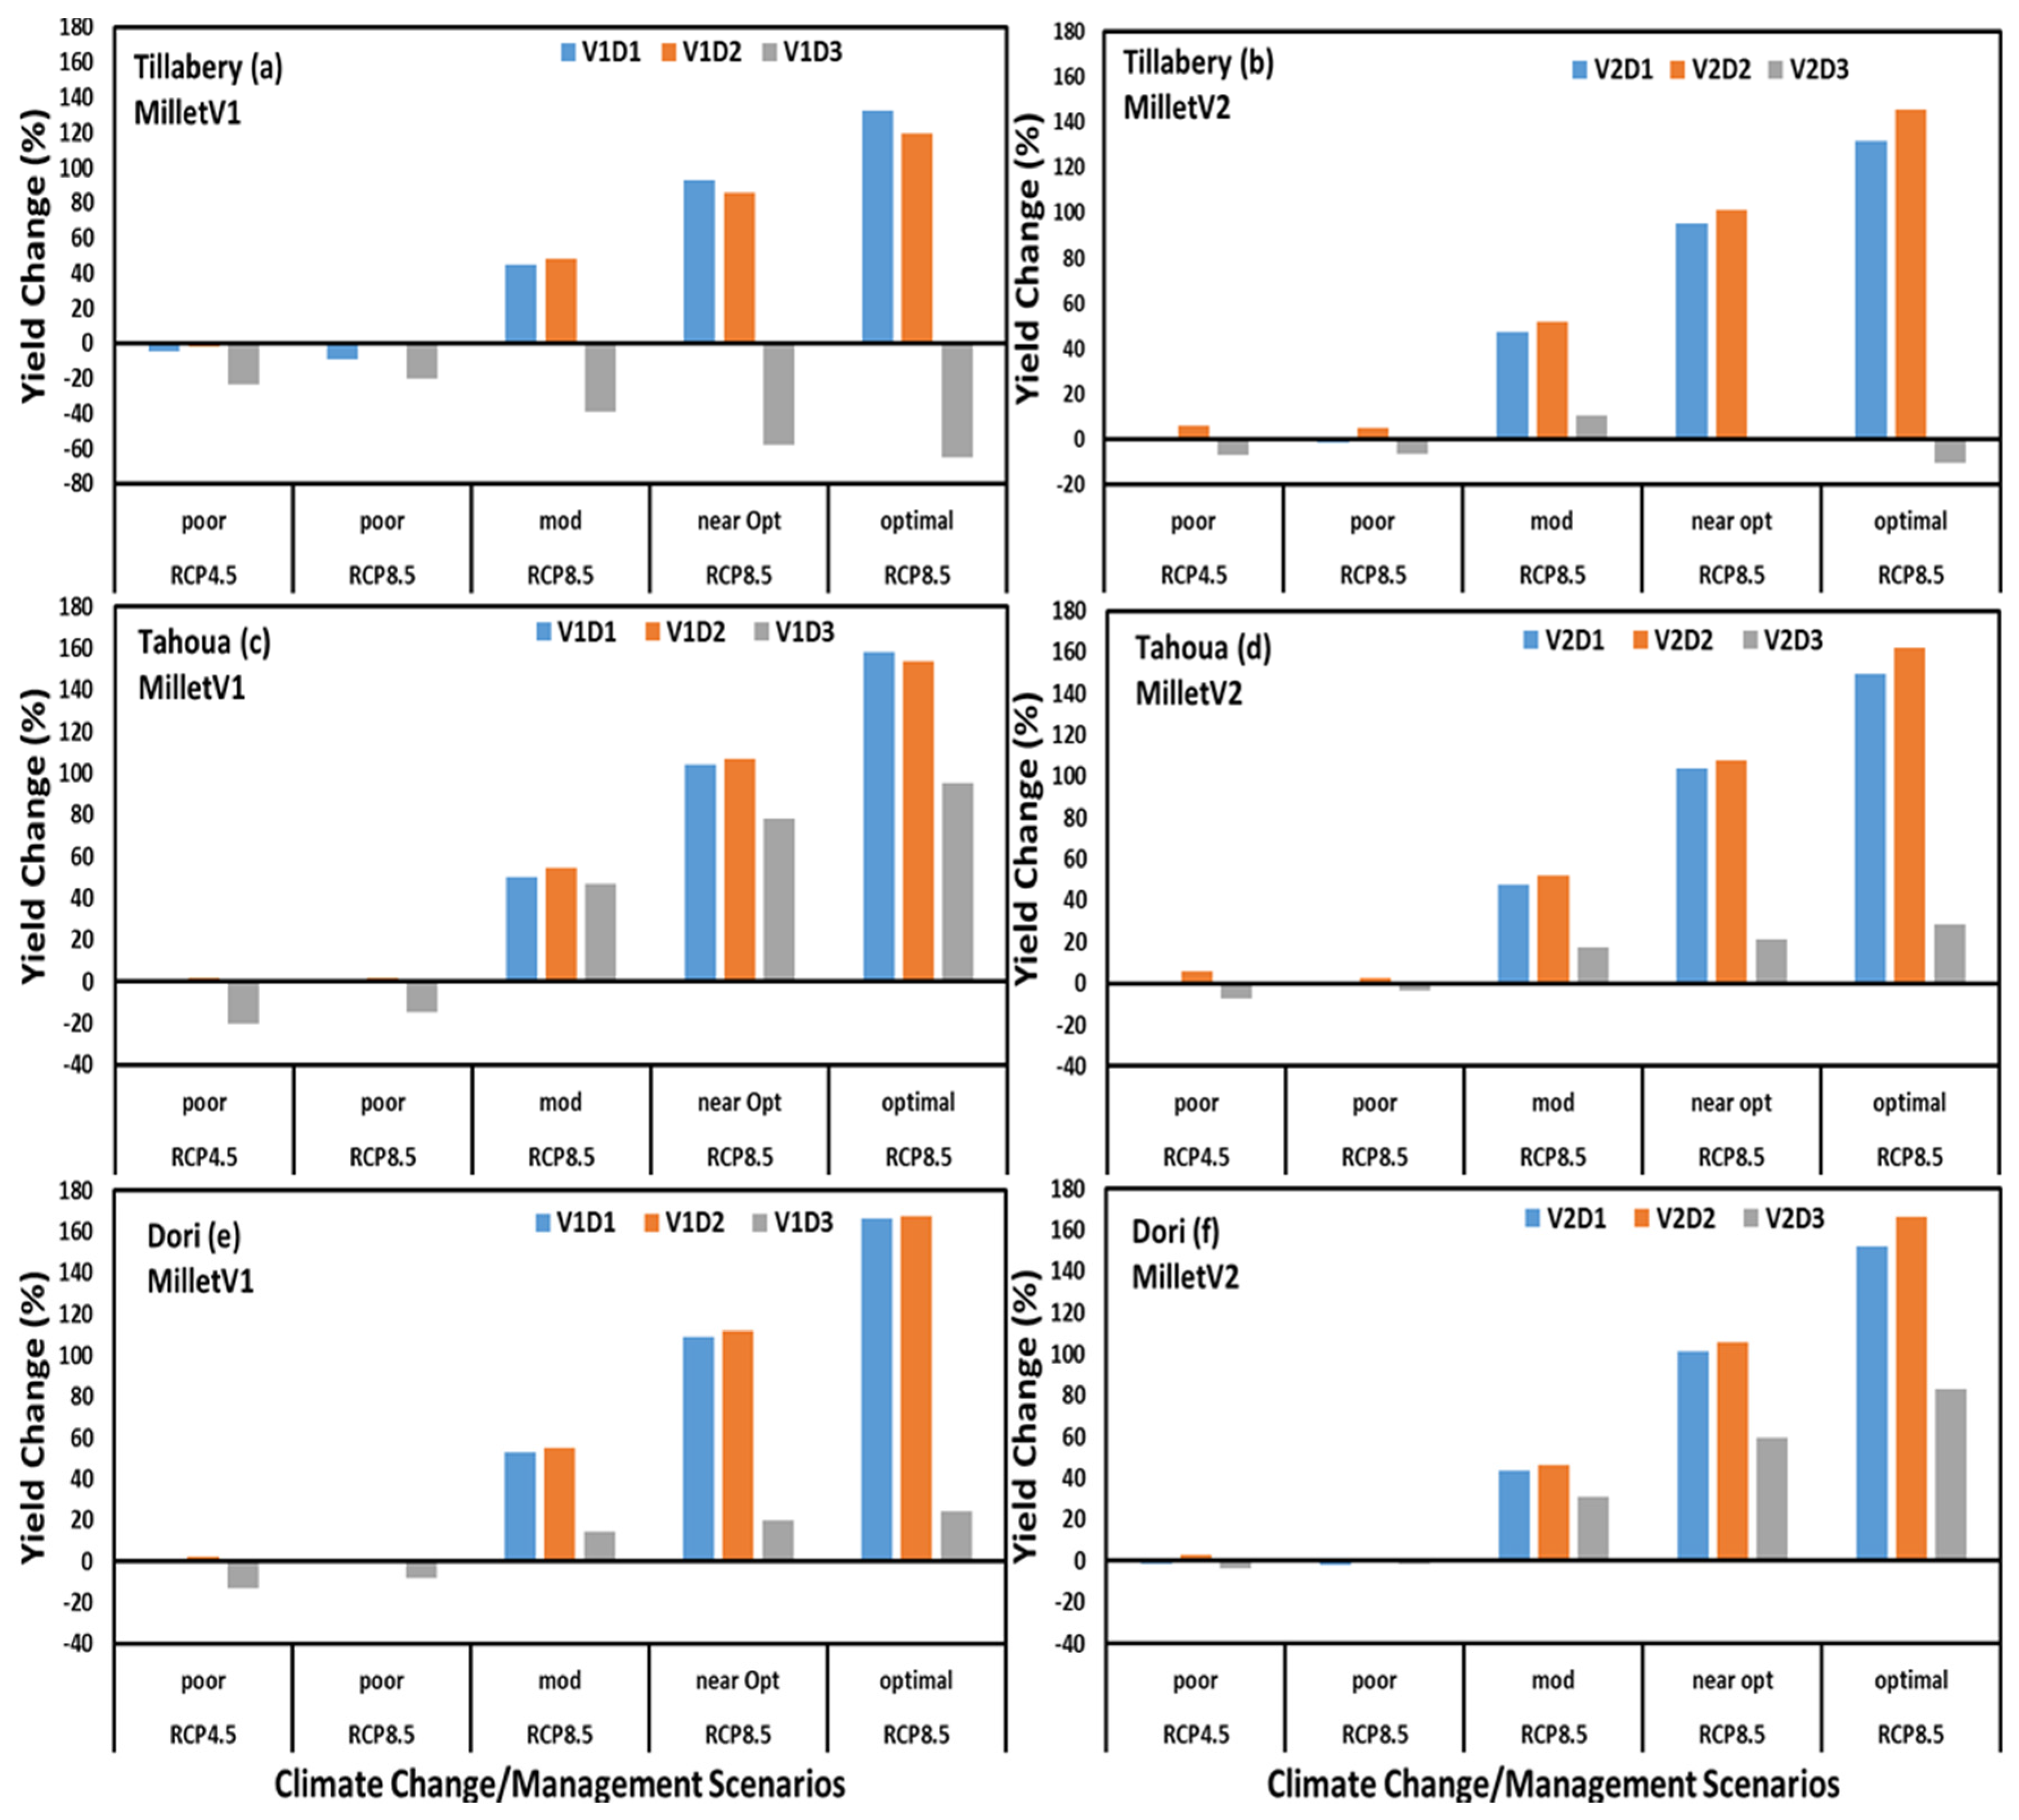
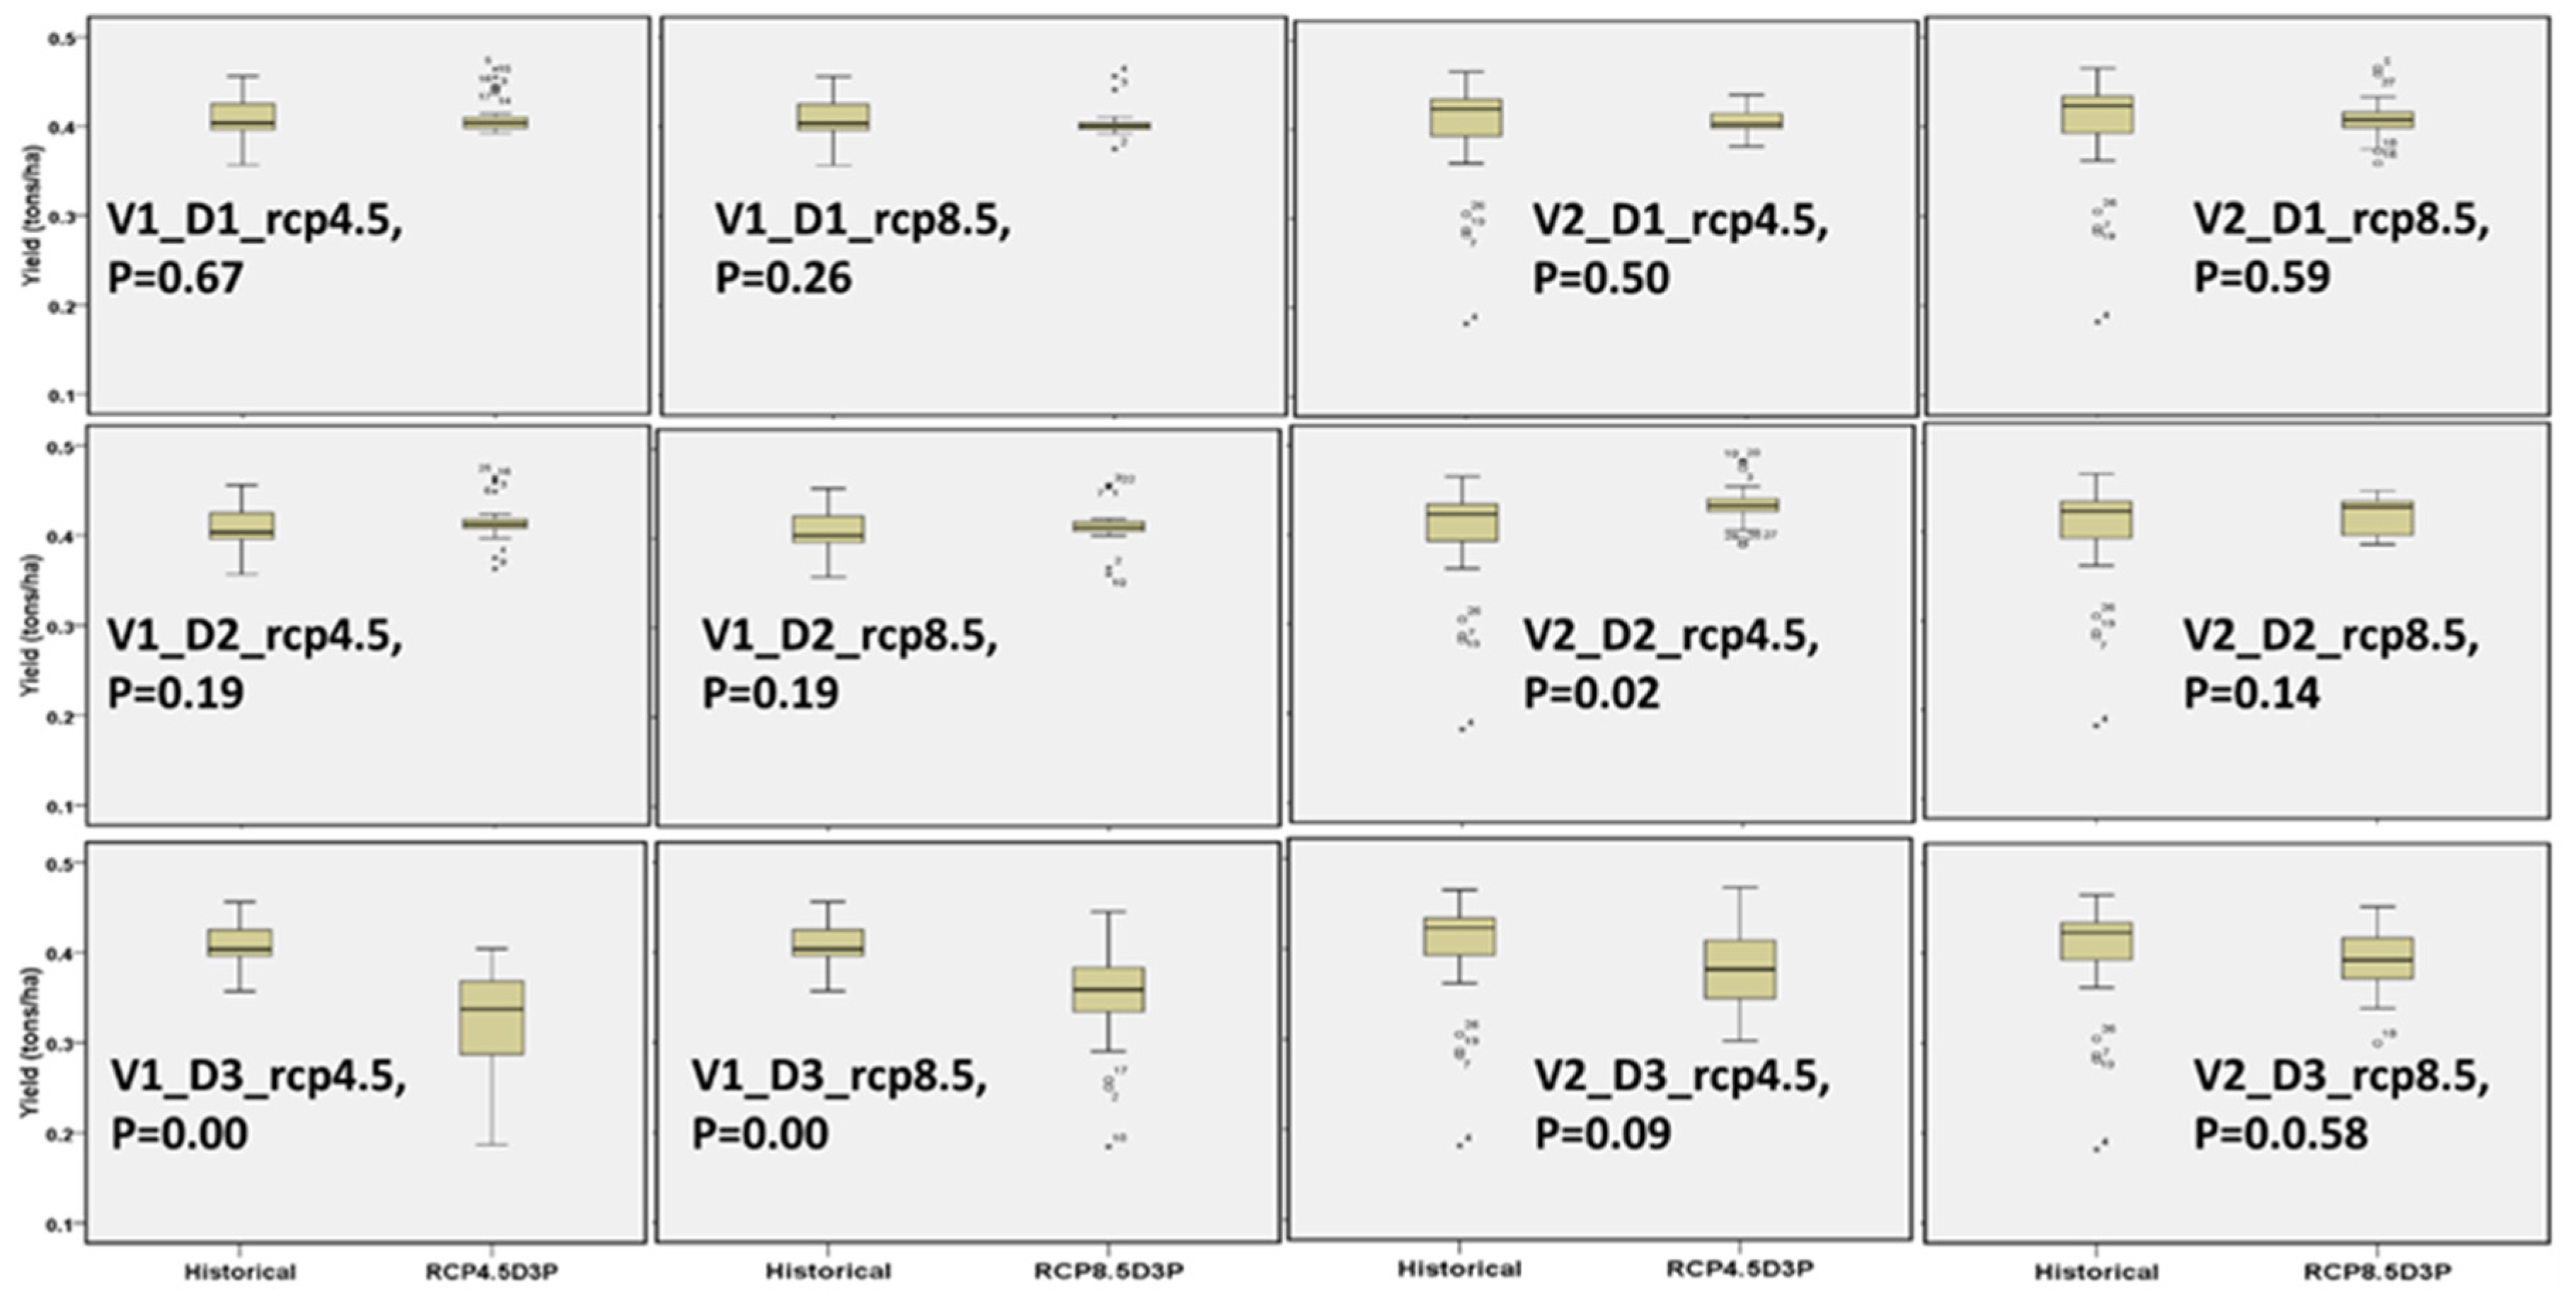
4.3.2. Sahelian Agroecological Zone
5. Conclusions
- There is strong consensus among all models that mean surface temperature in the Niger Basin will increase by between 1.3 °C and 2.3 °C in the Southern Guinea Zone and the Northern Guinea Zone respectively.
- The average ensemble Basin rainfall shows an increase of about 5% for Southern Guinea Zone, 10–20% for Northern Guinea Zone, and 10–15% for the Sahelian zone although there is much less agreement among the models across the locations.
- Climate change effects on maize and sorghum yields are mostly positive (2–6% increase) in the Southern Guinea Zone whereas in the Northern Guinea Zone it is mostly negative (7–20% decrease). Despite increased rainfall, millet yield at the Sahelian Zone generally showed no change under current farmers’ level of fertilization, except at Tillabery where a future yield decrease of up to 10% occurred.
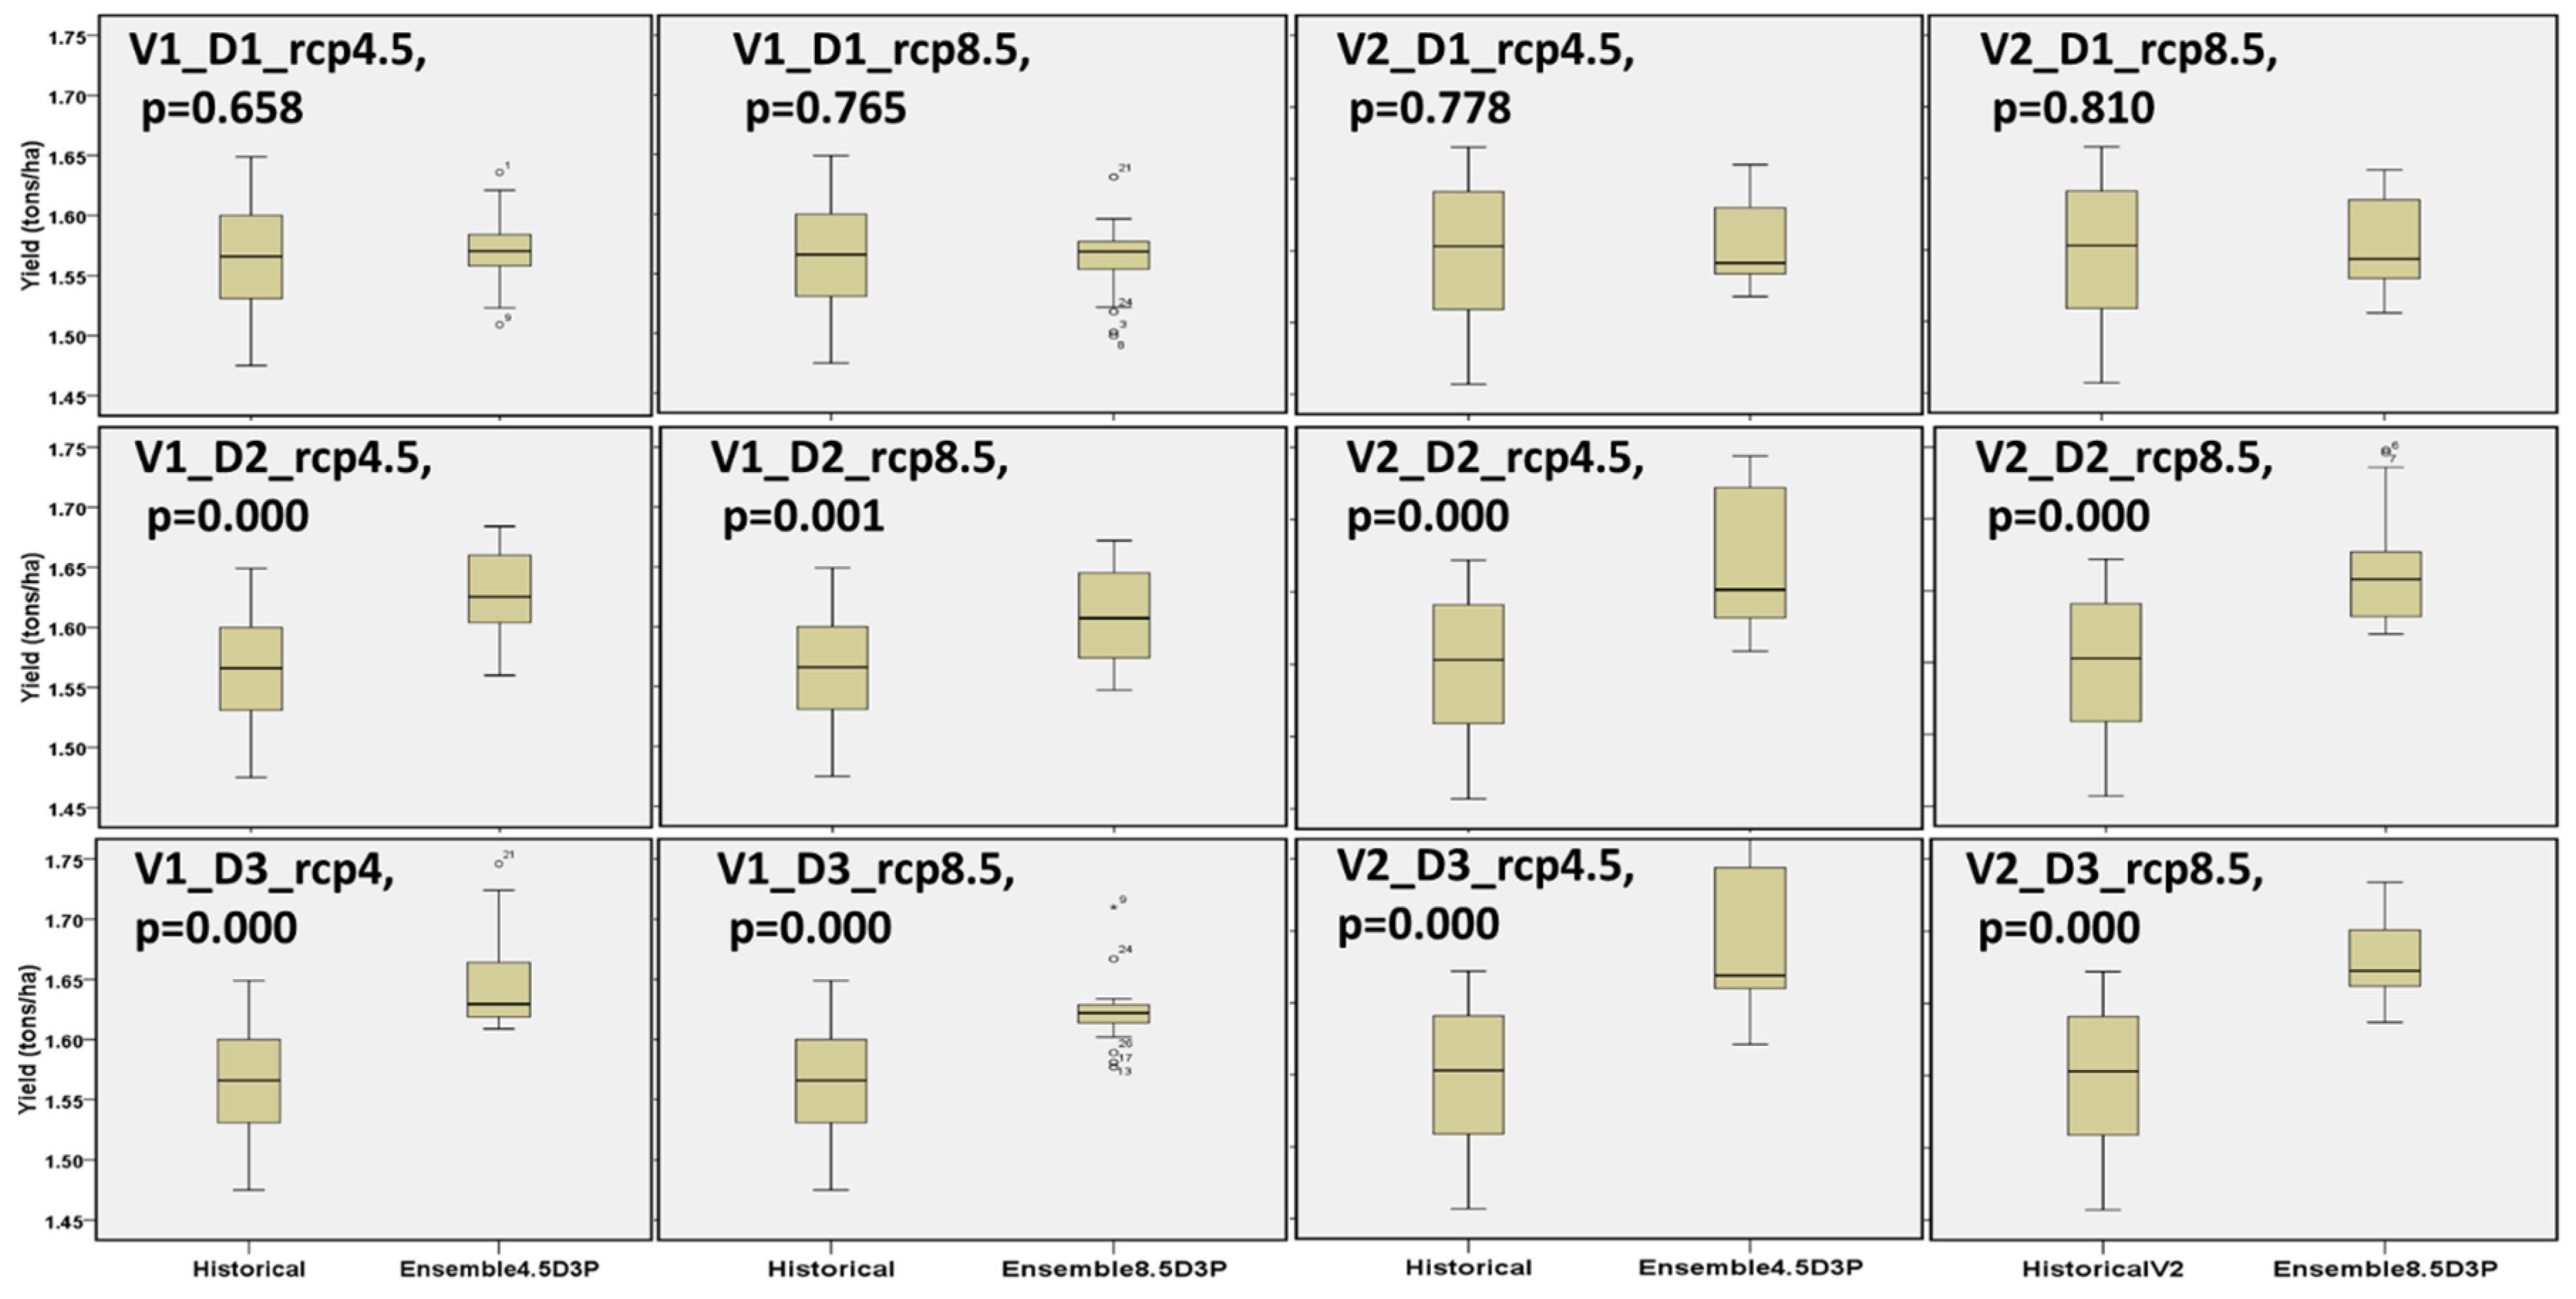
- Changing planting dates results in significant positive yield change in all agro-ecological zones except for the Sahelian zone where delaying planting to late planting date (D3) leads to crop failures. In addition, changing crop cultivar results in significant positive yield change in all agro-ecological zones.
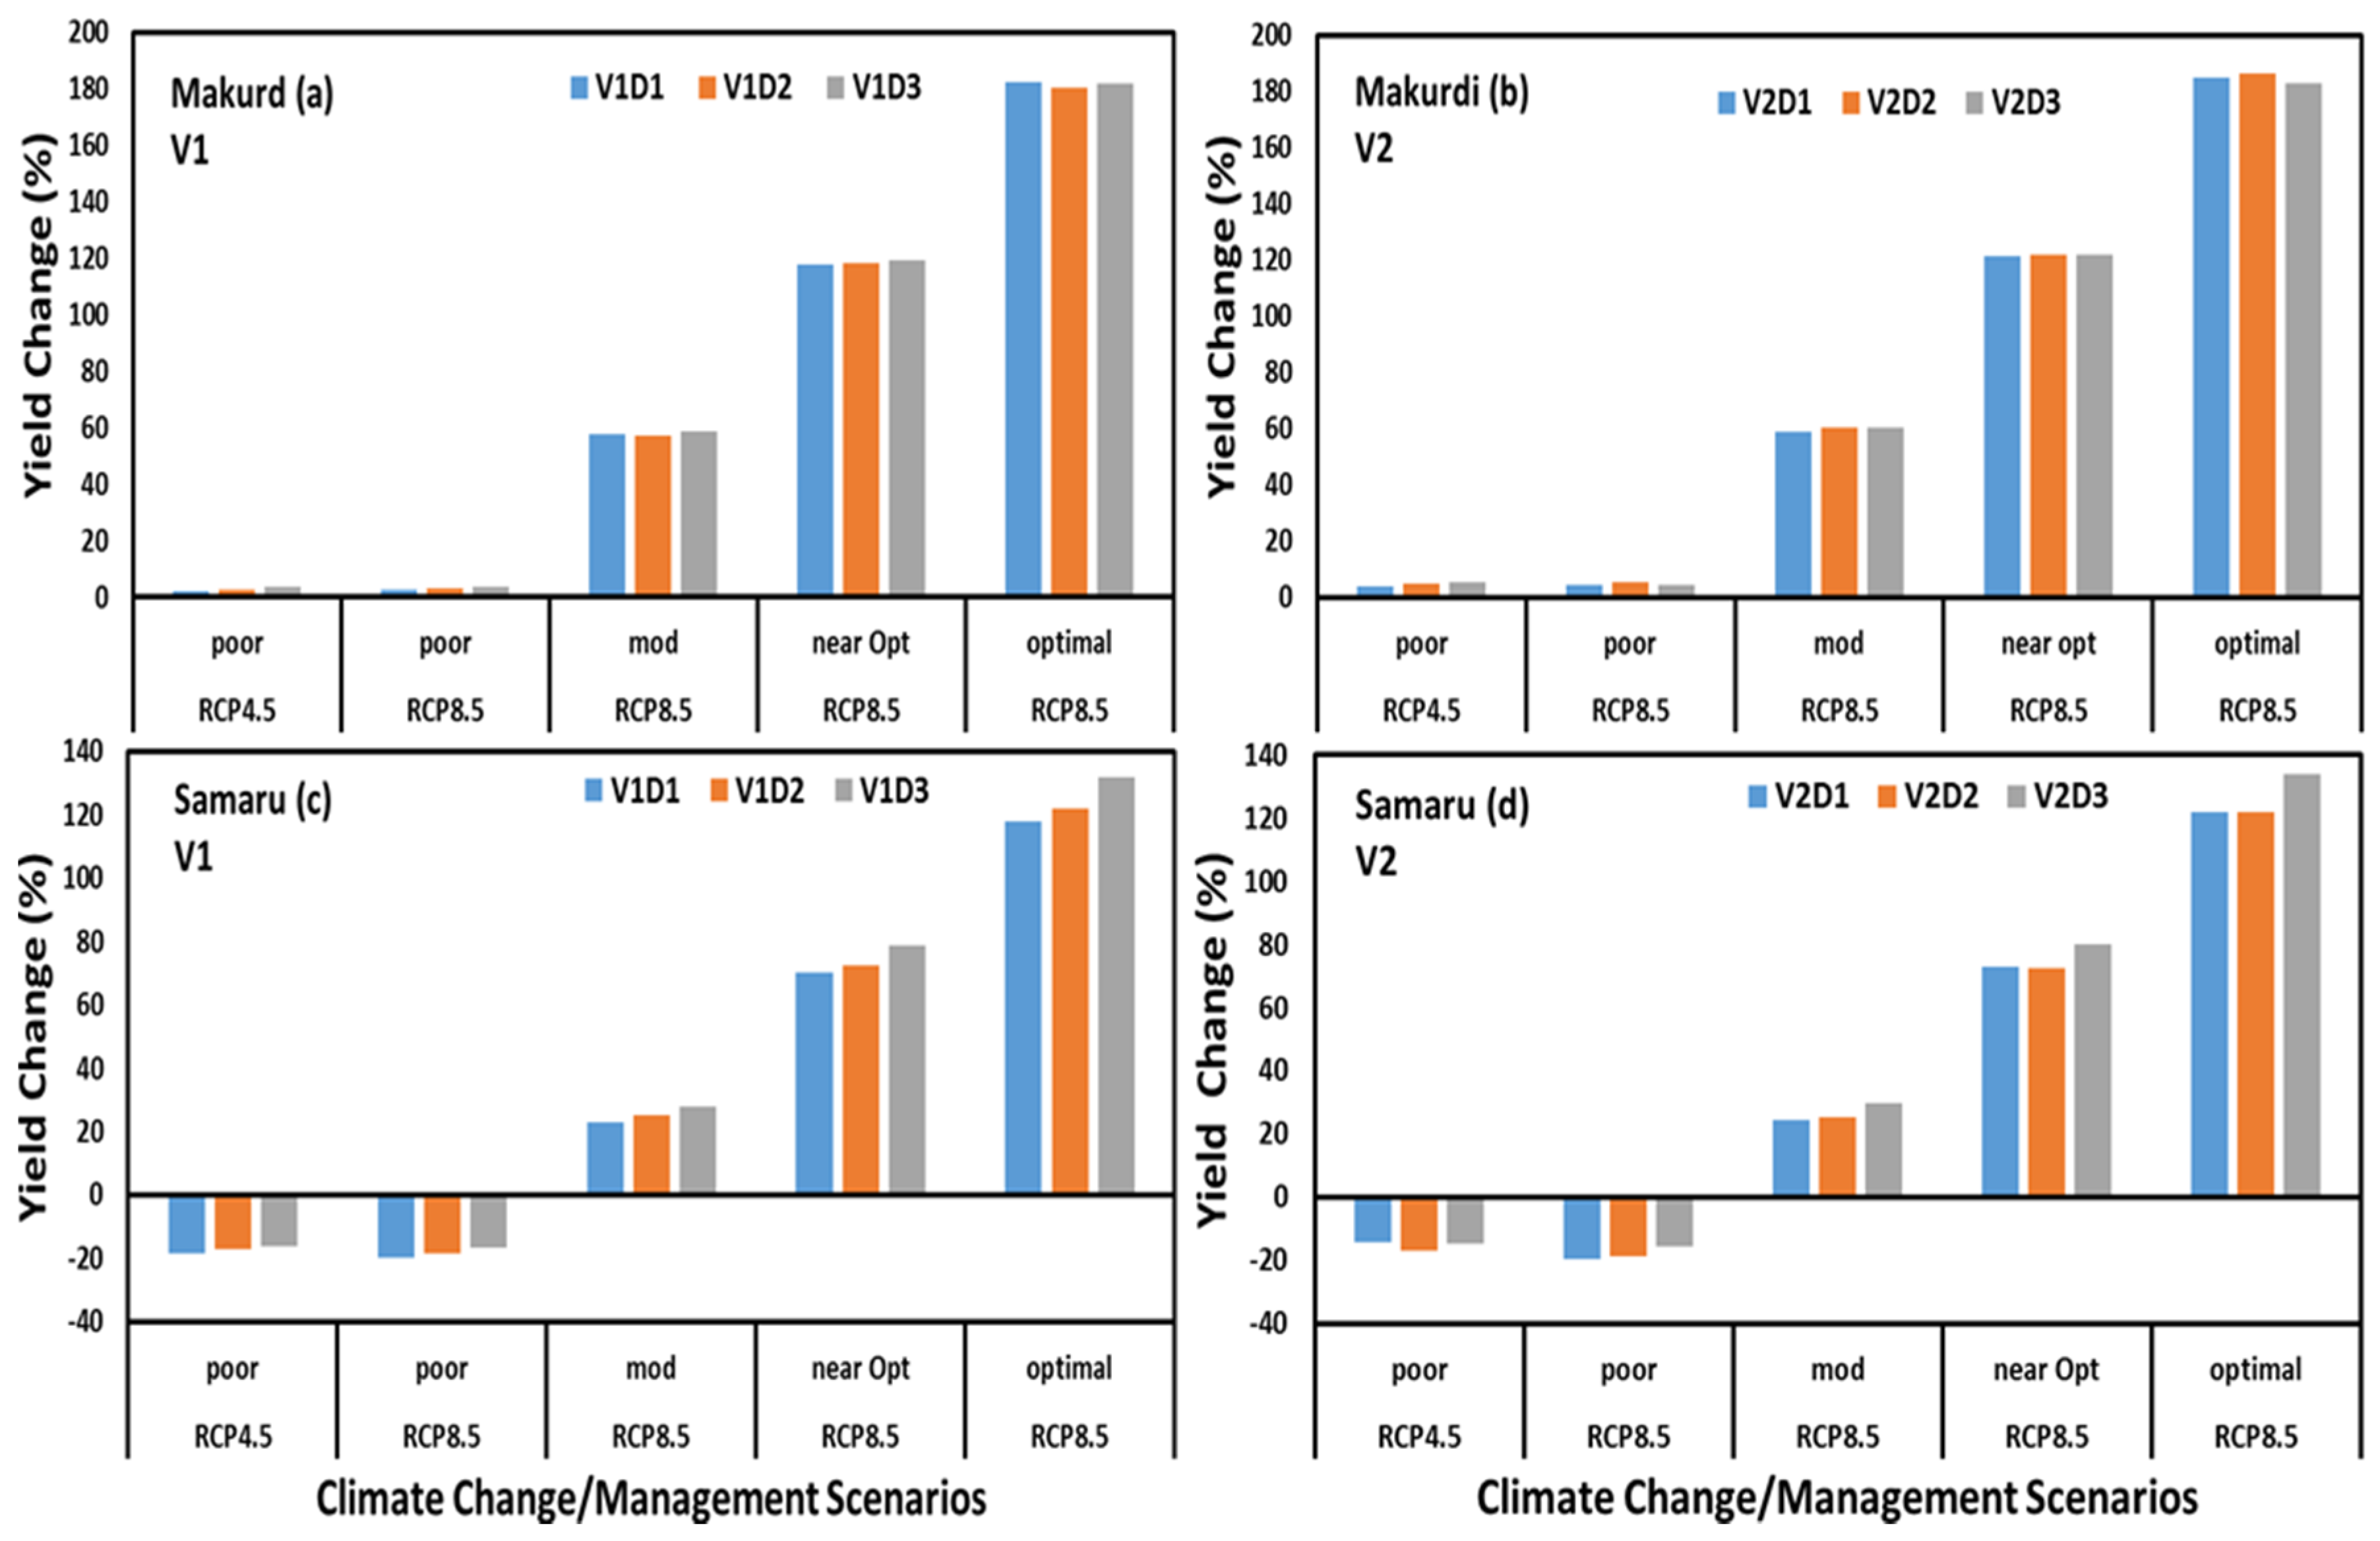
- Increasing soil fertility is the single most important adaptation farmers in the Niger Basin can make in response to climate change. For all crops and zones investigated, crop yields increased by 20%, 70%, and 180% for moderate fertility, near optimal fertility and optimal fertility under 8.5 scenarios for both cultivars, and planting dates.
- Finally, the effects of climate change on crop yields are considerable and pose serious risks not just to farmers but regional food security, especially given rapidly growing population in West Africa which necessitates increasing food production several folds. Ultimately, the solution lies in mitigating the causes of climate change. In the meantime, this study suggests that yield losses can be substantially alleviated through several adaptation measures, notably changing planting dates, changing crop cultivars and most importantly, increasing fertilizer use on farms. These changes are well within the ability of policy makers and a majority of smallholder farmers.
Supplementary Materials
Acknowledgments
Author Contributions
Conflicts of Interest
References
- Schlenker, W.; Lobell, D.B. Robust negative impacts of climate change on African agriculture. Environ. Res. Lett. 2010, 5, 1–8. [Google Scholar] [CrossRef]
- Rosenzweig, C.; Elliott, J.; Deryng, D.; Ruane, A.C.; Muller, C.; Arneth, A.; Boote, K.J.; Folberth, C.; Glotter, M.; Khabarov, N.; et al. Assessing agricultural risks of climate change in the 21st century in a global gridded crop model intercomparison. Proc. Natl. Acad. Sci. USA 2013, 111, 3268–3273. [Google Scholar] [CrossRef] [PubMed]
- Sultan, B.; Guan, K.; Kouressy, M.; Biasutti, M.; Piani, C.; Hammer, G.L.; McLean, G.; Lobell, D.B. Robust features of future climate change impacts on sorghum yields in West Africa. Environ. Res. Lett. 2014, 9, 1–13. [Google Scholar] [CrossRef] [Green Version]
- International Food Policy Research Institute (IFPRI). Climate Change: Impact on Agriculture and Costs of Adaptation; International Food Policy Research Institute: Washington, DC, USA, 2009; pp. 1–16. [Google Scholar]
- Müller, C.; Bondeau, A.; Popp, A.; Waha, K.; Fader, M. Climate Change Impacts on Agricultural Yields. Background Note to the World Development Report 2010; Potsdam Institute for Climate Impact Research: Potsdam, Germany, 2010. [Google Scholar]
- Thornton, P.K.; Jones, P.G.; Ericksen, P.J.; Challinor, A.J. Agriculture and food systems in sub-Saharan Africa in a 4 °C+ world. Philos. Trans. R. Soc. A 2011, 369, 117–136. [Google Scholar] [CrossRef] [PubMed]
- Sanchez, P.A. Tripling crop yields in tropical Africa. Nat. Geosci. 2010, 3, 299–300. [Google Scholar] [CrossRef]
- Knox, J.; Hess, T.; Daccache, A.; Wheeler, T. Climate Change impacts on crop productivity in Africa and South Asia. Environ. Res. Lett. 2012, 7, 1–8. [Google Scholar] [CrossRef]
- FAO. FAO Statistics. 2017. Available online: http://www.fao.org (accessed on 7 February 2017).
- FAO. The State of Food Insecurity in the World: Eradicating World Hunger-Taking Stock Ten Years after the World Food Summit; FAO: Rome, Italy, 2006; pp. 4–41. [Google Scholar]
- UN (United Nations, Department of Economic and Social Affairs, Population Division). World Population Prospects: The 2012 Revision, Key Findings and Advance Tables; Working Paper No. ESA/P/WP.227; United Nations: New York, NY, USA, 2013; pp. 1–50. [Google Scholar]
- Rockström, J.; Falkenmark, M. Comment on increasing water harvesting in Africa: Meeting global food needs requires strategies for storing rainwater and retaining soil moisture to bridge dry spells. Nature 2015, 519, 283–285. [Google Scholar] [CrossRef] [PubMed]
- Tingem, M.; Rivington, M. Adaptation for crop agriculture to climate change in Cameroon: Turning on the heat. Mitig. Adapt. Strateg. Glob. Chang. 2009, 14, 153–168. [Google Scholar] [CrossRef]
- Lahmar, R.; Bationo, B.D.; Lamso, D.; Guero, Y.; Tittonell, P. Tailoring conservation agriculture technologies to West African semi-arid zones: Building on traditional local practices for soil restoration. Field Crop. Res. 2012, 132, 158–167. [Google Scholar] [CrossRef]
- Blanc, E. The impact of climate change on crop yields in Sub-Saharan Africa. Am. J. Clim. Chang. 2012, 1, 1–13. [Google Scholar] [CrossRef]
- Challinor, A.J.; Wtson, J.; Lobell, D.B.; Howden, S.M.; Smith, D.R.; Chhetri, N. A meta-analysis of crop yield under climate change and adaptation. Nat. Clim. Chang. 2014, 4, 287–291. [Google Scholar] [CrossRef]
- Raes, D.; Steduto, P.; Hsiao, T.C.; Fereres, E. AquaCrop—The FAO crop model to simulate yield response to water: II. Main Algorithms and Software description. Agron. J. 2009, 101, 438–447. [Google Scholar] [CrossRef]
- Hsiao, T.C.; Heng, L.K.; Steduto, P.; Rojas, B.; Raes, D.; Fereres, E. AquaCrop—The FAO crop model to simulate yield response to water: III. Parameterization and testing for maize. Agron. J 2009, 101, 448–459. [Google Scholar] [CrossRef]
- Araya, A.; Kaesstra, S.D.; Stroosnijder, L. Simulating yield response to water of Teff (Eragrostis tef) with FAO’s AquaCrop model. Field Crop. Res. 2010, 116, 196–204. [Google Scholar] [CrossRef]
- Van Gaelen, H.; Tsegay, A.; Delbecque, N.; Shrestha, N.; Garcia, M.; Fajardo, H.; Miranda, R.; Vanuytrecht, E.; Abrha, B.; Dies, J.; et al. Semi-quantitative approach for modelling crop response to soil fertility: Evaluation of the AquaCrop procedure. J. Agric. Sci. 2015, 153, 1218–1233. [Google Scholar] [CrossRef]
- Akumaga, U.; Tarhule, A.; Yusuf, A.A. Validation and testing of the FAO AquaCrop model under different levels of nitrogen fertilizer on rainfed maize in Nigeria, West Africa. Agric. For. Meteorol. 2017, 232, 225–234. [Google Scholar] [CrossRef]
- Tarhule, A.; Zume, J.T.; Grijsen, J.; Talbi-Jordan, A.; Guero, A.; Dessouassi, R.Y.; Doffou, H.; Kone, S.; Coulibaly, B.; Harshadeep, N.R. Exploring temporal hydroclimatic variability in the Niger Basin (1901–2006) using observed and gridded data. Int. J. Climatol. 2015, 35, 520–539. [Google Scholar] [CrossRef]
- Andersen, I.; Dione, O.; Jarosewich-Holder, M.; Olivry, J.C. The Niger River Basin: A Vision for Sustainable Management; Golitzen, K.G., Ed.; World Bank: Washington, DC, USA, 2005; Available online: www.worldbank.org (accessed on 12 August 2017).
- Tarhule, A. Climate Change Adaptation in Developing Countries: Beyond Rhetoric. In Climate Variabilty: Some Aspects, Challenges and Prospects; Hannachi, A., Ed.; InTech: Croatia, Balkans, 2011. [Google Scholar]
- Tarhule, A.; Saley-Bana, Z.; Lamb, P.J. Rainwatch: A Prototype GIS for Rainfall Monitoring in West Africa. Bull. Am. Meteorol. Soc. 2009, 90, 1607–1614. [Google Scholar] [CrossRef]
- Adejuwon, J.O. Food crop production in Nigeria II. Potentials effects of climate change. Clim. Res. 2006, 32, 229–245. [Google Scholar]
- Jalloh, A.; Nelson, G.C.; Thomas, T.S.; Zougmore, R.; Roy-Macauley, H. (Eds.) West African Agriculture and Climate Change: A Comprehensive Analysis; International Food Policy Research Institute: Washington, DC, USA, 2013; pp. 1–363. [Google Scholar]
- Steduto, P.; Hsiao, T.C.; Raes, D.; Fereres, E. AquaCrop—The FAO crop model to simulate yield response to water: I. Concepts and underlying principles. Agron. J. 2009, 101, 426–437. [Google Scholar]
- FAO. The ETo Calculator: Reference Manual, Version 3.2. 2012. Available online: http://www.fao.org/nr/water/docs/ReferenceManualV32.pdf (accessed on 30 April 2014).
- Nikulin, G.; Jones, C.; Giorgi, F.; Asrar, G.; Buchner, M.; Cerezo-Mota, R.; Christensen, O.B.; Deque, M.; Fernandez, J.; Hansler, A.; et al. Precipitation climatology in an ensemble of CORDEX-Africa Regional climate simulation. J. Clim. 2012, 25, 6057–6078. [Google Scholar] [CrossRef]
- Gbobaniyi, E.; Sarr, A.; Sylla, M.B.; Diallo, I.; Lennard, C.; Dosio, A.; Dhiediou, A.; Kamga, A.; Klutse, N.A.B.; Hewitson, B. Climatology, annual cycle and interannual variability of precipitation and temperature in CORDEX simulations over West Africa. Int. J. Climatol. 2014, 34, 2241–2257. [Google Scholar] [CrossRef]
- Piani, C.; Weedon, G.P.; Best, M.; Gomes, S.M.; Viterbo, P.; Hagemann, S.; Haerter, J.O. Statistical bias correction of global simulated daily precipitation and temperature for the application of hydrological models. J. Hydrol. 2010, 395, 199–215. [Google Scholar] [CrossRef]
- Haerter, J.O.; Eggert, B.; Moseley, C.; Piani, C.; Berg, P. Statistical precipitation bias correction of gridded model data using point measurements. Geophys. Res. Lett. 2015, 42, 1919–1929. [Google Scholar] [CrossRef]
- Heng, L.K.; Evett, S.R.; Howell, T.A.; Hsiao, T.C. Validating the FAO AquaCrop model for irrigated and water deficit field Maize. Agron. J. 2009, 101, 488–498. [Google Scholar] [CrossRef]
- Willmott, C.J. On the validation of models. Phys. Geogr. 1981, 2, 184–194. [Google Scholar]
- Willmott, C.J. Some comments on the evaluation of model performance. Bull. Am. Meteorol. Soc. 1982, 63, 1309–1313. [Google Scholar] [CrossRef]
- Jamieson, P.D.; Porter, J.R.; Wilson, D.R. A test of the computer simulation model ARC-WHEAT1 on wheat crops grown in New Zealand. Field Crop. Res. 1991, 27, 337–350. [Google Scholar] [CrossRef]
- Singh, J.; Knapp, H.V.; Demissie, M. Hydrologic Modeling of the Iroquois River Watershed Using HSPF and SWAT; ISWS CR 2004-08; Illinois State Water Survey: Champaign, IL, USA, 2004. [Google Scholar]
- IPCC. Climate Change 2014: Synthesis Report. Contribution of Working Groups I, II, III to the Fifth Assessment Report of the Intergovernmental Panel on Climate Change; Cambridge University Press: Cambridge, UK, 2014. [Google Scholar]
- Washington, R.; Hawcroft, M. Climate Change in West African Agriculture: Recent Trends, Current Projections, Crop—Climate Suitability, and Prospects for Improved Climate Model Information; CGIAR Research Program on Climate Change, Agriculture and Food Security (CCAFS): Copenhagen, Denmark, 2012; Volume 303. [Google Scholar]
- Butt, T.A.; McCarl, B.A.; Angerer, J.; Dyke, P.T.; Stuth, J.W. The economic and food security implications of climate change in Mali. Clim. Chang. 2005, 68, 355–378. [Google Scholar] [CrossRef]
- Rockstrom, J.; Hatibu, N.; Oweis, T.; Wani, S.P. Managing water in rainfed agriculture. In Water for Food, Water for Life: A Comprehensive Assessment of Water Management in Agriculture; Molden, D., Ed.; International Water Management Institute (IWMI): Colombo, Sri Lanka, 2007; pp. 315–348. [Google Scholar]
- Jones, P.G.; Thornton, P.K. The potential impacts of climate change on maize production in Africa and Latin America in 2055. Glob. Environ. Chang. 2003, 13, 51–59. [Google Scholar] [CrossRef]
- Roudier, P.; Sultan, B.; Quirion, P.; Berg, A. The impact of future climate change on West African crop Yields: What does the recent literature say? Glob. Environ. Chang. 2011, 21, 1073–1083. [Google Scholar] [CrossRef]
- Traore, B.; Decheemaeker, K.; Van Wijk, M.T.; Corbeels, M.; Supit, I.; Giller, K.E. Modelling cereal crops to assess future climate risk for family food self-sufficiency in Southern Mali. Field Crop. Res. 2017, 201, 133–145. [Google Scholar] [CrossRef]


| Study Site | Agroecological | Data Source | Period |
|---|---|---|---|
| Makurdi | Southern Guinea | BNARDA | 1985–2010 |
| Samaru | Northern Guinea | I.A.R/ABU Zaria/KADP | 1980–2010 |
| N’Tarla | Northern Guinea | IER NTarla | 1985–2010 |
| Tillabery and Tahoua | Sahel | AGRHYMET | 1980–2010 |
| Dori | Sahel | FAO | 1980–2010 |
| Statistics | Makurdi (BNARDA vs. Simulated) Southern Guinea | Samaru (KADP vs. Simulated) Northern Guinea | N’Tarla (N’Tarla vs. Simulated) Northern Guinea | ||
|---|---|---|---|---|---|
| Sorghum Y | Maize Y | Sorghum Y | Maize Y | Sorghum Y | |
| d | 0.379 | 0.978 | 0.858 | 0.821 | 0.948 |
| RMSE, t ha−1 | 0.291 | 0.096 | 0.375 | 0.210 | 0.355 |
| NRMSE (%) | 19.404 | 7.531 | 6.921 | 13.944 | 20.622 |
| MAE, t ha−1 | 0.255 | 0.085 | 0.076 | 0.166 | 0.283 |
| MBE, t ha−1 | 0.064 | 0.005 | −0.012 | 0.091 | −0.058 |
| Statistics | Dori (FAO vs. Simulated) Sahelian Zone | Tahoua (Agryhmet vs. Simulated) Sahelian Zone | Tillabery (Agryhmet vs. Simulated) Sahelian Zone |
|---|---|---|---|
| Millet Yield | Millet Yield | Millet Yield | |
| d | 0.758 | 0.740 | 0.731 |
| RMSE, t ha−1 | 0.131 | 0.063 | 0.071 |
| NRMSE (%) | 21.412 | 15.776 | 17.348 |
| MAE, t ha−1 | 0.113 | 0.042 | 0.0567 |
| MBE, t ha−1 | −0.011 | 0.007 | 0.026 |
| Agroecological Zone | Location | Tmin Ensemble Change (°C) | Tmax Ensemble Change (°C) | Period | ||
|---|---|---|---|---|---|---|
| RCP4.5 | RCP8.5 | RCP4.5 | RCP8.5 | |||
| Southern Guinea | Makurdi | 1.1 | 1.4 | 1.2 | 1.4 | 2025–2050 |
| Northern Guinea | Samaru | 2.5 | 2.9 | 1.8 | 2.2 | 2021–2050 |
| N’tarla | 1.5 | 1.9 | 1.8 | 2.3 | 2025–2050 | |
| Sahelian Zone | Tillabery | 1.7 | 2.1 | 1.8 | 2.2 | 2025–2050 |
| Tahoua | 2.4 | 2.9 | 1.8 | 2.1 | 2021–2050 | |
| Dori | 2.4 | 2.9 | 1.8 | 2.1 | 2021–2050 | |
| Agro-ecological Zone | Location | PCP Ensemble Change (%) | PCP Change (%) Range by Nine Models | Period | ||
|---|---|---|---|---|---|---|
| RCP4.5 | RCP8.5 | RCP4.5 | RCP8.5 | |||
| Southern Guinea | Makurdi | 4.5 | 4.4 | −7 to +22 | −8 to +28 | 2025–2050 |
| Northern Guinea | Samaru | 10.5 | 15.4 | 2 to 29 | 4 to 34 | 2021–2050 |
| N’tarla | 12.0 | 26.5 | 3 to 28 | 2 to 33 | 2025–2050 | |
| Sahelian Zone | Tillabery | 2.0 | 2.8 | −52 to 33 | −50 to 34 | 2025–2050 |
| Tahoua | 12.5 | 18.7 | 6 to 31 | 3 to 40 | 2021–2050 | |
| Dori | 10.3 | 12.9 | −12 to 20 | −0.2 to 22 | 2021–2050 | |
| Maize | Climate Scenarios | Climate Scenarios | Sorghum | Climate Scenarios | Climate Scenarios | ||||||
|---|---|---|---|---|---|---|---|---|---|---|---|
| Adaptation | Factor | Baseline | Rcp4.5 | Y∆ (%) | Rcp8.5 | Y∆ (%) | Baseline | Rcp4.5 | Y∆ (%) | Rcp8.5 | Y∆ (%) |
| Fertility | P | 1.28 | 1.33 | 3.7 | 1.33 | 3.9 | 1.58 | 1.64 | 3.3 | 1.62 | 2.5 |
| M | * | * | * | 2.03 | 58.8 | * | * | * | 2.56 | 61.9 | |
| NP | * | * | * | 2.82 | 120.0 | * | * | * | 3.60 | 127.4 | |
| OP | * | * | * | 3.62 | 182.9 | * | * | * | 4.81 | 203.6 | |
| Cultivar | V1 | 1.28 | 1.32 | 3.1 | 1.33 | 3.9 | 1.57 | 1.62 | 3.2 | 1.60 | 2.0 |
| V2 | 1.28 | 1.34 | 4.7 | 1.34 | 4.7 | 1.60 | 1.65 | 3.3 | 1.65 | 3.0 | |
| Planting D | D1 | 1.28 | 1.32 | 3.1 | 1.33 | 3.9 | 1.58 | 1.59 | 0.3 | 1.58 | 0.0 a |
| D2 | 1.28 | 1.33 | 3.9 | 1.33 | 3.9 | 1.58 | 1.65 | 4.2 | 1.63 | 3.2 | |
| D3 | 1.28 | 1.34 | 4.7 | 1.33 | 3.9 | 1.58 | 1.67 | 5.5 | 1.65 | 4.3 | |
| Maize | Climate Scenarios | Climate Scenarios | Sorghum | Climate Scenarios | Climate Scenarios | |||||
|---|---|---|---|---|---|---|---|---|---|---|
| Factor | Baseline | Rcp4.5 | Y∆ (%) | Rcp8.5 | Y∆ (%) | Baseline | Rcp4.5 | Y∆ (%) | Rcp8.5 | Y∆ (%) |
| P | 1.63 | 1.36 | −16.3 | 1.33 | −18.1 | 1.380 | 1.272 | −7.8 | 1.252 | −9.3 |
| M | * | * | * | 2.05 | 26.0 | * | * | * | 1.983 | 43.7 |
| NP | * | * | * | 2.84 | 74.6 | * | * | * | 2.774 | 101.1 |
| OP | * | * | * | 3.66 | 125.0 | * | * | * | 3.659 | 165.2 |
| V1 | 1.63 | 1.35 | −17.3 | 1.33 | −18.2 | 1.362 | 1.264 | −7.2 | 1.240 | −9.0 |
| V2 | 1.63 | 1.38 | −15.4 | 1.34 | −17.9 | 1.397 | 1.281 | −8.3 | 1.264 | −9.5 |
| D1 | 1.63 | 1.36 | −16.4 | 1.31 | −19.6 | 1.380 | 1.251 | −9.3 | 1.231 | −10.8 |
| D2 | 1.63 | 1.35 | −17.1 | 1.33 | −18.5 | 1.380 | 1.280 | −7.2 | 1.252 | −9.3 |
| D3 | 1.63 | 1.38 | −15.4 | 1.37 | −16.0 | 1.380 | 1.285 | −6.8 | 1.273 | −7.7 |
© 2018 by the authors. Licensee MDPI, Basel, Switzerland. This article is an open access article distributed under the terms and conditions of the Creative Commons Attribution (CC BY) license (http://creativecommons.org/licenses/by/4.0/).
Share and Cite
Akumaga, U.; Tarhule, A.; Piani, C.; Traore, B.; Yusuf, A.A. Utilizing Process-Based Modeling to Assess the Impact of Climate Change on Crop Yields and Adaptation Options in the Niger River Basin, West Africa. Agronomy 2018, 8, 11. https://doi.org/10.3390/agronomy8020011
Akumaga U, Tarhule A, Piani C, Traore B, Yusuf AA. Utilizing Process-Based Modeling to Assess the Impact of Climate Change on Crop Yields and Adaptation Options in the Niger River Basin, West Africa. Agronomy. 2018; 8(2):11. https://doi.org/10.3390/agronomy8020011
Chicago/Turabian StyleAkumaga, Uvirkaa, Aondover Tarhule, Claudio Piani, Bouba Traore, and Ado A. Yusuf. 2018. "Utilizing Process-Based Modeling to Assess the Impact of Climate Change on Crop Yields and Adaptation Options in the Niger River Basin, West Africa" Agronomy 8, no. 2: 11. https://doi.org/10.3390/agronomy8020011