Article

Metabolic Profiling of Phloem Exudates as a Tool to Improve Bread-Wheat Cultivars

1
Laboratorio de Biología Funcional y Biotecnología (CICPBA-BIOLAB AZUL) CIISAS, Facultad de Agronomía, Universidad Nacional del Centro de la Provincia de Buenos Aires (UNCPBA), CONICET-INBIOTEC, Av. Rep. Italia 780, CC 47, 7300 Azul, Province of Buenos Aires, Argentina
2
Biomics Facility, Department of Animal and Plant Sciences, Alfred Denny Building, University of Sheffield, Western Bank, Sheffield S10 2TN, UK
3
Laboratorio de Fisiología Vegetal, Facultad de Ciencias Agrarias, Universidad Nacional de Mar del Plata, Ruta 226 Km 73,5, Balcarce, Provincia de Buenos Aires, y Comisión de Investigaciones Científicas de la Provincia de Buenos Aires, 7620 Balcarce, Province of Buenos Aires, Argentina
*
Author to whom correspondence should be addressed.
Agronomy 2018, 8(4), 45; https://doi.org/10.3390/agronomy8040045
Submission received: 21 February 2018 / Revised: 26 March 2018 / Accepted: 5 April 2018 / Published: 10 April 2018

Abstract

:
In a proof of concept study aimed at showing that metabolites in bread wheat (Triticum aestivum L. ssp. aestivum), phloem exudates have potential as biochemical markers for cultivar discrimination, Argentinean cultivars from three quality groups (groups 1, 2, and 3 of high, intermediate, and low quality, respectively) were grown under two nitrogen (N) availabilities and analysed for metabolic profile by electrospray ionisation mass spectrometry. Data as signal strengths of mass/charge (m/z) values binned to a resolution of 0.2 Daltons were subjected to principal component analysis and orthogonal projections to latent structures discriminant analysis. Certain bins were influential in discriminating groups taken in pairs and some were involved in separating all three groups. In high N availability, group 3 cultivars clustered away from the other cultivars, while group 1 cultivars clustered tightly together; group 2 cultivars were more scattered between group 1 and group 3 cultivars. In low N availability, the cultivars were not clustered as tightly; nonetheless, group 1 cultivars tended to cluster together and mainly separated from those of group 2. m/z values also showed potential for discrimination between N availability. In conclusion, phloem exudate metabolic profiles could provide biochemical markers for selection during breeding and for discerning the effects of N fertiliser application.

1. Introduction

The aim of the work reported in this paper was to examine whether metabolic profiling of wheat phloem exudates could be used to discriminate between cultivars with different bread-making qualities and to discern the effects of nitrogen (N) fertiliser application. Since the development of the wheat grain depends on the supply of nutrients in the phloem [1], such measurements could potentially also provide insights into aspects such as N use efficiency. The identification of biochemical markers useful for discriminatory purposes and for selecting combinations of good quality, high yield, and good tolerance to biotic and abiotic stresses appears feasible [2]. Metabolic profiling has been used to distinguish between leaf and fruit extracts of species and cultivars of tomato and examine the effects of N on metabolism in these organs [3,4,5].
In bread wheat (Triticum aestivum L. ssp. aestivum), one important target trait for improvement is grain protein content (GPC), which is one of the determinants of international market price [1]. Argentinean wheat cultivars are currently classified into three quality groups for bread-making based upon a range of tests, including grain protein content, wet gluten content, properties in the alveograph and farinograph, and loaf volume. Group 1 is the best quality (including wheats that can be blended with others to correct their visco-elastic properties and that are suitable for industrial bread-making), and group 3, the poorest quality, which tends to include high-yielding cultivars of deficient quality for bread-making (suitable for only short fermentation times, of less than eight hours). Group 2 is of intermediate quality, including cultivars that are not correctors and that are suitable for traditional bread-making and for fermentation of more than eight hours. Groups 1, 2, and 3 are expected to rank from high to low for protein content and other quality traits [6], and phloem composition would be expected to be related to such differences.
Soil or foliar applications of N, applied at different rates and stages of growth, are commonly used to improve GPC. One of the principal contributors to GPC is the process of remobilisation from leaves during organ senescence, but N runoff from soils creates environmental issues. Barneix [1] demonstrated that more than 50–70% of final grain N is accumulated by the plant before anthesis and is remobilised to the grain later. The relationship between the N supplied and that absorbed by the plant is not linear; rather, there is a limit to the potential GPC, which lowers fertiliser use efficiency when high N doses are supplied. The concentration of free amino acids in the phloem acts as a signal to the roots that indicates the N status of the plant, which activates or inhibits NO3 uptake by the plant. As a consequence, N metabolism in the shoot dictates the rate of NO3 uptake [1]. The concentration of the majority of the amino acids in phloem exudates is proportional to the concentration in the leaves [7], if no pathogens are involved [8].
The concentration of the majority of the amino acids in phloem exudates is proportional to the concentration in the leaves [7], if no pathogens are involved [8]. Grain filling is mainly dependent on remobilisation from the flag leaf and the adjacent leaf. Furthermore, the final GPC has been correlated with the amount of free amino acids in the flag leaf during grain filling [9,10]. Therefore, the analysis of the metabolites present in the phloem exudates provides a valid indicator of the compounds that will be present in the future grains and of the effect of N fertilisation, given that secondary metabolites serve as a N reserve [11].
These relationships, showing the potential importance for the quality of phloem exudate composition, gave rise to the current work. Since direct injection mass spectrometry (DIMS) through electrospray ionisation time-of-flight (ESI-TOF-MS) provides a rapid method to obtain an initial metabolic profile of samples [3,12], it was chosen as an approach for profile analysis of phloem exudate samples in this proof of concept study.

2. Materials and Methods

2.1. Experimental Design

The field trial was carried out at the Experimental Field of the Faculty of Agronomy, UNCPBA (Lat.: 36°45′ S; Long.: 59°50′ W; Height above sea level: 132 m) situated on the Ruta Nacional No. 3 Km 307, in Azul, Province of Buenos Aires, Argentina.
The trial was a randomised complete block design with three replicate blocks, with a split plot design where the main plot was N fertiliser level and the sub-plot was cultivar. Eight cultivars of contrasting quality were sown: ‘ACA 304’, ‘Klein Proteo’, and ‘Buck Meteoro’ of group 1 (high bread-making quality); ‘Bio 3003’, ‘Bio 1000’, and ‘Buck Malevo’ of group 2 (medium bread-making quality); and ‘Klein Gavilán’ and ‘Klein Guerrero’ of group 3 (low bread-making quality). These cultivars have been previously evaluated for quality traits [13,14,15,16,17,18,19], amongst others.
Soil N content before fertilisation was approximately 35 kg N per hectare and the field area was fertilised with triple superphosphate (100 ppm) prior to sowing. Sowing date was adjusted according to the cultivar cycle (short or long) with the aim of ensuring that the cultivars arrived simultaneously at the required physiological stage for extracting phloem exudates. Plots measured 9.5 m × 2.8 m and sowing density was 350 plants/m2. Half of each plot, randomly designated, was fertilised to achieve 100 ppm of N availability as urea by hand broadcasting. The herbicide DICAMBA-SPA was applied for weed control. At exudate sampling the plants showed good general health status, with differences in colour intensity between the well-fertilised treatments compared to the rest.

2.2. Extraction Method

Phloem exudate extraction was done according to Urquhart and Joy [20] as modified in [21]. Samples were taken when the flag leaf was fully expanded, which occurred within a lapse of eight days covering all cultivars, meaning the different sowing dates for short and long cycled cultivars resulted in the desired limited range of dates for the expanded leaf physiological stage, minimising the effect of the cycle.
The exudates should mainly reveal the contents of the phloem; while we cannot rule out the possibility of xylem contents and cellular leakage also occurring in the samples, such contamination would be expected to be slight [20,22]. The flag leaf and the adjacent leaf were harvested according to [21]. The extremes were cut and complete leaves kept for 15 min in a 20 mm pH 6 ethylenediaminetetraacetic acid (EDTA) solution, which was subsequently discarded to minimise such contamination. Leaves were washed in new EDTA solution for one minute and then left for three hours in a new aliquot of the EDTA solution to allow the phloem to exude. The whole procedure was carried out in the dark to minimise leaf transpiration and absorption of the solution by the xylem. The exudates were stored at −4 °C and lyophilised to −40 °C and 76 mm Hg for 24 h.

2.3. Sample Processing

Samples were resuspended in 1 mL of H2O and an aliquot of 20 μL was diluted in 100 μL of methanol, 0.1 μL of formic acid, and distilled water to a final volume of 200 μL. The samples were analysed by direct injection mass spectrometry (DIMS) through electrospray ionisation time-of-flight (ESI-TOF-MS) using an Applied Systems/MDS Sciex (Foster City, CA, USA) hybrid quadrupole time-of-flight Q-Star Pulsar-I mass spectrometer. For all samples three technical replicates were analysed.
Of the 48 exudate samples (8 cultivars × 3 blocks × 2 N levels), those from ACA 304 without added N (−N) block II, Bio 3003 −N block I, Bio 1000 with added N (+N) block III and Meteoro +N block III went missing during processing.

2.4. Data Analysis

The mass spectra were processed according to Overy et al. [3]. Only mass/charge (m/z) values occurring in all three technical replications were included and the data was binned to a resolution of 0.2 Daltons. The metabolic profiles thus obtained were then analysed by unsupervised statistics using principal component analysis (PCA) with SIMCA14 (Umetrics, Umeå, Sweden). When clustering was observed the data was processed by orthogonal projections to latent structures discriminant analysis (OPLS-DA) to resolve the bins contributing towards the clustering of samples and putative metabolites were assigned to these bins from empirical formulae.
Analysis of variance (ANOVA) was carried out using the software Infogen, Córdoba, Argentina [23], for individual bins between quality groups and between N availability.

3. Results

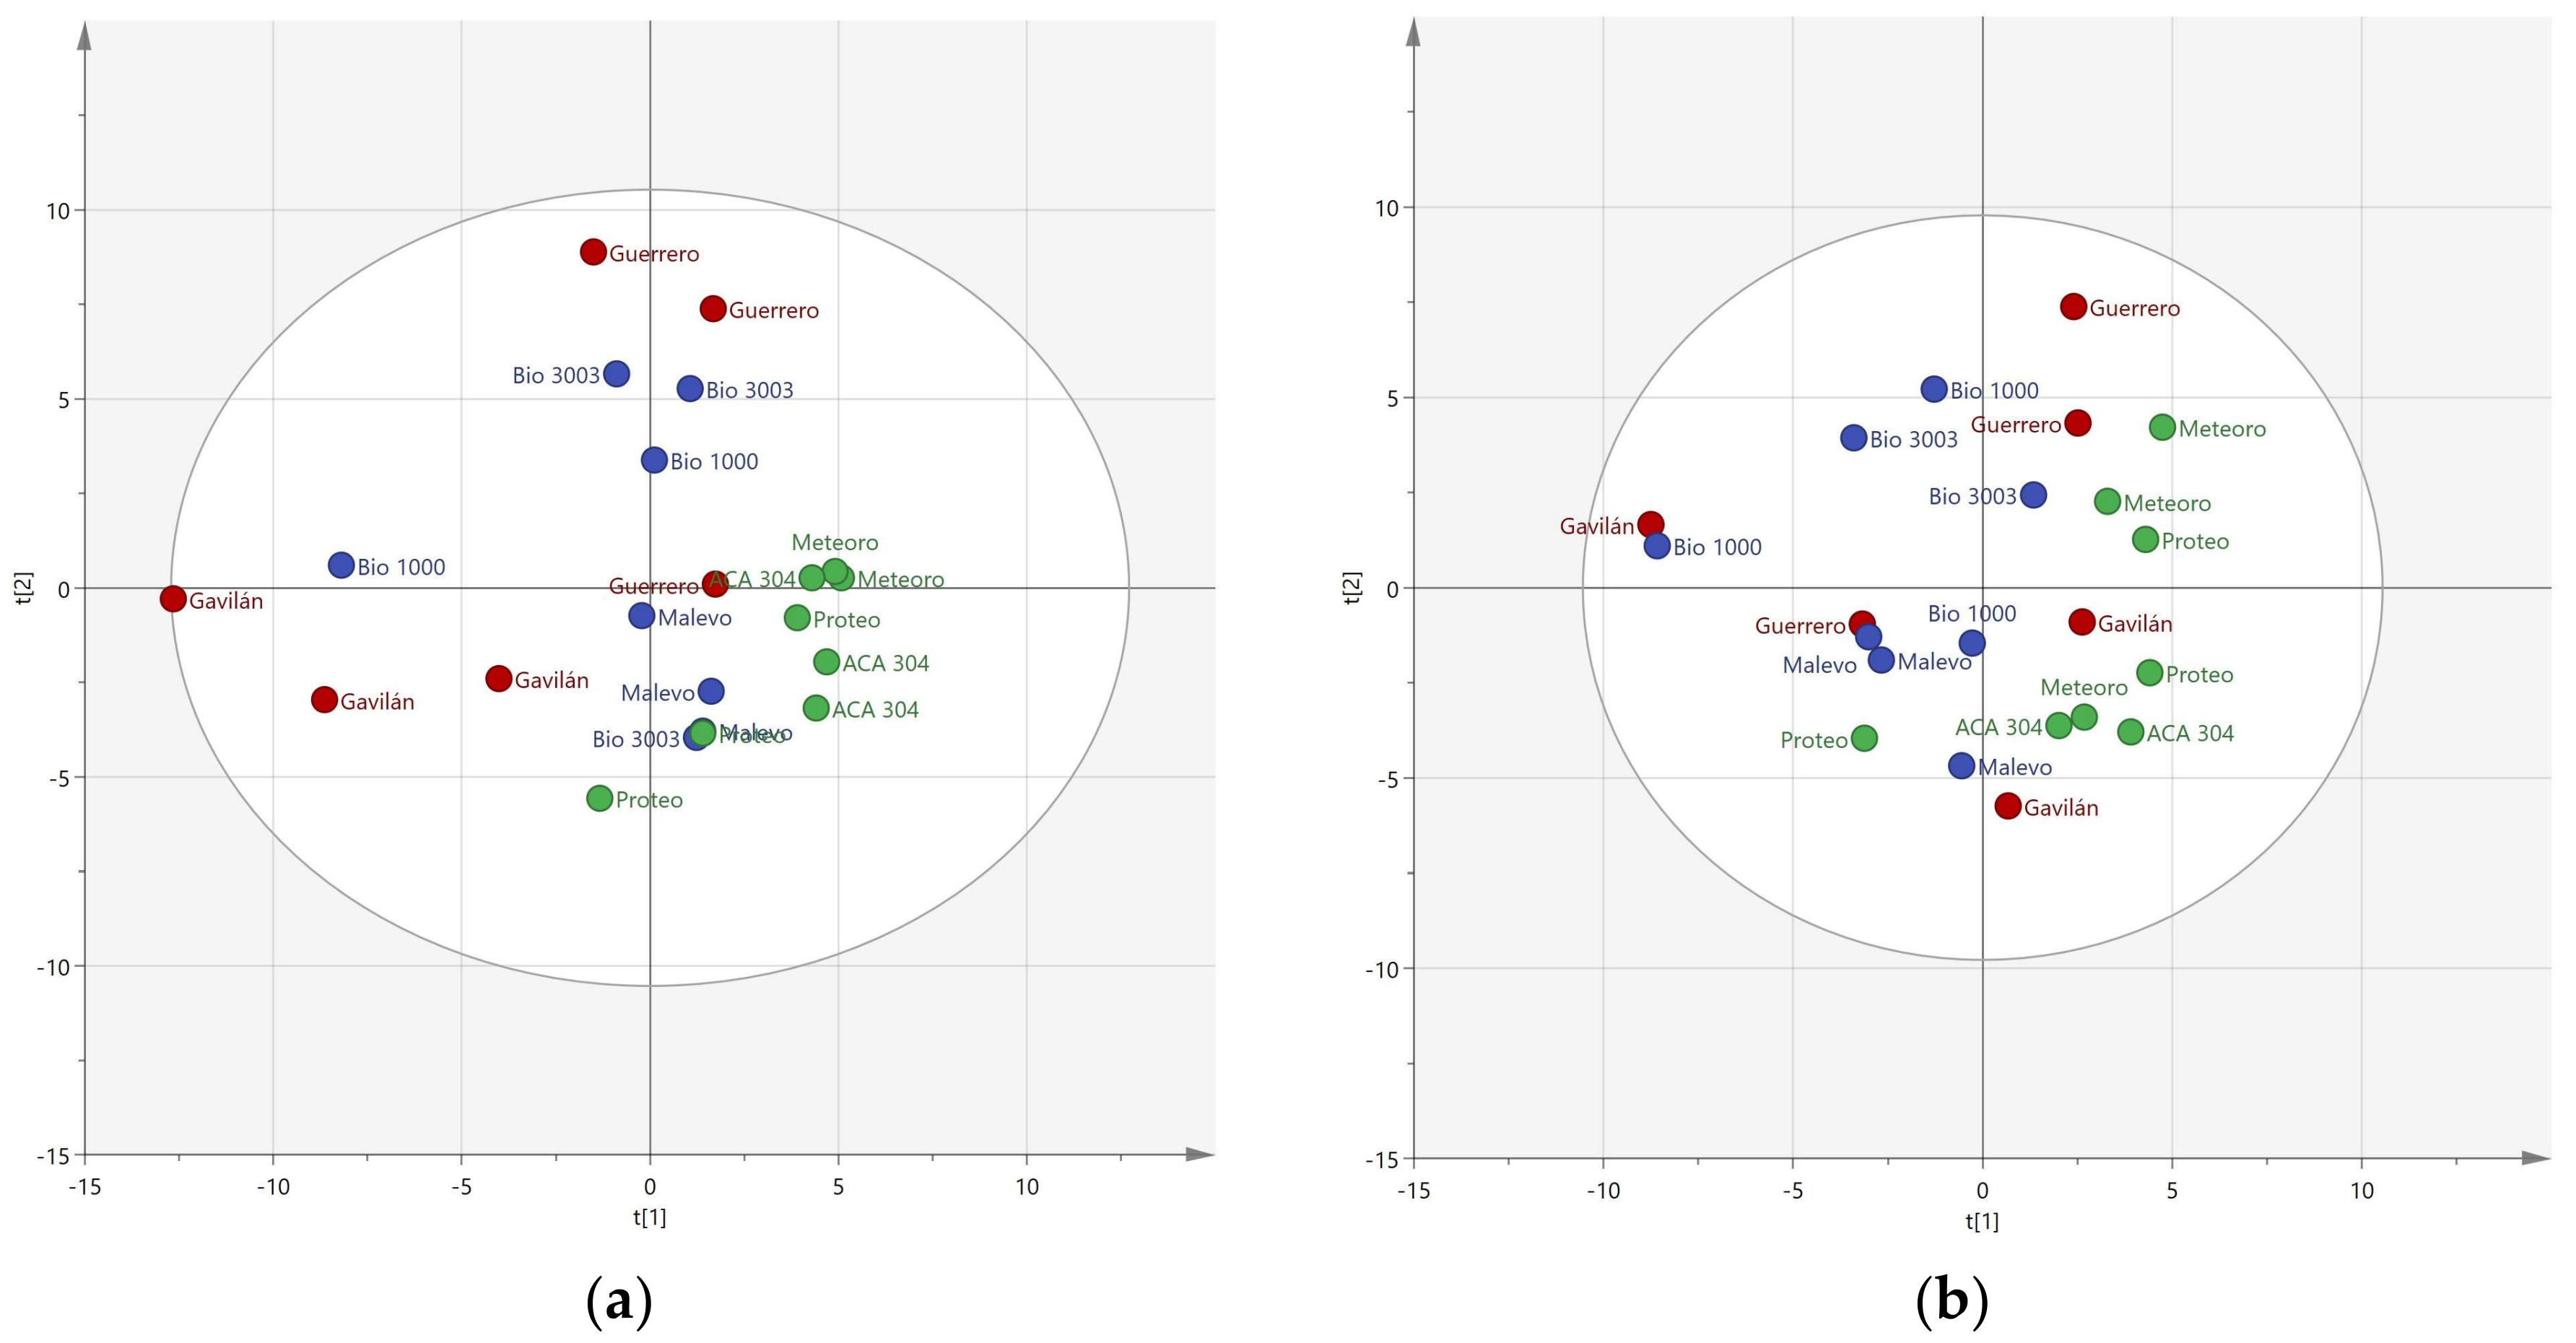
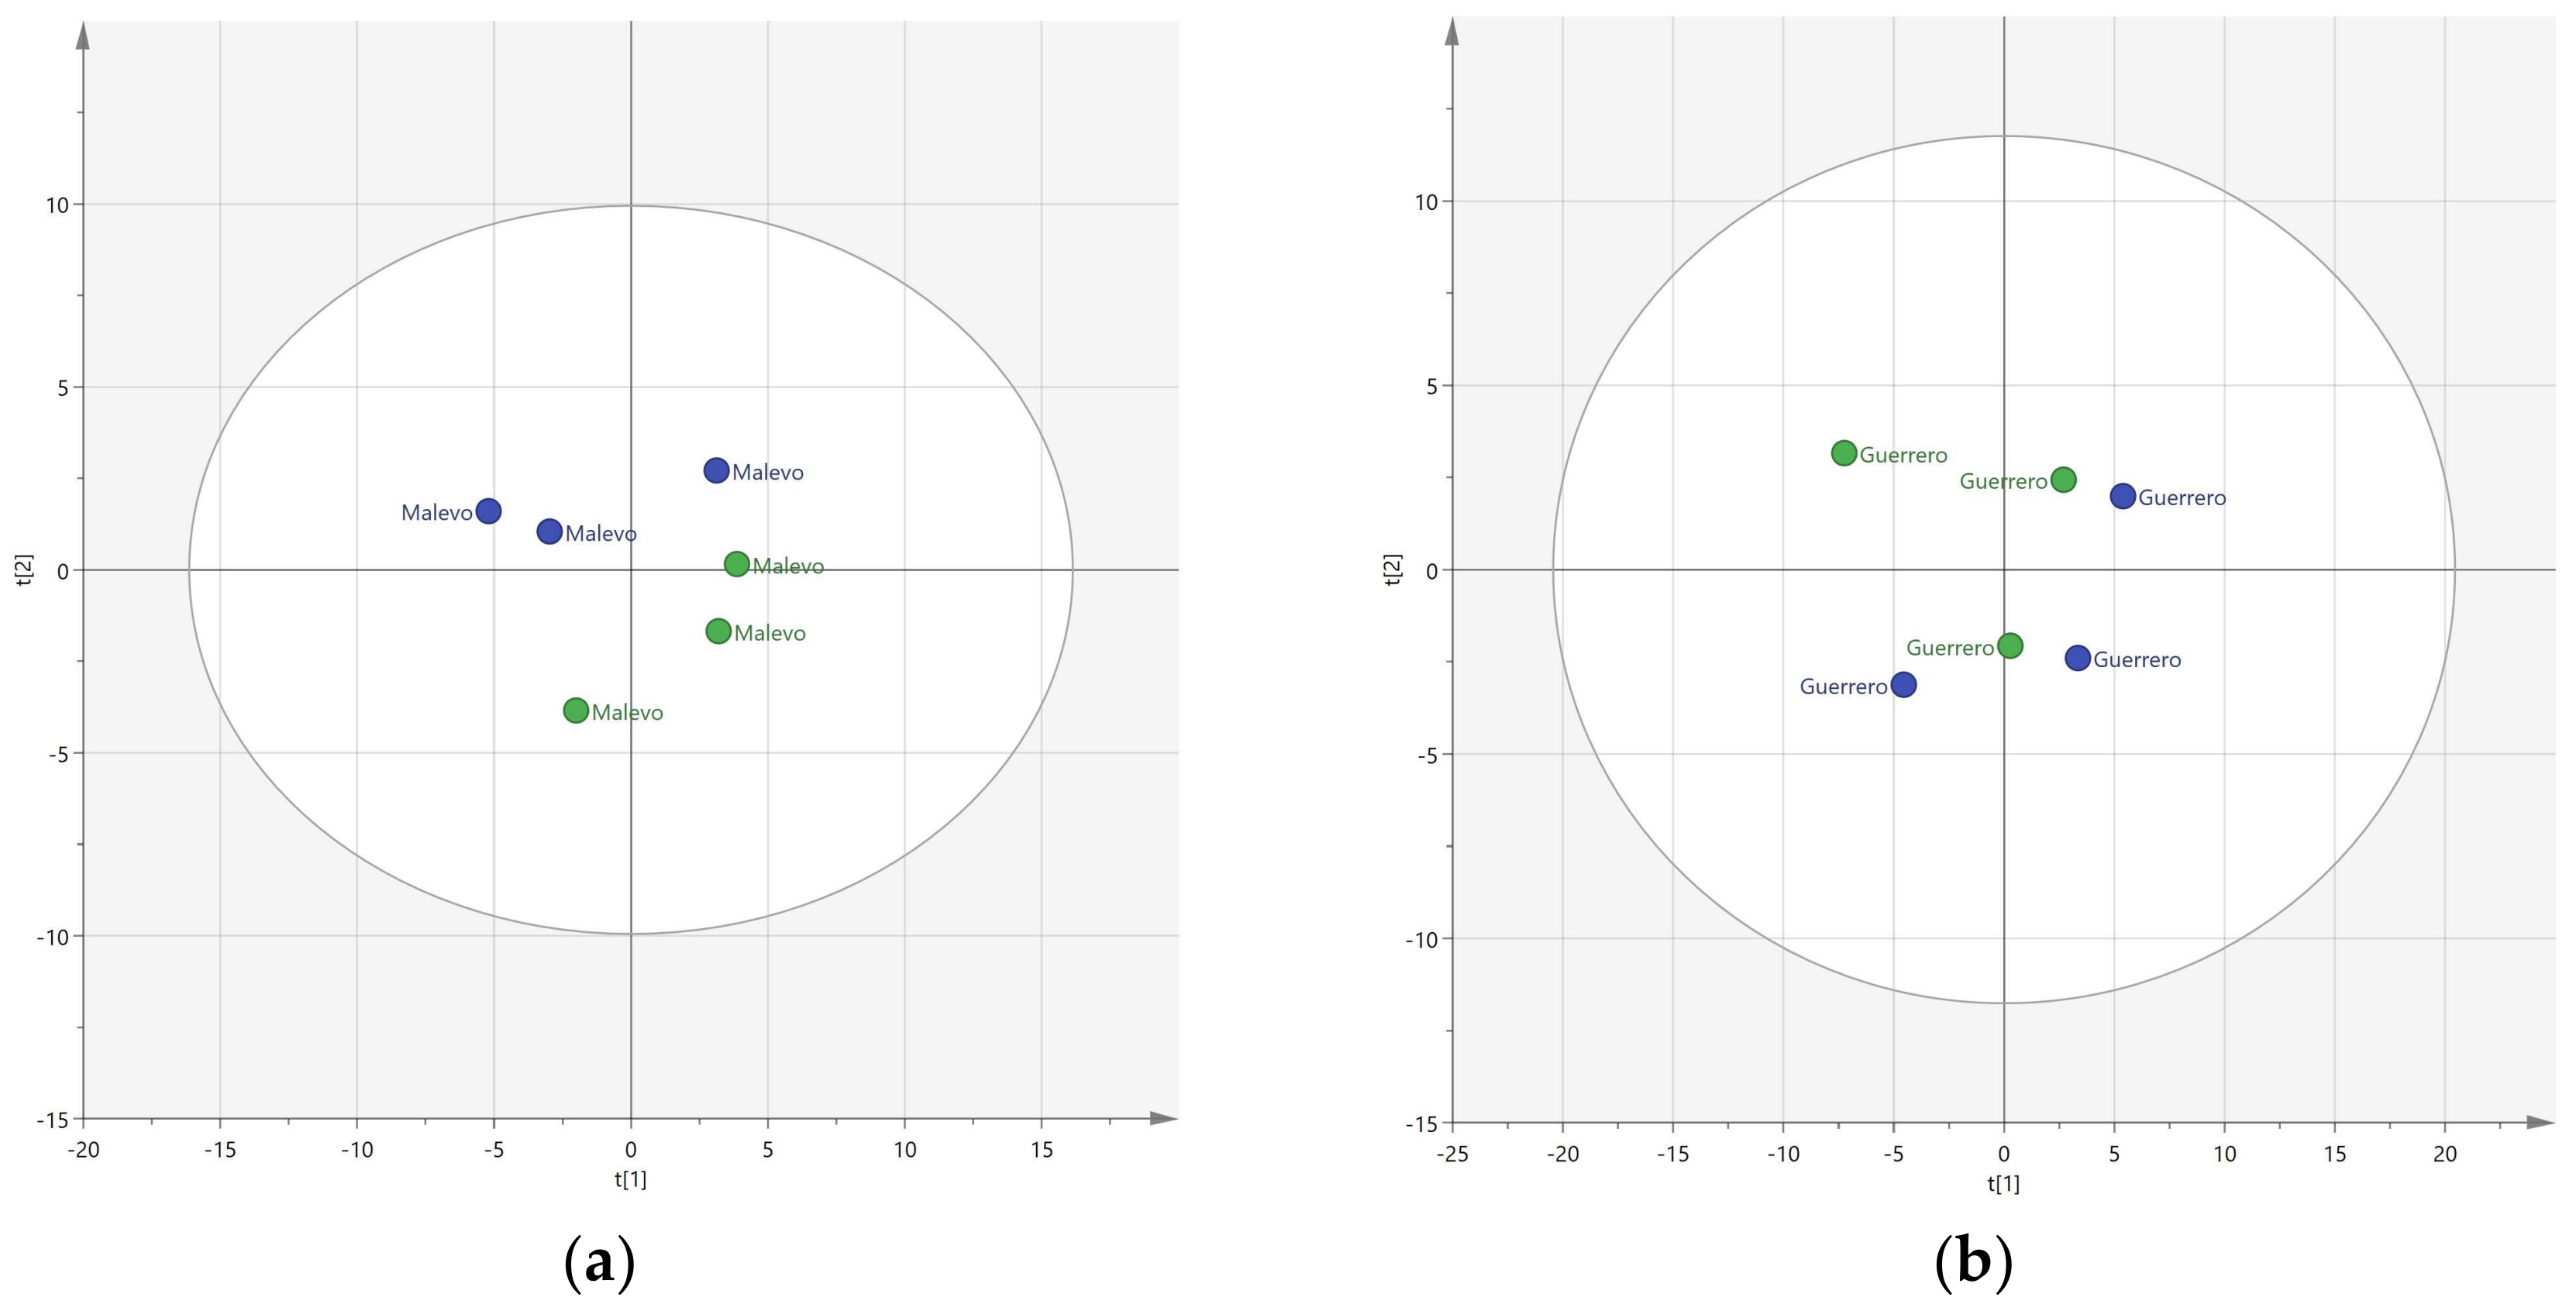
3.1. Resolution of Cultivars

An overall PCA of all data (all samples including all detected masses) showed that the proportion of the total variation accounted for by principal components 1 and 2 was 56.5%. Since the analytical approach used was completely untargeted, the data were examined to reveal any clustering, by using an unsupervised statistical approach and then overlaying the known variables on the plot. Initially the data for the plots with and without added N were analysed separately. From the analysis of plots with added N (Figure 1a), it can be seen that the group 3 cultivars Gavilán and Guerrero cluster away from the other cultivars, while the group 1 cultivars ACA 304, Proteo, and Meteoro cluster tightly together. The group 2 cultivars are more scattered between the group 1 and group 3 cultivars, as might be expected from their intermediate characteristics. For the plots without added N (Figure 1b), the cultivars are not clustered as tightly. The group 3 variety replicates are more scattered, but the group 1 cultivars tend to cluster in the right hand two quartiles and, apart from one Proteo replicate, are separated from the group 2 cultivars. If fewer cultivars are included in the analysis to reduce the total variance, the groups are more clearly separated (data not shown).
Since there is evidence of clustering of the data it was examined with an OPLS-DA analysis to identify those bins that contribute most towards the separation. These values are obtained from the loadings plot of the first predictive component of the model and correspond to the covariance of the X-variables and the predictive score vectors. It is interesting to note that many of the bins that separate group 3 from group 2 also separate group 3 from group 1 (Table 1). The cut-off point of the top ten values was an arbitrary decision to illustrate that some bins contribute to the separation of all three groups, such as bin 383; putative metabolites were assigned to these influential bins (Supplementary Table S1).
ANOVAs carried out for individual bins of high influence in the original overall analysis also showed differences between quality groups (Table 2). For example, mean values for bin 203, given in Table 1 as being influential in separating group 3 from the other groups, ranked group 1 < group 2 < group 3 in the ANOVAs, and so may be associated with poor quality. In contrast, bin 370.6 ranked group 1 > group 2 > group 3, and so may favour quality (Table 2). Bin 301.2, influential in separating group 3 from group 1 and group 2 from group 1 (Table 1), gave a ranking consistent with this, of 3 = 2 > 1, and bin 329, influential in separating group 2 from group 1 (Table 1), gave a ranking consistent with this, of 2 > 1 = 3.

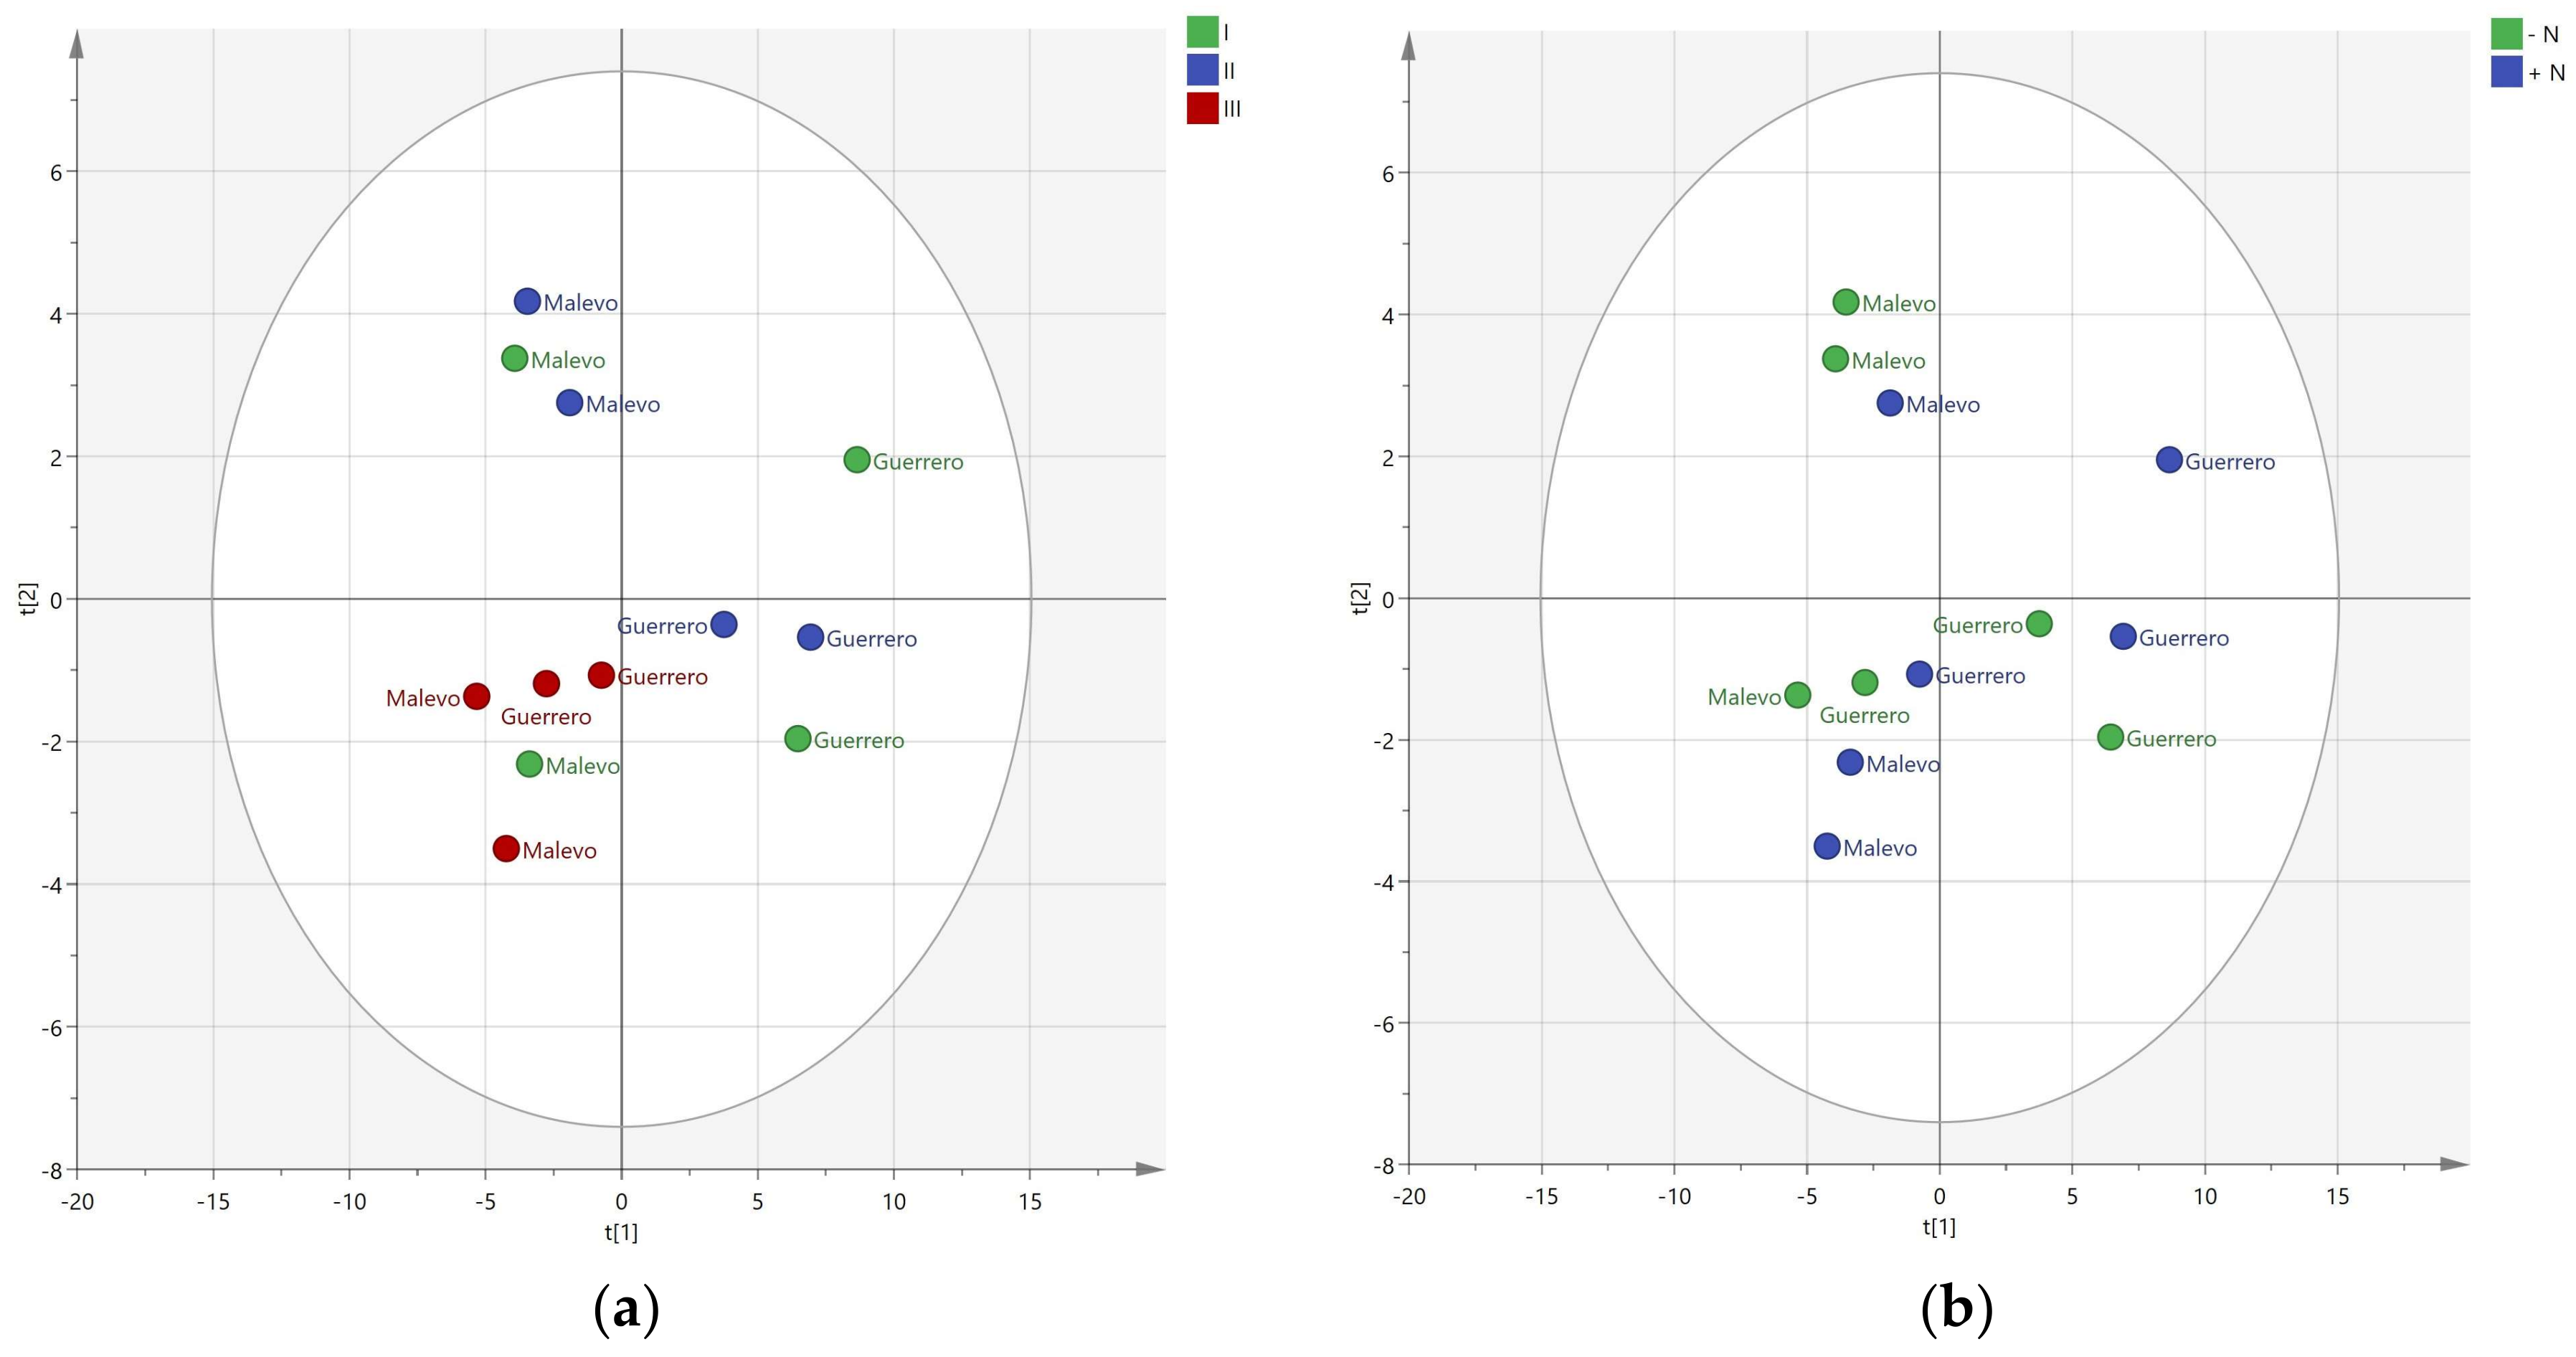
3.2. Effect of Nitrogen

The effect of adding N was examined by cultivar (Figure 2a (Malevo) and Figure 2b (Guerrero)). Adding N clearly alters the metabolic profiles of the exudates, but an OPLS-DA analysis of these two cultivars do not reveal common masses in the top ten discriminant bins. We hypothesised that the variation in field N could be creating additional variation and, therefore, examined the effect of revealing the blocks. Clearly there is both an effect of block and addition of N on the metabolic profiles of the exudates (Figure 3a,b). Block 3 clusters in the bottom left quartile. This field effect is creating much variation in the samples and, with the small number of replicates used, limits the resolution of the difference in metabolic profiles caused by N.
Effects of N could also be discerned with ANOVA of individual bins, where, in an overall analysis including all cultivars in the three quality groups, nine mass bins were found to show significant differences for N availability (Table 3). Some of these mass bins were also influential in the original overall analysis separating quality groups (bins 301.2 and 329 in Table 1).

4. Discussion

Bread-making quality is determined by genetic and environmental factors. The balance between gliadins and glutenins determines, at least partially, that the dough has properties suitable for baking. Quality is usually determined by conventional and time-costly methods. However, more recently, the genetic control of bread-making quality has been dissected into quantitative trait loci (QTL) in numerous studies, for example, micro-alveograph testing and sub-components [24], sedimentation in sodium dodecyl sulphate (SDS) [24,25,26], GPC [24,26,27,28,29,30,31,32,33,34], and hardness [24], amongst others. As well as genetic factors, these traits are influenced by environmental factors and management practices, such as N and water availability, temperature and light intensity [35,36,37]; for example, increases in GPC can be achieved by N addition, but after incremental additions of N fertilizer, GPC reaches a maximum and then remains constant, without any increase in N uptake or remobilization by the crop, thus decreasing the efficiency of N fertilizer [1], hence, the importance of efficient tools to assist genetic selection and management practices.
In this work, we propose a novel approach to study bread-making quality by metabolic profiling. Electrospray ionisation mass spectrometry is highly suitable for analysing the wide range of non-volatile compounds present in phloem exudates: it is a soft ionisation method at atmospheric pressure; it is practical for molecules the size of metabolites; it provides good sensitivity; it is adaptable to a wide range of aqueous and organic solvents and, therefore, can be used directly with metabolite extracts prepared from plants; and it can analyse a wide range of different types of molecules, including highly polar molecules, such as peptides, oligonucleotides, and oligosaccharides, as well as small polar molecules, ionic metal complexes, and other soluble inorganic analytes. The analysis of ions by MS-TOF is simple and allows analyses of a virtually unlimited mass range with a resolution of 0.0001 and high sensitivity.
The approach taken in this demonstration of principle experiment was to use a non-targeted analysis of phloem exudates. Non-targeted approaches have been previously used in studies on tomatoes and Arabidopsis [3,12]. PCA provides strong evidence that cultivars can be distinguished from each other, as well as between quality groups. For example, in Figure 1, Gavilán germplasm is clearly different to ACA 304.
The overall PCA identified PC 1 and PC 2, accounting for 56.5% of the total variation, which was relatively high compared to values obtained in other work, such as Rogers et al. [38]; presumably these cultivars differed in many aspects of their metabolism responsible for their different agronomic performance. Some mass bins showed large differences between quality groups and could be important for accounting for the differences responsible for belonging to different quality groups. For example, the mass bin 203, which was shown to be the first in the ranking of the top ten bins for separating group 3 from 2 and group 3 from 1 (Table 1), showed a ranking 1< 2 < 3 in the ANOVAs, meaning it may be associated with poor quality. Another mass bin showing large differences between quality groups in the ANOVAs was 370.6, that showed a ranking of 1 > 2 > 3 (Table 2). These mass bins could be markers for the rapid selection of cultivars for quality.
Other mass bins showing different rankings for quality groups in the ANOVAs (Table 2) give similar patterns to those observed in the top ten of Table 1. For example, ranking 3 > 1:301.2, 140, 283, 539, and 156; ranking 3 > 2:204, 156, and 383; ranking 2 > 1:301.2, 449, and 329.
Differences between N fertiliser levels identified by the PCA were to a certain extent masked by the differences between cultivars, but could still be extracted from the data. For example, mass bins 203 and 305 identified responses to N treatment in the cultivars.
When only three replicates are used, as in this study, the variation between replicates and the large amount of variation between cultivars clouds the separation. When the experimental blocks are overlaid on the data (Figure 3) it is clear that block three samples cluster tightly, whereas blocks one and two are more scattered. Thus, there is a large field effect in this experiment, meaning it may be beneficial in future experiments to increase the number of blocks in order to better take into account such heterogeneity [39]. In spite of this, clear effects on the addition of N on the metabolic profiles of the exudates were observed in PCA. Future work will also de aimed at widening the number of cultivars under study and to relate their detailed quality characteristics with the masses analysed here; as mentioned in the introduction, these cultivars have been studied for quality characteristics and we propose to add our own quality data obtained from controlled field trials to these in future studies.
The period over which exudates were collected was short and the environmental conditions changed little over this time; for example, mean maximum, minimum, and mean temperatures were 22.9 ± 3.01, 6.73 ± 2.67, and 15 ± 1.7 °C, respectively, and rainfall was minimal (0.3 and 0.2 mm). Hence, we would not expect phloem exudate composition to be significantly affected. Moreover, Overy et al. [3] and Tetyuk et al. [40] collected exudates from plants differing in age (three days in the former and up to fourteen in the latter) and made no observations on this. The difference in the latter study resulted in collection from different phenological stages; we, in our study, were interested in analysing exudates from plants of the same stage, rather than the same age.
The results presented show that metabolic profiling may be used to extract biochemical markers that may be of potential use in selection, in the discrimination of cultivars of differing quality, and in elucidating the effect of N fertilisation. The challenge will be to identify which metabolites are those associated with that performance and to determine the definitive identification of the metabolites that goes beyond the putative metabolites included in the current study, in order to allow possible reasons to be postulated for those differences, and to generate the potential for biochemical marker selection for the important traits; future work will be directed towards this. Some of the mass bins identified as differing significantly between the cultivars may be involved in grain protein composition and quality characteristics. While these are possible candidates for explaining differences in agronomic performance, further analysis will be needed in order to establish these relationships and, as previously mentioned, the evaluation of a larger number of cultivars will be required. As data becomes available from field trials over several years, designed to explore the consistency of responses for the mass bins, this detailed analysis will be a focus for our resources.

5. Conclusions

In summary, we believe metabolic profiling has the potential to be developed into a breeding tool to refine plant breeding efficiency. In particular, it would appear to be useful to identify when field effects could be clouding the results of other screening methods.

Supplementary Materials

Supplementary materials can be found at https://www.mdpi.com/2073-4395/8/4/45/s1, Table S1: Putative metabolites for the top ten m/z bins that separate quality groups in Table 1.

Acknowledgments

We wish to thank Carla Caputo for her generous guidance with sample lyophilisation. We are indebted to the CIC-PBA, CONICET, and CIISAS, Facultad de Agronomía, UNCPBA, for funding this work. S.M.L.B. has been in receipt of a doctoral fellowship from the ANPCyT and from CONICET. This work is part of the doctoral thesis of S.M.L.B.

Author Contributions

S.M.L.B., J.A.C., H.D.V., M.M.B., and W.J.R. conceived and designed the experiments; S.M.L.B., M.M.B., H.J.W., J.A.C., C.S., F.K., J.A.T., H.R.V., and W.J.R. performed the experiments; S.M.L.B., M.M.B., J.A.T., and W.J.R. analysed the data; M.M.B. contributed reagents, materials, and analytical tools; and S.M.L.B., M.M.B., J.A.T., and W.J.R. wrote the paper.

Conflicts of Interest

The authors declare no conflict of interest. The founding sponsors had no role in the design of the study; in the collection, analyses, or interpretation of data; in the writing of the manuscript; or in the decision to publish the results.

References

  1. Barneix, A.J. Physiology and biochemistry of source-regulated protein accumulation in the wheat grain. J. Plant Physiol. 2007, 164, 581–590. [Google Scholar] [CrossRef] [PubMed]
  2. Hall, R.; Brouwer, I.; Fitzgerald, M. Plant metabolomics and its potential application for human nutrition. Physiol. Plant. 2008, 132, 162–175. [Google Scholar] [CrossRef] [PubMed]
  3. Overy, S.A.; Walker, H.J.; Malone, S.; Howard, T.P.; Baxter, C.J.; Sweetlove, L.J.; Hill, S.A.; Quick, W.P. Application of metabolite profiling to the identification of traits in a population of tomato introgression lines. J. Exp. Bot. 2005, 56, 287–296. [Google Scholar] [CrossRef] [PubMed]
  4. Schauer, N.; Zamir, D.; Fernie, A.R. Metabolic profiling of leaves and fruit of wild species tomato: A survey of the Solanumlycopersicum complex. J. Exp. Bot. 2005, 56, 297–307. [Google Scholar] [CrossRef] [PubMed]
  5. Urbanczyk-Wochniak, E.; Fernie, A.R. Metabolic profiling reveals altered nitrogen nutrient regimes have diverse effects on the metabolism of hydroponically-grown tomato (Solanum lycopersicum) plants. J. Exp. Bot. 2005, 56, 309–321. [Google Scholar] [CrossRef] [PubMed]
  6. Cuniberti, M. Propuesta de clasificación del trigo argentino. IDIA XXI 2004, 6, 21–25. [Google Scholar]
  7. Caputo, C.; Criado, M.V; Roberts, I.N.; Gelso, M.A.; Barneix, A.J. Regulation of glutamine synthetase 1 and amino acids transport in the phloem of young wheat plants. Plant Physiol. Biochem. 2009, 47, 335–342. [Google Scholar] [CrossRef] [PubMed]
  8. Gai, Y.P.; Han, X.J.; Li, Y.Q.; Yuan, C.Z.; Mo, Y.Y.; Guo, F.Y.; Liu, Q.X.; Ji, X.L. Metabolomic analysis reveals the potential metabolites and pathogenesis involved in mulberry yellow dwarf disease. Plant Cell Environ. 2014, 37, 1474–1490. [Google Scholar] [CrossRef] [PubMed]
  9. Millet, E.; Zaccai, M.; Feldman, M. Paternal and maternal effects on grain wheat and protein percentages in crosses between hexaploid and tetraploid high protein and low protein wheat genotypes. Genome 1992, 35, 257–260. [Google Scholar] [CrossRef]
  10. Barneix, A.J.; Guitman, M.R. Leaf regulation of the nitrogen concentration in the grain of wheat plants. J. Exp. Bot. 1993, 44, 1607–1612. [Google Scholar] [CrossRef]
  11. Poulton, J.E. Cyanogenesis in plants. Plant Physiol. 1990, 94, 401. [Google Scholar] [CrossRef] [PubMed]
  12. Walker, T.S.; Pal Bais, H.; Halligan, K.M.; Stermitz, F.R.; Vivanco, J.M. Metabolic profiling of root exudates of Arabidopsis thaliana. J. Agric. Food Chem. 2003, 51, 2548–2554. [Google Scholar] [CrossRef] [PubMed]
  13. Villar, J.; Cencig, G. Evaluación De Cultivares De Trigo 2004/2005 Y Recomendaciones Para La Próxima Campaña; INTA—Estación Experimental Agropecuaria Rafaela, Información técnica de trigo campaña 2005, Nº 103; Publicación Miscelánea, INTA EEA: Rafaela, Argentina, 2005. [Google Scholar]
  14. Villar, J.; Cencig, G. Evaluación De Cultivares De Trigo 2008 Y Recomendaciones Para La Próxima Campaña; Información técnica de trigo y otros cultivos de invierno campaña 2009, Nº 113; Publicación Miscelánea, INTA EEA: Rafaela, Argentina, 2009. [Google Scholar]
  15. Villar, J.; Cencig, G. Evaluación De Cultivares De Trigo 2010 Y Recomendaciones Para La Próxima Campaña; Información técnica de trigo y otros cultivos de invierno campaña 2011, Nº 119; Publicación Miscelánea, INTA EEA: Rafaela, Argentina, 2011. [Google Scholar]
  16. Molfese, E.R.; Astiz, V. Calidad Del Trigo Pan En El Sur Bonaerense; Cosecha 2014–2015, Colección divulgación; Ediciones, INTA EEA: Barrow, Argentina, 2015. [Google Scholar]
  17. Donaire, G.; Masiero, B.; Gutierrez, C.; Conde, B.; Salines, J.; Chiacchera, S.; Bertram, N.; Amigone, M.; Fraschina, J.; Gómez, D.; et al. Caracterización De Cultivares De Trigo Doble Propósito; Planteos ganaderos; Aapresid: Rosario, Argentina, 2010. [Google Scholar]
  18. Albrecht, R.; Quaino, O.; Perez, D.; Martins, L. Evaluación De Cultivares De Trigo; Campaña 2008/2009 San Fabián—Departamento San Jerónimo—Santa Fe, INTA—Estación Experimental Agropecuaria Rafaela, Información técnica de trigo y otros cultivos de invierno, Campaña, Nº 113; Publicación Miscelánea, INTA EEA: Rafaela, Argentina, 2009. [Google Scholar]
  19. Bainotti, C.T.; Fraschina, J.; Salines, J.; Alberione, E.; Gómez, D.; Donaire, G.; Nisi, J.; Masiero, B.; Conde, B.; Cuniberti, M.; et al. Evaluación De Cultivares De Trigo En La Eea Marcos Juárez-Campaña 2007/2008; Trigo Actualización 2008, Informe de Actualización Técnica Nº 8; INTA EEA: Marcos Juárez, Argentina, 2008. [Google Scholar]
  20. Urquhart, A.A.; Joy, K.W. Use of phloem exudate technique in the study of amino acid transport in pea plants. Plant Physiol. 1981, 68, 750–754. [Google Scholar] [CrossRef] [PubMed]
  21. Caputo, C.; Barneix, A.J. The Relationship between Sugar and Amino Acid Export to the Phloem in Young Wheat Plants. Ann. Bot. 1999, 84, 33–38. [Google Scholar] [CrossRef]
  22. Cao, T.; Lahiri, I.; Singh, V.; Louis, J.; Shah, J.; Ayre, B.G. Metabolic engineering of raffinose-family oligosaccharides in the phloem reveals alterations in carbon partitioning and enhances resistance to green peach aphid. Front. Plant Sci. 2013, 4, 263. [Google Scholar] [CrossRef] [PubMed]
  23. Balzarini, M.; Di Renzo, J. Infogen: Software Para Análisis Estadísticos De Marcadores Genéticos; Facultad de Ciencias Agropecuarias, Universidad Nacional de Córdoba: Córdoba, Argentina, 2003. [Google Scholar]
  24. Perretant, M.R.; Cadalen, T.; Charmet, G.; Sourdille, P; Nicolas, P.; Boeuf, C.; Tixier, M.H.; Branlard, G.; Bernard, S.; Bernard, M. QTL analysis of bread-making quality in wheat using a doubled haploid population. Theor. Appl. Genet. 2000, 100, 1167–1175. [Google Scholar] [CrossRef]
  25. Blanco, A.; Bellomo, M.P.; Lotti, C.; Maniglio, T.; Pasqualone, A.; Simeone, R.; Troccoli, A.; Di Fonzo, N. Genetic mapping of sedimentation volume across environments using recombinant inbred lines of durum wheat. Plant Breed. 1998, 117, 413–417. [Google Scholar] [CrossRef]
  26. Rousset, M.; Brabant, P.; Kota, R.S.; Dubcovsky, J.; Dvorak, J. Use of recombinant substitution lines for gene mapping and QTL analysis of bread making quality in wheat. Euphytica 2001, 119, 81–87. [Google Scholar] [CrossRef]
  27. Groos, C.; Robert, N.; Bervas, E.; Charmet, G. Genetic analysis of grain protein-content, grain yield and thousand-kernel weight in bread wheat. Theor. Appl. Genet. 2003, 106, 1032–1040. [Google Scholar] [CrossRef] [PubMed]
  28. Wang, L.; Wang, J.; Cui, F.; Jun, L.; Ding, A.; Zhao, C.; Li, X.; Feng, D.; Gao, J.; Wang, H. Conditional QTL mapping of protein content in wheat with respect to grain yield and its components. J. Genet. 2012, 91, 303–312. [Google Scholar] [CrossRef] [PubMed]
  29. Cormier, F.; Le Gouis, J.; Dubreuil, P.; Lafarge, S.; Praud, S. A genome-wide identification of chromosomal regions determining nitrogen use efficiency components in wheat (Triticum aestivum L.). Theor. Appl. Genet. 2014, 127, 2679–2693. [Google Scholar] [CrossRef] [PubMed]
  30. Li, C.; Bai, G.; Chao, S.; Carver, B.; Wang, Z. Single nucleotide polymorphisms linked to quantitative trait loci for grain quality traits in wheat. Crop J. 2016, 4. [Google Scholar] [CrossRef]
  31. Krishnappa, G.; Singh, A.M.; Chaudhary, S.; Ahlawat, A.K.; Singh, S.K.; Shukla, R.B.; Jaiswal, J.P.; Singh, G.P.; Singh Solanki, I. Molecular mapping of the grain iron and zinc concentration, protein content and thousand kernel weight in wheat (Triticum aestivum L.). PLoS ONE 2017, 12, e0174972. [Google Scholar] [CrossRef] [PubMed]
  32. Nedelkou, I.P.; Maurer, A.; Schubert, A.; Léon, J.; Pillen, K. Exotic QTL improve grain quality in the tri-parental wheat population SW84. PLoS ONE 2017, 12, e0179851. [Google Scholar] [CrossRef] [PubMed]
  33. Monostori, I.; Szira, F.; Tondelli, A.; Árendás, T.; Gierczik, K.; Cattivelli, L.; Galiba, G.; Vágújfalvi, A. Genome-wide association study and genetic diversity analysis on nitrogen use efficiency in a Central European winter wheat (Triticum aestivum L.) collection. PLoS ONE 2017, 12, e0189265. [Google Scholar] [CrossRef] [PubMed]
  34. Liu, J.; Feng, B.; Xu, Z.; Fan, X.; Jiang, F.; Jin, X.; Cao, J.; Wang, F.; Liu, Q.; Yang, L.; Wang, T. A genome-wide association study of wheat yield and quality-related traits in southwest China. Mol. Breed. 2018, 38. [Google Scholar] [CrossRef]
  35. Carrillo, J.M.; Rousset, M.; Qualset, C.O.; Kasarda, D.D. Use of recombinant inbred lines of wheat for study of associations of high-molecular-weight glutenin subunit alleles to quantitative traits. 1. Grain yield and quality prediction tests. Theor. Appl. Genet. 1990, 79, 321–330. [Google Scholar] [CrossRef] [PubMed]
  36. Silvela, L.; Ayuso, M.G.; Gil-Delgado, L.G.; Solaices, L. Genetic and environmental contributions to bread-wheat flour quality using the SDS sedimentation test as an index. Theor. Appl. Genet. 1993, 86, 889–894. [Google Scholar] [CrossRef] [PubMed]
  37. Blanco, A.; Mangini, G.; Giancaspro, A.; Giove, S.; Colasuonno, P.; Simeone, R.; Signorile, A.; De Vita, P.; Mastrangelo, A.M.; Cattivelli, L.; et al. Relationships between grain protein content and grain yield components through quantitative trait locus analyses in a recombinant inbred line population derived from two elite durum wheat cultivars. Mol. Breed. 2012, 30, 79–92. [Google Scholar] [CrossRef]
  38. Rogers, W.J.; Cogliatti, M.; Burrell, M.M.; Steels, C.; Kallenberg, F.; Bongiorno, F.; DallaValle, H. Mejoramiento y metabolómica del cultivo de alpiste (Phalaris canariensis). In Cereales de Invierno. Investigación Científico-Técnica; Steinglein, S.A., Moreno, M.V., Cogliatti, M., Rogers, W.J., Carmona, M.A., Lavado, R.S., Eds.; Universidad Nacional del Centro de la Provincia de Buenos Aires: Tandil/Buenos Aires, Argentina, 2012; pp. 147–154. ISBN 978-950-658-301-9. [Google Scholar]
  39. Montgomery, D.C.; Runger, G.C. Design and analysis of single-factors experiments: The analysis of variance. In Applied Statistics and Probability for Engineers, 3rd ed.; John Wiley & Sons, Inc.: New York, NY, USA, 2003; Chapter 13; pp. 468–504. ISBN 0-471-20454-4. [Google Scholar]
  40. Tetyuk, O.; Benning, U.F.; Hoffmann-Benning, S. Collection and Analysis of Arabidopsis Phloem Exudates Using the EDTA-facilitated Method. J. Vis. Exp. 2013, 80, e51111. [Google Scholar] [CrossRef] [PubMed]
Figure 1. Principal components analysis: PC1 vs. PC2 of the cultivars under study (group 1—green; group 2—blue; group 3—red). (a) With, and (b) without added N.
Agronomy 08 00045 g001
Figure 2. Principal component analysis: PC 1 vs. PC 2 of (a) Malevo; and (b) Guerrero. With N—blue; without N—green.
Agronomy 08 00045 g002
Figure 3. Principal component analysis: PC 1 vs. PC 2 of Malevo and Guerrero. (a) Block effect; and (b) N effect.
Agronomy 08 00045 g003
Table 1. m/z bins that separate groups. The top 10 bins showing the strongest contribution in order of their p and q values.
Group 3 from Group 2Group 3 from Group 1Group 2 from Group 1
203203301.2
140140471
239301.2361
118383157
383239227
701.2261173
204539449
539441.2329
156245195
261156383
Table 2. Influential mass bins showing significant differences between quality groups in ANOVA.
Ranking PatternMass BinMeans
Group 1Group 2Group 3
3c > 2b > 1a2033.2056.58910.256
1c > 2b > 3a370.60.1410.0960.046
2c > 1b > 3a1430.3260.4250.27
1650.120.1480.093
1b > 2a = 3a1310.1240.0940.094
31510.9395.9725.517
6510.2020.0990.061
6731.2760.7170.598
6953.6072.3111.804
6960.5810.270.242
7171.4811.0770.835
3161.050.4440.508
3751.1440.6610.668
3760.0390.0150.023
2b = 1b > 3a1720.1120.1310.064
3710.0180.020.008
3820.4040.4150.278
1b = 2b > 3a1440.0110.0090.004
2550.2230.2080.089
2690.1280.1080.062
287.20.1890.1420.075
3701.0970.8940.402
7610.3350.2970.148
3b > 1a = 2a1350.0250.0130.11
1560.1930.1780.303
2040.2280.1110.405
2050.0740.0530.107
2190.4050.2320.881
2610.30.1880.517
3830.3140.160.766
2b = 3b > 1a1670.0560.0920.09
1810.060.0940.088
307.20.0830.1140.11
3b = 2b > 1a1405.6876.7437.397
1830.0410.070.075
301.23.4585.5215.763
302.20.4280.5720.583
5610.0680.1650.17
2b > 1a = 3a2220.0130.020.014
249.20.110.2020.119
295.20.0560.070.059
299.20.1420.420.252
309.20.1490.2720.193
4030.6571.2180.663
1800.010.0140.008
1950.1250.1810.123
1990.3770.5680.367
300.20.0080.020.008
3290.1110.2020.085
3920.1990.3450.1
4490.0690.1480.058
5600.1620.2720.073
1b = 3b > 2a3530.4790.340.443
2b > 1ab > 3a990.0110.0120.006
1020.0210.0280.013
1890.1120.1270.093
263.20.0640.0740.053
269.20.0640.0730.054
2790.4450.4910.362
3b > 2ab > 1a1181.8872.1352.553
5390.2330.3830.529
2b > 3ab > 1a193.20.1590.2220.19
251.20.1870.2540.23
267.20.2070.280.23
303.20.0310.0430.036
321.20.0710.1060.088
1b > 2ab > 3a2570.9330.760.556
35914.28512.58610.842
7391.1070.90.6
Group numbers followed by different letters differed significantly (LSD, p < 0.05). No mass bins showed patterns 2c > 3b > 1a; 3c > 1b > 2a; 1c > 3b > 2a; 3b = 1b > 2a; 3b > 1ab > 2a and 1b > 3ab > 1a.
Table 3. Mass bins responding to fertiliser levels in ANOVAs applied to quality groups.
Mass BinMeans
−N+N
910.053a0.111b
1490.087a0.114b
1830.059a0.065b
301.24.482a5.346b
3390.146a0.211b
442.20.404a0.435b
2110.200a0.252b
3290.117a0.148b
2550.148a0.198b
Values for a certain mass followed by a different letter were significantly different (LSD, p < 0.05).

