Article

Developmental Morphology and Biomass Yield of Upland and Lowland Switchgrass Ecotypes Grown in Iowa

by
Muhammad Aurangzaib
1,*,
Kenneth J. Moore
2,
Andrew W. Lenssen
2,
Sotirios V. Archontoulis
2,
Emily A. Heaton
2 and
Shuizhang Fei
3
1
Department of Agronomy, University College of Agriculture & Environmental Sciences, The Islamia University of Bahawalpur, Bahawalpur 63100, Pakistan
2
Department of Agronomy, Iowa State University, Ames, IA 50011, USA
3
Department of Horticulture, Iowa State University, Ames, IA 50011, USA
*
Author to whom correspondence should be addressed.
Agronomy 2018, 8(5), 61; https://doi.org/10.3390/agronomy8050061
Submission received: 6 April 2018 / Revised: 23 April 2018 / Accepted: 25 April 2018 / Published: 28 April 2018
(This article belongs to the Special Issue Forage and Bioenergy Crops)

Abstract

:
Sustainable development of the bioenergy industry will depend upon the amount and quality of bioenergy feedstock produced. Switchgrass (Panicum virgatum L.) is a model lignocellulosic bioenergy crop but critical information is lacking for improved management, growth, and development simulation model calibration. A field study was conducted near Ames, IA during 2012–2013 with the objective to evaluate upland (“Cave-in-Rock”, ‘Trailblazer’ and ‘Blackwell’) and lowland (“Kanlow” and “Alamo”) switchgrass ecotypes for harvest timing on morphology (i.e., phenology, leaf area index (LAI), and biomass yield). The experiment used a randomized complete block design, with three upland and two lowland varieties harvested at six dates annually. In both years, delaying harvest to later maturity increased biomass yield; lowland cultivars produced greater biomass yield (6.15 tons ha−1) than upland ecotypes (5.10 tons ha−1). Lowland ecotypes had delayed reproductive development compared with upland ecotypes. At the end of both growing seasons, upland ecotypes had greater mean stage count (MSC) than lowland ecotypes. “Cave-in-Rock” had greatest MSC and LAI, but did not produce the greatest biomass. Relationships were nonlinear between MSC and biomass yield, with significant cultivar–year interaction. The relationship between biomass yield and MSC will be useful for improving switchgrass, including cultivar selection, fertilizer application, and optimum harvest time.

1. Introduction

Increasing energy demands, uncertainty in crude oil prices, and environmental impacts of using fossil fuels have increased interest in alternative energy sources, including biofuels. Growing biomass crops that can be converted to fuel is one approach to addressing these concerns [1,2,3]. Switchgrass (Panicum virgatum L.) is a C4 perennial grass native to North America [4,5]. It has been selected as a model 2nd generation bioenergy crop alternative to fossil fuel by the Bioenergy Feedstock Development Program (BFDP) at the U.S. Department of Energy [5]. Switchgrass has already demonstrated great potential as an ideal bioenergy feedstock in Central and North America [1,6,7,8], due to its wide geographic adaptability, suitability for growth on marginal lands, high nutrient and water use efficiency, and by providing natural habitat for migratory birds [9,10,11].
The wide natural geographic distribution of switchgrass has resulted in the evolution of two broad ecotypes (i.e., upland and lowland ecotypes) [12]. These ecotypes possess large genotypic, phenotypic, and physiological differences between them [13,14,15,16,17,18]. Lowland cultivars are generally tall, thick-stemmed, later flowering, adapted to wetter conditions, and have higher biomass yield potential, compared to the upland ecotypes [19,20,21]. Upland ecotypes are shorter, thin-stemmed, relatively lower yielding, found in drier conditions [22], and have better winter survival than lowland ecotypes when grown at the same latitude [7,21].
In geographic zones where the adaption of these ecotypes overlap, clear morphological differences have been observed between them [23,24]. These differences have been observed to play an important role in biomass accumulation and composition. Production of greater biomass yields by lowland ecotypes is also generally attributed to their delayed maturity and faster stem elongation [15].
There are five distinct stages in the development of most grasses: (1) germination; (2) vegetative/leaf development; (3) elongation/stem development; (4) reproductive/floral development; and (5) seed development and ripening [25]. Switchgrass development is closely associated with growing degree days (GDDs) during its vegetative stage, but the relationship varies with cultivar and location [26,27,28]. Reproductive development, on the other hand, is more closely related to the day of the year, suggesting a photoperiod effect [26,29,30]. However, these relationships are also affected by cultivar–environment interactions, and differences between relative biomass yields often vary by year, location, and harvest management [30,31,32]. Therefore, understanding morphological development is important for quantifying and describing important grass canopy processes that are influenced by the plant–environment interaction [33]. Once developed, estimation of grass developmental morphology can be used to predict yield and composition [19,27,34,35,36].
Most of the information available on morphological development of switchgrass ecotypes is based on comparisons made among cultivars grown in different geographic zones; however, the information from side-by-side comparisons at the same location is not extensive. Such information is useful for cultivar selection and development, and to understand differences between ecotypes. The objectives of this study were: (1) to determine the effect of harvest date and switchgrass phenology on biomass yield; (2) to evaluate biomass yield differences between switchgrass ecotypes; and (3) to determine if switchgrass morphological development, an easily observable trait in the field, can be used as a predictive tool for leaf area index (LAI) and dry matter yield (DMY).

2. Material and Methods

2.1. Experimental Site

To determine the developmental morphology and DMYs of upland and lowland switchgrass cultivars, a study was conducted during 2012 and 2013 on a switchgrass cultivar trial established in 2007 at Iowa State University, Sorenson Research Farm, near Ames, IA, USA (42°0′41″ N, 93°44′34″ W). Soils at the site consisted primarily of Canisteo clay loam (Fine-loamy, mixed, superactive, mesic calcareous, mesic Typic Endoaquolls), Harps clay loam (Fine-loamy, mixed, superactive, mesic Typic Calciaquolls), and Nicollet loam (Fine-loamy, mixed, superactive, mesic Aquic Hapludolls). The experimental field was arranged as a randomized complete block design with six replications. The individual plot size within each replication was 4.5 × 3 m. Five switchgrass varieties of two distinct ecotypes, upland (“Cave-in-Rock”, “Blackwell”, and “Trailblazer”) and lowland (“Kanlow” and “Alamo”), were used as treatments. Every year prior to spring growth initiation, standing dead material was mowed at a stubble height of 5 cm, and the plant residue was removed from the field. To control weeds each year, a pre-emergence application of atrazine [6-Chloro-N-ethyl-N′-(1-methylethyl)-1,3,5-triazine-2,4-diamine] and Paramount [3, 7-Dichloro-8-quinolinecarboxylic acid] was applied at 2.23 kg and 0.56 kg ha−1 a.i.ha−1 respectively. Nitrogen (NH4NO3, 34-0-0), P (TSP, 0-46-0), and K (KCl, 0-0-62) fertilizers were applied every year in early May at 78 kg ha−1, 67 kg ha−1, and 90 kg ha−1, respectively. Total precipitation and mean monthly air temperature for 2012 and 2013 were collected at a site located less than 8 km from the experimental site, and the data were downloaded from the Iowa Environmental Mesonet (2014) (Table 1).

2.2. Biomass Harvest

In 2012, biomass harvest samples were collected from three randomly selected blocks, and the remaining blocks were used the following year to collect harvest samples. Each plot was divided into six subplots corresponding to six biomass harvests. Each year, depending on spring growth, the first harvest occurred at early vegetative growth (approximately two weeks after tiller emergence). In 2012 and 2013, the first harvest samples were harvested on the 136th and 149th day of the year (DOY), respectively, and the remaining five harvests were collected at approximately 2-week intervals. At each harvest date, two 0.1 m2 samples were harvested by placing two quadrats randomly within each subplot. Tillers were carefully hand clipped at ground level and transported to the laboratory for further processing.

2.3. Morphology and Development

Leaf area was estimated using an LI-2000 plant canopy analyzer system (LI-COR Biosciences, Lincoln, NE, USA). Measurements were taken biweekly on the same day the biomass harvest samples were collected and within the first 4 h of daylight on clear sunny days. Each LAI determination consisted of four below-canopy measurements interspersed with one above-canopy measurement. Below-canopy measurements were recorded by placing the LI-2000 bar close to the ground surface and on the non-harvested portion of the whole plot.
Mean stage count (MSC) for each switchgrass variety was determined at each harvest date. Biomass harvest samples were hand sorted and morphologically classified according to the Nebraska system for staging perennial grasses described by Moore et al. [25].

2.4. Dry Matter Yield

Harvested biomass samples were pooled after morphological classification to determine DMY. Biomass samples were weighed for fresh weight and then dried in a forced-air oven at 60 °C for 72 h or until a constant dry weight was achieved, and then reweighed.

2.5. Statistical Analysis

Statistical analysis was performed by analysis of variance using the GLIMMIX procedure of SAS 9.4 (SAS Institute Inc., Cary, NC, USA). Switchgrass variety, year, and harvest date were considered fixed effects, while blocks and the interactions with blocks were considered as random effects. To determine the relationship between switchgrass development, LAI, and DMY, quadratic regression equations were fitted with MSC as an independent variable, and LAI and DMY as dependent variables. All statistical tests were made at alpha = 0.05.

3. Results

3.1. Temperature and Precipitation

Growing season conditions differed between years. Mean monthly air temperature in the first half of 2012 was warmer compared to 2013 and the 20-year mean, while the rest of the growing season temperatures were fairly typical (Table 1). In 2013, spring regrowth was delayed about two weeks compared to 2012, which was related to cool temperatures in May. Precipitation in both years was lower than the 20-year mean, except April and May of 2013. April in both years and May in 2013 were wetter than the 20-year average and then followed by a drier summer (Table 1). The year 2012 experienced serious drought as a result of below normal rainfall in spring, while spring and summer temperatures were above the long-term normal.

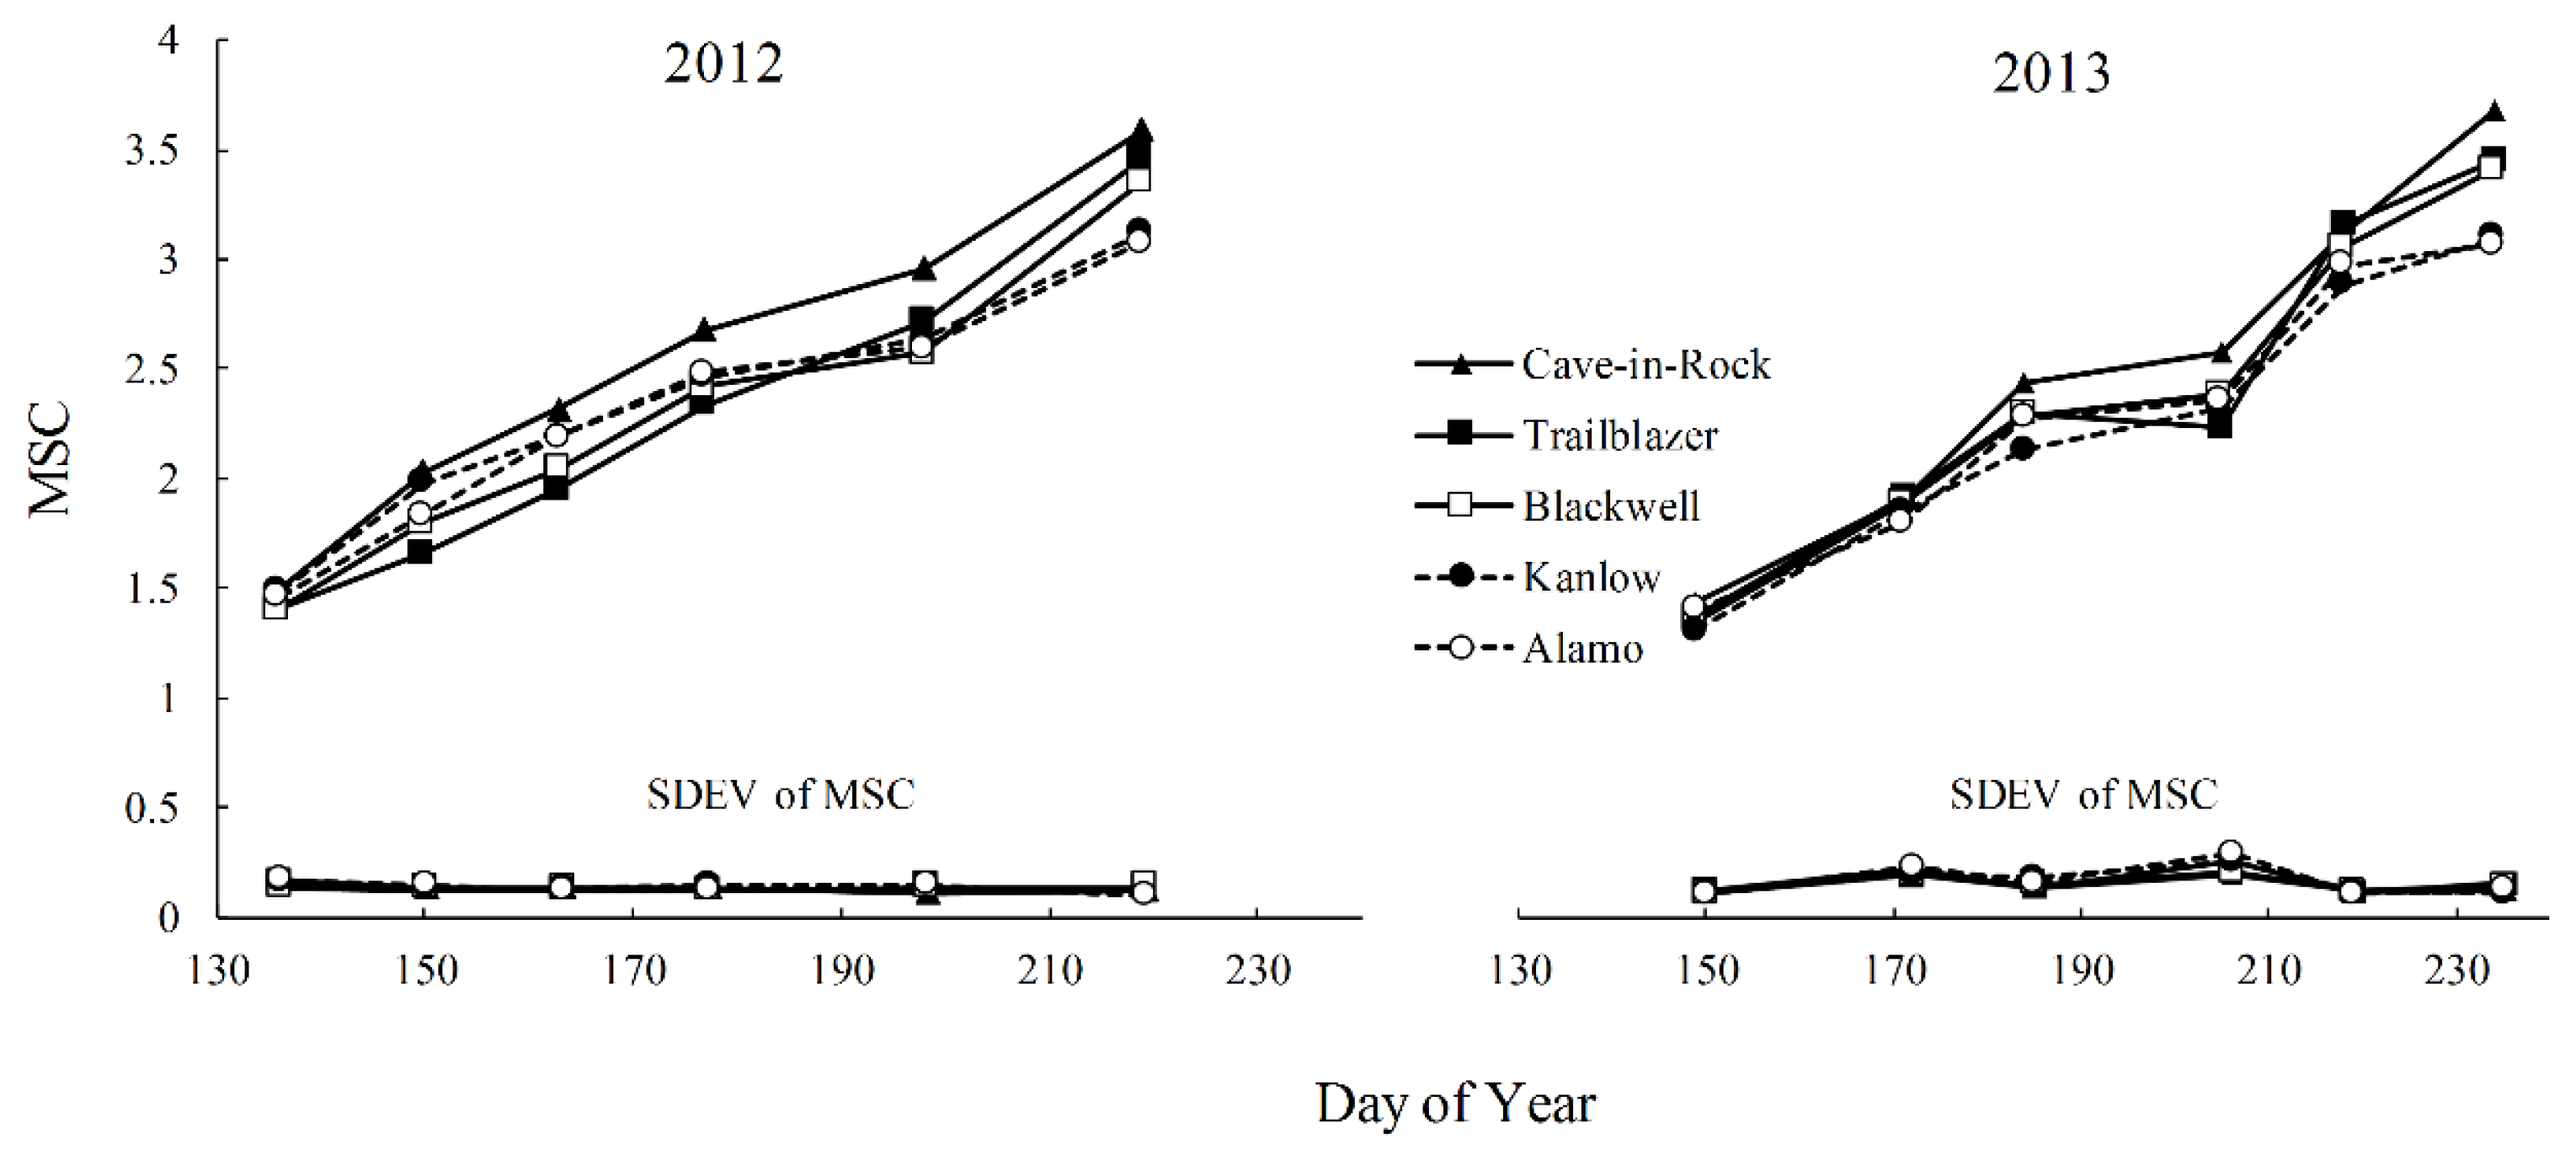
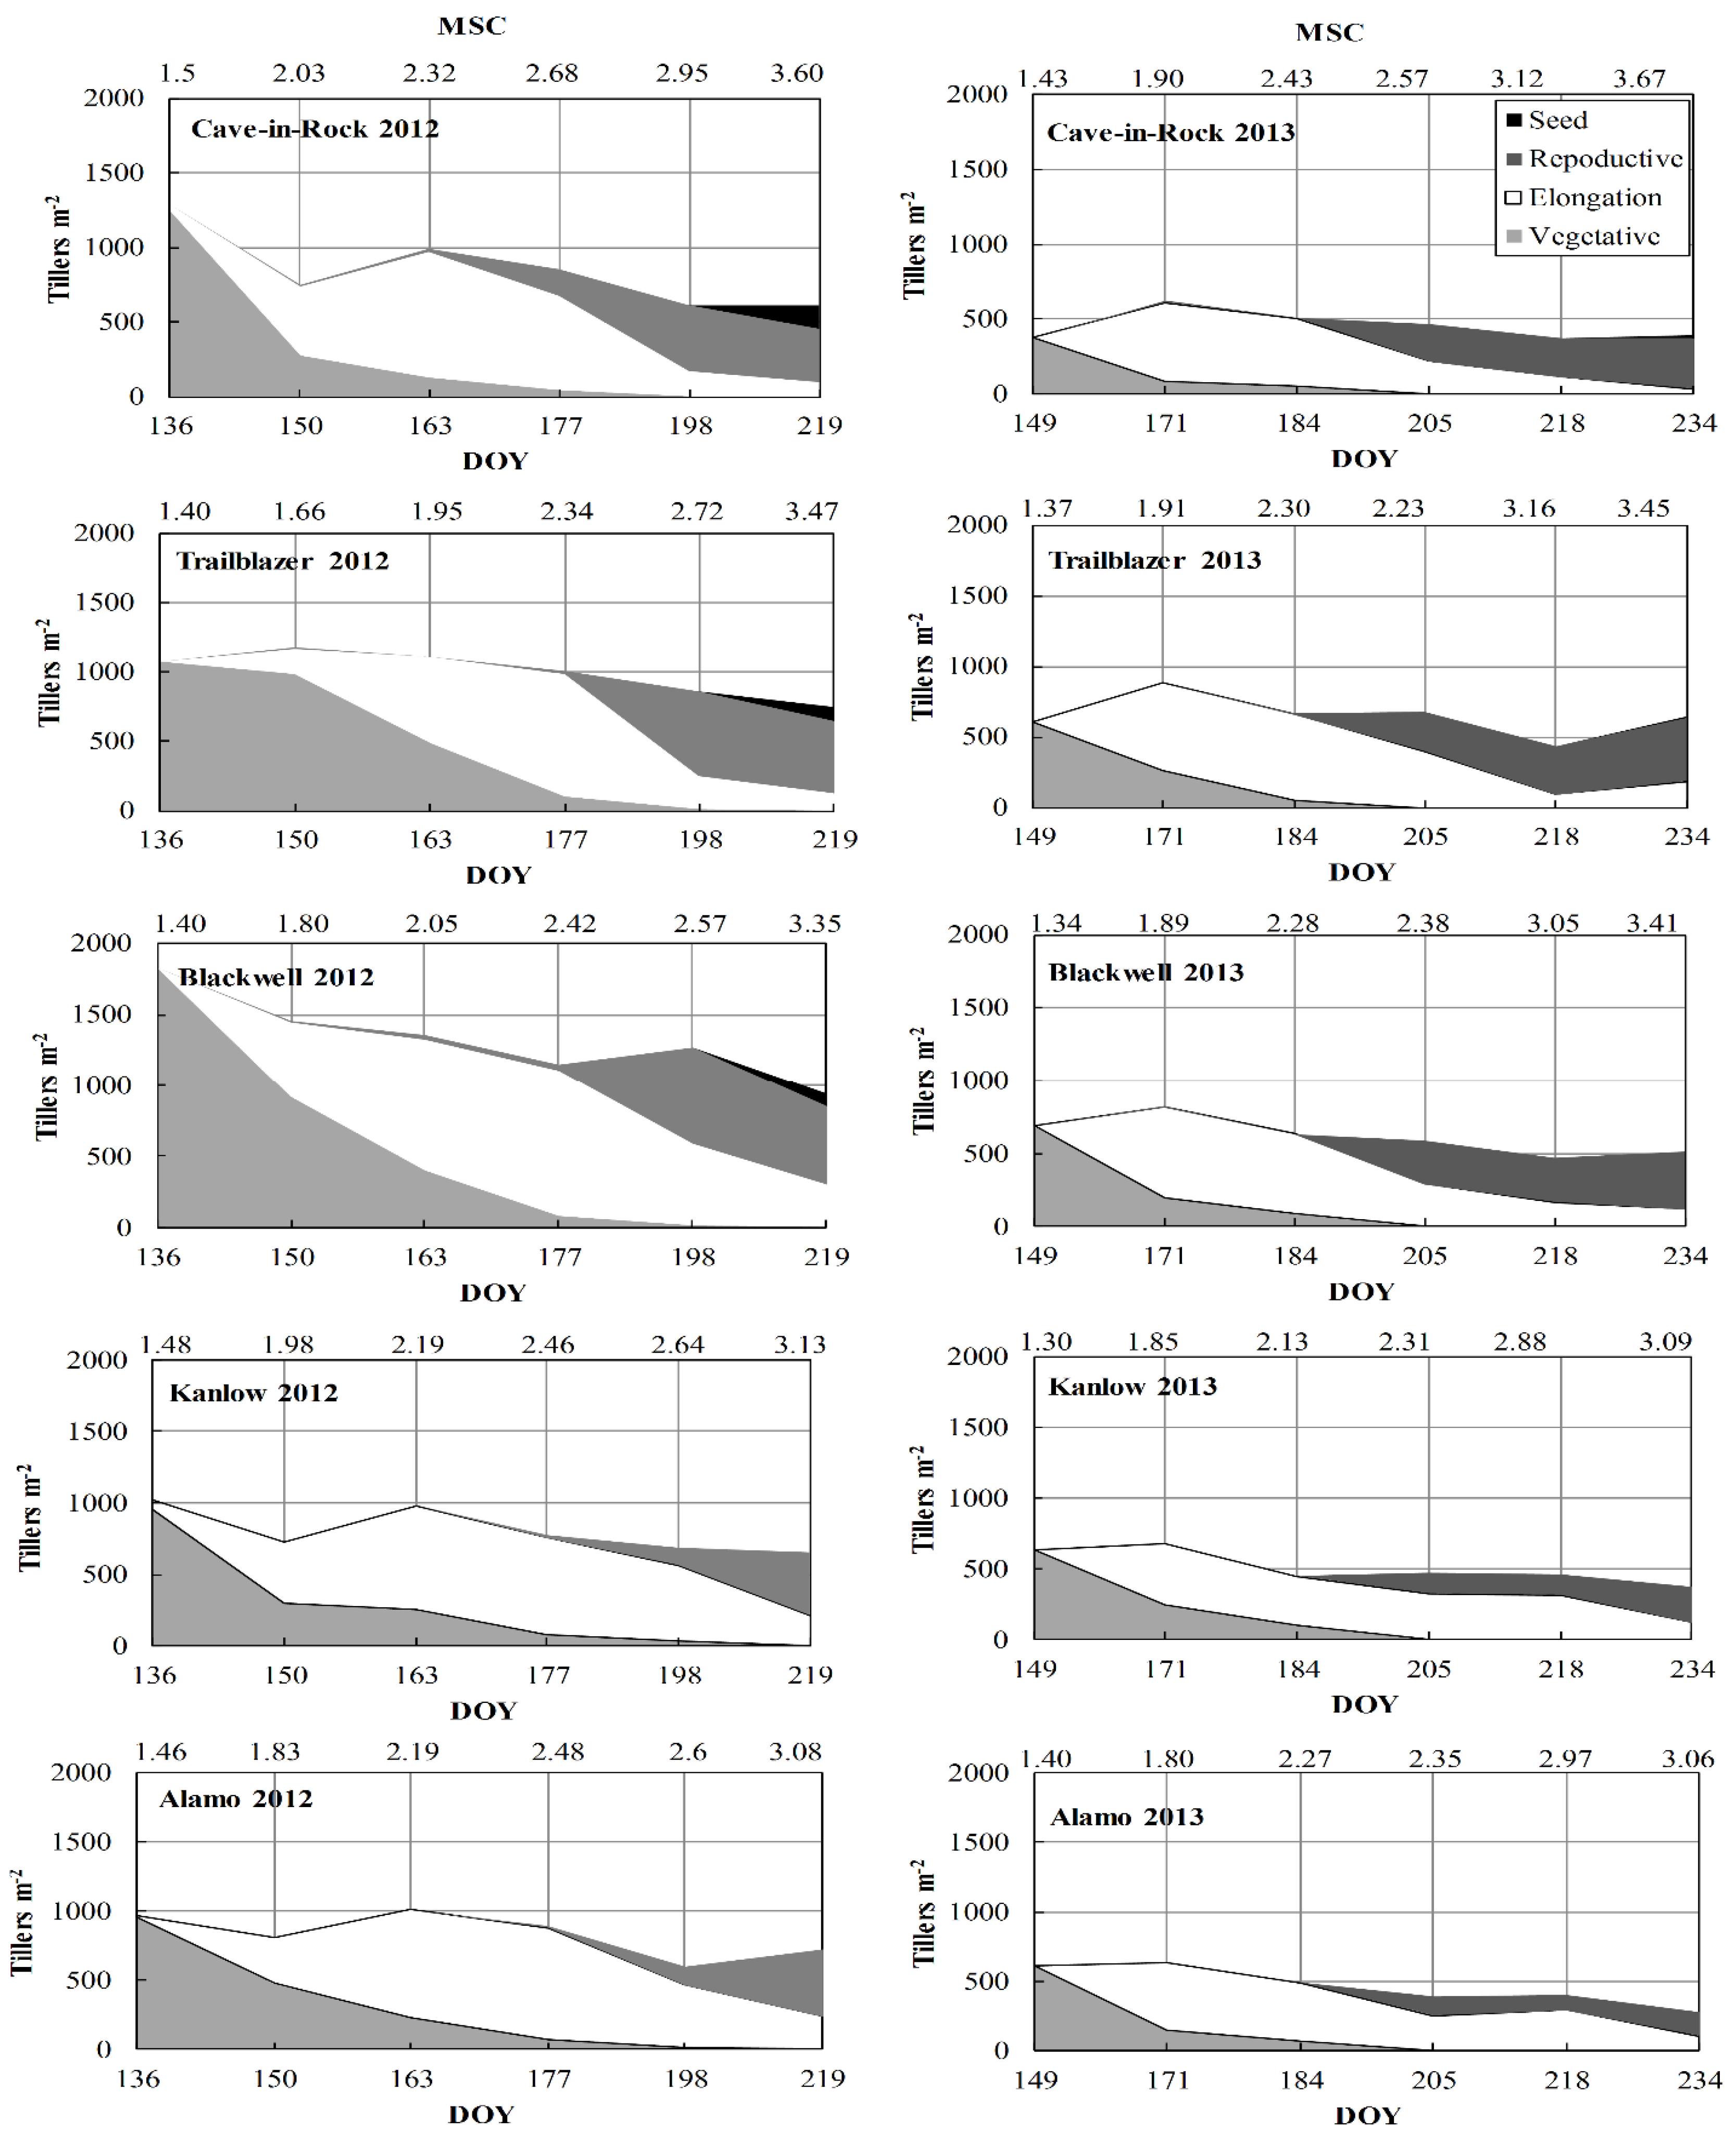
3.2. Morphology and Development

Development (i.e., MSC) was affected by harvest date, but the effect was different among the varieties (Table 2, Figure 1 and Figure 2). Averaged over both years, “Cave-in-Rock”, which is an upland cultivar, had the highest MSC of 2.52, whereas the two lowland cultivars, “Kanlow” and “Alamo”, had the lowest MSCs of 2.28 and 2.29, respectively.
Due to significant variety–year interactions, each year was then analyzed separately. In 2012, variety and harvest date influenced MSC, and there was a significant interaction between them. However, in 2013, variety and harvest date were found to have an effect on MSC, but the two-way interaction of variety and harvest was not significant. This indicates that switchgrass varieties in 2012 had larger differences between harvests than in 2013.
In both years, MSCs for all switchgrass varieties increased gradually from the first harvest date to the final, and the highest MSCs for all switchgrass varieties was observed at the final harvest (Figure 1 and Figure 2). At the end of each growing season, MSC for upland ecotypes was always greater than lowland ecotypes, indicating that upland ecotypes matured earlier than lowland ecotypes (Figure 1 and Figure 2). In 2012, there was an interaction between variety and harvest date. At the final harvest in 2012, “Cave-in-Rock” had the highest MSC of 3.6, whereas “Kanlow” and “Alamo” had the lowest MSCs of 3.1 and 3.0, respectively (Figure 1 and Figure 2). However, in 2013, only variety and harvest date affected the MSC and there was no interaction between them. In 2013, at the final harvest, “Cave-in-Rock” had the highest MSC of 4.6, and “Kanlow” and “Alamo” had the lowest MSCs of 3.1 and 3.2, respectively (Figure 1 and Figure 2).
The LAI for all switchgrass varieties increased with maturity in both years (Figure 3). The LAI of all varieties differed with harvest date (Table 2); earlier harvest dates had lower LAI compared to later harvest dates. Averaged over both years, the increase in LAI of switchgrass varieties between first and last harvest ranged from 0.8 for “Alamo” to 5.6 for “Cave-in-Rock”.
In 2012, variety and harvest date affected the LAI of switchgrass varieties and there was an interaction between them. In 2012, LAI for all switchgrass varieties increased gradually from the first harvest date to the final. The increase in LAI for switchgrass varieties between first and last harvest ranged from 0.6 for “Blackwell” to 6.7 for “Cave-in-Rock” (Figure 3). However, in 2013, only variety and harvest date affected the LAI, but there was no interaction between them, suggesting that LAI among switchgrass varieties changed differently in 2013 compared to 2012. In 2013, a gradual increase in LAI was only observed until mid-season, after which it decreased (Figure 3). The LAI between first and fourth harvest ranged from 0.93 for “Kanlow” to 5.1 for “Cave-in-Rock” (Figure 3). Similar to MSC, at the end of both years, LAI for upland varieties was always greater than the lowland varieties.

3.3. Dry Matter Yield

The DMY of all switchgrass varieties increased gradually in both years (Figure 4). Year, variety, and harvest date significantly affected the DMY (Table 2, Figure 4). Averaged over both years, “Kanlow” had the highest DMY of 6.31 tons ha−1, and “Trailblazer” had the lowest DMY, 4.5 tons ha−1.
In 2012, variety and harvest date influenced DMY, but there was no interaction between them. The highest DMY for all switchgrass varieties were observed at the last harvest; “Kanlow” accumulated the highest DMY of 14.3 tons ha−1, and “Blackwell” had the lowest DMY of 10.2 tons ha−1 (Figure 4). Similarly, in 2013, variety and harvest date affected the DMY for switchgrass varieties, but there was no interaction between them. In 2013, DMY for all switchgrass varieties were lower compared to 2012. However, varieties followed a similar trend, as in 2012 with “Kanlow” producing the highest yield with 10.88 tons ha−1, and “Blackwell" with the lowest DMY of 6.7 tons ha−1 (Figure 4).

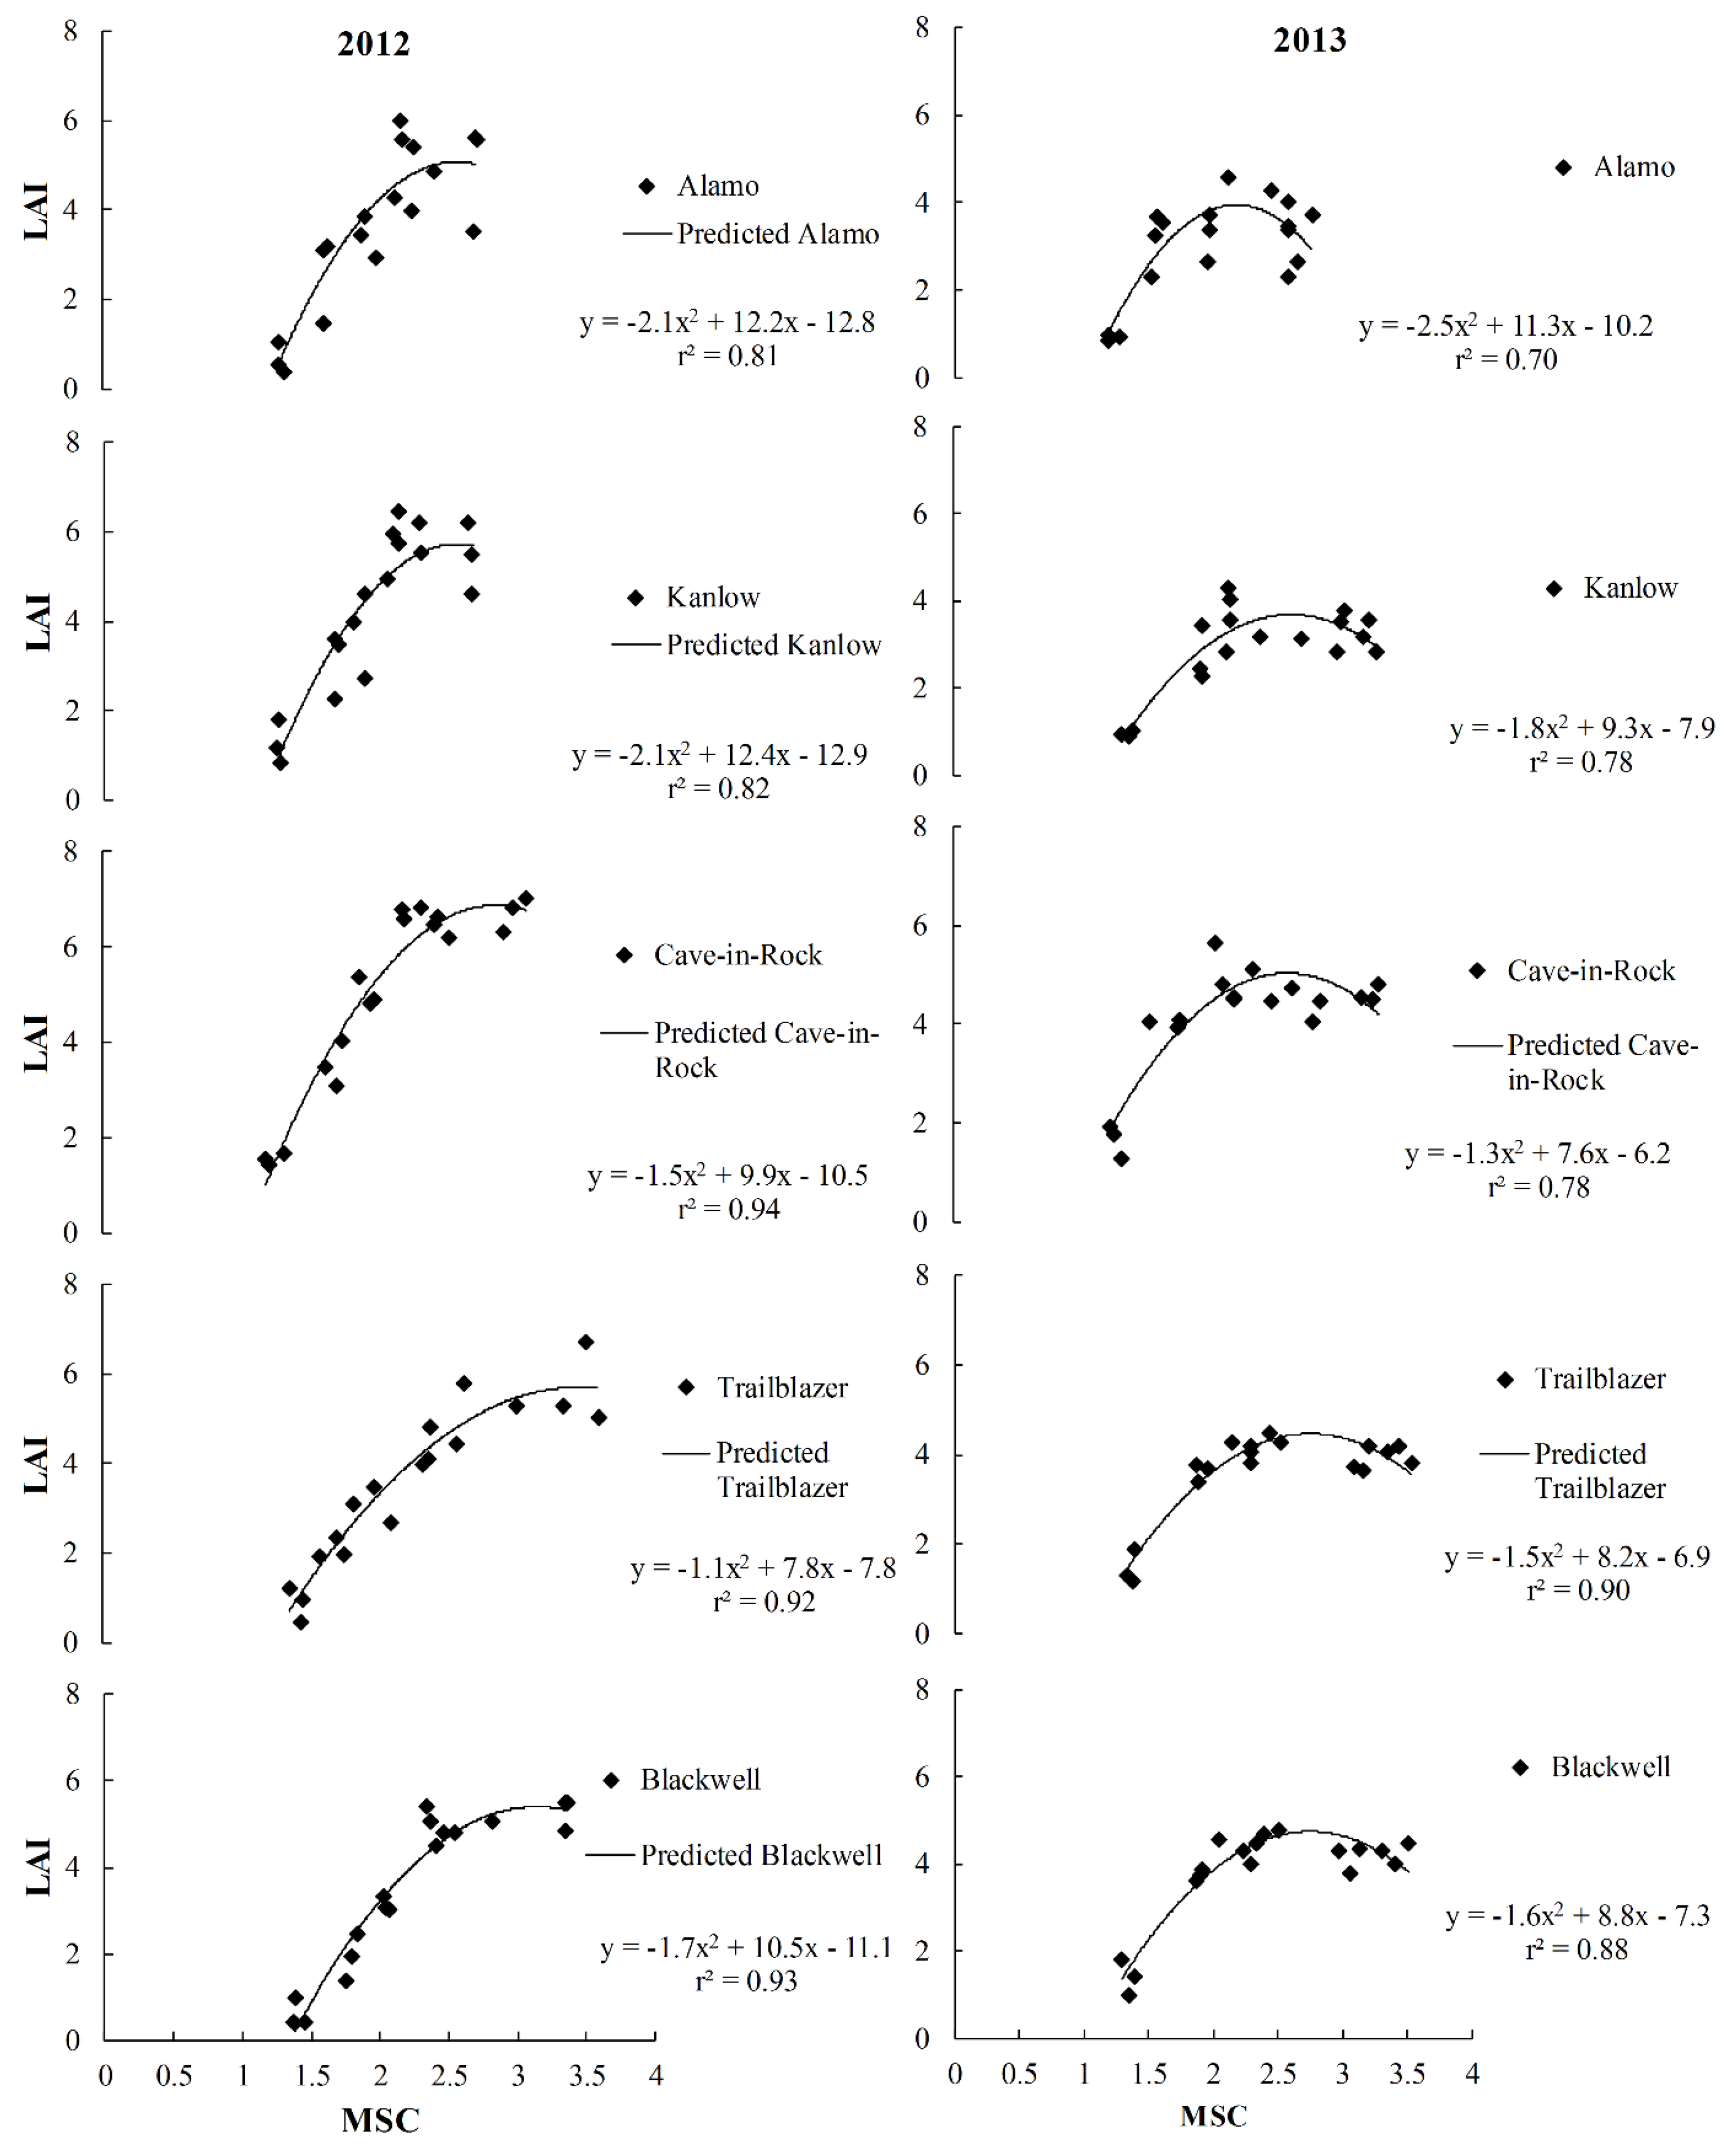
3.4. Predictive Relationships

The relationships between MSC and DMY, and MSC and LAI were nonlinear. Quadratic equations gave the best fit in terms of predicting relationships between MSC, LAI, and DMY in 2012 and 2013 (Figure 5 and Figure 6). In both years, these relationships were positive and with good predictive values (r2 = 0.60–0.94).
The equation for predicting LAI and DMY using the quadratic MSC model in 2012 generally gave a higher r2 than in 2013. In terms of ecotypes, LAI and DMY were found to be more predictable with the MSC quadratic equation in upland ecotypes, rather than lowland ecotypes (Figure 5 and Figure 6), but year to year variation also seems to have an effect on this relationship.

4. Discussion

Results of two years of growth and developmental study of switchgrass ecotypes confirmed significant variation between switchgrass ecotypes for their biomass yield and phenology. This study showed that MSC, LAI, and biomass yields were significantly different between switchgrass ecotypes (Figure 1, Figure 3, and Figure 4, respectively) suggesting that there is substantial scope for enhancing switchgrass genotypes in the U.S. Midwest for improved biomass yield.
The ultimate goal of a biomass crop is to produce a high yield of high quality substrate over the growing season, and harvest management has the potential to greatly influence biomass yields and quality. Poor harvest management may not only result in reduced biomass quality and yield, it might also decrease stand persistence [37,38]. Harvest timing can also vary by location, as well as with cultivar. This study documents significant variation among switchgrass ecotypes for their optimal harvest time. Delayed harvest, and consequent later tiller maturity, resulted in greater DMYs for all cultivars. These results are in agreement with previous studies, where a single, end-of-season harvest provided maximum switchgrass DMYs [31,39,40,41,42,43,44,45]. Harvesting at later stages of switchgrass growth and development will also increase lignocellulose and decrease mineral concentration in biomass [38,42,46,47,48].
Canopy architecture not only affects plant growth via light interception, but it can also affect the composition of the biomass [49]. Canopy architecture traits related to morphological development have always been of great interest for researchers in order to enhance and optimize economic biomass yields. Results from our study demonstrated significant differences between switchgrass ecotypes for their MSC over the two growing seasons. Generally, upland ecotypes reached higher MSC than the lowland ecotypes on a given day of the year, and this difference between the upland and lowland ecotypes became larger at the start of reproductive development. Upland ecotypes emerged earlier in the spring and matured about two to three weeks earlier than the lowland ecotypes. Previous studies have also reported similar findings that upland ecotypes mature earlier than the lowland ecotypes [7,21,26]. Standard deviation of MSC (SMSC) presented as a simple linear function for all ecotypes as the growing season progressed in 2012, but variability for SMSC in 2013 was greater, especially during the mid-season harvest (Figure 1). This indicates that the tiller population of switchgrass ecotypes during mid-season harvests were comprised of diverse sub-stages. Reproductive development of switchgrass is linked with the day of year, or in other words day length, but it is not completely independent of other factors. In 2012, the onset of reproductive development was about two weeks earlier in all varieties than in 2013, which indicates that growing season temperatures also play an important role in switchgrass phenological development, and year-to-year variability can be explained by the differences in mean monthly temperatures.
Switchgrass LAI on the other hand, increased with advanced maturity and varied across years (Figure 3). In both years, switchgrass ecotypes accumulated LAI in a curvilinear manner. During mid-season, LAI reached its maximum and then declined due to leaf senescence. This developmental pattern for LAI development was described by Hernández et al. [50] as size/density compensation, where tiller number decreases, but biomass increases. Results from this study also revealed significant differences between switchgrass ecotypes for LAI. The greater LAI in 2012 might be the result of higher temperatures during early growth periods, which also decreased the LAI differences among upland and lowland ecotypes. These results are in agreement with previous research that switchgrass leaf/stem ratio increases at higher temperatures in both upland and lowland ecotypes [51]. However, in 2013, clear differences between upland and lowland switchgrass varieties for their LAI throughout the growing season occurred, clearly indicating an ecotypic effect. The 2013 year, being less warm than 2012, resulted in delayed spring emergence and delayed reproductive development in all switchgrass varieties compared to 2012. Van Esbroeck et al. [52] reported similar findings that slow leaf area appearance in switchgrass is associated with late panicle emergence. They reported about 60 days earlier panicle emergence in upland ecotypes “Cado” and “Cave-in-Rock” than the lowland type “Alamo”.
Biomass yields of all switchgrass ecotypes were inconsistent across years. The year 2012, being warmer than 2013 and with higher LAI and more tillers m−2 (Figure 3), also produced higher biomass yields than 2013 (Figure 4). This might be explained by the fact that at higher temperatures switchgrass varieties produced greater tiller numbers in 2012, and resulted in higher DMY than 2013. Kandel et al. [51] reported similar findings that at higher temperatures root/shoot and leaf/stem ratios increase in both upland and lowland ecotypes. Biomass yields of switchgrass ecotypes increased in a somewhat linear manner as the growing season progressed in both years. Maximum biomass yields in both years were observed during post-reproductive development and at the last harvest in all ecotypes. These results are consistent with past findings that maximum switchgrass biomass yields in the U.S. Midwest occurred in mid-August at full panicle emergence to post-anthesis [44]. In both years, “Kanlow” produced the highest biomass yields, and “Alamo” and “Cave-in-Rock” had the second highest biomass yields after “Kanlow”. “Cave-in-Rock”, the most recommended cultivar for Iowa, did not produce greater biomass yields than its lowland counterparts, but it performed better than all other upland cultivars (Figure 4).
Switchgrass has a determinate growth habit and as the inflorescence development initiates, vegetative growth is terminated [53,54]. This indicates that maximum biomass yields in switchgrass occur when most of the grass tillers are post-reproductive development. This phenomenon on the other hand also reduces the dry matter yield accumulation in early flowering plants by terminating their vegetative growth. Lowland cultivars with delayed maturity as compared to the upland cultivars, “Kanlow” and “Alamo” accumulates more vegetative biomass than upland ecotypes [15,52].
There was a strong quadratic relationship of MSC with LAI and DMY. However, a slight under prediction in both years after the mid-season of growth and development was also observed, which might be the result of faster LAI and dry matter accumulation. These findings are consistent with the previous studies [25,38,55]. Response of the MSC quadratic equations also varied from year to year which also indicates that this relationship can be affected by environmental factors such as temperature and precipitation [31].

5. Conclusions

In conclusion, results of this experiment show variability among switchgrass ecotypes for biomass yield and important morphological traits. These traits were also observed to have an impact on biomass yield accumulation and harvest management among switchgrass ecotypes. This study also provides support for planting lowland switchgrass varieties in Iowa to obtain greater biomass yields. However, delayed maturity in lowland ecotypes might also reduce their persistence in northern locations in the long term. Winter temperatures during the course of this study were fairly typical and no winter losses were observed. Therefore, we also suggest that lowland ecotypes be tested for their cold tolerance before being commercially grown for biomass production in Iowa. Moreover, the results of MSC relationship to LAI and DMY can also be useful in development of new and improvement of existing switchgrass morphological models for LAI and DMY prediction. However, this information would work best if the models are cultivar and region specific.

Author Contributions

M.A. and K.J.M. conceived and designed the experiment. M.A. and K.J.M. wrote the paper. A.W.L., S.V.A., E.A.H. and S.F. contributed expertise and helped in revising this paper.

Acknowledgments

This research supported by the U.S. Department of Agriculture National Institute of Food and Agriculture under award number 2011-68005-30411.

Conflicts of Interest

The authors declare no conflict of interest.

References

  1. Ragauskas, A.J.; Williams, C.K.; Davison, B.H.; Britovsek, G.; Cairney, C.A.; Frederick, W.J., Jr.; Hallett, J.P.; Leak, D.J.; Liotta, C.L.; Mielenz, J.R.; et al. The path forward for biofuels and biomaterials. Science 2006, 311, 484–489. [Google Scholar] [CrossRef] [PubMed]
  2. Farrell, A.J.; Richard, J.P.; Plevin, T.T.; Brian, D.J.; Andrew, O.M.; Daniel, M.K. Ethanol can contribute to energy and environmental goals. Science 2006, 311, 506–508. [Google Scholar] [CrossRef] [PubMed]
  3. Council for Agricultural Science and Technology (CAST). Convergence of Agriculture and Energy: II. Producing Cellulosic Biomass for Biofuels; CAST Commentary QTA 2007-2; USDA-ARS/UNL Faculty: Lincoln, NE, USA, 2007.
  4. Bransby, D.I.; Bouton, J.; Conger, B.; McLaughlin, S.B.; Ocumpaugh, W.R.; Parrish, D.; Taliaferro, K.; Vogel, K.; Wallschleger, S. Perspectives on New Crops and New Uses; Janick, J., Ed.; ASHS Press: Alexandria, VA, USA, 1999; pp. 282–299. [Google Scholar]
  5. Missaoui, A.M.; Bouton, J.H.; Paterson, A.H. Molecular markers for the classification of switchgrass (Panicum virgatum L.) germplasm and to assess genetic diversity in three synthetic switchgrass populations. Gen. Res. Crop Evol. 2006, 53, 1291–1302. [Google Scholar] [CrossRef]
  6. Douglas, J.L.; Edwards, S.D.; Grabowski, J.M. Evaluation of Warm Season Grass Species and Management Practices to Improve Biomass Production Potential in the Mid-South; USDA Natural Resource Conservation Services: Washington, DC, USA, 2004.
  7. Cassida, K.A.; Muir, J.P.; Hussey, M.A.; Read, J.C.; Venuto, B.C.; Ocumpaugh, W.R. Biomass yield and stand characteristics of switchgrass in south central U.S. environments. Crop Sci. 2005, 44, 673–681. [Google Scholar] [CrossRef]
  8. Bouton, J.H. Molecular breeding of switchgrass for use as a biofuel crop. Curr. Opin. Genet. Dev. 2007, 17, 553–558. [Google Scholar] [CrossRef] [PubMed]
  9. Moser, L.E.; Vogel, K.P. Switchgrass, big bluestem, and indiangrass. In Forages, Volume 1: An Introduction to Grassland Agriculture; Barnes, R.F., Miller, D.A., Nelson, C.J., Eds.; Iowa State University Press: Ames, IN, USA, 1995; Volume 5, pp. 9–420. [Google Scholar]
  10. Paine, L.K. Some ecological and socio-economic considerations for biomass energy crop production. Biomass Bioenergy 1996, 10, 231–242. [Google Scholar] [CrossRef]
  11. Sanderson, M.A. Switchgrass as a sustainable bioenergy crop. Biores. Technol. 1996, 56, 83–93. [Google Scholar] [CrossRef]
  12. McLaughing, S.B.; Kszos, L.A. Development of switchgrass (Panicum virgatum) as a bioenergy feedstock in the United States. Biomass Bioenergy 2005, 28, 515–535. [Google Scholar] [CrossRef]
  13. Gunter, L.E.; Tuskan, G.A.; Wullschleger, S.D. Diversity among populations of switchgrass based on RAPD markers. Crop Sci. 1996, 36, 1017–1022. [Google Scholar] [CrossRef]
  14. Stroup, J.A.; Sanderson, M.A.; Muir, J.P.; McFarland, M.J.; Reed, R.L. Comparison of growth and performance in upland and lowland switchgrass types to water and nitrogen stress. Bioresour. Technol. 2003, 86, 65–72. [Google Scholar] [CrossRef]
  15. Casler, M.D.; Vogel, K.P.; Taliaferro, C.M.; Wynia, R.L. Latitudinal adaptation of switchgrass populations. Crop Sci. 2004, 44, 293–303. [Google Scholar] [CrossRef]
  16. Das, M.K.; Fuentes, R.G.; Taliaferro, C.M. Genetic variability and trait relationships in switchgrass. Crop Sci. 2004, 44, 443–448. [Google Scholar] [CrossRef]
  17. Yang, J.; Worley, E.; Wang, M.; Lahner, B.; Salt, D.E.; Saha, M.; Udvardi, M. Natural variation for nutrient use and remobilization efficiencies in switchgrass. Bioenergy Res. 2009, 2, 257–266. [Google Scholar] [CrossRef]
  18. Cortese, L.M.; Honig, J.; Miller, C.; Bonos, S.A. Genetic diversity of twelve switchgrass populations using molecular and morphological markers. Bioenergy Res. 2010, 3, 262–271. [Google Scholar] [CrossRef]
  19. Casler, M.D.; Boe, A.R. Cultivar x environment interactions in switchgrass. Crop Sci. 2003, 43, 2226–2233. [Google Scholar] [CrossRef]
  20. Casler, M.D. Ecotypic variation among switchgrass populations from northern USA. Crop Sci. 2005, 45, 388–398. [Google Scholar] [CrossRef]
  21. Parrish, D.J.; Fike, J.H.; Bransby, D.I.; Samson, R. Establishing and managing switchgrass as an energy crop. Forage Grazinglands 2008. [Google Scholar] [CrossRef]
  22. Lewandowski, I.; Scurlock, J.M.O.; Lindvall, E.; Christou, M. The development and current status of perennial rhizomatous grasses as energy crops in the US and Europe. Biomass Bioenerg. 2003, 25, 335–361. [Google Scholar] [CrossRef]
  23. Casler, M.D. Switchgrass breeding, genetics, and genomics. In Switchgrass: A Valuable Biomass Crop for Energy; Monti, A., Ed.; Springer: London, UK, 2012; Volume 43, pp. 29–53. [Google Scholar]
  24. Aspinwall, M.J.; Lowry, D.B.; Taylor, S.H.; Juenger, T.E.; Hawkes, C.V.; Johnson, M.V.; Kiniry, J.R.; Fay, P.A. Genotypic variation in traits linked to climate and aboveground productivity in a widespread C4 grass: Evidence for a functional trait syndrome. New Phytol. 2013, 199, 966–980. [Google Scholar] [CrossRef] [PubMed]
  25. Moore, K.J.; Moser, L.E.; Vogel, K.P.; Waller, S.S.; Johnson, B.E.; Pedersen, J.F. Describing and quantifying growth stages of perennial forage grasses. Agron. J. 1991, 83, 1073–1077. [Google Scholar] [CrossRef]
  26. Sanderson, M.A.; Wolf, D.D. Morphological development of switchgrass in diverse environments. Agron. J. 1995, 87, 908–915. [Google Scholar] [CrossRef]
  27. Sanderson, M.A.; Wolf, D.D. Switchgrass biomass composition during morphological development in diverse environments. Crop Sci. 1995, 35, 1432–1438. [Google Scholar] [CrossRef]
  28. Madakadze, I.; Coulman, B.E.; Stewart, K.; Peterson, P.; Samson, R.; Smith, D.L. Phenology and tiller characteristics of big bluestem and switchgrass cultivars in a short growing season area. Agron. J. 1998, 90, 489–495. [Google Scholar] [CrossRef]
  29. Cornelius, D.R.; Johnston, C.O. Differences in plant type and reaction to rust among several collections of Panicum virgatum L. J. Am. Soc. Agron. 1941, 33, 115–124. [Google Scholar] [CrossRef]
  30. Hopkins, A.A.; Vogel, K.P.; Moore, K.J.; Johnson, K.D.; Carlson, I.T. Genotype effects and genotype by environment interactions for traits of elite switchgrass populations. Crop Sci. 1995, 35, 125–132. [Google Scholar] [CrossRef]
  31. Sanderson, M.A.; Reed, R.L.; Ocumpaugh, W.R.; Hussey, M.A.; Van Esbroeck, G.; Read, J.C.; Tischler, C.; Hons, F.M. Switchgrass cultivars and germplasm for biomass feedstock production in Texas. Bioresour. Technol. 1999, 67, 209–219. [Google Scholar] [CrossRef]
  32. Hopkins, A.A.; Vogel, K.P.; Moore, K.J.; Johnson, K.D.; Carlson, I.T. Genotypic variability and genotype × environment interactions among switchgrass accessions from the midwestern USA. Crop Sci. 1995, 35, 565–571. [Google Scholar] [CrossRef]
  33. Welles, J.M.; Norman, J.M. Instrument for indirect measurement of canopy architecture. Agron. J. 1991, 83, 818–825. [Google Scholar] [CrossRef]
  34. Sanderson, M.A.; Wedin, W.F. Phenological stage and herbage quality relationships in temperate grasses and legumes. Agron. J. 1989, 81, 864–869. [Google Scholar] [CrossRef]
  35. Hintz, R.W.; Albrecht, K.A. Prediction of alfalfa chemical composition from maturity and plant morphology. Crop Sci. 1991, 31, 1561–1565. [Google Scholar] [CrossRef]
  36. Dien, B.S.; Jung, H.G.; Vogel, K.P.; Casler, M.D.; Lamb, J.F.S.; Mitchell, R.B.; Sarath, G. Chemical composition and response to dilute-acid pretreatment and enzymatic saccharification of alfalfa, reed canarygrass and switchgrass. Biomass Bioenergy 2006, 30, 880–891. [Google Scholar] [CrossRef]
  37. Moore, K.J.; Moser, L.E. Quantifying developmental morphology of perennial grasses. Crop Sci. 1995, 35, 37–43. [Google Scholar] [CrossRef]
  38. Mitchell, R.B.; Fritz, J.; Moore, K.; Moser, L.E.; Vogel, K.P.; Redfearn, D.; Wester, D. Predicting forage quality in switchgrass and big bluestem. Agron. J. 2001, 93, 118–124. [Google Scholar] [CrossRef]
  39. Dwyer, D.S.; Elder, W.C.; Singh, G. Effects of height and frequency of clipping on pure stands of range grasses in North Central Oklahoma. Oklahoma Agricultural Experiment Station Bulletin; Oklahoma Agricultural Experiment Station: Stillwater, OK, USA, 1963; B-614. [Google Scholar]
  40. Balasko, J.A.; Burner, D.M.; Thayne, W.V. Yield and quality of switchgrass grown without soil amendments. Agron. J. 1984, 76, 204–208. [Google Scholar] [CrossRef]
  41. Trocsanyi, Z.K.; Fieldsend, A.F.; Wolf, D.D. Yield and canopy characteristics of switchgrass (Panicum virgatum L.) as influenced by cutting management. Biomass Bioenergy 2009, 33, 442–448. [Google Scholar] [CrossRef]
  42. Madakadze, I.C.; Stewart, K.; Peterson, P.R.; Coulman, B.E.; Smith, D.L. Switchgrass biomass and chemical composition for biofuel in eastern Canada. Agron. J. 1999, 91, 696–701. [Google Scholar] [CrossRef]
  43. Muir, J.P.; Sanderson, M.A.; Ocumpaugh, W.R.; Jones, R.M.; Reed, R.L. Biomass production of “Alamo” switchgrass in response to nitrogen, phosphorus, and row spacing. Agron. J. 2001, 93, 896–901. [Google Scholar] [CrossRef]
  44. Vogel, K.P.; Brejda, J.J.; Walters, D.T.; Buxton, D.R. Switchgrass biomass production in the Midwest USA: Harvest and nitrogen management. Agron. J. 2002, 94, 413–420. [Google Scholar] [CrossRef]
  45. Smart, A.J.; Moser, L.E.; Vogel, K.P. Morphological characteristics of big bluestem and switchgrass plants divergently selected for seedling tiller number. Crop Sci. 2004, 44, 607–613. [Google Scholar] [CrossRef]
  46. Jung, H.G.; Vogel, K.P. Lignification of switchgrass (Panicum virgatum) and big bluestem (Andropogon gerardii) plant parts during maturation and its effect on fiber degradability. J. Sci. Food Agric. 1992, 59, 169–176. [Google Scholar] [CrossRef]
  47. Mulkey, V.R.; Owens, V.N.; Lee, D.K. Management of switchgrass dominated Conservation Reserve Program lands for biomass production in South Dakota. Crop Sci. 2006, 46, 712–720. [Google Scholar] [CrossRef]
  48. Waramit, N.; Moore, K.J.; Heggenstaller, A.H. Composition of native warm-season grasses for bioenergy production, in response to nitrogen fertilization rate and harvest date. Agron. J. 2011, 103, 655–662. [Google Scholar] [CrossRef]
  49. Nelson, C.J.; Moser, L.E. Plant factors affecting forage quality. In Forage Quality, Evaluation, and Utilization; Fahey, G.C., Jr., Collins, M., Mertens, D.R., Moser, L.E., Eds.; ASA/CSSA/SSSA: Madison, WI, USA, 1994; pp. 115–154. [Google Scholar]
  50. Hernandez, G.A.; Matthew, C.; Hodgson, J. Tiller size/density compensation in perennial ryegrass miniature swards subject to differing defoliation heights and a proposed productivity index. Grass Forage Sci. 1999, 54, 347–356. [Google Scholar]
  51. Kandel, T.P.; Wu, Y.; Kakani, V. Growth and yield responses of switchgrass ecotypes to temperature. Am. J. Plant Sci. 2013, 4, 1173–1180. [Google Scholar] [CrossRef]
  52. Van Esbroeck, G.A.; Hussey, M.A.; Sanderson, M.A. Leaf appearance and final leaf number of switchgrass cultivars. Agron. J. 1997, 37, 864–870. [Google Scholar] [CrossRef]
  53. Dahl, B.E.; Hyder, D.N. Developmental morphology and management implications. In Rangeland Plant Physiology; Sosebee, R.E., Ed.; Society for Range Management: Denver, CO, USA, 1977; pp. 257–290. [Google Scholar]
  54. Mitchell, R.B.; Moore, K.J.; Moser, L.E.; Fritz, J.O.; Redfearn, D.D. Predicting developmental morphology in switchgrass and big bluestem. Agron. J. 1997, 89, 827–832. [Google Scholar] [CrossRef]
  55. Kalu, B.A.; Fick, G.W. Quantifying morphological development for studies of herbage quality. Crop Sci. 1981, 21, 267–271. [Google Scholar] [CrossRef]
Figure 1. MSC and standard deviation (SD) of mean stage count (SMSC) for five switchgrass varieties grown near Ames, IA in 2012 and 2013. Crop re-growth began on 1 May 2012 and on 15 May 2013. The upland and lowland varieties are denoted with straight and dotted lines, respectively.
Agronomy 08 00061 g001
Figure 2. Tiller demographics and MSC against day of year (DOY) for five switchgrass varieties grown near Ames, IA in 2012 and 2013.
Agronomy 08 00061 g002
Figure 3. Leaf Area Index (LAI) for five switchgrass varieties grown near Ames, IA in 2012 and 2013.
Agronomy 08 00061 g003
Figure 4. Dry Matter Yield (DMY) tons ha−1 for five switchgrass varieties grown near Ames, IA in 2012 and 2013.
Agronomy 08 00061 g004
Figure 5. MSC and LAI relationships for switchgrass cultivars grown near Ames, IA in 2012 and 2013.
Agronomy 08 00061 g005
Figure 6. MSC and DMY relationships for switchgrass cultivars grown near Ames, IA in 2012 and 2013.
Agronomy 08 00061 g006
Table 1. Mean monthly air temperature and precipitation for 2012–2013, and 20-year mean at Ames, IA.
Temperature (°C)Precipitation (mm)
Month2012201320-Year Mean2012201320-Year Mean
January−2−5−771520
February−1−3−4442025
March12−13603850
April1281012214898
May19161662180125
June2321217576132
July2723233726107
August2223227455124
September181918475081
October101112599761
November614234051
December−2−8−426827
Table 2. Analysis of variance (ANOVA) for mean stage count (MSC), leaf area index (LAI), and dry matter yield (DMY), and significance in response to switchgrass varieties and harvest dates during growing seasons 2012 and 2013 in Ames, IA.
ANOVAMSCLAIDMY
Year (Y)3.34.114.5 **
Harvest date (H)992.1 **406.3 **233 **
Y × H14.4 **59.3 **7.3 **
Variety (V)23 **54.7 **12 **
Y × V5.6 **26.2 **1.1
H × V3.8 **1.51.1
Y × H × V0.70.80.8
** Significant at the 0.01 probability level.

