Article

Genotype-by-Environment Interaction and Yield Stability of Maize Single Cross Hybrids Developed from Tropical Inbred Lines

by
Hortense Noëlle Apala Mafouasson
1,
Vernon Gracen
2,
Martin Agyei Yeboah
2,
Godswill Ntsomboh-Ntsefong
1,
Liliane Ngoune Tandzi
1,3,* and
Charles Shelton Mutengwa
3
1
Institute of Agricultural Research for Development (IRAD), P.O. Box 2123 Yaounde, Cameroon
2
West Africa Centre for Crop Improvement (WACCI), College of Basic and Applied Sciences, University of Ghana, PMB 30 Legon, Accra, Ghana
3
Department of Agronomy, University of Fort Hare, P. Bag X1314, Alice 5700, South Africa
*
Author to whom correspondence should be addressed.
Agronomy 2018, 8(5), 62; https://doi.org/10.3390/agronomy8050062
Submission received: 27 March 2018 / Revised: 19 April 2018 / Accepted: 25 April 2018 / Published: 1 May 2018
(This article belongs to the Special Issue Environmental and Management Factor Contributions to Maize Yield)

Abstract

:
Nitrogen (N) is one of the most important nutrients required for high productivity of the maize plant. In most farmers’ fields in Sub-Saharan Africa (SSA), there is low availability of N in the soil mainly due to continuous cultivation of the land, crop residues removal, little or no application of fertilizers and rapid leaching. There is a need to develop low N tolerant and adapted maize genotypes. Evaluation of maize genotypes under different nitrogen conditions would therefore be useful in identifying genotypes that combine stability with high yield potential for both stress and non-stress environment. Eighty maize hybrids were evaluated at Mbalmayo and Nkolbisson in Cameroon, during 2012 and 2013 minor and major cropping seasons across 11 environments under low and high N conditions. The objectives of the study were: (i) to determine the effect of genotype x environment interaction (G × E) on grain yield and yield stability of single cross maize hybrids across low N and optimum N environments and (ii) to identify genotypes to recommend for further use in the breeding program. Yield data of 80 hybrids were analyzed initially and the analysis of 20 best performing genotypes was further performed for a better visualization and interpretation of the results. Combined analysis of variance showed highly significant G × E effects for grain yield. The GGE biplot analysis divided the study area into three mega environments: one related to the major cropping season while the two others were related to the minor cropping season. The grain yield of the 20 highest yielding hybrids ranged from 4484.7 to 5198.3 kg ha−1. Hybrid 1368 × 87036 was the highest yielding in the minor season while the most outstanding hybrid, TL-11-A-1642-5 × 87036 was the best for the major season. The latter hybrid showed the potential for production across environments and should therefore be further tested in multiple environments to confirm consistency of its high yield performance and stability, and to facilitate its release as a commercial hybrid. High yielding but not stable hybrids across environments could be recommended for the specific environments where they performed well.

1. Introduction

Maize is one of the most important cereals in Sub-Saharan Africa (SSA) and a staple food for an estimated 50% of the population. It is an important source of carbohydrate, protein, iron, vitamin B, and minerals [1] and accounts for about 15% of the caloric intake of the population [2]. In Cameroon, maize is the most consumed cereal, much more than sorghum, rice and wheat [3]. Maize is grown in all the five agro ecological zones of the country, namely: Sudano-Sahelian Zone, High Guinea Savanna, Humid Forest Zone and the Western Highlands with a mono-modal rainfall pattern and the Humid Forest Zone with a bimodal rainfall pattern [4]. These agro-ecological zones are within an altitude ranging from zero and 4095 m above sea level. The crop is grown both by small and large scale farmers [3,4] under a wide range of conditions such as different soil types, soil fertility levels, moisture levels, different temperatures and cultural practices.
Low soil nitrogen (low N) limits maize yield production in diverse arable land. It is also one of the most important environmental constraints contributing to yield instability of maize. Ajala et al. [5] found large genotypic and phenotypic variances for maize grain yield under low and high N environments with low heritability estimates but with yield gain of more than 25% in all environments. Therefore, selection for grain yield and correlated traits under low N may result in improving maize performance under low N soil environments. Because of the high genotype × environment interactions involved, stressed experiments often produce rankings that differ significantly from one experiment to another, making it difficult to identify the best germplasm [6]. In general, maize yields are considerably low under the smallholders farming systems of the tropics than other environments predominantly due to lack of well-adapted and improved cultivars and due to genotype by environment (G × E) interaction [7]. Most farmers, especially small scale farmers usually grow varieties based on many criteria, but they usually do not consider the suitability of the variety to the environment which is usually influenced by many biotic and abiotic stresses among which is low soil nitrogen. Consequently, this always results in low yields compared to yields obtained in research stations [3]. In the bimodal forest zone of Cameroon, the average maize yield ranged from 0.8 to 1 t ha−1 at farmer level [8]. These low yields obtained by farmers are probably due to poor and unstable environmental conditions. Environmental conditions can fluctuate as a result of drought, reduced soil fertility, pressure from insects and diseases [9]. It has also been reported [9] that environmental conditions can further be amplified by socio-economic constraints faced by small scale farmers that result in suboptimal input application. The farmers usually have limited access to technology and inputs, especially fertilizer, irrigation facilities and pesticides and have no means to modify or condition the production environment [9]. The authors found that including selection under high priority abiotic stresses, such as drought and low N, in a routine breeding program and with adequate weighting can significantly increase maize yields in a highly variable drought-prone environment and particularly at lower yield levels.
Large genotype by environment interactions (G × E) commonly occur under stress conditions; consequently a variety which performs well in one environment during one season or year may not perform well in a different period or in a different site within the same region [10]. This is because genotypes exhibit different levels of phenotypic expression under different environmental conditions resulting in crossover performances [11]. Genotype × environment interaction is also the result from differences in the sensitivities of genotypes to the conditions in the target environment [11]. Genetic × environment interactions (G × E) are of major importance in developing improved genotypes across different environments. When G × E interaction effects are non-significant, means of evaluated varieties across environments are adequate indicators of genotypic performance across the environments. In this situation, the varieties are said to be stable across the environments [12]. Significant G × E indicates that selections from one environment may often perform differently in another and the variety is not stable across the environments [12]. Therefore, information on G × E may help in determining a breeding strategy. When G × E exists, it is necessary to determine whether there are important crossovers, i.e., rank changes of the genotypes in different environments, such that different winners are picked up in different environments [13]. When there is no change in rank of genotypes over environments, there is non-crossover type of interaction effects, and genotypes with superior means can be recommended for all the environments [13]. Breeders can also use information on G × E to choose appropriate locations for selection [13].
Maize growers need cultivars that are reliable and consistent across a wide array of stress conditions and have high yield potential that may be expressed when conditions become more favorable [14]. Plant breeders should therefore develop cultivars capable of withstanding unpredictable environmental variations [14]. In addition, the varieties developed should be stable across environments in order to be widely accepted by farmers throughout a region [14,15,16,17]. It is, therefore, important for newly improved maize cultivars to be evaluated at many sites and for a number of years before release [18,19]. Unfortunately, in these multi-location trials, varietal selection is often inefficient due to G × E and relative rankings of varieties usually differ across environments [15,17,18,20,21]. As a result, it becomes difficult to demonstrate the superiority of any single variety. This can be done through the use of various statistical models [19,20]. These statistical analyses give information on adaptability and stability of varieties across target environments. It would then be possible to identify varieties that are appropriate for a specific environment and those with stable performance across environments.
Many stability analysis models exist: joint regression analysis proposed by Eberhart and Russell [22] to estimate the average performance of a genotype in different environments relative to the mean performance of all genotypes in the same environment; multivariate analysis among which are the additive main effects and multiplicative interaction (AMMI) and the genotype and genotype by environment interaction (GGE) biplot analysis [19,20]. The AMMI model [23,24,25] and GGE biplot analysis [26] are the most common statistical tools used for the analysis of multi-environment trials (METs) [18,19]. The AMMI model combines analysis of variance for the genotype and environment main effects with principal components analysis of the G × E interactions [27]. The AMMI method captures a large portion of the G × E interaction sum of squares [28]. The AMMI can also help in informing important decisions in breeding programs, such as which genotypes exhibit specific adaptation and in selecting the testing environments [28]. This is important for new breeding programs that have not yet optimized their genotype testing networks. The results of an AMMI analysis are often presented in a biplot, which displays both the genotype and environment values and their relationships using the singular vector technique [29]. The GGE integrates the genotypic main effect with the G × E interaction effect (Yan et al., 2000). A GGE biplot can help in grouping mega-environments [27]. It can also help to identify more representative environments for cultivar evaluation [30] and to compare and rank genotypes using mean yields and stability [31]. The objectives of the study were to determine the effect of G × E on grain yield and yield stability of maize single cross hybrids across low N stress and optimal environments.

2. Materials and Methods

2.1. Germplasm

Eighty single-cross hybrids were used in this study with four of them serving as hybrid checks. The 76 hybrids were selected from 117 F1 developed by crossing thirty nine tropical inbred lines with three testers using a line × tester mating scheme [4]. The selection of hybrids was based on seeds availability. The lines included inbred lines from IRAD Cameroon, IITA, CIMMYT and lines from other African maize breeding programs. Of the 39 inbred lines, six were tolerant to low N, four to drought, five to acid soils and four to aluminum toxicity. The testers are parental lines of high yielding hybrids used as checks in this study. The four checks comprised three hybrids (87036 × Exp1 24, 9071 × Exp1 24, 87036 × 9071) from crosses among the 3 testers and hybrid 88069 × Cam inb gp1 17 a promising yellow hybrid of the national breeding program. The hybrid 87036 × Exp1 24 is a high yielding hybrid released in Cameroon and adapted to the Humid Forest Zone of Cameroon. Exp1 24 × 9071 is also a high yielding hybrid, developed from a cross between tropical lowland × temperate converted lines. Genotypes names and codes are presented in Table 1.

2.2. Experimental Sites

The 80 hybrids were evaluated at two locations (Mbalmayo and Nkolbisson) of the Humid Forest Zone of Cameroon with a bimodal rainfall pattern. These locations are among the maize growing areas of the Humid Forest Zone of Cameroon where are located the principal experimental sites of the Institute of Agricultural Research of Cameroon. Nkolbisson is located at 11°36′ E and 3°44′ N, 5 km from the main capital city ‘Yaoundé’. The altitude is 650 m above sea level (a.s.l.). The mean annual rainfall is 1560 mm with bimodal distribution. The average daily temperature is 23.5 °C. The soil is sandy clay [32]. Mbalmayo is located at 11°30′ E and 3°31′ N. The altitude is 641 m a.s.l. The mean annual rainfall varies from 1017 to 1990 mm with bimodal distribution. The mean monthly temperature varies from 25 °C to 22 °C. The soil is sandy clay [33]. Based on the results of soil analysis in 2012 and 2013, the soil in Mbalmayo had a pH of 5.97 which is moderately acidic, while at Nkolbisson, pH was 4.54 and the soil classified as strongly acid.
The main cropping system in Nkolbisson is maize/groundnut/cassava in sole cropping or mixed cropping while in Mbalmayo, other cultivated crops include banana, melon, plantain and vegetables [32]. The hybrids were evaluated in a total of 11 environments. Each environment was assigned a code and consisted of a combination of site × year × season × nitrogen level (Table 2). The soil management consisted of two nitrogen levels; Low N (20 kg ha−1) and Optimum N (100 kg ha−1). The geographical coordinates, climatic conditions of the localities and the 11 environments are described in (Table 2).

2.3. Site Preparation and Soil Analysis

The soil was depleted of available Nitrogen by high density maize cropping without fertilizer application, and complete removal of organic matter after harvest [6], in order to establish low N plots in Mbalmayo and Nkolbisson [4]. This was done at Mbalmayo thrice between 2010 and 2011 and at Nkolbisson for six growing seasons between 2008 and 2012. To ensure the low N status of the sites [32], composite soil samples were collected before each cropping season and analyzed at the soil laboratory of the International Institute of Tropical Agriculture (IITA) Cameroon [4]. Soils were air-dried and ground to pass through a 2 mm sieve. Soil pH in water was determined in a 1:2.5 (w/v) soil: water suspension. Organic C was determined by chromic acid digestion and spectrophotometric analysis [34]. Total N was determined from a wet acid digest [35] and analyzed by colorimetric analysis [36]. Exchangeable Ca, Mg, K, and Na were extracted using the Mehlich-3 procedure [37] and determined by atomic absorption spectrophotometry. Exchangeable Al extracted using 1N KCl [38] and analyzed using the pyrocatechol violet method described by Mosquera and Mombiela [39]. Available P was extracted by Bray-1 procedure and analyzed using the molybdate blue procedure described by Murphy and Riley [40]. P expressed in ppm or μg/g; Al, Ca, Mg, K, and Na reported as cmol(+)/kg or me/100 g. Organic C and Total N expressed as % particle size (three fractions) was determined by the hydrometer method. The results of soil analysis are presented in Table 3.

2.4. Experimental Design

The experiment was established in two replicates of single row experimental units with an 8 × 10 alpha lattice design using 80 maize hybrids [4]. Rows were 5 m long in Mbalmayo and 4 m long at Nkolbisson. Between row spacing was 0.75 m while spacing between hills within the same row was 0.5 m. At planting, each hill received three seeds which were later thinned to two plants for a final density of 53,330 plants per hectare. Split fertilization, weed and pest control were done on each plot as described in Mafouasson et al. [4].

2.5. Data Collection

Data for grain yield was obtained as follows: grains were harvested at maturity from each row. The total number of ears and ear weight was recorded for each plot. Five ears were then randomly selected from each plot and their grains were shelled. The “Dickey John” moisture tester was used to measure the percent grain moisture at harvest. Grain yield ((kg ha−1) for every entry from the data of fresh ear weight per plot (adjusted to 15% grain moisture) was calculated using the following formula [4]:
Grain   yield   ( kg   ha 1 ) = Fresh   ear   weight   ( kg / plot ) × ( 100 MC ) × 0.8 × 10,000 ( 100 15 ) × Area   harvested / plot
where:
  • MC = moisture content in grains at harvest (%)
  • 0.8 = Shelling coefficient
  • 10,000 m2 corresponds to 1 hectare
  • 15% = moisture content required in maize grain at storage

2.6. Statistical Analysis

Data obtained was subject to combined analysis of variance (ANOVA) with the PROC GLM procedure in SAS [41] using the RANDOM statement set to the TEST option. Environments were considered as random effects while genotypes were treated as fixed effects. Entry means were adjusted for block effects with reference to lattice design [42]. Each environment was defined as year × season × site × nitrogen treatment and the means were separated using Tukey’s test at p < 0.05 [4].
The AMMI statistical analysis of yield data was performed with Breeding View in the Integrated Breeding Platform Breeding Management System version 2.1 [43].
GGE biplot analysis was performed using Genstat 15th edition in order to identify genotypes that were suitable for the different environments as well as genotypes stable across the various environments, and to identify the different mega-environments. It was difficult to present the eighty hybrids on the AMMI and GGE biplot. Therefore, for a better visualization and interpretation of AMMI and GGE biplot, the top 20 best performing hybrids across environments and four checks were used for this analysis.

3. Results

3.1. Analysis of Variance for Grain Yield across Environments

The results of the combined ANOVA across environments for the 80 hybrids showed that genotype main effect (G), environment main effect (E) and G × E were all highly significant (p < 0.001) for grain yield (Table 4). The test environments contributed 60.13% of the total variation in the sum of squares for grain yield, while G and G × E sources of variation accounted for 6.81% and 33.05% of the total variation, respectively. The ratio of genotype (G) effect over genotype + genotype × environment (G + G × E) was 0.17.

3.2. Yield Performance of the 20 Best Performing Hybrids and Four Checks across Eleven Environments

The 20 best performing hybrids were selected from the 80 hybrids evaluated across environments based on their highest mean yields across the 11 environments. The four checks were added to the 20 hybrids. Yield performance data of these 24 hybrids across eleven environments is presented in Table 5. The overall mean across the 11 environments for the 20 selected hybrids ranged from 4484.7 kg ha−1 to 5198.3 kg ha−1. The highest yielding hybrid across environments was TL-11-A-1642-5 × 87036 with a yield of 5198 kg ha−1. All the 20 hybrids selected yielded higher than the four checks. The best check across environments was Exp1 24 × 9071 (3912.4 kg ha−1) followed by 87036 × Exp1 24 (3908.9 kg ha−1). The bold and underlined mean yields are for those hybrids that were the highest yielding in each environment. TL-11-A-1642-5 × 87036 was the highest yielding in two optimum environments E4 and E8 with 9531 kg ha−1 and 8874 kg ha−1. TL-11-A-1642-5 × Exp1 24 was the best performing in E2 (optimum) and E3 (low N) with 6427 and 5402 kg ha−1 respectively. Entrada 29 × Exp1 24 was also the highest yielding in two environments, E9 (low N) and E11 (optimum). One of the hybrid checks (87036 × Exp1 24) was not the best in any environments but was among the five highest yielding hybrids in E6 (optimum), E9 (low N) and E10 (optimum) with grain yield of 4232 kg ha−1 and 6410 kg ha−1 respectively (Table 5).

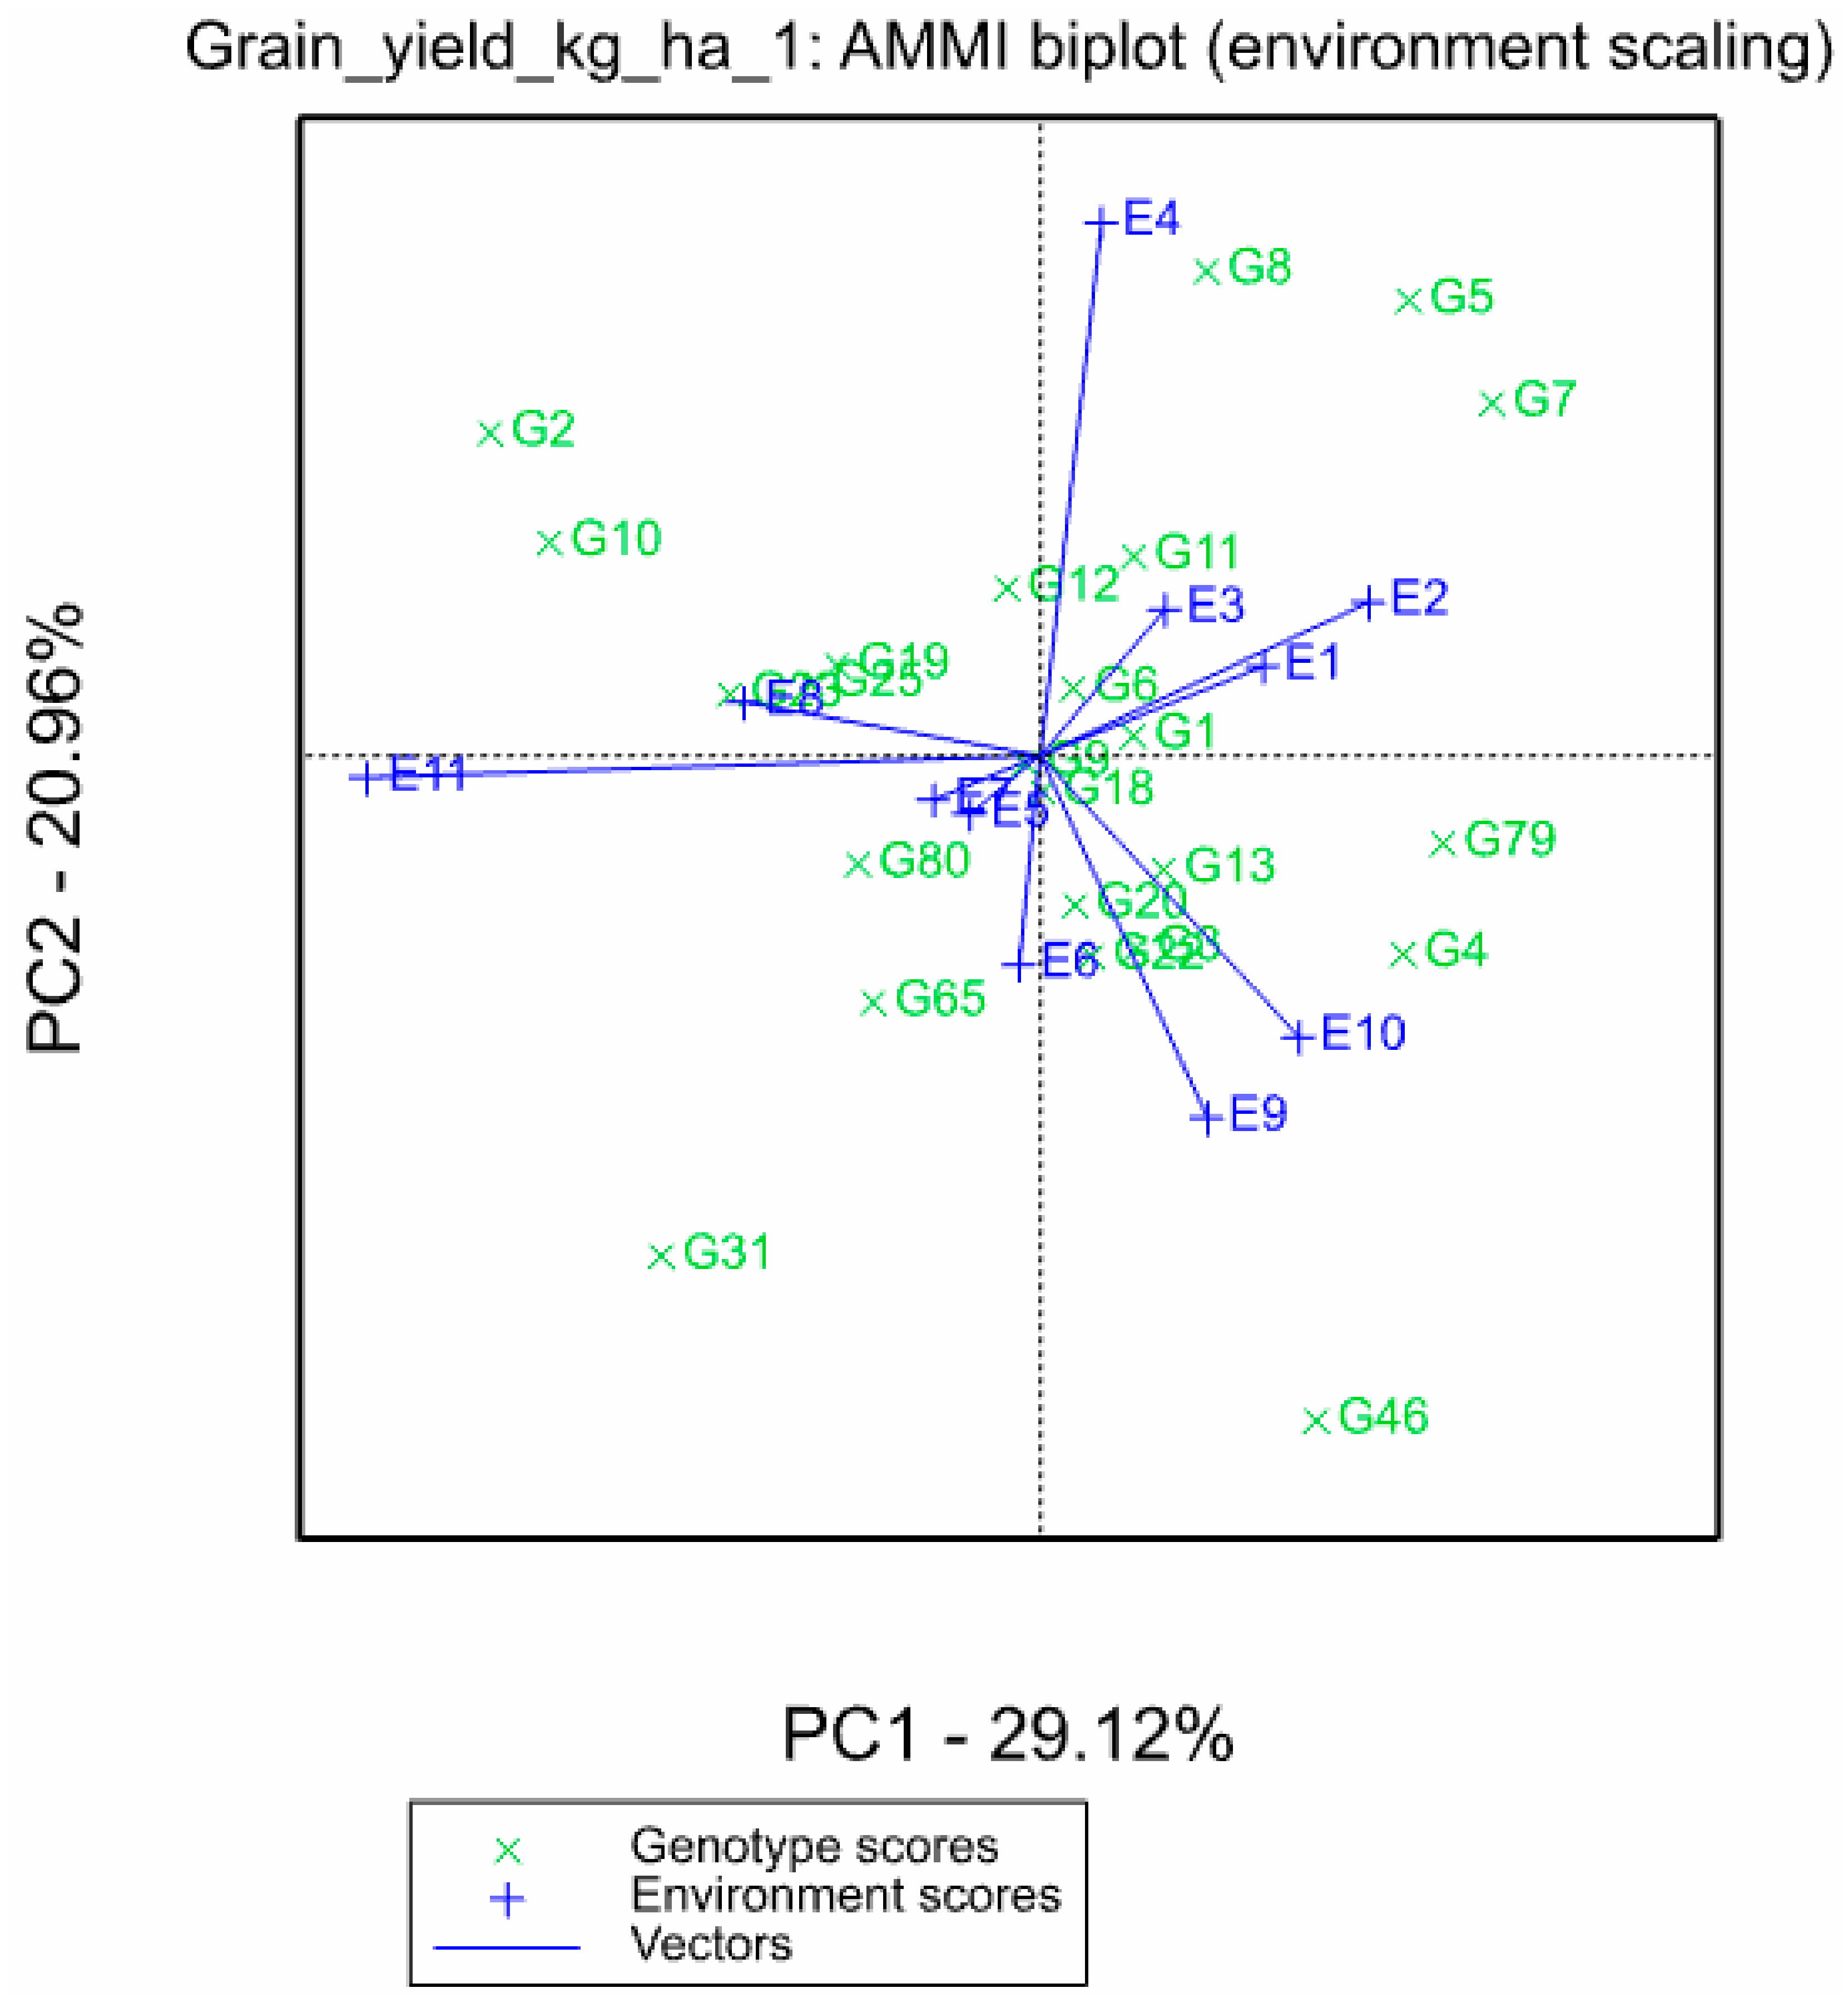
3.3. Additive Main Effect and Multiplicative Interaction (AMMI) Analysis of 24 Hybrids for Grain Yield

The results of AMMI biplot analysis of the 24 hybrids evaluated in 11 environments showed that environment accounted for 59.82% of the total variation in the sum of squares, while genotype and genotype by environment interaction accounted for 7.89% and 32.28 % of variation observed in grain yield respectively (Table 6).
In the AMMI biplot (Figure 1) the genotype and environment main effects for grain yield are on the x-axis while the IPCA1 (Interaction Principal Component Axis 1) scores are on the y-axis. The vertical line is the grand mean for grain yield and the horizontal line (y-ordinate) represents the IPCA1 value of zero.
In the AMMI biplot, the IPCA scores of a genotype are an indication of the stability of the genotype across environments. The more the IPCA score is close to zero, the more stable the genotype is across environments. The greater the IPCA scores, either positive or negative, the more specifically adapted a genotype is to certain environments. Accordingly, ATP S6-20-Y-1 × 87036 (G12) and CML395 × Exp1 24 (G18) had their IPCA1 close to zero and can be considered to have small interaction with the environments and to be the most stable hybrids (Figure 1). CML395 × Exp1 24 (G18) and ATP S6-20-Y-1 × 87036 (G12) had grain yield above the grand mean and CML395 × Exp1 24 (G18) was higher yielding than ATP S6-20-Y-1 × 87036 (G12) even though the difference was small. Among the 24 hybrids selected, 87036 × Exp1 24 (G46), Exp1 24 × 9071 (G65), 87036 × 9071(G79) and 88069 × Cam inb gp1 17 (G80) had grain yield response below the grand mean. The other 20 hybrids had grain yield above the grand mean. Among these 20 hybrids, TL-11-A-1642-5 × 87036 (G2) had the highest grain yield, followed by CLYN246 × 87036 (G1), ATP S6-20-Y-1 × Exp1 24 (G10) and CLWN201 × Exp1 24 (G3). TL-11-A-1642-5 × 87036 (G2) had a negative interaction with IPCA1. In contrast, TL-11-A-1642-5 × Exp1 24 (G7), 1368 × 87036 (G5) and J16-1 × Exp1 24 (G4) had yield above the grand mean with high positive IPCA1 scores. CLYN246 × 87036 (G1) and CLWN201 × Exp1 24 (G3) had comparable IPCA1 score and small interaction with environments. TL-11-A-1642-5 × 87036 (G2) was higher yielding than CLYN246 × 87036 (G1), but CLYN246 × 87036 (G1) was more stable than TL-11-A-1642-5 × 87036 (G2). ATP S6-20-Y-1 × Exp1 24 (G10), Entrada 29 × Exp1 24 (G31), ATP S6 20 Y-2 × Exp1 24 (G23), ATP S5 31 Y-2 × 87036 (G25) and CML451 × 87036 (G19) had grain yield above the grand mean and had negative interaction with IPCA1, and therefore negative interaction with the environments. Among the four low yielding hybrids, 88069 × Cam inb gp1 17 (G80) was the lowest yielding, followed by 87036 × 9071 (G79) which was the least stable among them.
G1 = CLYN246 × 87036; G2 = TL-11-A-1642-5 × 87036; G3 = CLWN201 × Exp1 24; G4 = J16-1 × Exp1 24; G5 = 1368 × 87036; G6 = CLQRCWQ26 × Exp1 24; G7 = TL-11-A-1642-5 × Exp1 24; G8 = TZ-STR-133 × 87036; G9 = CLWN201 × 87036; G10 = ATP S6-20-Y-1 × Exp1 24; G11 = CLA 18 × Exp1 24; G12 = ATP S6-20-Y-1 × 87036; G13 = Cam inb gp1 17 × 87036; G18 = CML395 × Exp1 24; G19 = CML451 × 87036; G20 = CML343 × 9071; G22 = CLQRCWQ26 × 87036; G23 = ATP S6 20 Y-2 × Exp1 24; G25 = ATP S5 31 Y-2 × 87036; G31 = Entrada 29 × Exp1 24; G46 = 87036 × Exp1 24; G65 = Exp1 24 × 9071; G79 = 87036 × 9071; G80 = 88069 × Cam inb gp1 17.
In AMMI biplot (Figure 2), environments are distributed from lower yielding in quadrant A (top left) and C (bottom left) to the higher yielding in quadrants B (top right) and D (bottom right).
This graph identified E1, E3, E5, E7 and E9 as low yielding environments. These were all low N environments in Mbalmayo and Nkolbisson in 2012 and 2013. Environments E4, E6, E8, E11 were identified as high yielding. These were optimum N plots in both locations in 2012 and 2013. The lowest yielding optimum environment was E2. The highest yielding environment was E4 (optimum N, minor season of 2012 at Nkolbisson) while the lowest was E3 (low N, minor season of 2012 at Nkolbisson).
The four highest yielding hybrids selected by AMMI for each environment are presented in Table 6. TL-11-A-1642-5 × 87036 (G2) appeared as the best hybrid in four (E5, E7, E8 and E11) out of 11environments. TL-11-A-1642-5 × 87036 (G2) was followed by TL-11-A-1642-5 × Exp1 24 (G7) which was the best in three environments (E1, E2 and E3) and 87036 × Exp1 24 (G46) was the highest yielding in two environments (E9 and E10). CLYN246 × 87036 (G1) appeared as the third in three environments and as fourth in three other environments. CLWN201 × Exp1 24 (G3) appeared as second, third and fourth in three different environments while ATP S6-20-Y-1 × Exp1 24 (G10) appeared as second in two environments and as third and fourth in two different environments.

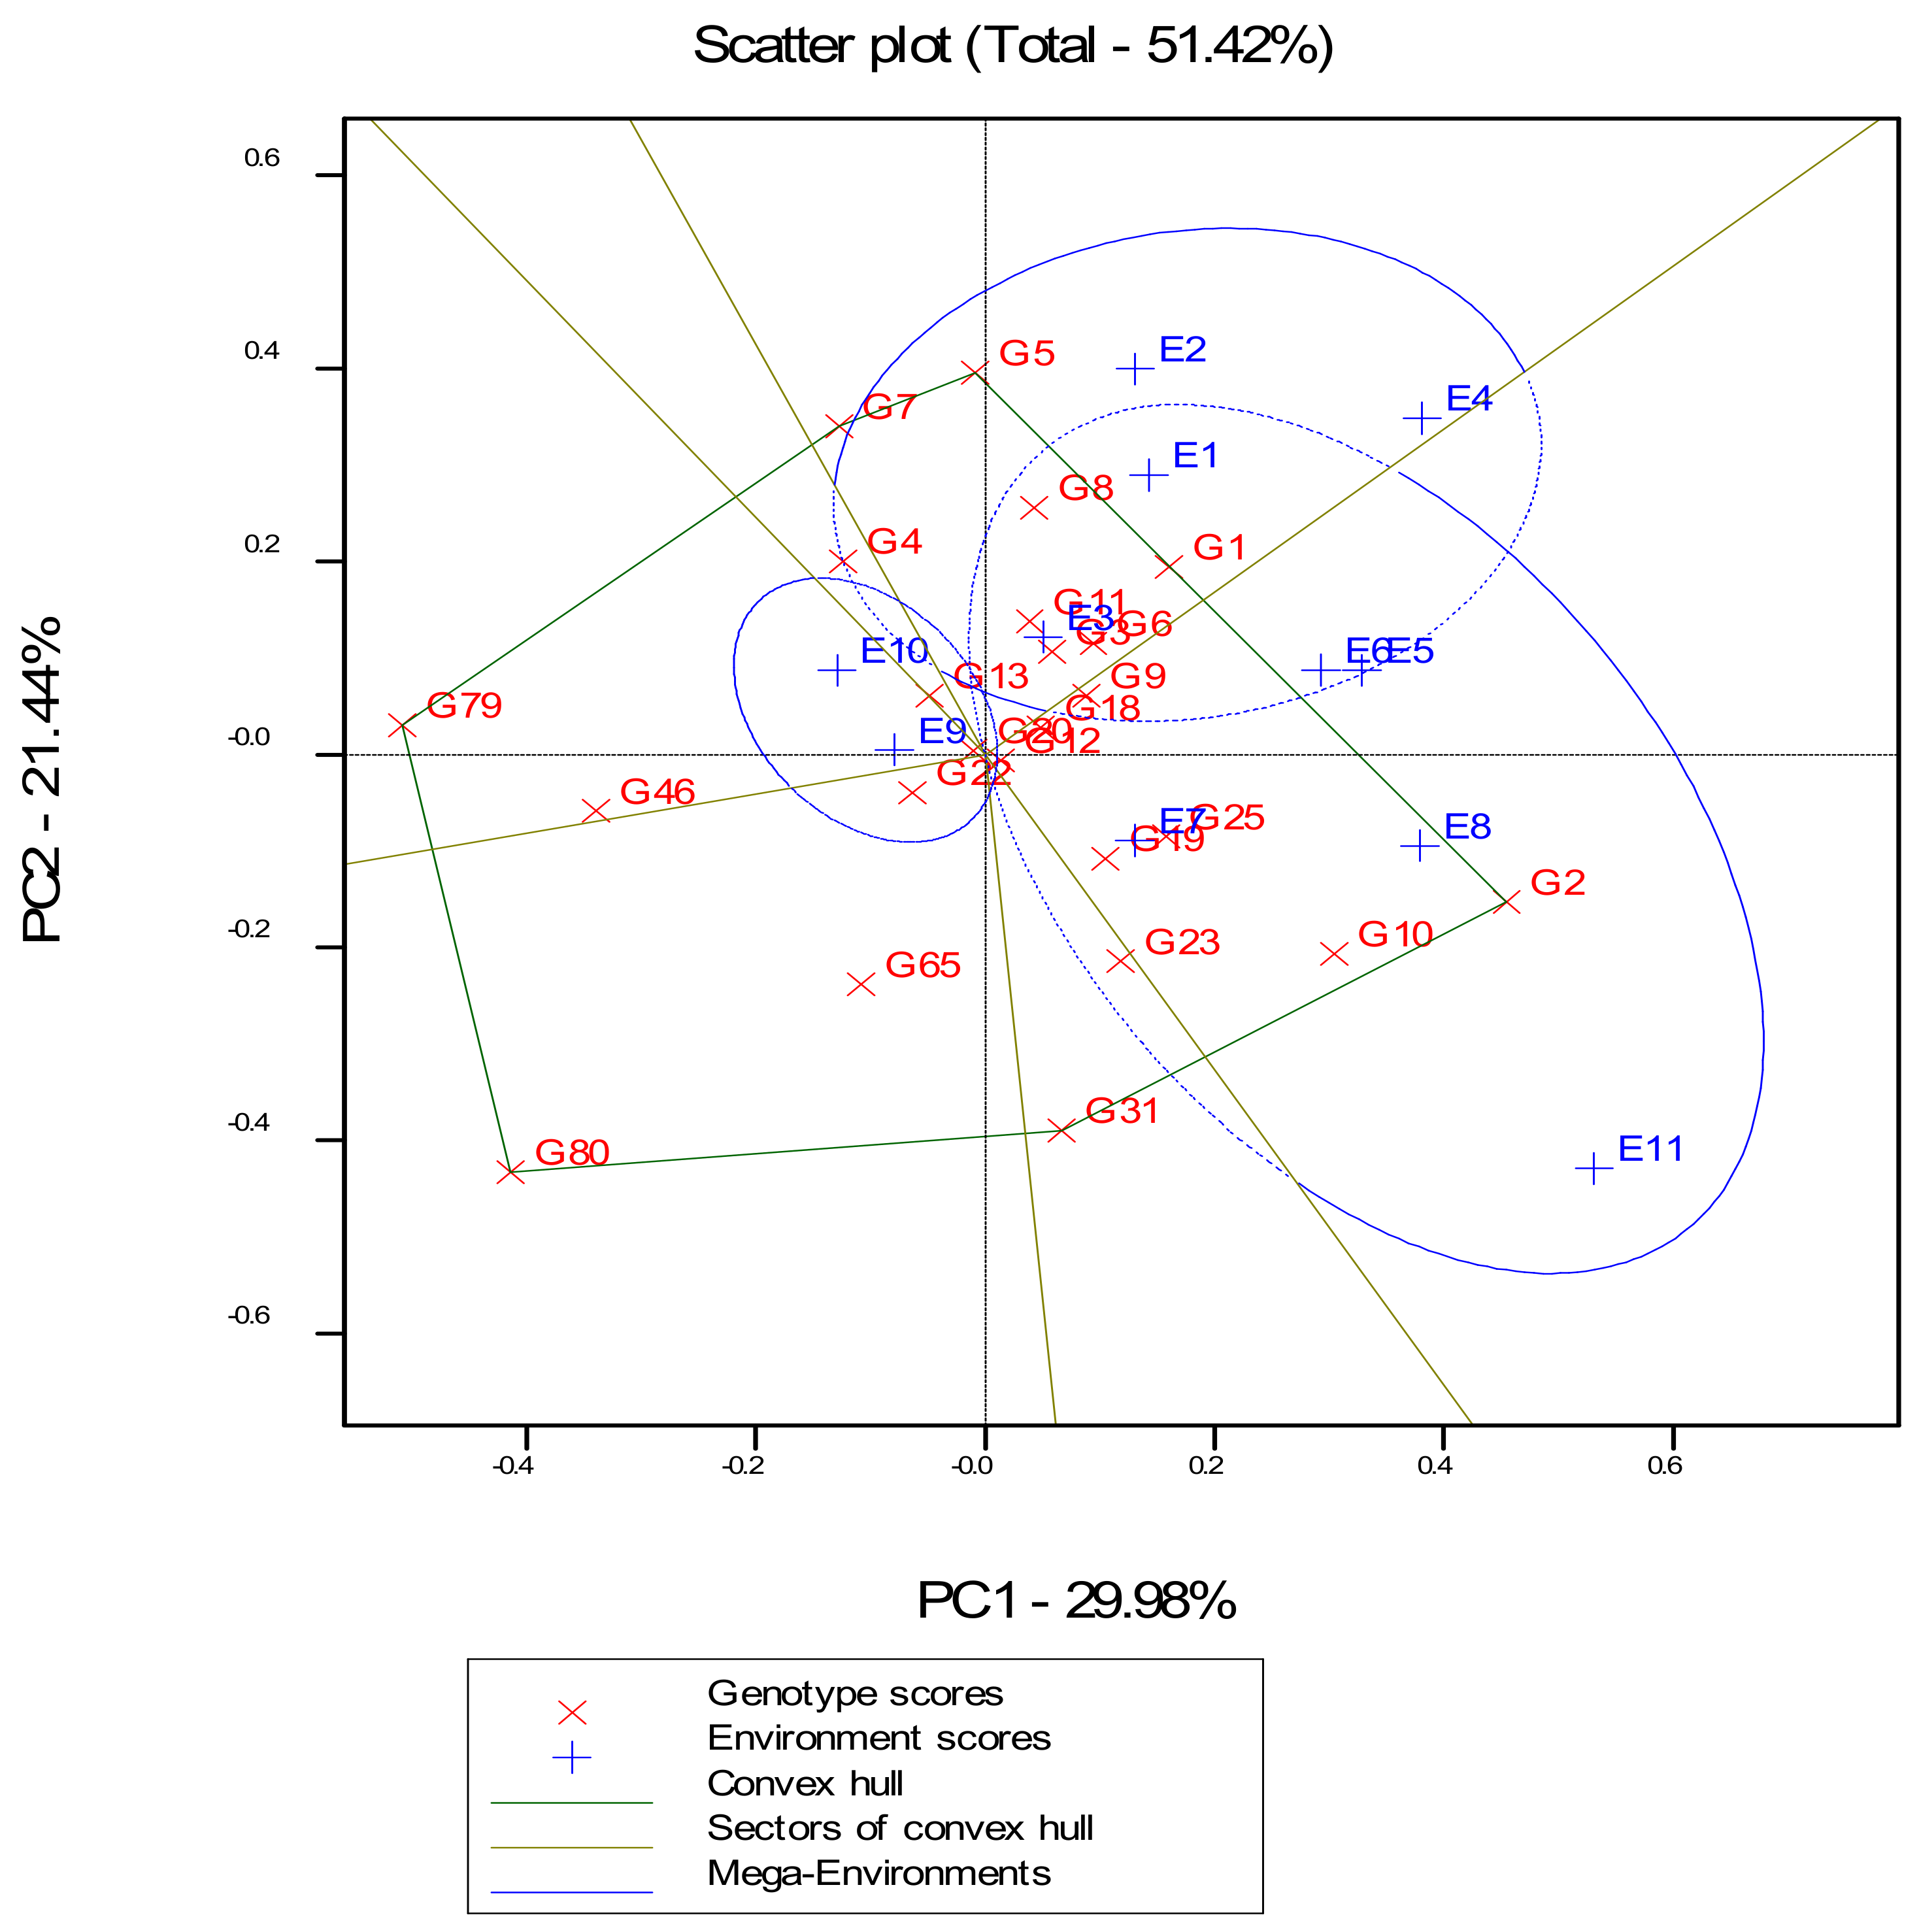
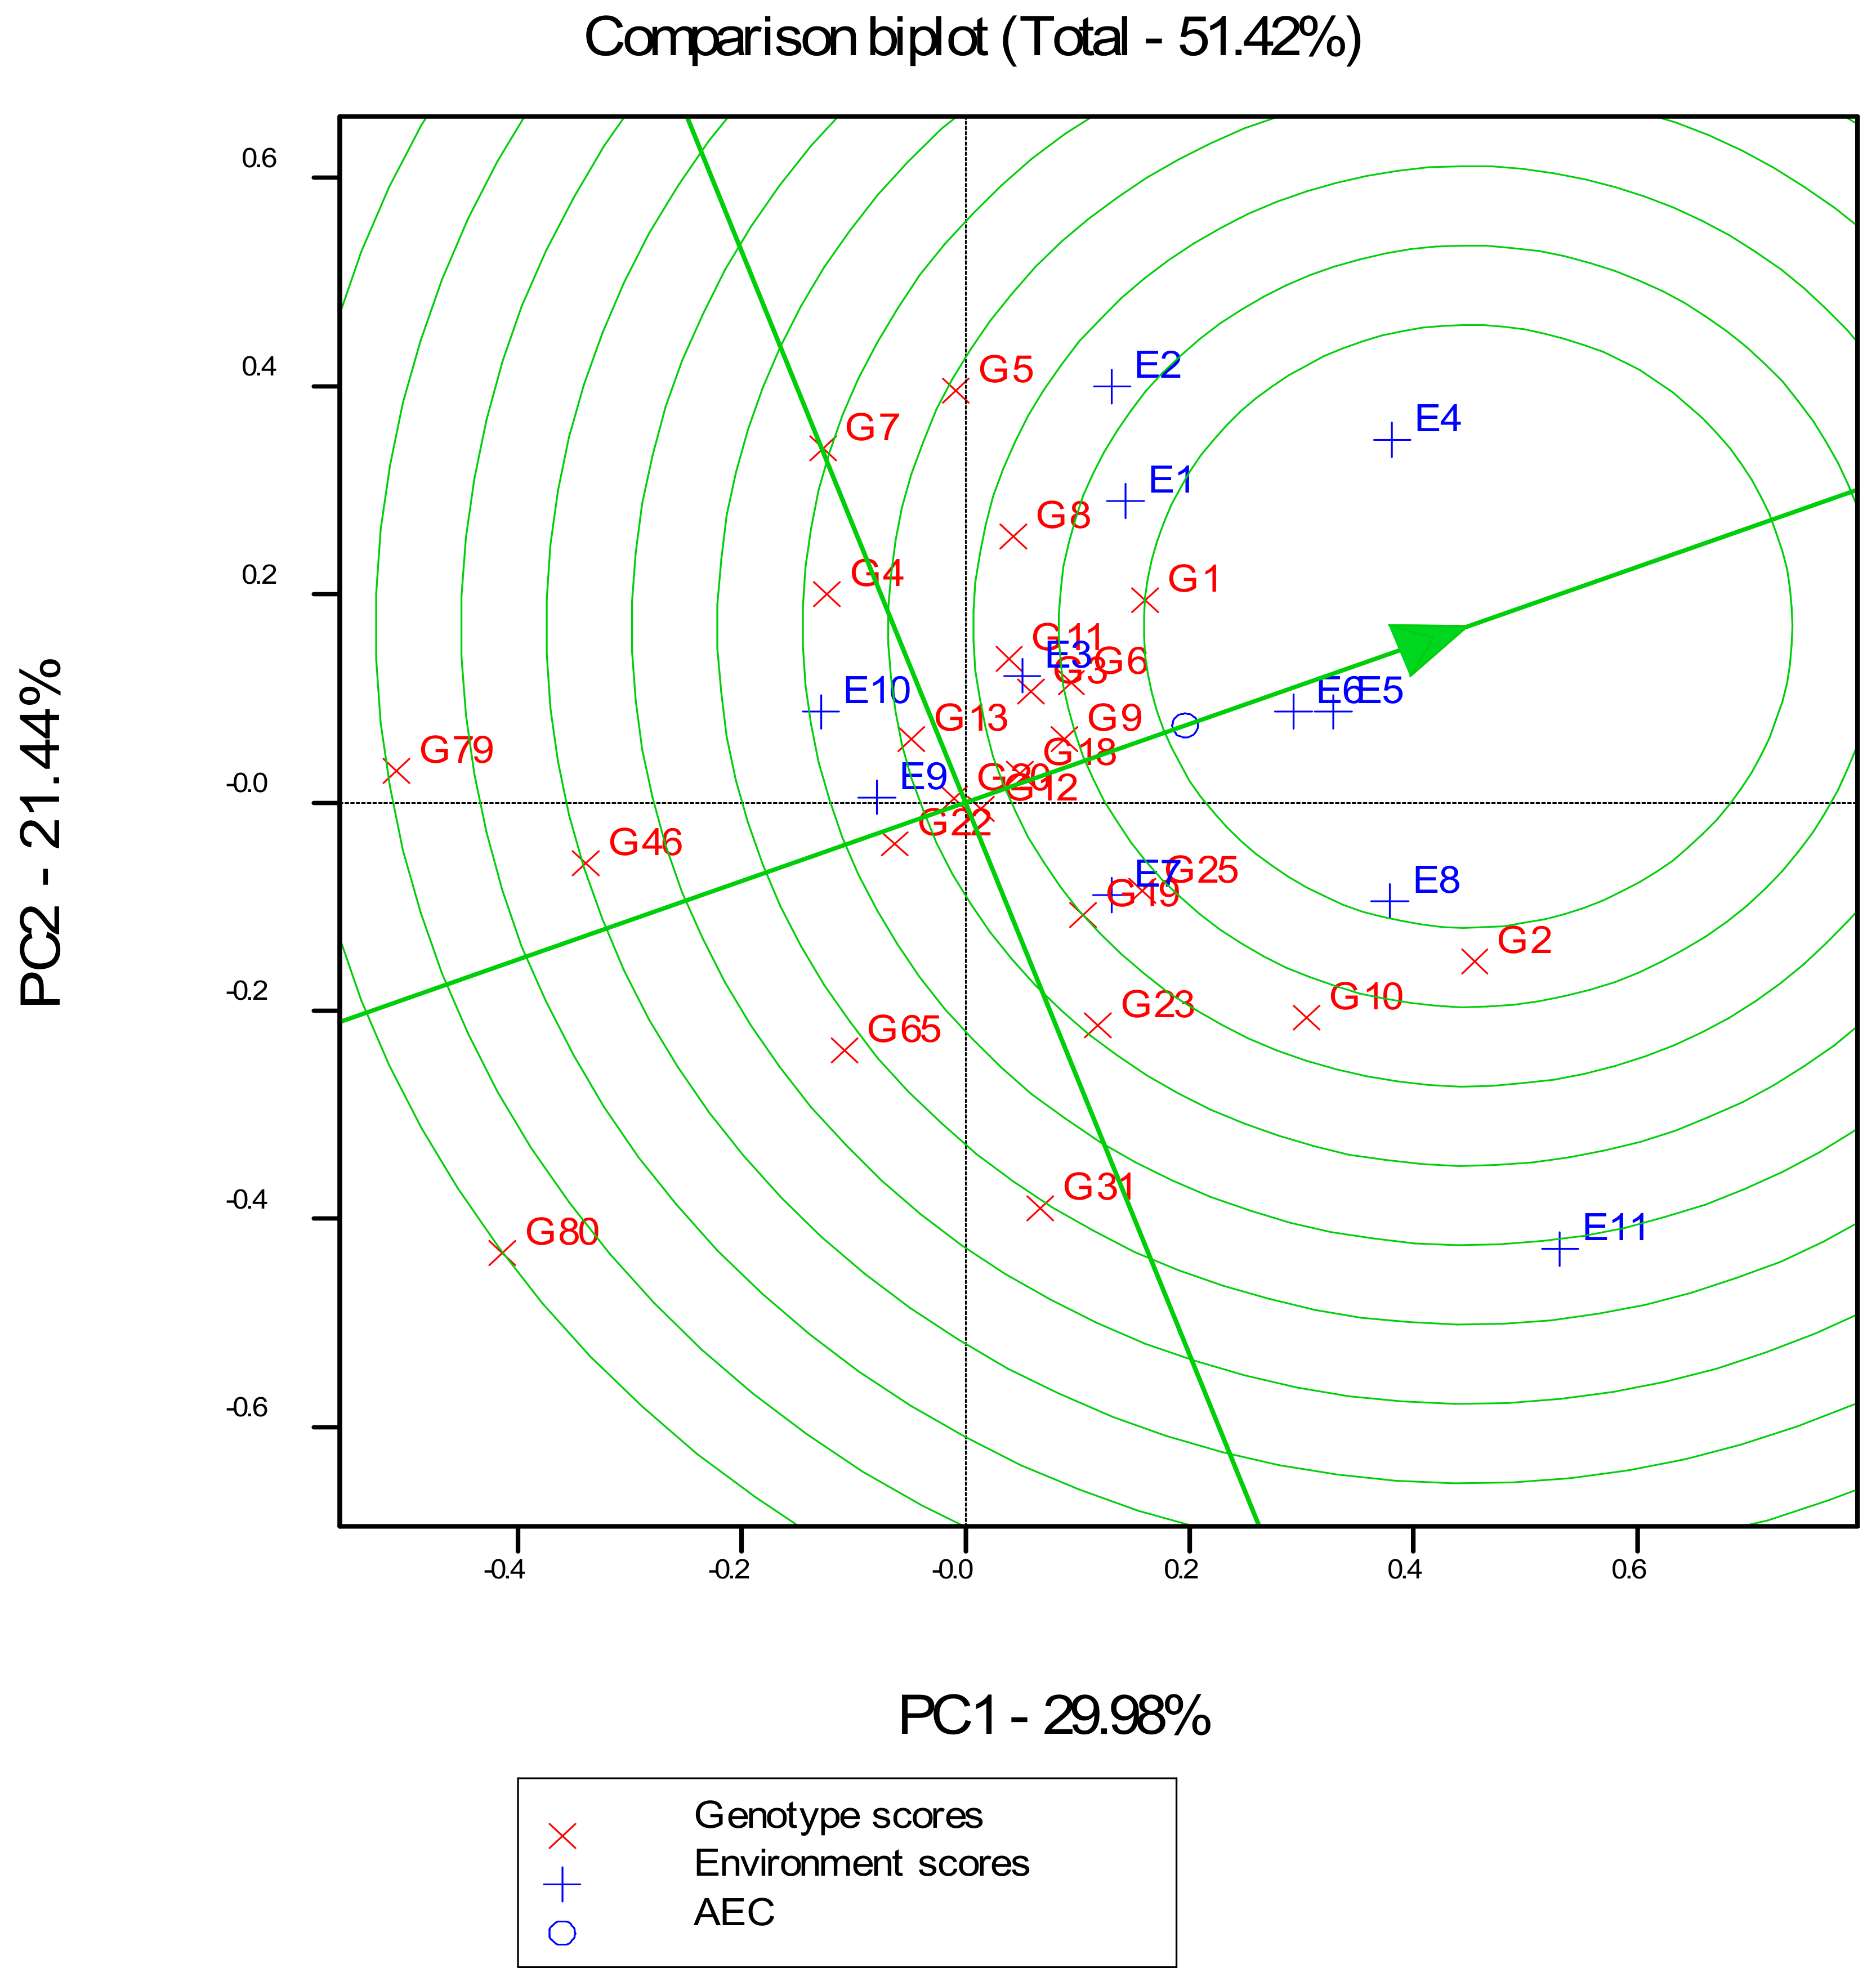
3.4. GGE Biplot Analysis of Best 20 Hybrids and Four Checks

The polygon view of the genotypes in the GGE biplot for 24 genotypes is presented in Figure 3. Primary (PC1) and secondary (PC2) scores were significant and explained 29.98% and 21.44% of the variation, respectively. Together they explained 51.42% of the genotype main effect and G × E interaction for the grain yield of maize hybrids evaluated in the 11 environments at Mbalmayo and Nkolbisson in 2012 and 2013.
The polygon view of a GGE biplot displayed the “which-won-where” pattern (Figure 3). The vertices of the polygon were the genotype markers located farthest away from the biplot origin in various directions, such that all genotype markers were contained within the resulting polygon. The biplot was divided into six sectors and three mega-environments and showed five vertex cultivars 1368 × 87036 (G5), TL-11-A-1642-5 × 87036 (G2), Entrada 29 × Exp1 24 (G31), 87036 × 9071 (G79) and 88069 × Cam inb gp1 17 (G80). The first mega-environment comprised E1, E2, E3 and E4 and had 1368 × 87036 as the highest yielding hybrid. These four environments were low N (E1and E3) and optimum N (E2 and E4), minor season of 2012 at Mbalmayo and Nkolbisson. The second mega-environment consisted of E5, E6, E7, E8 and E11 and had TL-11-A-1642-5 × 87036 (G2) as the highest yielding hybrid. These environments were low N (E5 and E7) and optimum N (E8 and E11) of major season in 2013 at Mbalmayo and Nkolbisson plus E11 which is optimum N plot of minor season of 2013 at Nkolbisson. The third comprised E9 and E10 (low N, and optimum N plots of minor season in 2013 at Mbalmayo), with the highest yielding hybrid as 87036 × 9071 (G79). This mega-environment contained 87036 × Exp1 24 (G46). No environment fell within the sector with Entrada 29 × Exp1 24 (G31) and 88069 × Cam inb gp1 17 (G80), indicating that these hybrids were not the best in any of the mega-environments, or they were the poorest cultivars in some or all of the environments. Genotypes within the polygon were less responsive than the vertex genotypes.
G1 = CLYN246 × 87036; G2 = TL-11-A-1642-5 × 87036; G3 = CLWN201 × Exp1 24; G4 = J16-1 × Exp1 24; G5 = 1368 × 87036; G6 = CLQRCWQ26 × Exp1 24; G7 = TL-11-A-1642-5 × Exp1 24; G8 = TZ-STR-133 × 87036; G9 = CLWN201 × 87036; G10 = ATP S6-20-Y-1 × Exp1 24; G11 = CLA 18 × Exp1 24; G12 = ATP S6-20-Y-1 × 87036; G13 = Cam inb gp1 17 × 87036; G18 = CML395 × Exp1 24; G19 = CML451 × 87036; G20 = CML343 × 9071; G22 = CLQRCWQ26 × 87036; G23 = ATP S6 20 Y-2 × Exp1 24; G25 = ATP S5 31 Y-2 × 87036; G31 = Entrada 29 × Exp1 24; G46 = 87036 × Exp1 24; G65 = Exp1 24 × 9071; G79 = 87036 × 9071; G80 = 88069 × Cam inb gp1 17.
Ranking of genotypes based on both mean grain yield and stability performance of the 20 best genotypes and four checks is presented in Figure 4 in order to identify the highest yielding and stable genotypes (Figure 4). Genotypes that are located at the center of the concentric circles are the ideal (highest yielding and stable). The GGE biplot identified CLYN246 × 87036 (G1) and TL-11-A-1642-5 × 87036 (G2) as superior since they were located close to the center of the concentric circles. Both were high yielding but TL-11-A-1642-5 × 87036 (G2) was the highest yielding and therefore the most desirable genotype. These hybrids were followed by CLQRCWQ26 × Exp1 24 (G6) and CLWN201 × 87036 (G9) (Figure 4).
G1 = CLYN246 × 87036; G2 = TL-11-A-1642-5 × 87036; G3 = CLWN201 × Exp1 24; G4 = J16-1 × Exp1 24; G5 = 1368 × 87036; G6 = CLQRCWQ26 × Exp1 24; G7 = TL-11-A-1642-5 × Exp1 24; G8 = TZ-STR-133 × 87036; G9 = CLWN201 × 87036; G10 = ATP S6-20-Y-1 × Exp1 24; G11 = CLA 18 × Exp1 24; G12 = ATP S6-20-Y-1 × 87036; G13 = Cam inb gp1 17 × 87036; G18 = CML395 × Exp1 24; G19 = CML451 × 87036; G20 = CML343 × 9071; G22 = CLQRCWQ26 × 87036; G23 = ATP S6 20 Y-2 × Exp1 24; G25 = ATP S5 31 Y-2 × 87036; G31 = Entrada 29 × Exp1 24; G46 = 87036 × Exp1 24; G65 = Exp1 24 × 9071; G79 = 87036 × 9071; G80 = 88069 × Cam inb gp1 17. The four checks were low yielding compared to the 20 hybrids selected. Hybrid 88069 × Cam inb gp1 17 (G80) was located far from the vertical axis at the left and far from the center of the concentric circle, therefore it was the most inferior hybrid in both mean grain yield and stability of performance.

4. Discussion

The greater variation contributed by environment than those from genotype and genotype × environment interaction indicated that the test environments were highly variable. This result is in agreement with Badu-Apraku et al. [18] who reported that contribution of test environments are much greater than from the other sources of variation in most multi-environmental trials. The highly significant G × E interaction for grain yield justified the use of AMMI and GGE biplots to decompose the G × E interactions and to determine the yield potential and stability of the evaluated single cross hybrids.
The results of the AMMI biplot analysis of the 24 hybrids evaluated in 11 environments also showed that environment effects accounted for 59.82% of the total variation in the sum of squares and was the highest value compared to the other components. The AMMI biplot revealed large variability among the 11 environments, but the yield range among the 24 hybrids was narrow. This is probably because the 20 hybrids were the best selected. ATP S6-20-Y-1 × 87036 and CML395 × Exp1 24 have IPCA1 scores near zero and therefore had small interaction with the environments. This small interaction with environments suggested that these hybrids are stable across environments [13].TL-11-A-1642-5 × 87036 was identified as the highest yielding hybrid. It was followed by CLYN246 × 87036, ATP S6-20-Y-1 × Exp1 24 and CLWN201 × Exp1 24. All these hybrids, except ATP S6-20-Y-1 × Exp1 24 are crosses between CIMMYT and IRAD lines. Acquaah [44] indicated that the development of adapted high yielding hybrids requires that the varieties used as parents are genetically divergent. The high yields obtained between CIMMYT and IRAD lines could therefore imply that they are genetically diverse. The negative interaction of TL-11-A-1642-5 × 87036 with the IPCA1 suggests that this hybrid was less sensitive to environmental changes and was likely to be adapted to unfavorable environments as indicated by Badu-Apraku et al. [18]. In contrast, TL-11-A-1642-5 × Exp1 24, 1368 × 87036 and J16-1 × Exp1 24 had large positive interaction with IPCA1 and might be more sensitive to environmental changes, and probably more adapted to favorable environments.
TL-11-A-1642-5 × 87036 was higher yielding than CLYN246 × 87036, but CLYN246 × 87036 was more stable than TL-11-A-1642-5 × 87036. Hybrids ATP S6-20-Y-1 × Exp1 24, Entrada 29 × Exp1 24, ATP S6 20 Y-2 × Exp1 24, ATP S5 31 Y-2 × 87036 and CML451 × 87036 had grain yield above the grand mean and negative interaction with the environments. Therefore, these hybrids were less sensitive to variation in the environments. They are also most likely to be adapted to unfavorable environments which in this study are low N environments.
AMMI biplot displayed the distribution of environments from low to high yielding in different quadrants of the graph. This graph placed all low N environments (E1, E3, E5, E7, E9) in the quadrants of lower yielding genotypes and showed the optimum environments (E4, E6, E8, E11) in quadrants of high yielding genotypes as expected.
The GGE biplot analysis of grain yield response and stability of 24 hybrids showed that PC1 explained 29.98% of total variation while PC2 explained 21.44% and together, the two axes accounted for 51.42%. This suggested that the biplot of PC1 and PC2 adequately approximated the environment centered data. The biplot for 24 hybrids was divided into six sectors and three mega-environments in which different cultivars should be selected and deployed to similar environments as suggested by Yan and Tinker [45]. According to Yan and Rajcan [46] a mega-environment is defined as the subset of locations that consistently share the best set of genotypes across years and the growing regions are relatively homogeneous with similar biotic and abiotic stresses and cropping system requirements.
In the polygon view, the vertex genotype in each sector represents the highest yielding genotype in the location that falls within that particular sector [13,26,45]. Accordingly, the biplot identified five vertex genotypes: 1368 × 87036, TL-11-A-1642-5 × 87036, Entrada 29 × Exp1 24, 87036 × 9071 and 88069 × Cam inb gp1 17.
Two out of the three mega-environments identified by the GGE biplot included both low and optimum N plots of the two locations, but they were related to different years and different growing seasons. The third mega-environment was related to one specific season of one specific year, but included two nitrogen treatments of one site. This could imply that the mega-environments constructed are based on growing seasons (minor or major) and not on different sites, or different nitrogen treatments. This suggests that seasons and years may have accounted more for significant environmental differences and to different genotypic responses to environments as indicated by Sibiya et al. [10]. It might probably be due to similar variation in rainfall amount and distribution as well as biotic stresses within seasons of each year which might have caused the 24 genotypes to have similar relative performance from one environment to another in the mega-environments. In the Bimodal Humid Forest Zone of Cameroon, there are two growing seasons, the major season and the minor season. During the minor season, the total rainfall was lower, the duration of the rainy period is usually shorter than in the major season. Moreover, during the minor season there is prevalence of many diseases such as fungal diseases (e.g., Maize leaf blight caused by Exserohilum turcicum) and maize stem borers among which the main species is Busseola fusca Fuller [47,48].
The results obtained suggest that highest yielding hybrids identified for each mega-environment should be proposed for environments similar to those of these mega-environments. Therefore, hybrids 1368 × 87036 could be proposed for the minor season and TL-11-A-1642-5 × 87036 for the major season. However, this should be done after further evaluation of hybrids in more environments including more locations, years and seasons as recommended by Yan and Tinker [45] who indicated the need for crossover interactions to be repeatable across the years so that target environments can be divided into mega-environments and genotypes be recommended based on METs (multi-environment trials). Yan and Tinker [13] indicated that an ideal genotype should be one that combines both high mean yield performance and high stability across environments; it should be on average environmental coordinate (AEC) on positive direction and have a vector length equal to the longest vector of the genotype as indicated by an arrow pointed to it. Accordingly, the GGE biplot identified TL-11-A-1642-5 × 87036 and CLYN246 × 87036 as closest to the ideal genotype. According to Badu-Apraku et al. [14], in the process of selecting for broad adaptation in maize production, an ideal genotype should have both high mean performance and high stability. TL-11-A-1642-5 × 87036 and CLYN246 × 87036 which were the highest yielding and the most stable hybrids across environments could therefore be selected for broad adaptation (production across environments). These hybrids were followed by CLQRCWQ26 × Exp1 24 and CLWN201 × Exp1 24. The top 20 hybrids performed better than the checks. The poor performance of the check 87036 × Exp1 24, a commercial hybrid, compared to the other hybrids might be due to the fact that it was developed many years ago and might not be adapted to changes (climatic, diseases) that might have occurred in the environments.

5. Conclusions

This study revealed that genotypes, environments and genotype × environment interaction were significant for grain yield. The genotypes therefore performed differently with respect to yield in each of the eleven test environments and their relative performance varied from one environment to another. AMMI analysis showed that environment effects accounted for a larger proportion of the total variation in the sum of squares for grain yield than genotype effects and genotype × environment effects. The AMMI biplot showed large variability among the environments but a narrow range for yields among hybrids. The GGE biplot classified the study area into three mega-environments. These mega-environments seemed to be related to the two growing seasons of the year (minor and major). High yielding hybrids were identified for each mega-environment and could be proposed for release for production in similar conditions. These hybrids are 1368 × 87036 for mega-environment 1, which is related to the minor season and TL-11-A-1642-5 × 87036 for Mega environment 2, which is related to the major season. The most outstanding hybrid was TL-11-A-1642-5 × 87036. This hybrid has the potential for production across environments and should therefore be tested further in multiple environments to confirm consistency of its high yield performance and stability to facilitate its release as a commercial hybrid. Hybrids which were selected as high yielding, but were not stable across environments could be recommended for the specific environments where they performed well. The results of this study should therefore be confirmed through further evaluation of hybrids at different locations of the Bimodal Humid Forest Zone during both minor and major seasons for several years.

Author Contributions

H.N.A.M. and V.G. conceived and designed the experiments; H.N.A.M. performed the experiments; H.N.A.M. and M.A.Y. analyzed the data; H.N.A.M., L.N.T., G.N.-N. and C.M. wrote the paper.

Acknowledgments

This study is part of the PhD work supported by Alliance for Green Revolution in Africa (AGRA) through the West Africa Centre for Crop Improvement (WACCI), University of Ghana. We are grateful to IRAD for the research facilities and to IITA and CIMMYT for supplying germplasm used in the study. We appreciate the post-doctoral fellowship awarded by Govan Mbeki Research and Development Centre (GMRDC) to Tandzi which facilitates the publication of the present paper.

Conflicts of Interest

The authors declare no conflict of interest.

References

  1. Badu-Apraku, B.; Akinwale, R. Identification of early-maturing maize inbred lines based on multiple traits under drought and low N environments for hybrid development and population improvement. Can. J. Plant Sci. 2011, 91, 931–942. [Google Scholar] [CrossRef]
  2. Ngo Nonga, F. Durabilité des Activités Agricoles des Exploitations Familiales Agricoles à Base de Maïs du Grand Sud Cameroun, 2èmes Journées de Recherches en Sciences Sociales; INRA SFER CIRAD: Lille, France, 2008; p. 20. [Google Scholar]
  3. Derera, J. Genetic Effects and Associations between Grain Yield Potential, Stress Tolerance and Yield Stability in Southern African Maize (Zea mays L.) Base Germplasm; School of Biochemistry, Genetics, Microbiology and Plant Pathology, Faculty of Science and Agriculture, University of KwaZulu-Natal: Durban, South Africa, 2005; p. 175. [Google Scholar]
  4. Mafouasson, A.H.N.; Kenga, R.; Gracen, V.; Yeboah, A.M.; Mahamane, N.L.; Tandzi, N.L.; Ntsomboh-Ntsefong, G. Combining Ability and Gene Action of Tropical Maize (Zea mays L.) Inbred Lines under Low and High Nitrogen Conditions. J. Agric. Sci. 2017, 9, 222–235. [Google Scholar]
  5. Ajala, S.O.; Olaniyan, A.B.; Olayiwola, M.O.; Job, A.O. Yield improvement in maize for tolerance to low soil nitrogen. Plant Breed. 2018, 137, 118–126. [Google Scholar] [CrossRef]
  6. Bänziger, M.; Edmeades, G.O.; Beck, D.; Bellon, M. Breeding for Drought and Nitrogen Stress Tolerance in Maize: From Theory to Practice; CIMMYT: Mexico, Mexico, 2000. [Google Scholar]
  7. Abakemal, D.; Shimelis, H.; Derera, J. Genotype-by environment interaction and yield stability of quality protein maize hybrids developed from tropical-highland adapted inbred lines. Euphytica 2016, 209, 757–769. [Google Scholar] [CrossRef]
  8. Citizens Association for the Defense of Collective Interests (ACDIC). The Maize Crisis and the Misfortunes of Cameroon’s Agriculture; ACDIC: Yaounde, Cameroon, 2010; p. 46. [Google Scholar]
  9. Bänziger, M.; Setimela, P.S.; Hodson, D.; Vivek, B. Breeding for improved drought tolerance in maize adapted to Southern Africa. “New directions for a diverse planet”. In Proceedings of the 4th International Crop Science Congress, Brisbane, Australia, 26 September–1 October 2004; [CDROM]: International Crop Science Congress: Brisbane, Australia, 2004. [Google Scholar]
  10. Sibiya, J.; Tongoona, P.; Derera, J.; Rij, N. Genetic analysis and genotype by environment (G X E) for grey leaf spot disease resistance in elite African maize (Zea mays L.) germplasm. Euphytica 2012, 185, 349–362. [Google Scholar] [CrossRef]
  11. Falconer, D.S.; Mackay, T.F.C. Introduction to Quantitative Genetics; Longman: New York, NY, USA, 1996. [Google Scholar]
  12. Miti, F. Breeding Investigations of Maize (Zea mays L.) Genotypes for Tolerance Tolow Nitrogen and Drought in Zambia. Ph.D. Thesis, University of Kwa-Zulu Natal, Pietermaritzburg, South Africa, 2007; 196p. [Google Scholar]
  13. Yan, W.; Tinker, N.A. Biplot analysis of multi-environment trial data: Principles and applications. Can. J. Plant Sci. 2006, 86, 623–645. [Google Scholar] [CrossRef]
  14. Kenga, R. Combining Ability Estimates and Heterosis in Selected Tropical Sorghum (Sorghum bicolor (L.) Moench); Department of Plant Science, Faculty of Agriculture, Ahmadu Bello University Zaria: Zaria, Nigeria, 2001; p. 186. [Google Scholar]
  15. Khalil, I.A.; Rahman, H.U.; Rehman, N.U.; Arif, M.; Khalil, I.H.; Iqbal, M.; Hidayatullah; Afridi, K.; Sajjad, M.; Ishaq, M. Evaluation of maize hybrids for grain yield stability in north-west of Pakistan. Sarhad J. Agric. 2011, 27, 213–218. [Google Scholar]
  16. IITA. Maize 2014. Available online: http://www.iita.org/maize (accessed on 16 June 2014).
  17. Etoundi, S.M.N.; Dia, K.B. Determinants of the adoption of improved varieties of Maize in Cameroon: Case of CMS 8704. Globalisation, Institutions and African Economic Development. In Proceedings of the African Economic Conference, Tunis, Tunisia, 12–14 November 2008; pp. 397–413. [Google Scholar]
  18. Badu-Apraku, B.; Oyekunle, M.; Obeng-Antwi, K.; Osuman, A.S.; Ado, S.G.; Coulibay, N.; Yallou, C.G.; Abdulai, M.; Boakyewaa, G.A.; Didjeira, A. Performance of extra-early maize cultivars based on GGE biplot and AMMI analysis. J. Agric. Sci. 2012, 150, 473–483. [Google Scholar] [CrossRef]
  19. Ndhlela, T. Improvement Strategies for Yield Potential, Disease Resistance and Drought Tolerance of Zimbabwean Maize Inbred Lines; Department of Plant Sciences (Plant Breeding), University of the Free State: Bloemfontein, South Africa, 2012; 295p. [Google Scholar]
  20. Adu, G.B.; Akromah, R.; Abdulai, M.S.; Obeng-Antwi, K.; Kena, A.W.; Tengan, K.M.L.; Alidu, H. Assessment of Genotype by Environment interactions and Grain Yield Performance of Extra-Early Maize (Zea mays L.) Hybrids. J. Biol. Agric. Healthc. 2013, 3, 7–15. [Google Scholar]
  21. Badu-Apraku, B.; Akinwale, R.O.; Menkir, A.; Obeng-Antwi, K.; Osuman, A.S.; Coulibaly, N.; Onyibe, J.E.; Yallou, G.C.; Abdullai, M.S.; Didjera, A. Use of GGE Biplot for Targeting Early Maturing Maize Cultivars to Mega-environments in West Africa. Afr. Crop Sci. J. 2011, 19, 79–96. [Google Scholar] [CrossRef]
  22. Eberhart, S.A.; Russell, W.A. Stability parameters for comparing varieties. Crop Sci. 1966, 6, 36–40. [Google Scholar] [CrossRef]
  23. Gauch, H.G. Model selection and validation for yield trials with interaction. Biometrics 1988, 44, 705–715. [Google Scholar] [CrossRef]
  24. Gauch, H.G.; Zobel, R.W. Identifying mega-environments and targeting genotypes. Crop Sci. 1997, 37, 311–326. [Google Scholar] [CrossRef]
  25. Zobel, R.W.; Wright, M.J.; Gauch, H.G. Statistical analysis of a yield trial. Agron. J. 1988, 80, 388–393. [Google Scholar] [CrossRef]
  26. Yan, W.; Hunt, L.A.; Sheng, Q.; Szlavnics, Z. Cultivar evaluation and mega-environment investigation based on the GGE biplot. Crop Sci. 2000, 40, 597–605. [Google Scholar] [CrossRef]
  27. Gauch, H.G.; Zobel, R.W. AMMI analyses of yield trials. In Genotype by Environment Interaction; Kang, M.S., Gauch, H.G., Eds.; CRC Press: Boca Raton, FL, USA, 1996; pp. 85–122. [Google Scholar]
  28. Ebdon, J.S.; Gauch, H.G. Additive main effects and multiplicative interaction analysis of national turfgrass performance trials. Crop Sci. 2002, 42, 497–506. [Google Scholar] [CrossRef]
  29. Gauch, H.G. Statistical analysis of yield trials by AMMI and GGE. Crop Sci. 2006, 46, 1488–1500. [Google Scholar] [CrossRef]
  30. Cooper, M.; Stucker, R.E.; DeLacy, I.H.; Harch, B.D. Wheat breeding nurseries, target environments, and indirect selection for grain yield. Crop Sci. 1997, 37, 1168–1176. [Google Scholar] [CrossRef]
  31. Yan, W. GGEbiplot-a windows application for graphical analysis of multi-environment trial data and other types of two-way data. Agron. J. 2001, 93, 1111–1118. [Google Scholar] [CrossRef]
  32. The, C.; Ngonkeu, M.L.; Zonkeng, C.; Apala, H.M. Evaluation and Selection of Maize (Zea mays L.) Genotypes Tolerant to Low N Soil. Optimizing Productivity of Food Crop Genotypes in Low Nutrient Soils; IAEA-TECDOC-1721: Vienna, Austria, 2013; pp. 251–264. [Google Scholar]
  33. Tchienkoua, M. Soil and Land-Use Survey of the Northern Section of the Mbalmayo Forest Reserve (Southern Cameroon). A Study for the Selection of the IITA Humid Forest Station Site; Ressource and Crop Management Research Monography N° 24; International Institute of Tropical Agriculture: Ibadan, Nigeria, 1996; p. 65. [Google Scholar]
  34. Heanes, D.L. Determination of organic C in soils by an improved chromic acid digestion and spectrophotometric procedure. Commun. Soil Sci. Plant Anal. 1984, 15, 1191–1213. [Google Scholar] [CrossRef]
  35. Buondonno, A.; Rashad, A.A.; Coppola, E. Comparing tests for soil fertility. II. The hydrogen peroxide/sulfuric acid treatment as an alternative to the copper/selenium catalyzed digestion process for routine determination of soil nitrogen-Kjeldahl. Commun. Soil Sci. Plant Anal. 1995, 26, 1607–1619. [Google Scholar] [CrossRef]
  36. Anderson, J.M.; Ingram, J.S.I. Tropical Soil Biology and Fertility: A Handbook of Methods, 2nd ed.; CAB International, The Cambrian News: Aberstwyth, UK, 1993; p. 221. [Google Scholar]
  37. Mehlich, M. Mehlich 3 soil text extractant: A modification of the Mehlich 2 extractant. Commun. Soil Sci. Plant Anal. 1984, 15, 1409–1416. [Google Scholar] [CrossRef]
  38. Barnhisel, R.; Bertsch, P. Aluminum. In Methods of Soil Analysis, Part 2, Chemical and Microbiological Properties; Page, A., Miller, R., Keeney, D., Eds.; American Society of Agronomy: Madison, WI, USA, 1982; pp. 275–300. [Google Scholar]
  39. Mosquera, A.; Mombiela, F. Comparison of three methods for determination of soil Al in an unbuffered salt-extract. Commun. Soil Sci. Plant Anal. 1986, 17, 30–35. [Google Scholar] [CrossRef]
  40. Murphy, J.; Riley, J.P. A modified single solution method for determination of phosphate in natural waters. Anal. Chim. Acta 1962, 27, 31–36. [Google Scholar] [CrossRef]
  41. Statistical Analysis System (SAS), version SAS/STAT 9.2; SAS Institute Inc.: Cary, NC, USA, 2008.
  42. Cochran, W.G.; Cox, G.M. Experimental Designs; John Wiley & Sons: Hoboken, NJ, USA, 1960. [Google Scholar]
  43. The IBP Breeding Management System Version 2.1. The Intergated Breeding Platform. May 2014. Available online: https://www.integratedbreeding.net/breeding-management-system (accessed on 13 May 2014).
  44. Acquaah, G. Principles of Plant Genetics and Breeding; Wiley-Blackwell Publishers: Hoboken, NJ, USA, 2007. [Google Scholar]
  45. Yan, W.; Tinker, N.A. An intergrated biplot analysis system for displaying interpreting, exploring genotyped by environments interactions. Crop Sci. 2005, 45, 1004–1016. [Google Scholar] [CrossRef]
  46. Yan, W.; Rajcan, I. Biplot evaluation of test sites and trait relations of soybean in Ontario. Crop Sci. 2002, 42, 11–20. [Google Scholar] [CrossRef] [PubMed]
  47. Aroga, R.; Ambassa-kiki, R.; The, C.; Enyong, L.; Ajala, S.O. On farm evaluation of performance of selecetd improved maize varieties in the forest zone of Central Cameroon. In Proceedings of the Seventh Eastern and Southern Africa Regional Maize Conference, Nairobi, Kenya, 5–11 February 2002; pp. 432–437. [Google Scholar]
  48. Aroga, R.; Coderre, D. Abondance et diversité des foreurs de tiges et grains dans une biculture maïs-arachide au centre du Cameroun. Afr. Crop Sci. J. 2000, 8, 365–374. [Google Scholar]
Figure 1. AMMI Biplot for grain of 24 maize hybrids showing genotypes and environments (E1-E11) plotted against their IPCA1 scores. (Codes for environments in Table 2).
Agronomy 08 00062 g001
Figure 2. Biplot of the additive main effects and multiplicative interaction (AMMI) showing the relationship among 11 testing environments (E1–E11). (Codes of genotypes in Table 1 and environments in Table 2).
Agronomy 08 00062 g002
Figure 3. A “which won where” biplot based on grain yield of 24 single hybrids evaluated in 11 environments.
Agronomy 08 00062 g003
Figure 4. Comparison view of 24 hybrids with the ideal genotype based on average grain yield and stability for grain yield across 11 environments in 2012 and 2013.
Agronomy 08 00062 g004
Table 1. Names and codes of 80 single cross hybrids evaluated across 11 environments in 2012 and 2013.
GenotypesCodeGenotypesCode
CLYN246 × 87036G188069 × 87036G39
TL-11-A-1642-5 × 87036G2ATP S8 30 Y-3 × 87036G40
CLWN201 × Exp1 24G3CML 254 × Exp1 24G41
J16-1 × Exp1 24G4CLYN246 × 9071G42
1368 × 87036G5CLWN201 × 9071G43
CLQRCWQ26 × Exp1 24G6CML343 × Exp1 24G44
TL-11-A-1642-5 × Exp1 24G7CLQRCWQ26 × 9071G45
TZ-STR-133 × 87036G8ATP S9 30 Y-1 × Exp1 24G47
CLWN201 × 87036G9ATP S6-20-Y-1 × 9071G48
ATP S6-20-Y-1 × Exp1 24G10J16-1 × 9071G49
CLA 18 × Exp1 24G11CML 358 × Exp1 24G50
ATP S6-20-Y-1 × 87036G12Entrada 3 × 87036G51
Cam inb gp1 17 × 87036G13CML494 × 87036G52
J16-1 × 87036G14J18-1 × 87036G53
4001STR × 87036G15CML 444 × 87036G54
CML343 × 87036G16Cam inb gp1 17 × 9071G55
CLA 18 × 87036G17ATP S5 31 Y-2 × 9071G56
CML395 × Exp1 24G18V-481-73 × Exp1 24G57
CML451 × 87036G19Cla 17 × Exp1 24G58
CML343 × 9071G205057 × Exp1 24G59
88069 × 9071G21ATP S8 30 Y-3 × Exp1 24G60
CLQRCWQ26 × 87036G22KU1414 × Exp1 24G61
ATP S6 20 Y-2 × Exp1 24G23TZ-STR-133 × Exp1 24G62
4001STR × 9071G24ATP S5 31 Y-2 × Exp1 24G63
ATP S5 31 Y-2 × 87036G25ATP S6 20 Y-2 × 9071G64
ATP S9 30 Y-1 × 87036G26Cla 17 × 87036G66
1368 × Exp1 24G27ATP S8 30 Y-3 × 9071G67
CML165 × 87036G28CML 254 × 87036G68
CML 358 × 87036G2988094 × 87036G69
KU1414 × 87036G30TZ-STR-133 × 9071G70
Entrada 29 × Exp1 24G31CML451 × 9071G71
CML494 × 9071G32CML 254 × 9071G72
CML 444 × Exp1 24G33TZMI 102 × 87036G73
88069 × Exp1 24G34TZMI 102 × Exp1 24G74
Cam inb gp1 17 × Exp1 24G35Ku1409 × 9071G75
CLYN246 × Exp1 24G36Entrada 3 × 9071G76
1368 × 9071G375012 × 87036G77
Ku1409 × 87036G38Ku1409 × Exp1 24G78
Checks
87036 × Exp1 24G4687036 × 9071G79
Exp1 24 × 9071G6588069 × Cam inb gp1 17G80
Table 2. Description of the eleven environments used to evaluate the 80 hybrids.
SiteLatitude, Longitude
and Altitude
Environments CodeYearSeasonSoil ManagementAverage Rain Fall
Mbalmayo3°31′ N, 11°30′ E,
641 m a.s.l.
E12012MinorLow N488.87 mm
E22012MinorOptimum N488.87 mm
E52013MajorLow N583.46 mm
E62013MajorOptimum N583.46 mm
E92013MinorLow N499.66 mm
E102013MinorOptimum N499.66 mm
Nkolbisson3° 44 N, 11°36 E,
650 m a.s.l.
E32012MinorLow N281 (October–November) *
E42012MinorOptimum N281 (October–November) *
E72013MajorLow N936 mm
E82013MajorOptimum N936 mm
E112013MinorOptimun N662 mm
a.s.l. = above sea level; Low N = low soil nitrogen; Rainfall data were collected at Mbalmayo by IITA and at Nkolbisson by the Rice Project PRODERiP; Major season: From March to June; Minor season: From September to November; * Data for the entire season in this environment were not available.
Table 3. Soil characteristics at Mbalmayo and Nkolbisson before the trials in 2012 and nitrogen level in 2013.
Chemical CharacteristicsMbalmayoNkolbisson
0–10 cm10–20 cm0–10 cm10–20 cm
Exchangeable Ca2+ (cmol kg−1)5.922.581.530.88
Exchangeable Mg2+ (cmol kg−1)1.150.630.770.46
Exchangeable K+ (cmol kg−1)0.110.060.380.24
Cation Exchange Capacity (cmol kg−1)nd nd 10.559.37
Organic Carbon %1.300.581.871.51
C/N9.908.0315.9012.94
Bray Phosphorus (mg kg−1)2.110.9913.853.10
pH 1:1 (H2O)5.975.044.544.36
Total Nitrogen %
In 20120.130.070.120.12
In 20130.110.150.060.11
nd = Not determined.
Table 4. Combined analysis of variance for grain yield of 80 hybrids across eleven environments.
SourcedfSum of Squares% Contribution to Sum of SquaresMean SquarePr > F
Env102,447,399,52260.13244,739,952<0.0001
Rep (Env)11127,598,961 11,599,906<0.0001
Block (Env × Rep)220382,845,773 1,740,2080.0001
Genotype79277,051,8376.813,506,985<0.0001
Env × Genotype7901,345,460,72733.051,703,115<0.0001
Error649767,427,967 1,182,478
Corrected Total17596,096,183,487
CV26.15
R20.87
Env = Environment; Rep= Replication; CV = Coefficient of variation; Pr = probability.
Table 5. Mean grain yield (kg ha−1) of 20 hybrids and four checks across 11 environments in Mbalmayo and Nkolbisson in 2012 and 2013.
GenotypesE1E2E3E4E5E6E7E8E9E10E11Mean Across
LOOPLOOPLOOPLOOPLOOPOP
1368 × 87036479061182547825339564953203858763247441937344546
TZ-STR-133 × 87036438256651508826922255507360473971602512941664499
CLQRCWQ26 × Exp1 24425348171520632454046317277868162163557051104639
CLWN201 × 87036409347392799498752937657331865352545322347794540
CLYN246 × 87036397947821327780951577437317570173922588049405040
TL-11-A-1642-5 × Exp1 24394064275401731128074755298737733718482844494583
CML343 × 9071391147741234567238106142291060114257506256724486
CML395 × Exp1 24389643961024699937496599298951273595574263424572
CLQRCWQ26 × 87036355740882546571121447155364651884550508157834485
CLA 18 × Exp1 24342647452317762743705485235859062911578553764567
J16-1 × Exp1 24329047072531642443156054278257894664727037244694
CML451 × 87036328444781528656928795796491670042847479965694590
ATP S5 31 Y-2 × 87036319844071425671146365877255468123240460470384571
ATP S6-20-Y-1 × 87036307649512447616731714555471781842655497348294518
Cam inb gp1 17 × 8703630434332761695738096089392357034604562446634499
ATP S6 20 Y-2 × Exp1 24303633363651613836845448433763213074452775494621
Entrada 29 × Exp1 24298936671536407740925742308558464905598191144602
CLWN201 × Exp1 24288944911209646457077568321265324059570843804750
TL-11-A-1642-5 × 87036273433031448953149856231353188743230500686195198
ATP S6-20-Y-1 × Exp1 24255432202376736746416739469777192558328174584761
Checks
87036 × Exp1 2428873801623276532416826335060454232641027103909
87036 × 907121752511699625319033273237540113986596820673211
Exp1 24 × 907117913475984455928505635228179503778469251553912
88069 × Cam inb gp1 1778212801799404918042754278346001952442450322823
Means30664132166158823719541331305832320849934738
LO = Low N environment; OP = Optimum environment.
Table 6. Analysis of variance for additive main effects and multiplicative interaction model for grain yield of 24 hybrids across 11 environments.
SourcedfSum of SquaresMean SquaresContribution to Total Variation (%)F Probability
Genotypes2367,848,8902,949,9527.891443<0.001
Environments10514,356,61951,435,66259.82435<0.001
Interactions (G × E)230277,572,4901,206,83732.2842
IPCA 13280,827,5072,525,86029.22<0.001
IPCA 23058,189,2851,939,64320.96<0.001
Residuals168138,555,699824,736
df = degree of freedom; G × E = Genotypes × Environment; IPCA = Interaction Principal Component Axis.

