High-Throughput Phenotyping of Seed/Seedling Evaluation Using Digital Image Analysis
by
Chongyuan Zhang
1, 
Yongsheng Si
1,2,
Jacob Lamkey
3,
Rick A. Boydston
4,
Kimberly A. Garland-Campbell
5 and
Sindhuja Sankaran
1,* 1
Biological Systems Engineering, Washington State University, Pullman, WA 99164, USA
2
College of Information Science and Technology, Hebei Agricultural University, Baoding 071000, China
3
Crop and Soil Sciences, Washington State University, Pullman, WA 99164, USA
4
USDA-ARS Grain Legume Genetics Physiology Research Unit, Prosser, WA 99350, USA
5
USDA-ARS Wheat Health, Genetics, and Quality Research Unit, Pullman, WA 99164, USA
*
Author to whom correspondence should be addressed.
Agronomy 2018, 8(5), 63; https://doi.org/10.3390/agronomy8050063
Submission received: 19 April 2018
/
Revised: 19 April 2018
/
Accepted: 26 April 2018
/
Published: 3 May 2018
(This article belongs to the Special Issue Sensing and Automated Systems for Improved Crop Management)
Abstract
:Image-based evaluation of phenotypic traits has been applied for plant architecture, seed, canopy growth/vigor, and root characterization. However, such applications using computer vision have not been exploited for the purpose of assessing the coleoptile length and herbicide injury in seeds. In this study, high-throughput phenotyping using digital image analysis was applied to evaluate seed/seedling traits. Images of seeds or seedlings were acquired using a commercial digital camera and analyzed using custom-developed image processing algorithms. Results from two case studies demonstrated that it was possible to use image-based high-throughput phenotyping to assess seeds/seedlings. In the seedling evaluation study, using a color-based detection method, image-based and manual coleoptile length were positively and significantly correlated (p < 0.0001) with reasonable accuracy (r = 0.69–0.91). As well, while using a width-and-color-based detection method, the correlation coefficient was also significant (p < 0.0001, r = 0.89). The improvement of the germination protocol designed for imaging will increase the throughput and accuracy of coleoptile detection using image processing methods. In the herbicide study, using image-based features, differences between injured and uninjured seedlings can be detected. In the presence of the treatment differences, such a technique can be applied for non-biased symptom rating.
1. Introduction
Computer vision with conventional RGB cameras or cell phones is highly affordable and beneficial in evaluating several phenotypic traits in a quantitative and high-throughput manner. Some of the many applications that have been explored in literature towards phenotyping include: plant architecture [1,2], seed characterization [3,4], canopy growth/vigor [5,6,7,8,9,10,11], and root characterization [12,13,14]. Digital image analysis in a controlled environment offers high resolution, high throughput, and the precise evaluation of crop traits of interest comparable with human data collection [15]. With current technological advancements (camera resolution, processing speed, storage, availability of image processing tools, etc.), the application of image analysis is anticipated to grow for practical applications in evaluating crop traits in an accurate and high-throughput manner. In this study, two such applications for digital image-based trait assessment have been evaluated.
Coleoptile length, a sheath protecting the young leaves of monocots when they emerge from the soil, is an important agronomic feature that is related to emergence, seedling vigor, and stand establishment. Wheat varieties with long coleoptile length are desired for improved seedling emergence and stand establishment. Long coleoptile length is favorable in regions with winter rainfall and dry summers, such as Mediterranean countries, western and southwestern Australia, and the Pacific Northwest of the United States. In these regions, seeds are sowed deeply and late in the dry season into stored soil moisture [16]. For example, in Washington State, the emergence capacity of the seeds due to deep sowing (100 to 200 mm) is a trait of greater importance than disease resistance, yield potential, lodging resistance, and grain quality traits during wheat variety selection because if the plants do not emerge, the other traits become irrelevant [17,18].
If winter wheat varieties do not have adequate coleoptile length for deep sowing, they will exhibit a delayed seedling emergence, lower average emergence rate, and poor average stand establishment [17,19,20]. Rebetzke et al. [21] reported that deep sowing significantly (p < 0.01) reduced the coleoptile length and primary tillers per plant, which resulted in fewer, narrower, long leaves with lower leaf area, and plant biomass. The correlation between coleoptile length and emergence has been found to be significant. The percentage of variability for emergence attributed to coleoptile length alone ranged from 28% to about 62–71%, indicating that other factors affecting germination, such as the ability to imbibe under low water potential, also influence emergence [16,17]. Nevertheless, coleoptile length is a critical component of emergence.
Wheat varieties with long coleoptile are also preferred within semi-dwarf genotypes. The primary genes that have been deployed in wheat varieties for reduced height, Rht-B1b and Rht-D1b, are repressors of the gibberellin signaling pathway, reducing plant growth throughout the entire life cycle [22]. This leads to poor stand establishment when the seedbed conditions are adverse [23]. Semi-dwarf wheat cultivars have other agronomic advantages, however, and variation has been reported for coleoptile length even in the presence of the Rht-1 genes [16]. Therefore, many wheat breeding programs make manual measurements of breeding lines for coleoptile length, which is labor-intensive and time-consuming [24]. Given the number of breeding varieties/lines evaluated, a digital image based tool can be beneficial in high-throughput evaluation of coleoptile length. However, so far only photoelectric devices to detect the coleoptile length or imaging devices for measuring root and hypocotyls have been investigated [25,26]. To the best of our knowledge, no study on coleoptile measurement using digital imaging exists.
Similarly, herbicide applicability in crops is assessed based on complex interactions between crops and weeds, their environment, and the given herbicide [27]. Herbicide injury to crops may cause a reduction in crop vigor, stand, and even yield. Reports of herbicide injury are common and the assessment methods of the crop damage associated with herbicide are frequently reported [28,29]. Herbicide injury is typically assessed by visual inspection [30,31], which relies on human expertise and is time-consuming, labor-intensive and to some extent inconsistent and subjective [32]. Herbicide injury in crops can be detected using optical image sensors and automated image analysis [33,34]. Huang [35] used texture and color features for detecting and classifying seedling diseases in leaves of Phalaenopsis species (Moth orchid). Camargo and Smith [36] used color distribution for identifying visual symptoms of plant diseases.
In herbicide research, optical image sensors and automated image analysis has been used for the assessment of herbicide crop damage [33,34]. Rasmussen et al. [37] quantified crop symptoms to herbicide treatments by using a RGB camera to estimate excess green index (ExG). To test whether effects of herbicides on canopy variables could be detected by sensors, Streibig et al. [29] used two crops with different herbicide treatments. Changes in canopy colors or height and crop density were detected. However, the assessment of plant responses to the herbicide is still a challenge. There are two kinds of crop herbicide application: pre- and post-emergence applications of herbicide. While post-emergence applications cause crop injury, pre-emergence herbicides can cause crop seedling damage, and loss of stand particularly when cool temperatures coincide with rain soon after seedlings begin to emerge from the soil [28,38,39]. There is also a need to evaluate seed/seedling damage to herbicide to assess pre-emergence herbicide damage and to optimize the herbicide concentration to a specific crop. No report on the assessment of herbicide induced seed or seedling injury using digital image analysis was found.
The herbicide, Flumioxazin, is used in several major crops including soybean (Glycine max) and cotton (Gossypium hirsutum) to control many annual broadleaf weeds. In Colorado, Oregon, and Washington, flumioxazin has a 24c (special local needs label) for weed control in dry beans and is used primarily where nightshade species are a particular problem. Flumioxazin is a light-dependent peroxidizing herbicide (LDPH), a protoporphyrinogen oxidase (PPO) inhibitor, which acts by blocking heme and chlorophyll biosynthesis resulting in the accumulation of photo-toxic porphyrins. Few pre-emergence broadleaf herbicides are labeled for use in dry beans (Phaseolus vulgaris L.) and interest in determining dry bean tolerance to flumioxazin led to field testing at various locations [40,41,42,43]. Flumioxazin was eventually labeled for use in dry beans, but at lower rates (54 g ha−1) than used in soybeans due to a greater potential for flumioxazin to injure dry beans. Susceptible plants in flumioxazin treated soils exhibit necrotic symptoms and die shortly after exposure to light. Determining the tolerance of different market classes and cultivars of dry beans to flumioxazin could lead to improved safety and utility of flumioxazin in dry beans [42,44]. Rapid and inexpensive screening methods to determine cultivar tolerance to pre-emergence herbicides, such as flumioxazin, could enhance efforts to refine herbicide labels to minimize potential crop injury.
Thus, the overall objective of this study was to develop algorithms for digital image analysis to evaluate seed/seedling traits in an accurate and quantifiable manner. This was achieved using two case studies on, (1) digital image based phenotyping of wheat coleoptiles; and (2) herbicide injury assessment in bean.
2. Materials and Methods
2.1. Experimental Set-Up
2.1.1. Case Study I: Wheat Seed Germination
There were two experiments in this study. In the first experiment, sixteen cultivars of wheat were used, including ‘Otto’, ‘Moro’, ‘Bruehl’, ‘Madsen’, ‘SY Ovation’, ‘Brundage 96′, ‘Pritchett’, ‘Stephens’, ‘Eltan’, ‘Jagger’, ‘Louise’, ‘Seahawk’, ‘Bobtail’, ‘ARS-Crescent’, ‘Selbu’ and ‘Cara’. Bruehl, Pritchett, ARS-Crescent, and Cara are club wheat, while the rest are common wheat cultivars. All cultivars except Moro were semi-dwarf due to the presence of either Rht-B1b or Rht-D1b. Wheat seeds were nursed on germination paper (No. 76 germination paper, Anchor Paper Co., St. Paul, MN, USA) and were marked with the variety name and the seed density treatment, at 10 or 15 seeds per paper. The seeds were placed in a line at 2.5 cm above the middle of the paper, which was made wet with tap water, with the germ end of seeds facing down, and about 1 cm distance between seeds for both 10 and 15 seeds per paper. Two seed density were used to determine the effect of density for automated image processing and select a suitable seed density in later studies. With seeds in position, the germination paper was folded up, rolled loosely, and secured with a No. 14 rubber band. The rolled germination papers were put upright in a 1 L plastic container lined with wet germination paper, the top of which was also covered with wet germination paper. The samples were first put in a dark incubator at 4 °C for 4 days and then moved to another dark incubator at 15 °C for 16 days [24]. Water was added to the container as needed to keep the germination paper rolls wet without flooding in the container.
In the second experiment, the seed germination procedure was similar, except for the density of seeds per paper. On each paper, eight seeds instead of 10 or 15 seeds were used, separated with a 3 cm distance, to increase the efficiency of image processing algorithm according to experience from the first experiment. Moreover, 14 of the 16 wheat cultivars, except for Stephens and Eltan, were used in the second experiment, with two replicates (8 seeds/towel × two replicates).
2.1.2. Case Study II: Bean Germination
Six cultivars of great northern dry beans (‘GN10-7’, ‘GN10-9’, ‘Matterhorn’, ‘Aires’, ‘Coyne’ and ‘Powderhorn’) were evaluated. The seeds were imbibed for 96 h at 25 °C in the dark in germination paper moistened with reverse osmosis (RO) water containing 1% (v/v) sodium hypochlorite. Flumioxazin bioassays were conducted in 11 × 11 cm clear plastic covered trays lined with 6 mm thick germination paper. Trays received 60 mL of aqueous solutions of 0, 50, 100 or 200 ppm flumioxazin. Eight bean seedlings, with radicles averaging 22 mm long, were placed on each tray. The initial radicle length of each seedling was recorded. Each cultivar was tested in a separate tray. Trays were then placed in incubators with constant light at 25 °C for 48 h. Each treatment was replicated four times in a completely randomized design.
Injury to bean seedlings was visually rated on a scale of 0 (no injury, white or green) to 100 (entirely brown, necrotic, or totally dead). Final radicle length was measured and the change in radicle length was determined by subtracting the initial radicle length (prior to flumioxazin exposure) from the final radicle length.
2.2. Imaging Protocol and Data Collection
2.2.1. Case Study I: Wheat Seedling Image Collection
A stable image acquisition environment is required for automated image processing, even in a controlled environment. For the coleoptile evaluation study (case study I), a phenotyping box was constructed. It consisted of a cardboard box covered with white paper internally, two tube fluorescent lights, a black foam board, and one RGB camera (SX530, Canon U.S.A. Inc., Huntington, NY, USA). The fluorescent lights were 58 cm in length, with a color temperature of 4200 K (white light) and light output of 700 lumens. Fluorescent lights were fixed on the internal top of the box and placed parallel. The cardboard box was laid on its side, and the top closure panels of the cardboard box served as ‘opening’. The black foam board served as background and a removable tray to hold the samples, and a strip of blue paper was attached to one end of the foam board and used as the baseline of seedlings in image processing. A USA quarter coin (22.26 mm in diameter) was fixed on the strip of blue paper and used as a reference measure to convert pixel data to millimeter length. The phenotyping box was fixed to a bench using T-slotted aluminum to prevent the box from moving. A visible or RGB camera with 4.3 to 215.0 mm focal length and 16.0 megapixels was used to acquire coleoptile images. The camera was placed over the phenotyping box by fixing to the T-slotted aluminum frame. Only the lens of the RGB camera went through the top of the phenotyping box through a hole, which was just big enough for the lens so that the influence of the other source of light could be minimized. The closure panels were closed during the imaging to prevent external light entering the box.
In the second experiment, two papers of seedlings were placed on the foam board and imaged at the same time, instead of one paper of seedlings as in the first experiment. In addition, a remote trigger (powered with 5 V battery) and Wi-Fi SD card with real-time monitoring of the images on a laptop was utilized in the second experiment. Twenty days after seeding, the coleoptile lengths were measured using both the high-throughput imaging device described above and using manual measurements with a ruler scale. The samples were first unfolded and put onto the foam board with the strip of blue paper covering everything below the seeds. One image for one or two papers of samples was acquired and after image acquisition, coleoptile length was measured manually to the nearest millimeter in sequence with one person measuring and another recording.
2.2.2. Case Study II: Bean Seed Image Collection
Eight seedlings were placed on red felt for easy image segmentation. A RGB camera (SX40 HS, Canon U.S.A. Inc., Huntington, NY, USA) with a 4.3 to 150.5 mm 35× optical zoom lens giving images of 2992 × 2992 pixels was used to take 24-bit RGB images of the seeds. Images were taken in the JPG image format. In order to keep image exposure consistent, all images were captured at manual mode with a 9 mm focus lens, aperture of F3.5, shutter speed of 1/25 s, and ISO 400 without flash.
2.3. Image Analysis
2.3.1. Case Study I: Color-Based Method
In both case studies, images were processed in MATLAB (R2016b, MathWorks, Natick, MA, USA) using a custom image processing algorithm. The images were processed in batch using the developed algorithm without any human intervention. Each image was read in MATLAB and converted from a 8-bit image (0–255) to a double precision image (0.0–1.0). The region of interest from each image was extracted in order to reduce the complexity of image processing, especially in terms of noise reduction, and make image processing faster. A mask for target objects (within the region of interest) was created according to the empirical thresholds as described below. During determination of thresholds (for seedlings), a few images were inspected in MATLAB to find out the range of pixel values in R, G, and B channels for differentiation between background and seedlings. Following the selection of the threshold, the image masks were inspected for verification and to accept/adjust the image thresholds. The modification of background and lighting will result in a change of threshold values that the user must define.
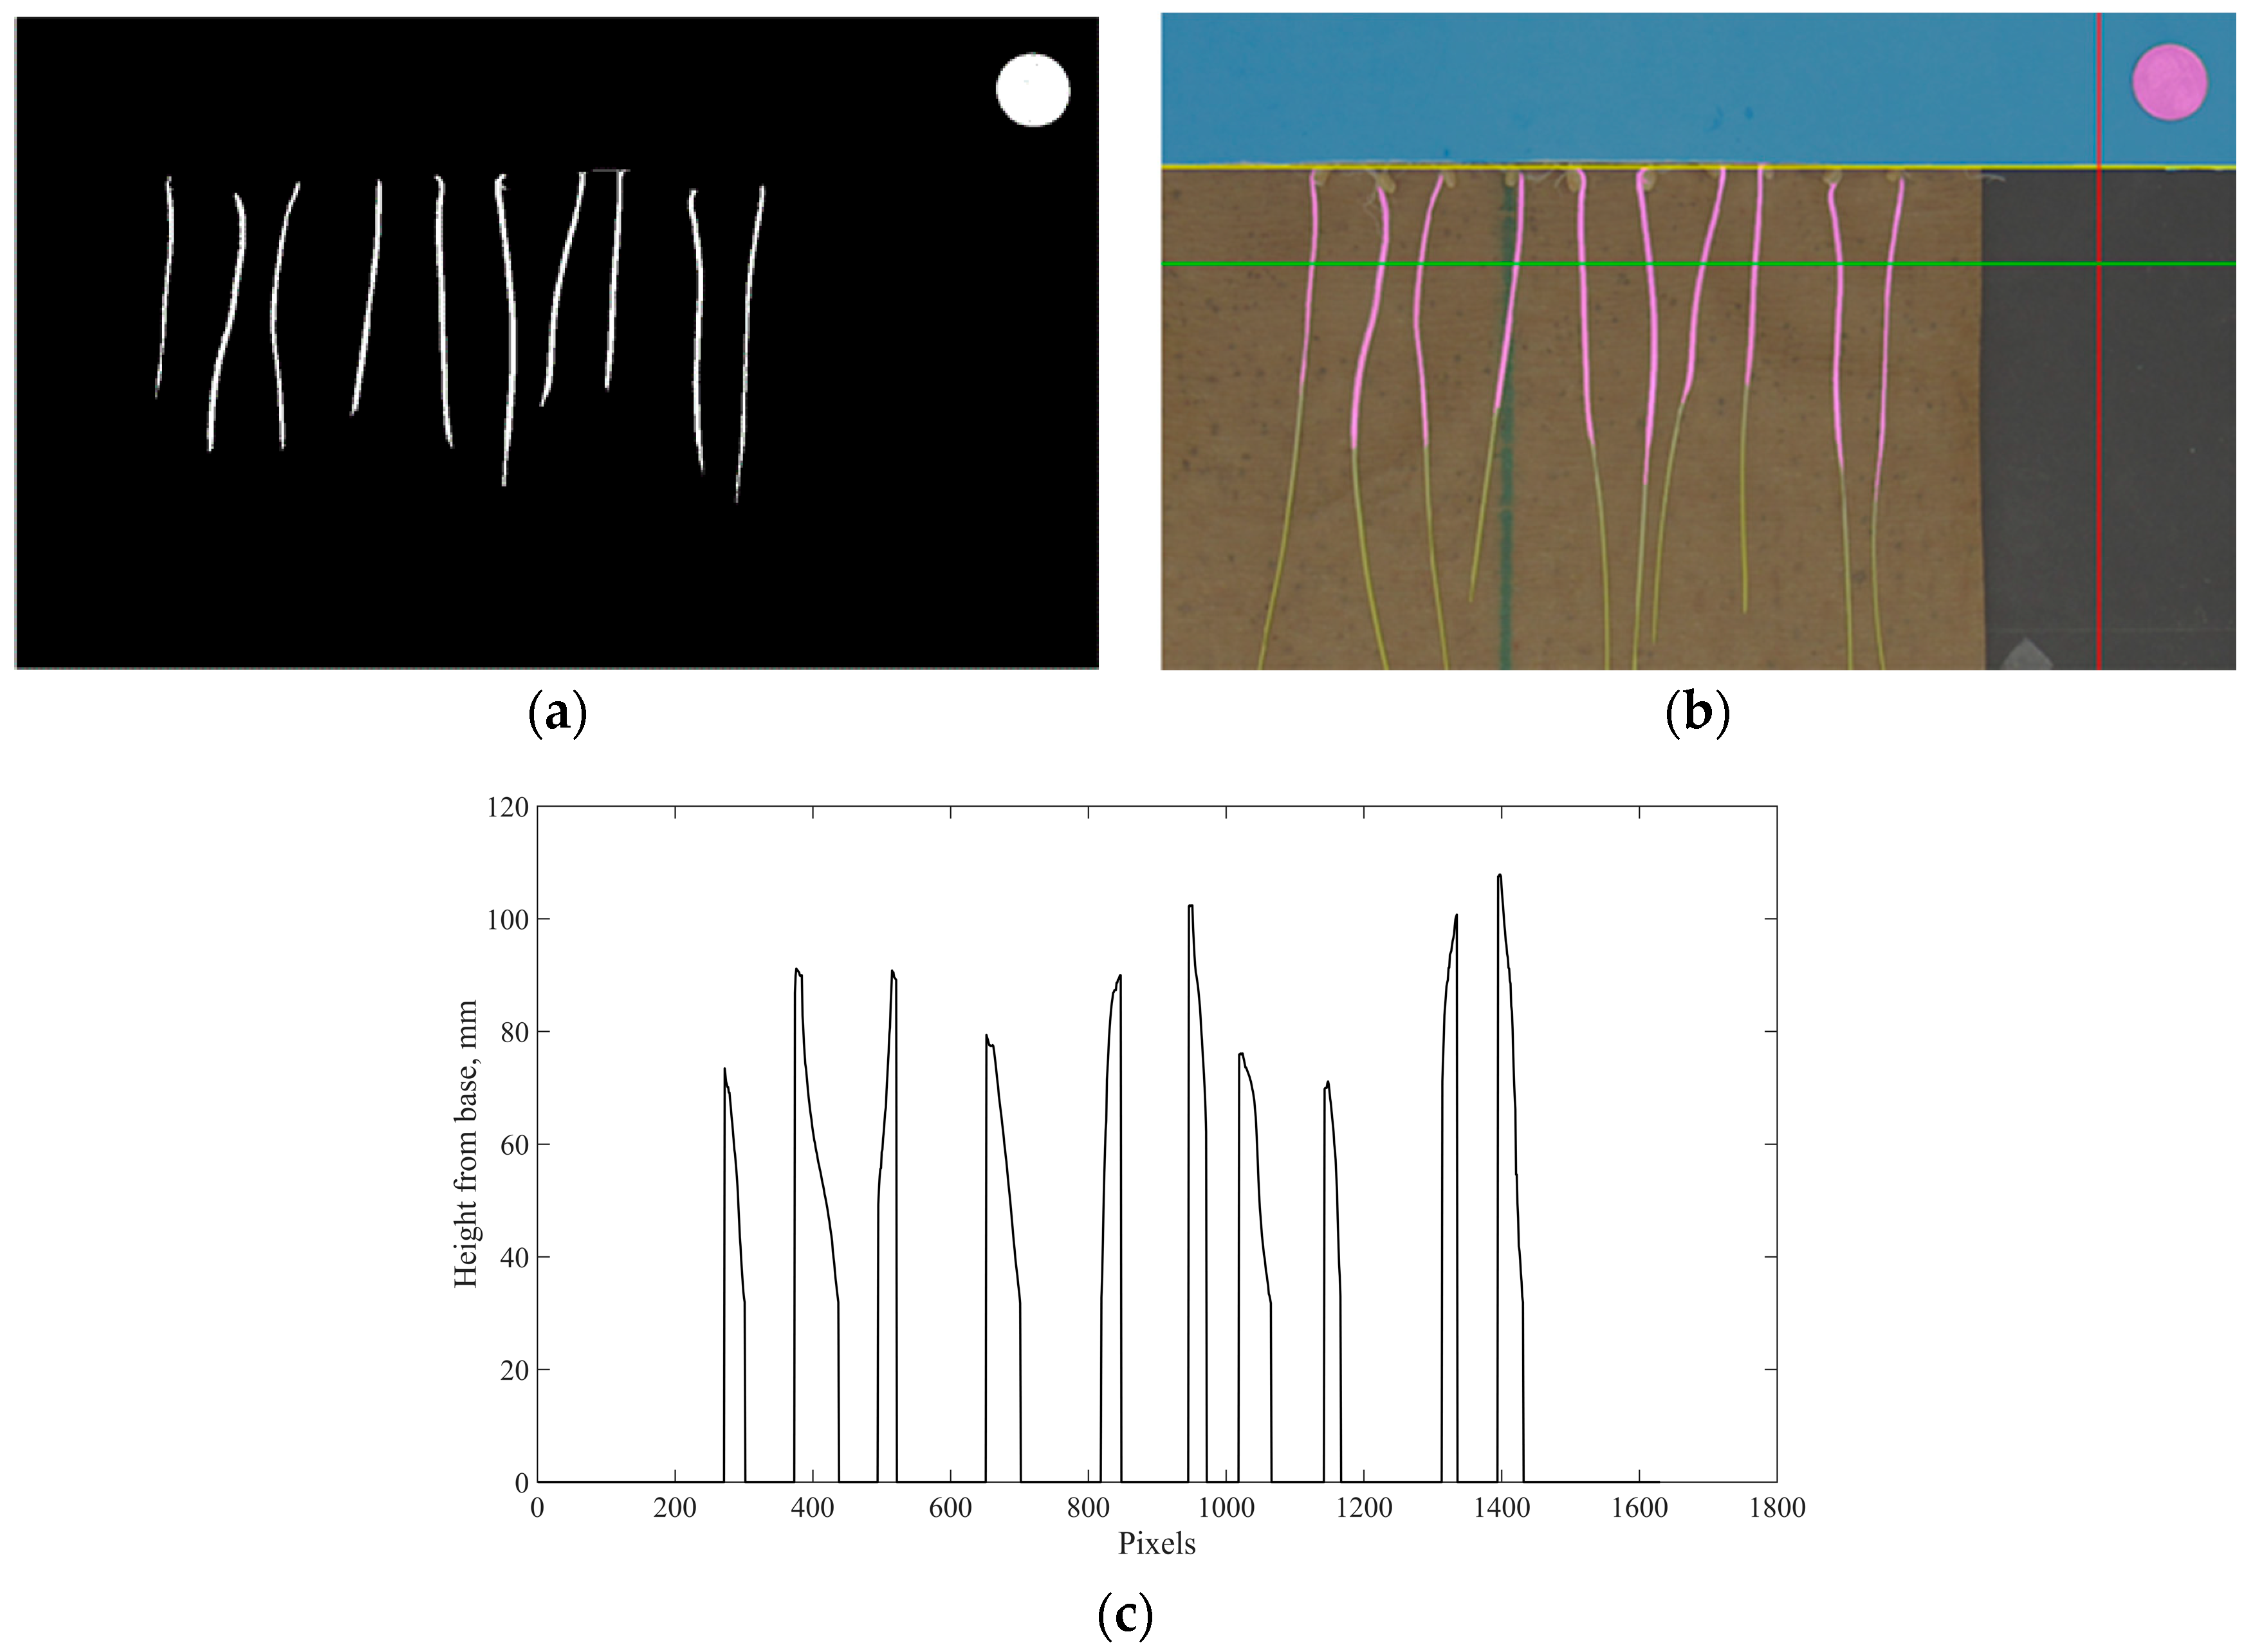
where R(i,j), G(i,j) and B(i,j) represent the pixel value of red, green, and blue channel at a coordinate of i and j, and abs(R(i,j) − G(i,j)) and abs(G(i,j) − B(i,j)) represents the absolute difference between the pixel value of the red and green channel, and the green and blue channels, respectively. A morphological operation was applied to the mask to improve the quality of the mask, as shown in (a) of Figure 1. A mask for the reference coin was created separately to obtain high-precision diameter of the coin using specific threshold and fasten the processing time. An area that covered slightly larger than the area of the coin was read and a mask only targeting the reference coin was created according to the empirical thresholds as described below.
| I(i,j) = Target | IF R(i,j) > 0.60 and B(i,j) > 0.50 and abs(R(i,j) − G(i,j)) ≤ 0.06 and abs(G(i,j) − B(i,j)) ≤ 0.25 and B(i,j) < R(i,j) |
| I(i,j) = Background | OTHERWISE |
| I(i,j) = Coin | IF B(i,j) < 0.98 and abs(R(i,j) − G(i,j)) ≤ 0.08 |
| I(i,j) = Background | OTHERWISE |
Morphological operations were also applied to the mask. The diameter of the reference coin was measured in terms of pixels and then used to calculate the conversion factor (24.14 mm/diameter in pixels), which was used to convert the coleoptile lengths in images into millimeter. The masks for target objects and coin were combined and overlapped with the original image to check the quality of the masks during the inspection of results, shown in Figure 1b. A combined mask was highlighted in magenta to facilitate inspection.
After creating the masks, the baseline of the stem for seedlings was detected automatically using the blue paper as a reference. An intensity profile of a line in the blue channel, which is highlighted by vertical/red line in Figure 1b, was examined to locate the first pixel where the intensity of blue channel is below 0.40. The horizontal line crossing the detected pixel (B(i,j) < 0.40) was considered as the baseline of the stem, which is highlighted by the first/yellow horizontal line from the top. Then a height profile relative to the baseline was developed by scanning a specific area in the mask, which is the corresponding area between the second/green horizontal line and the bottom line of (b) in Figure 1. Scanning from the second/green horizontal line, instead of the first/yellow horizontal line, avoids noise from the root fibers near the baseline. An example of the height profile is shown in (c) of Figure 1. The algorithm then scanned the height profile to detect local peaks, which are considered as the lengths of the coleoptile. After image processing, coleoptile length was extracted by the algorithm and exported as an Excel file for statistical analysis.
Image processing procedures for images from the second experiment were similar to those from the first experiment with a few changes. A white reference panel (Labsphere, Inc., North Sutton, NH, USA) was put on the black foam board for calibrating the images, and each channel of acquired images was calibrated by dividing the average value of reflectance for a respective channel within a region of interest of a reference panel. In addition, the threshold of creating the mask for a coin was different due to the different background (black background in the second experiment).
| I(i,j) = Coin | IF R(i,j) > 0.40 and G(i,j) > 0.40 and B(i,j) > 0.40 |
| I(i,j) = Background | OTHERWISE |
Moreover, each time an image from the second experiment was processed, two germination papers of samples were analyzed, compared with one germination paper of samples for images from the first experiment.
2.3.2. Case Study I: Width-and-Color-Based Method
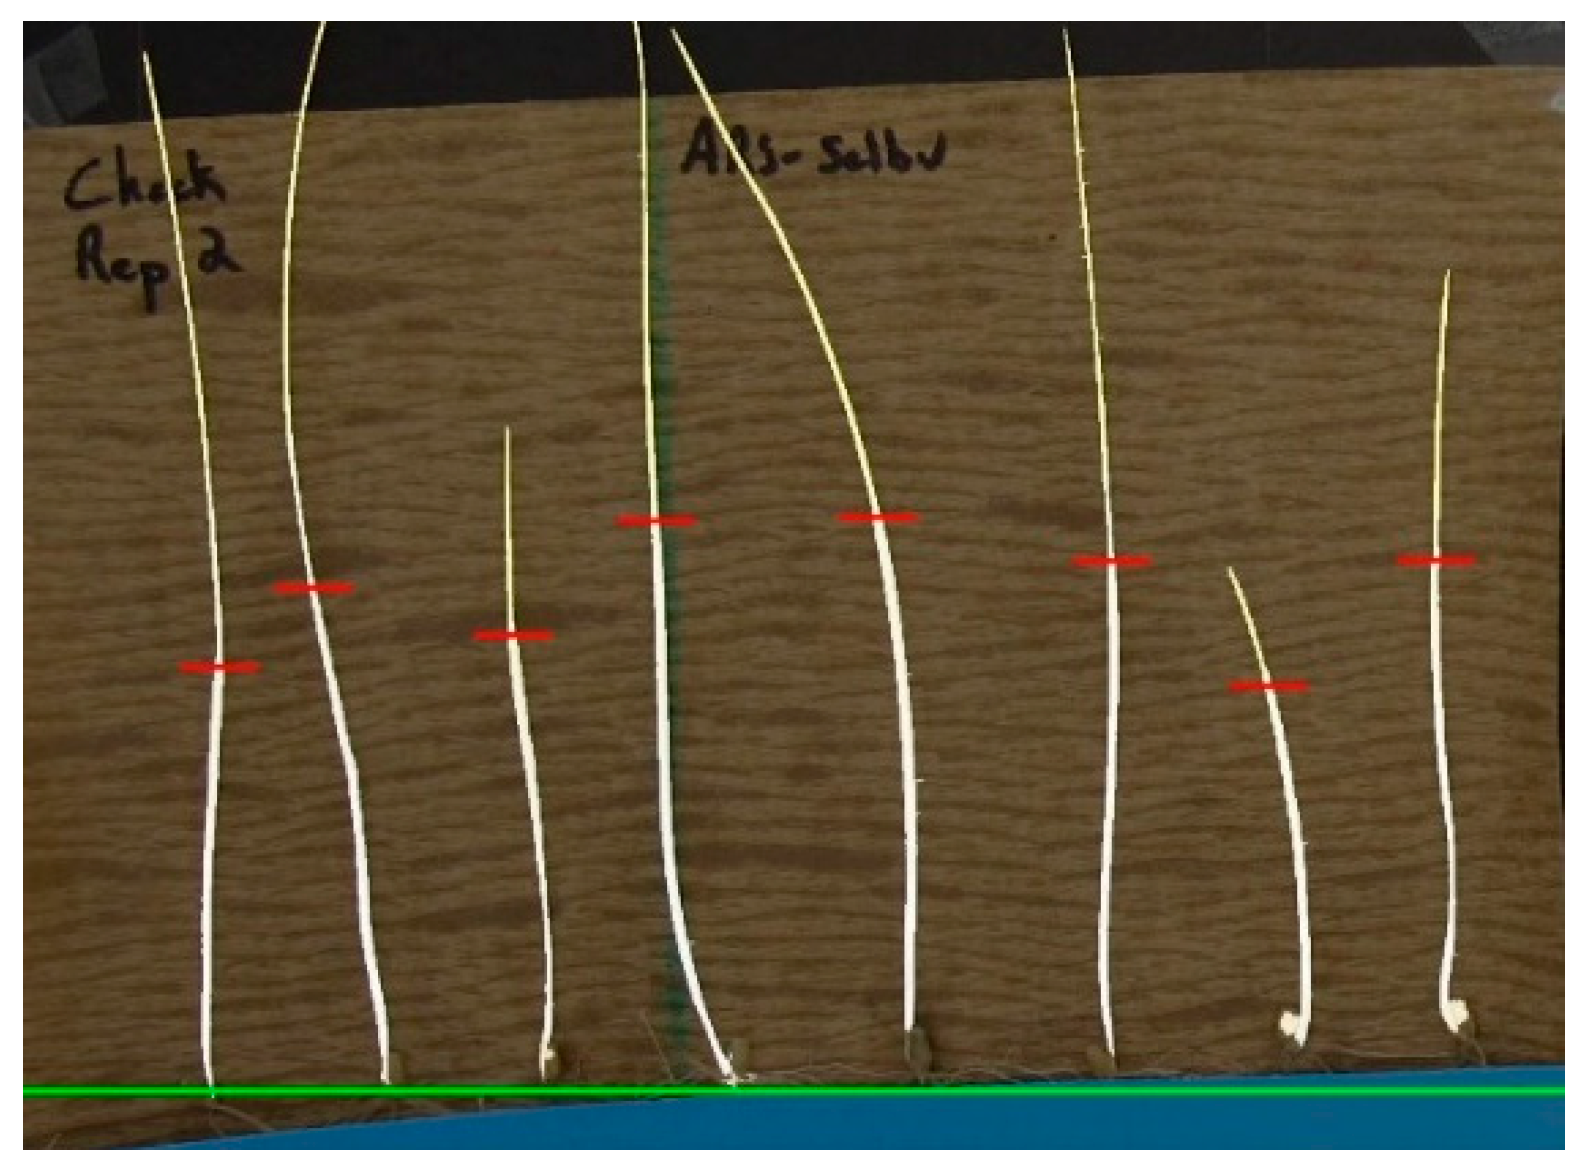
The detection of coleoptile length based on a method using width and color of coleoptile was tested on images acquired from the second experiment. Except for the method of detection of coleoptile length, general steps of image processing were similar to those described above, such as the calibration of images and detection of the reference coin. The seedlings, instead of only coleoptiles, were separated from the background using the empirical thresholds described below
| I(i,j) = Target | R(i,j) > 0.75 and G(i,j) > 0.75 and B(i,j) > 0.30 and B(i,j) < G(i,j) and L(i,j) > 80 |
| I(i,j) = Background | OTHERWISE |
L(i,j) represents the lightness value at the coordinate of i and j of an image, which is derived from Lab color space (images were converted from RGB to Lab color space). Within the region of interest, a mask for an individual seedling was identified and separated from masks for the rest of seedlings. The algorithm detected the width of the whole seedling (starting from the tip of the first leaf), creating a width profile for that seedling, and then scanned throughout the width profile to look for a point where the width of coleoptile increased. The width was considered as increasing if the average width of a continuous section (9 pixels long in our case) of coleoptile after the point was greater than the average width before that point plus 0.60 (an empirical threshold). Both the width and color of coleoptile of such a point was examined. The point was considered as the beginning of a coleoptile, if the width of the coleoptile at that point was greater than 8 pixels and greater than or equal to 4 pixels of the cross section at the point were white, which is the color for the coleoptile. If no such a point was found from a seedling, the seedling was examined again with the width threshold of 7 pixels. An example image with all the coleoptile automatically detected and highlighted is shown in Figure 2. Then, coleoptile length was calculated by subtracting the starting point of coleoptile and the baseline.
Data derived from imaging and manual measurement were analyzed using both individual data points and (trimmed) average values per germination paper. The trimmed average values were calculated by first removing the lowest and highest 10% (total 20%) of data points per germination paper, similar to the phenotyping protocol using manual measurements.
2.3.3. Case Study II: Herbicide Injury Evaluation
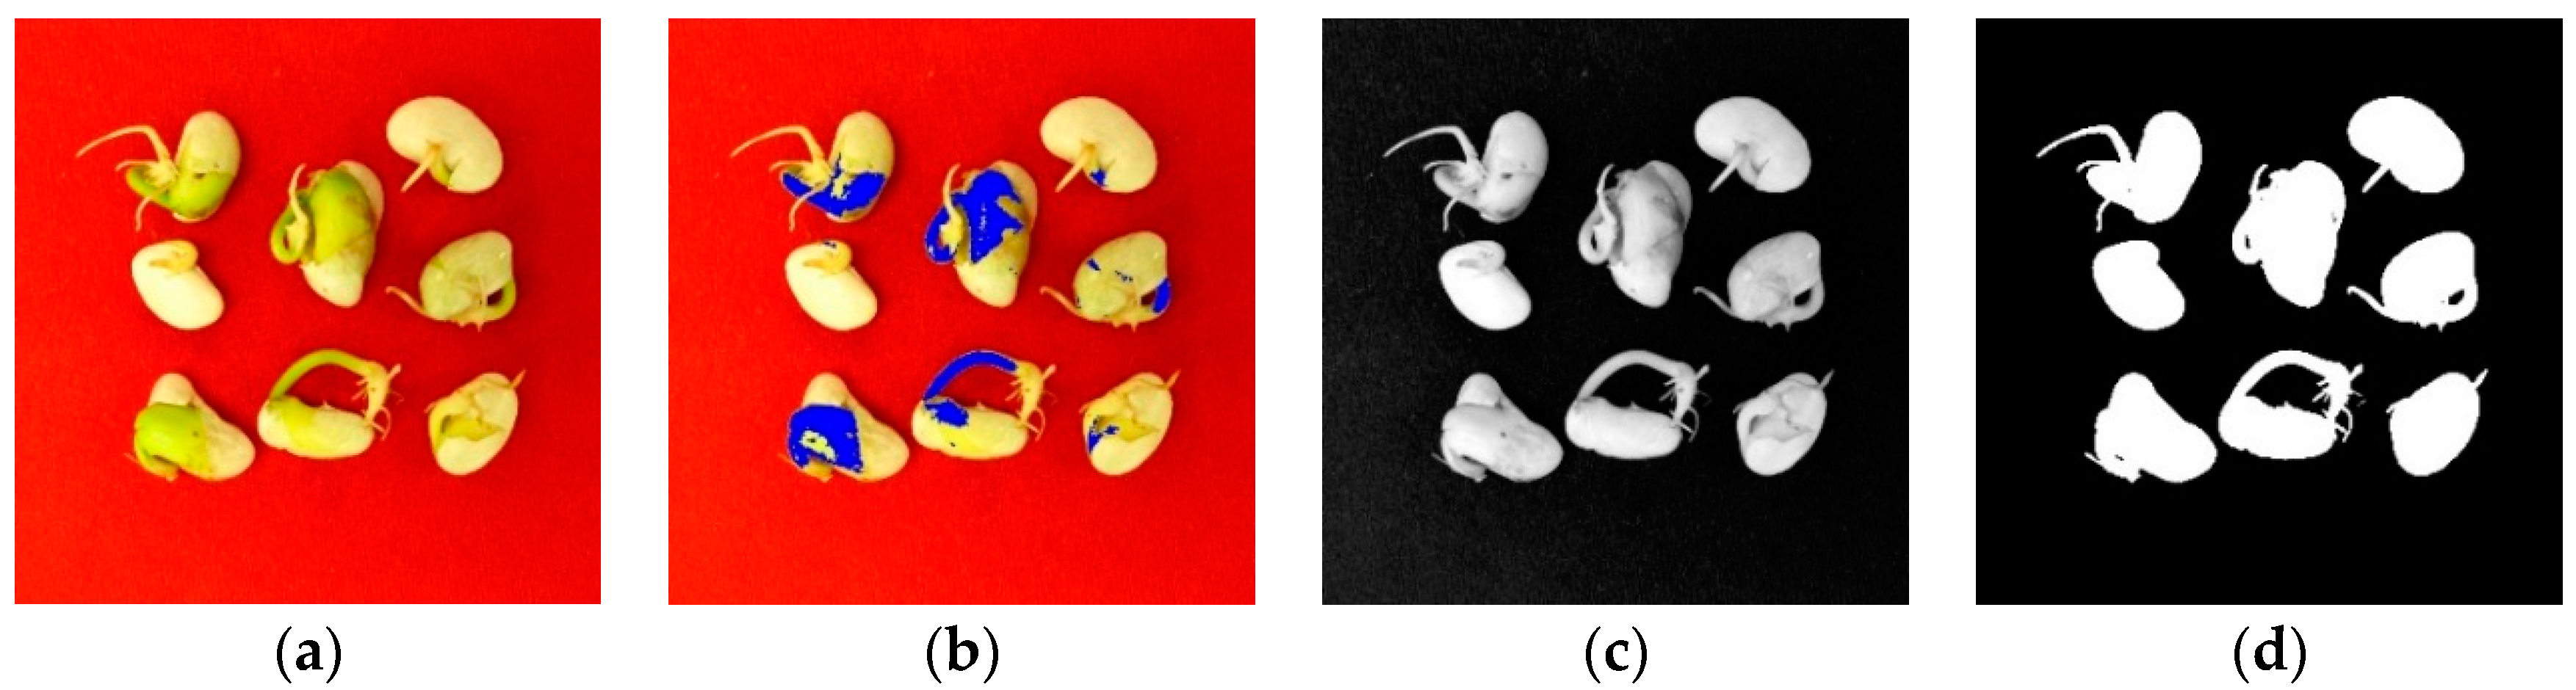
The key step to detect the herbicide injury in an image is to extract relevant features, for example color or textural features from the injured region. Injured and uninjured parts of the seeds can be easily discriminated by the human eye for their different colors. It may therefore be possible to identify injured and uninjured pixels by color features. To extract the color features, line profiles of the seed image in RGB color space were plotted and analyzed. A yellow line went through the seeds and background in Figure 3.
A careful examination of Figure 3 revealed some common features on uninjured parts: G values were much greater than B values, B values were small, and R values were close to and slightly greater than G values between A and B, while R values were less than G values between C and D. After analyzing the data of the line profiles, the empirical thresholds were developed to identify uninjured pixels.
where: R(i,j), G(i,j) and B(i,j) are the red, green and blue intensities (0–255), respectively, for each pixel coordinate (i,j). Using this method, all the pixels in the image were scanned and the uninjured parts of the seeds were identified (blue area in (b) of Figure 4). The number of uninjured pixels was extracted as green area. Following this, all the seeds in the image were identified using the grey scale of G channel, as shown in (c) of Figure 4. The common approach to compute a global threshold to create a binary image to separate objects and background is Otsu’s method (Otsu, 1975), which chooses the threshold by searching the maximum variance between the object and background pixels. In our case, however, Otsu’s method tended to consider the seriously injured pixels into the background. An empirical threshold of 50 in the G channel was used for segmentation. The binary image after segmentation is shown in (d) of Figure 4. The number of white pixels in the binary image was considered as seed area. The greenness ratio was defined as green area to seed area.
| I(i,j) = Uninjured | G(i,j) − B(i,j) > 100 and B(i,j) < 60 and ((R(i,j) ≤ G(i,j)) or (R(i,j) − G(i,j)) < 15) |
| I(i,j) = Injured | OTHERWISE |
In addition, the brownness ratio (injured part) was also computed. The color image was converted into Lab color space, where L refer to lightness, and a and b refer to green-red and blue-yellow color spaces. Pixels in a (green-red) with value of less than 30 were considered as seeds and separated from the background. On the other hand, the number of brown pixels were computed in RGB color space using the following threshold.
| I(i,j) = Uninjured | 0.60 > (R(i,j) − G(i,j))/(R(i,j) + B(i,j)) ≥ 0.12 |
| I(i,j) = Injured | OTHERWISE |
The brownness ratio was defined similar to the greenness ratio, by dividing the brown area to seed area. In addition, the greenness to brownness ratio was created by dividing the greenness ratio and brownness ratio.
2.4. Statistical Analysis
Pearson’s correlations and ANOVA were performed in SAS 9.2 (SAS Inc., Cary, NC, USA). Pearson’s correlation coefficient (r) and probability (p) values are reported.
3. Results and Discussion
3.1. Case Study I: Coleoptile Evaluation
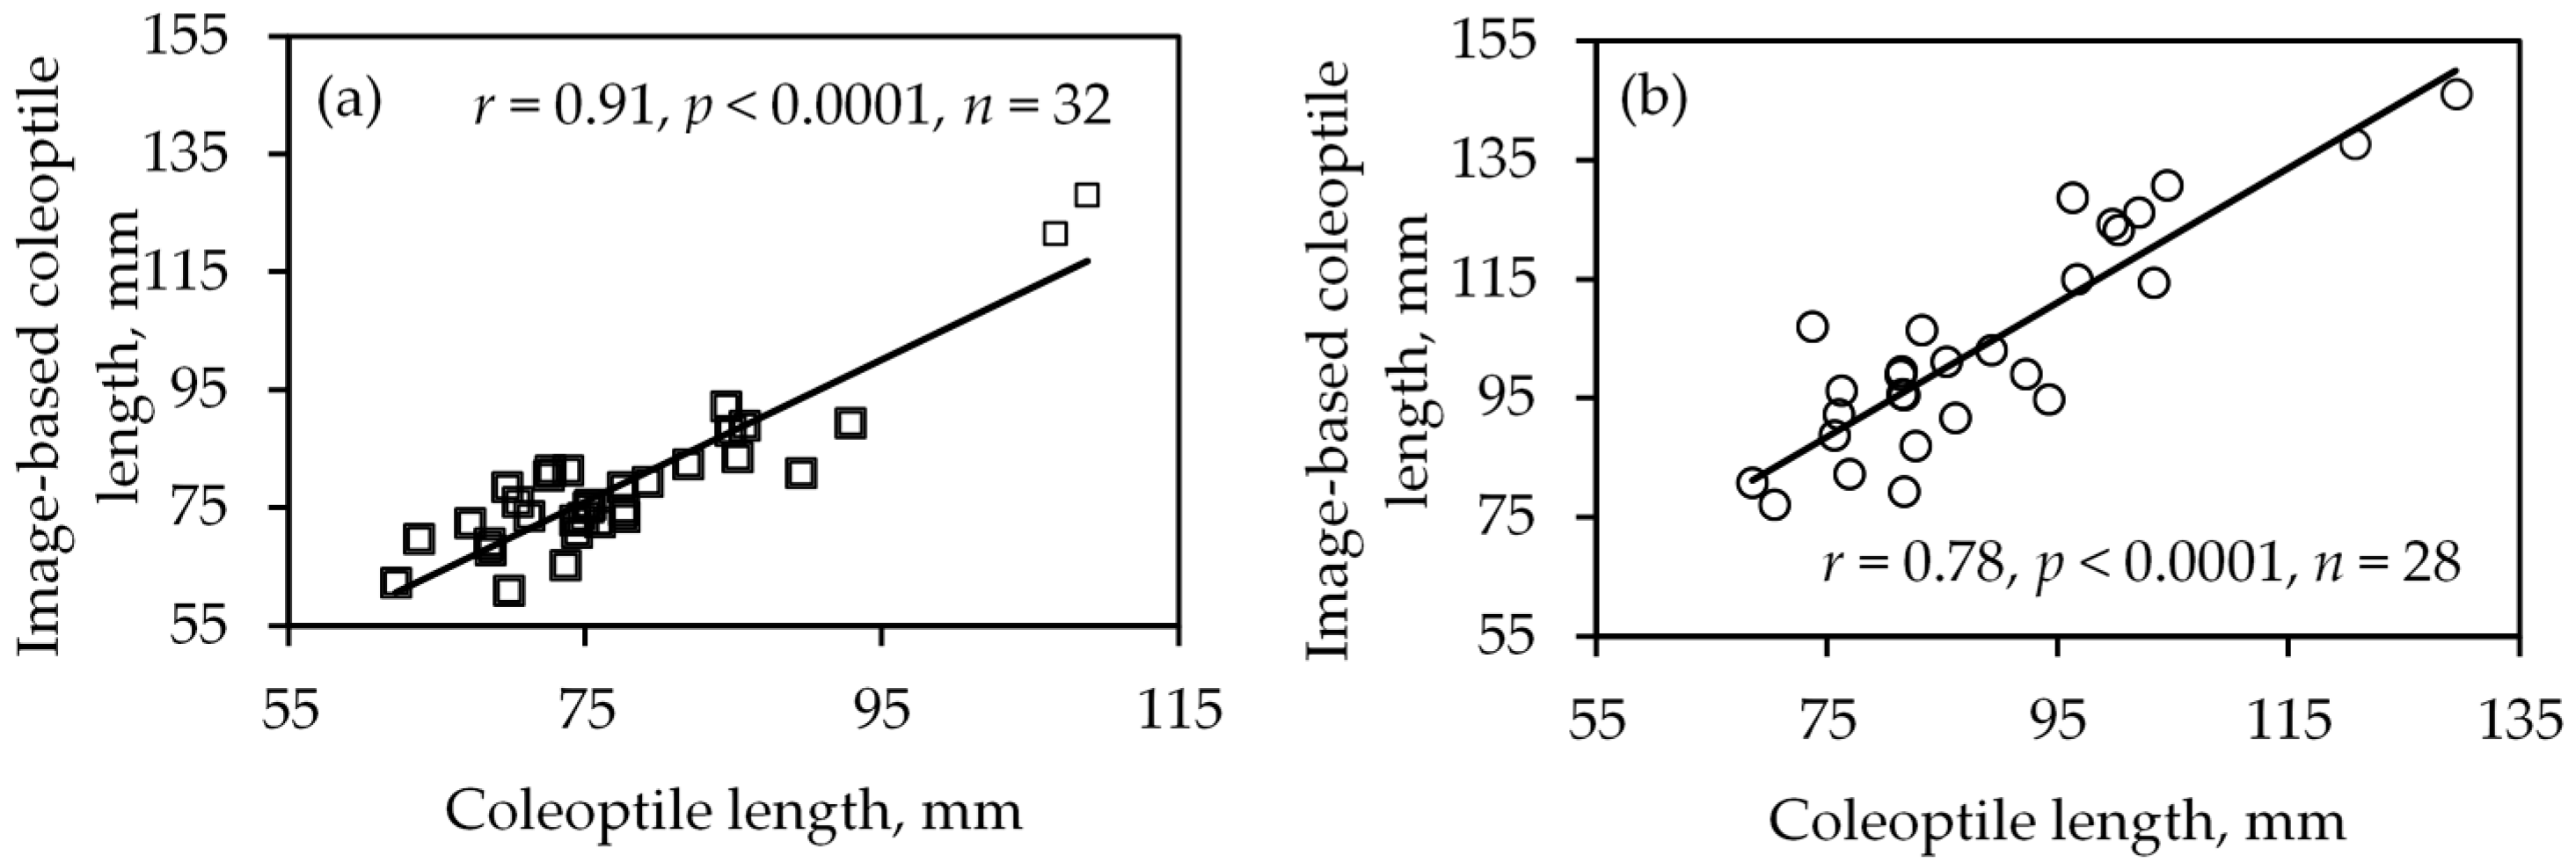
The coleoptile length computed using the image processing algorithm was positively correlated (p < 0.0001) with the associated manual measurements in both experiments. One-on-one comparison of coleoptile length comparison resulted in r of 0.69 and 0.77 in the first and second experiment, respectively. Comparing the average coleoptile length data of individual varieties, r was 0.91 and 0.89 in the first and second experiment (Figure 5), respectively. One of the key features of variety Moro, is the long coleoptile length. The image-based and manual measurements showed longer coleoptile length in Moro as expected. As its coleoptile length could lead to bias in the data, correlation analysis was performed excluding Moro. The correlation coefficient remained significant, adding confidence to such data (r = 0.78 in first experiment and r = 0.83 in second experiment, p < 0.0001). In summary, both experiments demonstrated that coleoptile length can be detected using sensing and image processing with desirable accuracy of detection.
Further analysis of coleoptile length data in the first experiment revealed that the differences between detected and manually measured coleoptile length followed a normal distribution. One of the key challenges in coleoptile length detection was a similarity in the color between coleoptile and first leaf. This could be addressed by evaluating other features, such as width, for a clear demarcation under the conditions as described below.
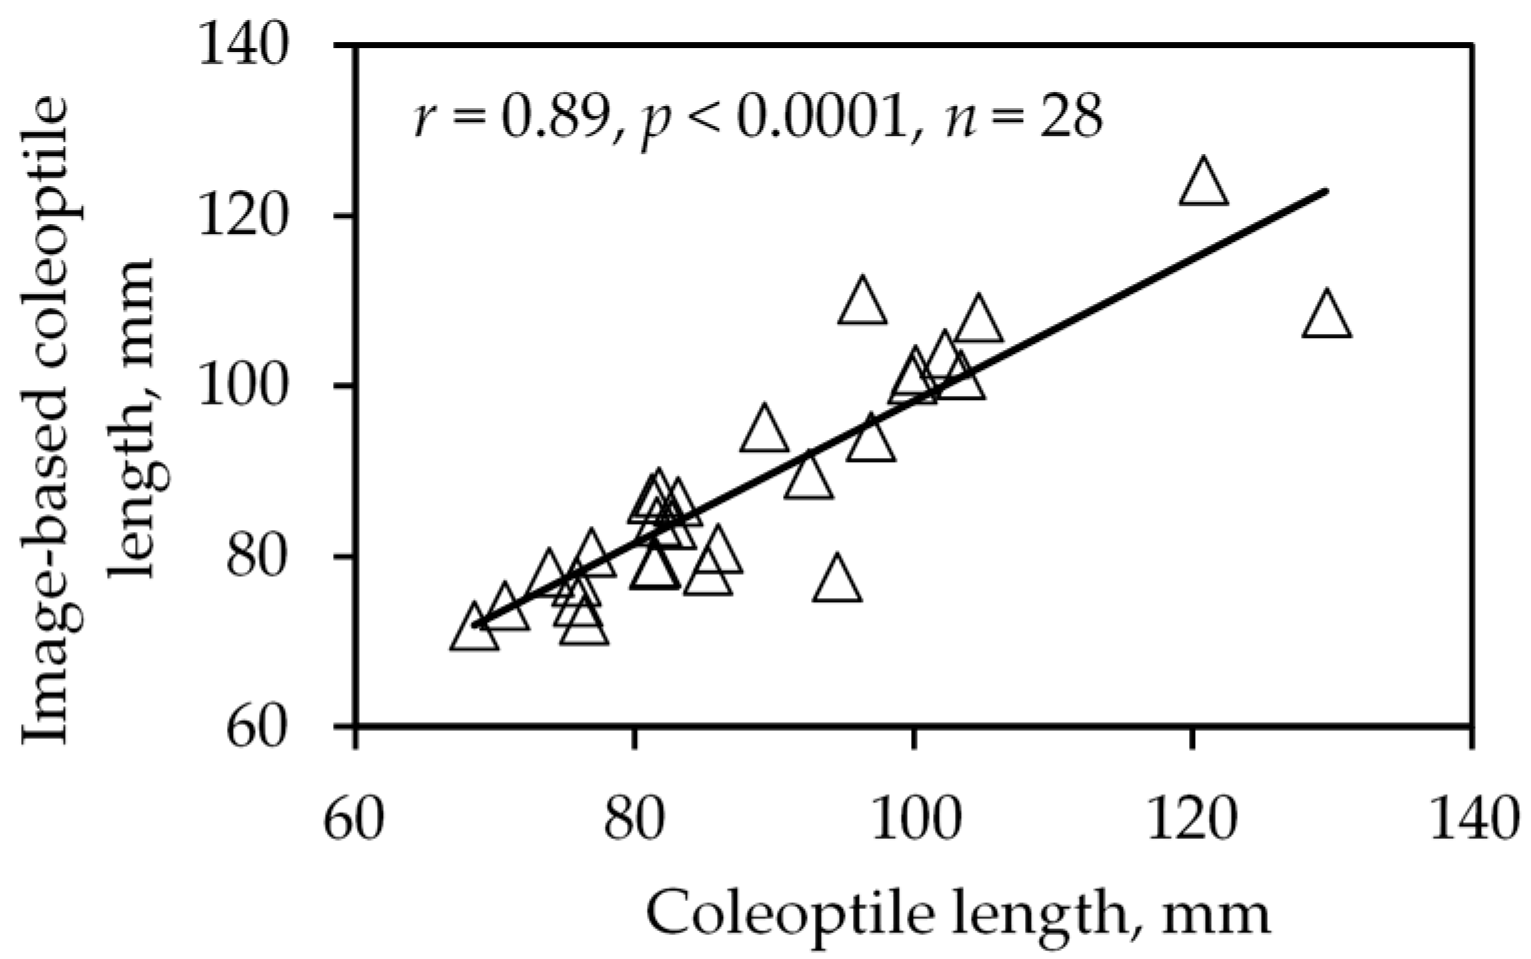
The coleoptile length detection method using width and color was developed and applied to the second experiment. The coleoptile length detected by width-and-color-based method was significantly (p < 0.0001) correlated with manual measurement using either the average (shown in Figure 6) or one-on-one data. The correlation coefficient for average comparison and one-on-one data comparisons were 0.89 and 0.79, respectively, and for average comparison, even with the data of Moro removed, the r was 0.88. Compared with the color-based method, the width-and-color-based method may be superior, because the demarcation between coleoptile and the first leaf is always featured by the change of width, but only sometimes by the color. To further exploit the change in width feature and increase the accuracy, a specific phenotyping protocol should be developed.
One of the benefits of image-based evaluation can be the throughput. The current method of sample preparation is designed for manual measurement, which is destructive and allows only one measurement at the end of the experiment. The sample preparation takes about 1.5 min, while image processing takes an average of 3 s (Hewlett-Packard, Pavilion 15, Intel(R) Core(TM) i7-5500U CPU @ 2.4 GHz, with 12 RAM). An improved sample preparation method (e.g., as reported in Miller et al. [5]; and other improvements such as the use of colored germination paper, the vertical piling of papers, etc.) should greatly enhance the throughput of image-based measurement. Image-based evaluation along with vertically piling the samples during germination avoids the destruction of samples during preparation and measurement, therefore allowing multiple measurements during the experiment period, which enables the monitoring of the growth rate that can be valuable data to the breeders. Another benefit of image-based techniques is the possibility of extracting multiple features that may be of value to scientists in emergence evaluation or variety development. The imaging tool can also measure traits associated with early vigor such as the color of the coleoptile, width of the coleoptile, the length and width of the first, and leaf and germination rate [45], in addition to coleoptile length. Currently, the color of coleoptile is visually assessed [46], while the width of coleoptile is measured manually [47]. The color and width of coleoptile and the germination rate can be extracted along with the length of coleoptile by modifying the image processing algorithms as reported in this work. Khoenkaw [48] demonstrated that by using digital image analysis, it was possible to detect the number of seeds and estimate the germination rate of rice seeds in each image with an accuracy of 96.4% and 98.4%, respectively. By extracting multiple features, the throughput image-based measurement of the seedling and coleoptile will be enhanced.
3.2. Case Study II: Herbicide Injury Evaluation
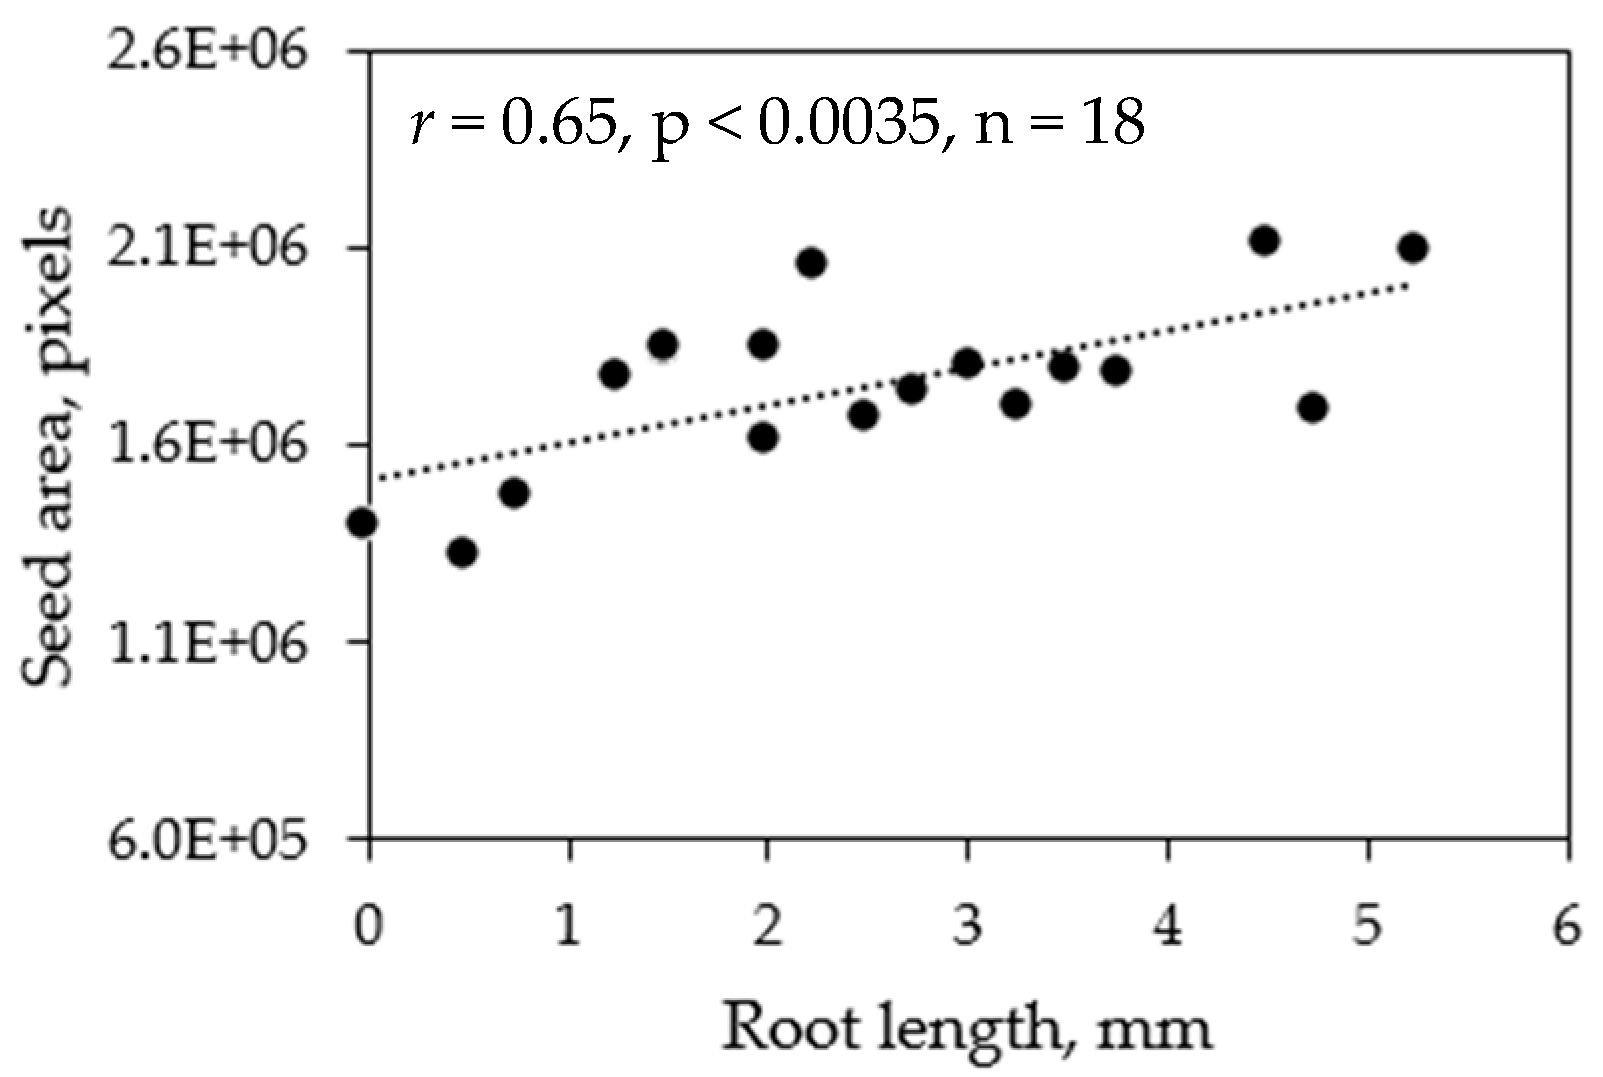
The ground-truth data comprised of changes in root length and visual rating (0% as healthy and 100% as extremely injured); while the image-based data comprised of seed area (number of pixels), greenness ratio (green area with respect to total seed area), greenness area (number of pixels), brownness ratio (brown area with respect to total seed area), brownness area (number of pixels), and greenness to brownness ratio. The correlation coefficients between the ground-truth and image-based data (six features) were determined one-on-one (each replicate of each treatment and variety) and by average (replicates averaged within a variety for a treatment). The ground-truth changes in root length data and visual rating data were significantly correlated (p < 0.05) in both cases (one-on-one and average comparison). Similarly, the ground-truth data was also significantly correlated with image-based data in most cases (Table 1). However, further analysis revealed that the correlation was resulting from the high root length or low visual rating (0%) of that control. Eliminating the control data for correlation analysis revealed that only average root length data was significantly correlated with average seed size (Figure 7).
Further analysis (ANOVA) for mean comparisons on measured and extracted data indicated that there was no significant herbicide rate effect from 50 to 200 ppm on the ground-truth nor image based data. Nevertheless, the method described herein could be used to evaluate the seed damage, and normalize the greenness/brownness based on the seed size and color differences. A lower herbicide concentration may have given treatment differences. Nevertheless, considering the study as two treatments (flumioxazin treated vs. non-treated control), the differences could be captured by image features. The technique, which is able to detect injury with no injury, could be useful depending on specific research objectives. If a genetic tolerance to a particular herbicide was presented, resulting in different cultivar responses to a range of herbicide rates, one could use the technique to screen varieties or cultivars for herbicide tolerance.
4. Conclusions
In summary, image-based coleoptile length detection is proved to be feasible with reasonable accuracy (r = 0.69–0.91). The performance of image-based coleoptile length detection can be improved through the development of a specific germination protocol that is designed for an imaging device and image processing. Compared with manual measurement, image-based coleoptile and seedling measurement could render more features that can be useful to the breeders. The findings from the herbicide study indicate a potential way to normalize the color data based on seed size, and estimate/predict root length based on the strong relationship between root length and image-based seed size data.
Author Contributions
For Case Study I, C.Z., J.L., K.C. and S.S. conceived and designed the experiments; C.Z. and J.L. performed the experiments; C.Z. and S.S. analyzed the data; K.C. and S.S. contributed reagents/materials/analysis tools. For Case Study II, Y.S., R.B. and S.S. conceived and designed the experiments; Y.S. and R.B. performed the experiments; Y.S. and S.S. analyzed the data; R.B. and S.S. contributed reagents/materials/analysis tools; C.Z., Y.S. and S.S. wrote the manuscript; and J.L., R.B. and K.C. edited and revised the manuscript. Code will be available upon request.
Acknowledgments
This work is funded by the Agriculture and Food Research Initiative (1008828) of the USDA National Institute of Food and Agriculture. This project was also funded, in part by the USDA National Institute for Food and Agriculture, Hatch Project, 1002864.
Conflicts of Interest
The authors declare no conflict of interest.
References
- Nguyen, T.T.; Slaughter, D.C.; Max, N.; Maloof, J.N.; Sinha, N. Structured light-based 3D reconstruction system for plants. Sensors 2015, 15, 18587–18612. [Google Scholar] [CrossRef] [PubMed]
- Nguyen, T.T.; Slaughter, D.C.; Townsley, B.T.; Carriedo, L.; Maloof, J.N.; Shinha, N. In-field plant phenotyping using multi-view reconstruction: An investigation in eggplant. In Proceedings of the 13th International Conference on Precision Agriculture, St. Louis, MO, USA, 31 July–4 August 2016. [Google Scholar]
- Tanabata, T.; Shibaya, T.; Hori, K.; Ebana, K.; Yano, M. SmartGrain: High-throughput phenotyping software for measuring seed shape through image analysis. Plant Physiol. 2012, 160, 1871–1880. [Google Scholar] [CrossRef] [PubMed]
- Jahnke, S.; Roussel, J.; Hombach, T.; Kochs, J.; Fischbach, A.; Huber, G.; Scharr, H. Phenoseeder—A robot system for automated handling and phenotyping of individual seeds. Plant Physiol. 2016, 172, 1358–1370. [Google Scholar] [CrossRef] [PubMed]
- Miller, N.D.; Parks, B.M.; Spalding, E.P. Computer-vision analysis of seedling responses to light and gravity. Plant J. 2007, 52, 374–381. [Google Scholar] [CrossRef] [PubMed]
- Vollmann, J.; Walter, H.; Sato, T.; Schweiger, P. Digital image analysis and chlorophyll metering for phenotyping the effects of nodulation in soybean. Comput. Electron. Agric. 2011, 75, 190–195. [Google Scholar] [CrossRef]
- Subramanian, R.; Spalding, E.P.; Ferrier, N.J. A high throughput robot system for machine vision based plant phenotype studies. Mach. Vis. Appl. 2013, 24, 619–636. [Google Scholar] [CrossRef]
- Sozzani, R.; Busch, W.; Spalding, E.P.; Benfey, P.N. Advanced imaging techniques for the study of plant growth and development. Trends Plant Sci. 2014, 19, 304–310. [Google Scholar] [CrossRef] [PubMed]
- Kipp, S.; Mistele, B.; Baresel, P.; Schmidhalter, U. High-throughput phenotyping early plant vigour of winter wheat. Eur. J. Agron. 2014, 52, 271–278. [Google Scholar] [CrossRef]
- Patrignani, A.; Ochsner, T.E. Canopeo: A powerful new tool for measuring fractional green canopy cover. Agron. J. 2015, 107, 2312–2320. [Google Scholar] [CrossRef]
- Gage, J.L.; Miller, N.D.; Spalding, E.P.; Kaeppler, S.M.; de Leon, N. TIPS: A system for automated image-based phenotyping of maize tassels. Plant Methods 2017, 13, 21. [Google Scholar] [CrossRef] [PubMed]
- Iyer-Pascuzzi, A.S.; Symonova, O.; Mileyko, Y.; Hao, Y.; Belcher, H.; Harer, J.; Weitz, J.S.; Benfey, P.N. Imaging and analysis platform for automatic phenotyping and trait ranking of plant root systems. Plant Physiol. 2010, 152, 1148–1157. [Google Scholar] [CrossRef] [PubMed]
- Trachsel, S.; Kaeppler, S.M.; Brown, K.M.; Lynch, J.P. Shovelomics: High throughput phenotyping of maize (Zea mays L.) root architecture in the field. Plant Soil 2011, 341, 75–87. [Google Scholar] [CrossRef]
- Clark, R.; MacCurdy, R.; Jung, J.; Shaff, J.; McCouch, S.R.; Aneshansley, D.; Kochian, L. 3-Dimensional root phenotyping with a novel imaging and software platform. Plant Physiol. 2011. [Google Scholar] [CrossRef] [PubMed]
- Spalding, E.P.; Miller, N.D. Image analysis is driving a renaissance in growth measurement. Curr. Opin. Plant Biol. 2013, 16, 100–104. [Google Scholar] [CrossRef] [PubMed]
- Mohan, A.; Schillinger, W.F.; Gill, K.S. Wheat seedling emergence from deep planting depths and its relationship with coleoptile length. PLoS ONE 2013, 8, e73314. [Google Scholar] [CrossRef] [PubMed]
- Schillinger, W.F.; Donaldson, E.; Allan, R.E.; Jones, S.S. Winter wheat seedling emergence from deep sowing depths. Agron. J. 1998, 90, 582–586. [Google Scholar] [CrossRef]
- Schillinger, W.F.; Papendick, R.I. Then and now: 125 years of dryland wheat farming in the Inland Pacific Northwest. Agron. J. 2008, 100, S-166–S-182. [Google Scholar] [CrossRef]
- Gan, Y.; Stobbe, E.H.; Moes, J. Relative date of wheat seedling emergence and its impact on grain yield. Crop Sci. 1992, 32, 1275–1281. [Google Scholar] [CrossRef]
- Huang, B.; Taylor, H.M. Morphological development and anatomical features of wheat seedlings as influenced by temperature and seeding depth. Crop Sci. 1993, 33, 1269–1273. [Google Scholar] [CrossRef]
- Rebetzke, G.J.; Richards, R.A.; Fettell, N.A.; Long, M.; Condon, A.G.; Forrester, R.I.; Botwright, T.L. Genotypic increases in coleoptile length improves stand establishment, vigour and grain yield of deep-sown wheat. Field Crops Res. 2007, 100, 10–23. [Google Scholar] [CrossRef]
- Pearce, S.; Saville, R.; Vaughan, S.P.; Chandler, P.M.; Wilhelm, E.P.; Sparks, C.A.; Al-Kaff, N.; Korolev, A.; Boulton, M.I.; Phillips, A.L.; et al. Molecular characterization of Rht-1 dwarfing genes in hexaploid wheat. Plant Physiol. 2011, 157, 1820–1831. [Google Scholar] [CrossRef] [PubMed]
- Gulnaz, S.; Sajjad, M.; Khaliq, I.; Khan, A.S.; Khan, S.H. Relationship among coleoptile length, plant height and tillering capacity for developing improved wheat varieties. Int. J. Agric. Biol. 2011, 13, 130–133. [Google Scholar]
- Hakizimana, F.; Haley, S.D.; Turnipseed, E.B. Repeatability and genotype × environment interaction of coleoptile length measurements in winter wheat. Crop Sci. 2000, 40, 1233–1237. [Google Scholar] [CrossRef]
- Goldsworthy, A.; Gates, R.; Ridgley, D. An electronic coleoptile measuring device. J. Exp. Bot. 1977, 28, 744–750. [Google Scholar] [CrossRef]
- Fraas, S.; Niehoff, V.; Lüthen, H. A high-throughput imaging auxanometer for roots and hypocotyls of Arabidopsis using a 2D skeletonizing algorithm. Physiol. Plant. 2014, 151, 112–118. [Google Scholar] [CrossRef] [PubMed]
- Ashton, F.M.; Harvey, W.A. Selective Chemical Weed Control; Division of Agricultural Sciences, University of California: Berkeley, CA, USA, 1971. [Google Scholar]
- Taylor-Lovell, S.; Wax, L.M.; Nelson, R. Phytotoxic response and yield of soybean (Glycine max) varieties treated with sulfentrazone or flumioxazin. Weed Technol. 2001, 15, 95–102. [Google Scholar] [CrossRef]
- Streibig, J.C.; Rasmussen, J.; Andújar, D.; Andreasen, C.; Berge, T.W.; Chachalis, D.; Dittmann, T.; Gerhards, R.; Giselsson, T.M.; Hamouz, P.; et al. Sensor-based assessment of herbicide effects. Weed Res. 2014, 54, 223–233. [Google Scholar] [CrossRef]
- Reiling, K.L.; Simmons, F.W.; Riechers, D.E.; Steckel, L.E. Application timing and soil factors affect sulfentrazone phytotoxicity to two soybean (Glycine max (L.) Merr.) cultivars. Crop Prot. 2006, 25, 230–234. [Google Scholar] [CrossRef]
- Peachey, E.; Doohan, D.; Koch, T. Selectivity of fomesafen based systems for preemergence weed control in cucurbit crops. Crop Prot. 2012, 40, 91–97. [Google Scholar] [CrossRef]
- Bock, C.H.; Poole, G.H.; Parker, P.E.; Gottwald, T.R. Plant disease severity estimated visually, by digital photography and image analysis, and by hyperspectral imaging. Crit. Rev. Plant Sci. 2010, 29, 59–107. [Google Scholar] [CrossRef]
- Bell, G.E.; Martin, D.L.; Kuzmic, R.M.; Stone, M.L.; Solie, J.B. Herbicide tolerance of two cold-resistant bermudagrass (Cynodon spp.) cultivars determined by visual assessment and vehicle-mounted optical sensing. Weed Technol. 2000, 14, 635–641. [Google Scholar] [CrossRef]
- Thelen, K.D.; Kravchenko, A.N.; Lee, C.D. Use of optical remote sensing for detecting herbicide injury in soybean. Weed Technol. 2004, 18, 292–297. [Google Scholar] [CrossRef]
- Huang, K.-Y. Application of artificial neural network for detecting Phalaenopsis seedling diseases using color and texture features. Comput. Electron. Agric. 2007, 57, 3–11. [Google Scholar] [CrossRef]
- Camargo, A.; Smith, J.S. An image-processing based algorithm to automatically identify plant disease visual symptoms. Biosyst. Eng. 2009, 102, 9–21. [Google Scholar] [CrossRef]
- Rasmussen, J.; Nielsen, J.; Garcia-Ruiz, F.; Christensen, S.; Streibig, J.C. Potential uses of small unmanned aircraft systems (UAS) in weed research. Weed Res. 2013, 53, 242–248. [Google Scholar] [CrossRef]
- Penner, D.; Graves, D. Temperature influence on herbicide injury to navy beans. Agron. J. 1972, 64, 30. [Google Scholar] [CrossRef]
- Wise, K.; Mueller, D.S.; Kandel, Y.; Young, B.; Johnson, B.; Legleiter, T. Soybean Seedling Damage: Is There an Interaction between the ILeVO Seed Treatment and Pre-Emergence Herbicides? Integrated Crop Management News, 22 May 2015; 319. [Google Scholar]
- Renner, K.A.; Powell, G.E. Dry bean responses to flumioxazin and sulfentrazone. In Proceedings of the North Central Weed Science Society; North Central Weed Science Society: St. Louis, MO, USA, 2002; Volume 57, p. 136. [Google Scholar]
- Soltani, N.; Bowley, S.; Sikkema, P.H. Responses of dry beans to flumioxazin. Weed Technol. 2005, 19, 351–358. [Google Scholar] [CrossRef]
- Wilson, R.G. Dry bean tolerance to flumioxazin. In Proceedings of the Western Society of Weed Science; Curran Associates, Inc.: Red Hook, NY, USA; San Diego, CA, USA, 2013; Volume 66, p. 71. [Google Scholar]
- Arnold, R.N.; Smeal, D.; Lombard, K.A.; O’Neill, M.K.; Allen, S.C.; West, M.; Yazzie, R. Broadleaf weed control in dry beans (Phaseolus vulgaris) with preemergence applications of valor alone or in combination from 2004 to 2008. Bull.-Agric. Exp. Stn. N. M. 2012, 1–4. [Google Scholar]
- Boydston, R.A. Effects of cultivar, seed size and herbicide placement on dry bean response to flumioxazin. In Proceedings of the Western Society of Weed Science; Curran Associates, Inc.: Red Hook, NY, USA; Portland, OR, USA, 2015; Volume 68, p. 29. [Google Scholar]
- Zhang, L.; Richards, R.A.; Condon, A.G.; Liu, D.C.; Rebetzke, G.J. Recurrent selection for wider seedling leaves increases early biomass and leaf area in wheat (Triticum aestivum L.). J. Exp. Bot. 2015, 66, 1215–1226. [Google Scholar] [CrossRef] [PubMed]
- Khlestkina, E.K.; Pestsova, E.G.; Röder, M.S.; Börner, A. Molecular mapping, phenotypic expression and geographical distribution of genes determining anthocyanin pigmentation of coleoptiles in wheat (Triticum aestivum L.). Theor. Appl. Genet. 2002, 104, 632–637. [Google Scholar] [CrossRef] [PubMed]
- Matsui, T.; Inanaga, S.; Shimotashior, T.; An, P.; Sugimoto, Y. Morphological characters related to varietal differences in tolerance to deep sowing in wheat. Plant Prod. Sci. 2002, 5, 169–174. [Google Scholar] [CrossRef]
- Khoenkaw, P. An image-processing based algorithm for rice seed germination rate evaluation. In Proceedings of the IEEE 2016 International Computer Science and Engineering Conference (ICSEC), Chiang Mai, Thailand, 14–17 December 2016; pp. 1–5. [Google Scholar]
Figure 1.
Procedure of image processing of coleoptile. Notes: (a) mask of coleoptiles and reference coin; (b) result of image processing with coleoptiles and reference coin highlighted; and (c) height profile relative to the baseline.
Figure 1.
Procedure of image processing of coleoptile. Notes: (a) mask of coleoptiles and reference coin; (b) result of image processing with coleoptiles and reference coin highlighted; and (c) height profile relative to the baseline.

Figure 2.
Application of width-and-color-based method for the identification of a starting point of coleoptile length measurement.
Figure 2.
Application of width-and-color-based method for the identification of a starting point of coleoptile length measurement.

Figure 3.
Line profiles of seeds. Notes: the black dash line, green solid line, and blue dash dot line represent the greyscale intensities in the R, G, and B channel, respectively, along the yellow line. Pixels between A and B and C and D on the yellow line belonged to an uninjured pixel.
Figure 3.
Line profiles of seeds. Notes: the black dash line, green solid line, and blue dash dot line represent the greyscale intensities in the R, G, and B channel, respectively, along the yellow line. Pixels between A and B and C and D on the yellow line belonged to an uninjured pixel.

Figure 4.
Procedure of image-based herbicide injury identification. Notes: (a) raw image; (b) uninjured parts of the seeds highlighted in blue; (c) greyscale image of G channel; and (d) seeds segmented from the background.
Figure 4.
Procedure of image-based herbicide injury identification. Notes: (a) raw image; (b) uninjured parts of the seeds highlighted in blue; (c) greyscale image of G channel; and (d) seeds segmented from the background.

Figure 5.
Correlations between manual and image-based coleoptile length measurement using average values in first (a) and second experiments (b).
Figure 5.
Correlations between manual and image-based coleoptile length measurement using average values in first (a) and second experiments (b).

Figure 6.
Correlation between manual and width-and-color based coleoptile length measurement using average values in second experiments.
Figure 6.
Correlation between manual and width-and-color based coleoptile length measurement using average values in second experiments.

Figure 7.
Correlation between root length and image-based seed size using average data.


Table 1.
Pearson’s correlation coefficient (r) between ground-truth data and image features in herbicide study.
Table 1.
Pearson’s correlation coefficient (r) between ground-truth data and image features in herbicide study.
| Image Features | With Control | Without Control | ||
|---|---|---|---|---|
| Change In Root Length | Visual Rating | Change In Root Length | Visual Rating | |
| One−on−one comparison | ||||
| Seed area | 0.41 | −0.28 * | 0.20 * | 0.07 * |
| Greenness ratio | 0.62 | −0.84 | 0.01 * | −0.24 * |
| Greenness area | 0.61 | −0.77 | 0.03 * | −0.22 * |
| Brownness ratio | −0.40 | 0.72 | −0.03 * | 0.30 * |
| Brownness area | −0.22 * | 0.53 | 0.07 * | 0.22 * |
| Greenness to brownness ratio | 0.64 | −0.89 | 0.07 * | −0.33 * |
| Average comparison | ||||
| Seed area | 0.72 | −0.39 * | 0.64 | −0.06 * |
| Greenness ratio | 0.75 | −0.89 | 0.03 * | −0.33 * |
| Greenness area | 0.76 | −0.81 | 0.15 * | −0.31 * |
| Brownness ratio | −0.51 | 0.78 | 0.17 * | 0.17 * |
| Brownness area | −0.27 * | 0.62 | 0.39 * | 0.09 * |
| Greenness to brownness ratio | 0.78 | −0.94 | 0.07 * | −0.38 * |
Notes: * Not significantly different at 5% confidence level.
© 2018 by the authors. Licensee MDPI, Basel, Switzerland. This article is an open access article distributed under the terms and conditions of the Creative Commons Attribution (CC BY) license (http://creativecommons.org/licenses/by/4.0/).
Share and Cite
MDPI and ACS Style
Zhang, C.; Si, Y.; Lamkey, J.; Boydston, R.A.; Garland-Campbell, K.A.; Sankaran, S. High-Throughput Phenotyping of Seed/Seedling Evaluation Using Digital Image Analysis. Agronomy 2018, 8, 63. https://doi.org/10.3390/agronomy8050063
AMA Style
Zhang C, Si Y, Lamkey J, Boydston RA, Garland-Campbell KA, Sankaran S. High-Throughput Phenotyping of Seed/Seedling Evaluation Using Digital Image Analysis. Agronomy. 2018; 8(5):63. https://doi.org/10.3390/agronomy8050063
Chicago/Turabian StyleZhang, Chongyuan, Yongsheng Si, Jacob Lamkey, Rick A. Boydston, Kimberly A. Garland-Campbell, and Sindhuja Sankaran. 2018. "High-Throughput Phenotyping of Seed/Seedling Evaluation Using Digital Image Analysis" Agronomy 8, no. 5: 63. https://doi.org/10.3390/agronomy8050063
Note that from the first issue of 2016, this journal uses article numbers instead of page numbers. See further details here.