Article

The Effects of Rice Straw and Biochar Applications on the Microbial Community in a Soil with a History of Continuous Tomato Planting History

1
College of Horticulture, Shenyang Agricultural University, Shenyang 110866, China
2
Land and Environmental College, Shenyang Agricultural University, Shenyang 110866, China
3
Key Soils and Environment Department, Shenyang Agricultural University, Shenyang 110866, China
*
Authors to whom correspondence should be addressed.
Agronomy 2018, 8(5), 65; https://doi.org/10.3390/agronomy8050065
Submission received: 9 April 2018 / Revised: 20 April 2018 / Accepted: 24 April 2018 / Published: 4 May 2018

Abstract

:
Soil microbial abundance and diversity change constantly in continuous cropping systems, resulting in the prevalence of soil-borne pathogens and a decline in crop yield in solar greenhouses. To investigate the effects of rice straw and biochar on soil microbial abundance and diversity in soils with a history of continuous planting, three treatments were examined: mixed rice straw and biochar addition (RC), rice straw addition (R), and biochar addition (C). The amount of C added in each treatment group was 3.78 g kg−1 soil. Soil without rice straw and biochar addition was treated as a control (CK). Results showed that RC treatment significantly increased soil pH, available nitrogen (AN), available phosphorus (AP), and potassium (AK) by 40.3%, 157.2%, and 24.2%, respectively, as compared to the CK soil. The amount of soil labile organic carbon (LOC), including readily oxidizable organic carbon (ROC), dissolved organic carbon (DOC), and light fraction organic carbon (LFOC), was significantly greater in the RC, R, and C treatment groups as compared to CK soil. LOC levels with RC treatment were higher than with the other treatments. Both rice straw and biochar addition significantly increased bacterial and total microbial abundance, whereas rice straw but not biochar addition improved soil microbial carbon metabolism and diversity. Thus, the significant effects of rice straw and biochar on soil microbial carbon metabolism and diversity were attributed to the quantity of DOC in the treatments. Therefore, our results indicated that soil microbial diversity is directly associated with DOC. Based on the results of this study, mixed rice straw and biochar addition, rather than their application individually, might be key to restoring degraded soil.

1. Introduction

Greenhouse horticulture plays an important role in supplying vegetables in northern China due to its superior heat preservation and high crop production [1,2]. However, to obtain higher yields, chemical fertilization is used more frequently than under field cultivation. Intensive application of chemical fertilizers results in soil acidification or salinization [3]. In addition, the cropping system in greenhouses is mostly that of monoculture, and intensive and continuous cropping of a single species inevitably results in barriers to productivity due to deterioration of soil conditions [4]. The most important problem under continuous cropping is the imbalance of soil microflora [5].
Soil microorganisms exert a dominant role in the cycling of soil nutrients [6]. Nitrogen cycling is altered by the modification of the soil-nitrifying microbial community after plant invasion [7]. In addition, microorganisms can enhance the use efficiency of micronutrients by changing the chemical properties of those nutrients [8]. Agricultural management can affect the abundance and diversity of soil microorganisms. Li et al. [9] reported that the abundance and diversity of microorganisms decreased, whereas pathogenic bacteria significantly increased after continuous cropping in a solar greenhouse, leading to outbreaks of disease and a decline in yields. In addition, Liang et al. [5] observed that after 3–5 years of cultivation of cucumbers, the abundance of actinomycetes sharply decreased, giving rise to an increase in the occurrence of pathogenic microbes and a decrease in microbial abundance and diversity.
Straw incorporation is widely used by organic farms to improve soil fertility. Short-term application of straw can induce N immobilization by microbes and decrease N mineralization [10], consequently increasing the net retention of N [11]. Long-term application of straw can significantly increase soil active organic carbon pools, macro aggregates, porosity, and water content [12]. The changes in soil properties under both short-term and long-term applications of straw can be beneficial to soil microbes [13,14], and accordingly, higher soil microbial biomass and activity are frequently observed under straw amendment [15,16]. Instead of applying straw directly, biochar derived from straw pyrolysis has been widely used to improve soil fertility. Biochar can influence soil pH and soil nutrient retention abilities. Changes in soil microbial abundance and diversity have been reported under the application of biochar. In addition, biochar with plenty of macro- and micro pores can provide a habitat for microorganisms. However, in soils with biochar application, biologically active C seems to be the limiting factor for microorganism development. A previous study suggested that biochar has little impact on soil microbial properties due to its chemical stability, which means that microorganisms will not be able to readily utilize the C as an energy source [17]. In contrast, biochar applied with glucose significantly increased soil microbial biomass compared with sole addition of glucose [18]. Straw is rich in readily-available C, however, the effect of the mixed application of plant residue and biochar on soil microbial properties has rarely been studied. The potential role of straw and biochar in improving soil fertility and microbial community and diversity has been fully recognized for open field cropland. However, in solar greenhouses, which are subject to serious soil deterioration and the proliferation of pathogens, it is necessary to study the beneficial effects of straw and biochar on soil microbial abundance and diversity.
In this study, we investigated the effect of rice straw and biochar on soil microbial community diversity and abundance in a solar greenhouse in which chemical fertilizers have been intensively applied and tomatoes have been continuously grown for 20 years. The study aimed to explore whether straw and biochar can improve the soil microbial community diversity in this soil, and the underlying mechanisms. We hypothesize that soil microbial diversity will increase under the addition of rice straw and biochar for the improvement of nutrition and the residential environment.

2. Materials and Methods

2.1. Site Description and Experimental Design

Soil was collected from a greenhouse which had been planted with tomatoes (Solanum lycopersicum L.) for 20 years. The chemical properties of the original soil planted with tomatoes are shown in Table 1. The soil is classified as Hapli-Udic Cambisol (FAO Classification). After transporting to greenhouse (123°57′ E, 41°83′ N), located at Shenyang Agricultural University in Shenyang city, Liaoning Province, soils were loaded into individual plots measuring 1.5 m × 0.8 m × 1.0 m.
The treatments used were as follows: mixed rice straw and biochar addition (RC), rice straw addition (R), biochar addition (C), and no rice straw and biochar addition (CK). The properties of the rice straw and biochar are presented in Table 2. The biochar was supplied by Liaoning Jinfu Agricultural Technology Development Co. Ltd (Shenyang, Liaoning, China). It was derived from rice straw combusted at 400–450 °C under low oxygen pressure.
The rice straw was applied at the rate of 5.56 g kg−1 soil (1.5 m2) which is realistic as a maximum rate of residue incorporation under field conditions. In order to achieve equal C, 3.78 g biochar kg−1 soil (which was equal to 9.5 t ha−1), was added at the rate of 4.26 g kg−1 soil kg per plot. In the RC treatment, rice straw and biochar were applied at the rate of 2.78 g kg−1 soil and 0.43 g kg−1 soil kg per plot, respectively. Both rice straw and biochar were mixed thoroughly with the surface soil (0–20 cm). Simultaneously, 0.073 g N kg−1 soil, 0.037 g P2O5 kg−1 soil, and 0.119 g K2O kg−1 soil, which equal 184 kg N ha−1, 92 P2O5 ha−1, and 300 kg K ha−1, respectively, were added as base fertilizer for all the treatments to meet the nutrient needs for tomato development. Treatments were replicated three times and arranged in a randomized block design. Tomatoes were planted in March and August of 2012, respectively. Row-to-row and plant-to-plant spacing was 35 and 30 cm, respectively.

2.2. Soil Sampling and Analysis

2.2.1. Soil Sampling

Top soil (0–30 cm) was sampled from five random sites within each plot after the tomato harvest in 2012. The soil was sieved with a 1-mm sieve. Fresh soil samples were stored at 4 °C for 6 h before carbon substrate oxidation pattern (BIOLOG) analyses. Subsamples were air dried at room temperature for the analysis of soil chemical properties.

2.2.2. Analysis of Soil Microbial Abundance

Soil microbial abundance was examined by the dilution plate method [19,20]; 10% tryptic soy agar (TSA; Difco Laboratories Inc., Detroit, MI, USA) was used for bacterial incubation [21], actinomycete isolation agar (Difco) was used for actinomycete incubation, and Martin’s rose bengal was used for fungal incubation [22]. All plates were incubated at 28 °C in the dark. The numbers of bacteria and fungi were manually counted after 4–7 days, and actinomycetes were counted after 10–14 days. The total microbial abundance (TMA) was the sum of the bacterial, fungal, and actinomycete abundances.

2.2.3. Analysis of Soil Microbial Community Functional Diversity

Fresh soil (10 g) was added to a 250-mL flask containing 100 mL of distilled water. The mixture was shaken for 10 min, 10-fold serial dilutions were prepared, and 15 mL of the dilution was used to inoculate BIOLOG Eco Plates. The BIOLOG plates were incubated at 25 °C for 7 days, and color development was measured by detecting the absorbance (A) in an automated plate reader at 590 nm.
The average well color development (AWCD) [23] was calculated for each micro plate using the following equation:
AWCD = ( C R ) / n
where C is the raw absorbance in each well, R is the absorbance in well A1, and n is the number of substrates reacting in the plate.
Substrate richness (S) was termed as the sum of all positive wells. Positive wells were defined as wells with an optical density value greater than 0.2.
The Shannon–Weiner index was determined using the following equations [24]:
H = ( P i × log P i )
P i = ( C R ) / ( C R )
where Pi is the ratio of the optical density of each well to all wells beyond the contrast.
Simpson’s dominance (D) was calculated as follows:
D = 1 P i 2

2.2.4. Analysis of Soil Chemical Properties

Soil pH was determined in water suspension at a soil: water (w/w) ratio of 1:2.5 using a pH meter (S210, Mettler Toledo, Greifensee, Switzerland). The pH of biochar was measured at a biochar: water (w/w) ratio of 1:5. Soil and biochar electrical conductivity (EC) were measured at a soil/biochar: water (w/w) ratio of 1:5 using a DDS-307 conductivity meter (INESA, Shanghai, China). Soil available N (AN) was examined by the 1 mol L−1 NaOH diffusion method [16]. Soil available P (AP) was extracted by NaHCO3 and the concentration of P in filtrate was determined by a molybdenum blue colorimetric method [25]. Soil available K (AK) was extracted with ammonium acetate at pH 7.0 and determined using flame photometry. Soil organic carbon (SOC) was measured by the potassium dichromate heating method, readily oxidizable organic carbon (ROC) was measured by the chemical oxidation method, and soil dissolved organic carbon (DOC) was measured by the, solution colorimetric determination [26]. The soil light fraction organic carbon (LFOC) was separated using 1.7 g cm−3 sodium iodide and measured using an elemental analyzer (Elementar III, Langenselbold, Germany) [27]. Total C, N, H, and O of rice straw and biochar were determined using Perkin-Elmer 2400 Series II CHNS/O analyzer (Perkin-Elmer, Shelton, CT, USA). To measure the total P and K, biochar and rice straw were digested by HNO3-HF-HClO4. Total P was measure by the molybdenum blue colorimetric method, and total K was determined by flame photometer [26].

2.3. Statistical Analysis

Multiple comparisons with a Tukey test were conducted to examine differences among the different treatments. Linear regression analyses (stepwise) were performed to determine variables contributing significantly to soil microbial diversity. All statistical analyses were performed in SPSS 16.0 (SPSS, Inc., Chicago, IL, USA), and statistical significance was reported at p < 0.05. Principal component analysis (PCA) by Canoco software (Canoco for Windows 4.5, Microcomputer Power Inc., Willis, TX, USA) was used to analyze microbial community composition based on a correlation similarity matrix. All data were tested for normal distribution before statistical analyses.

3. Results

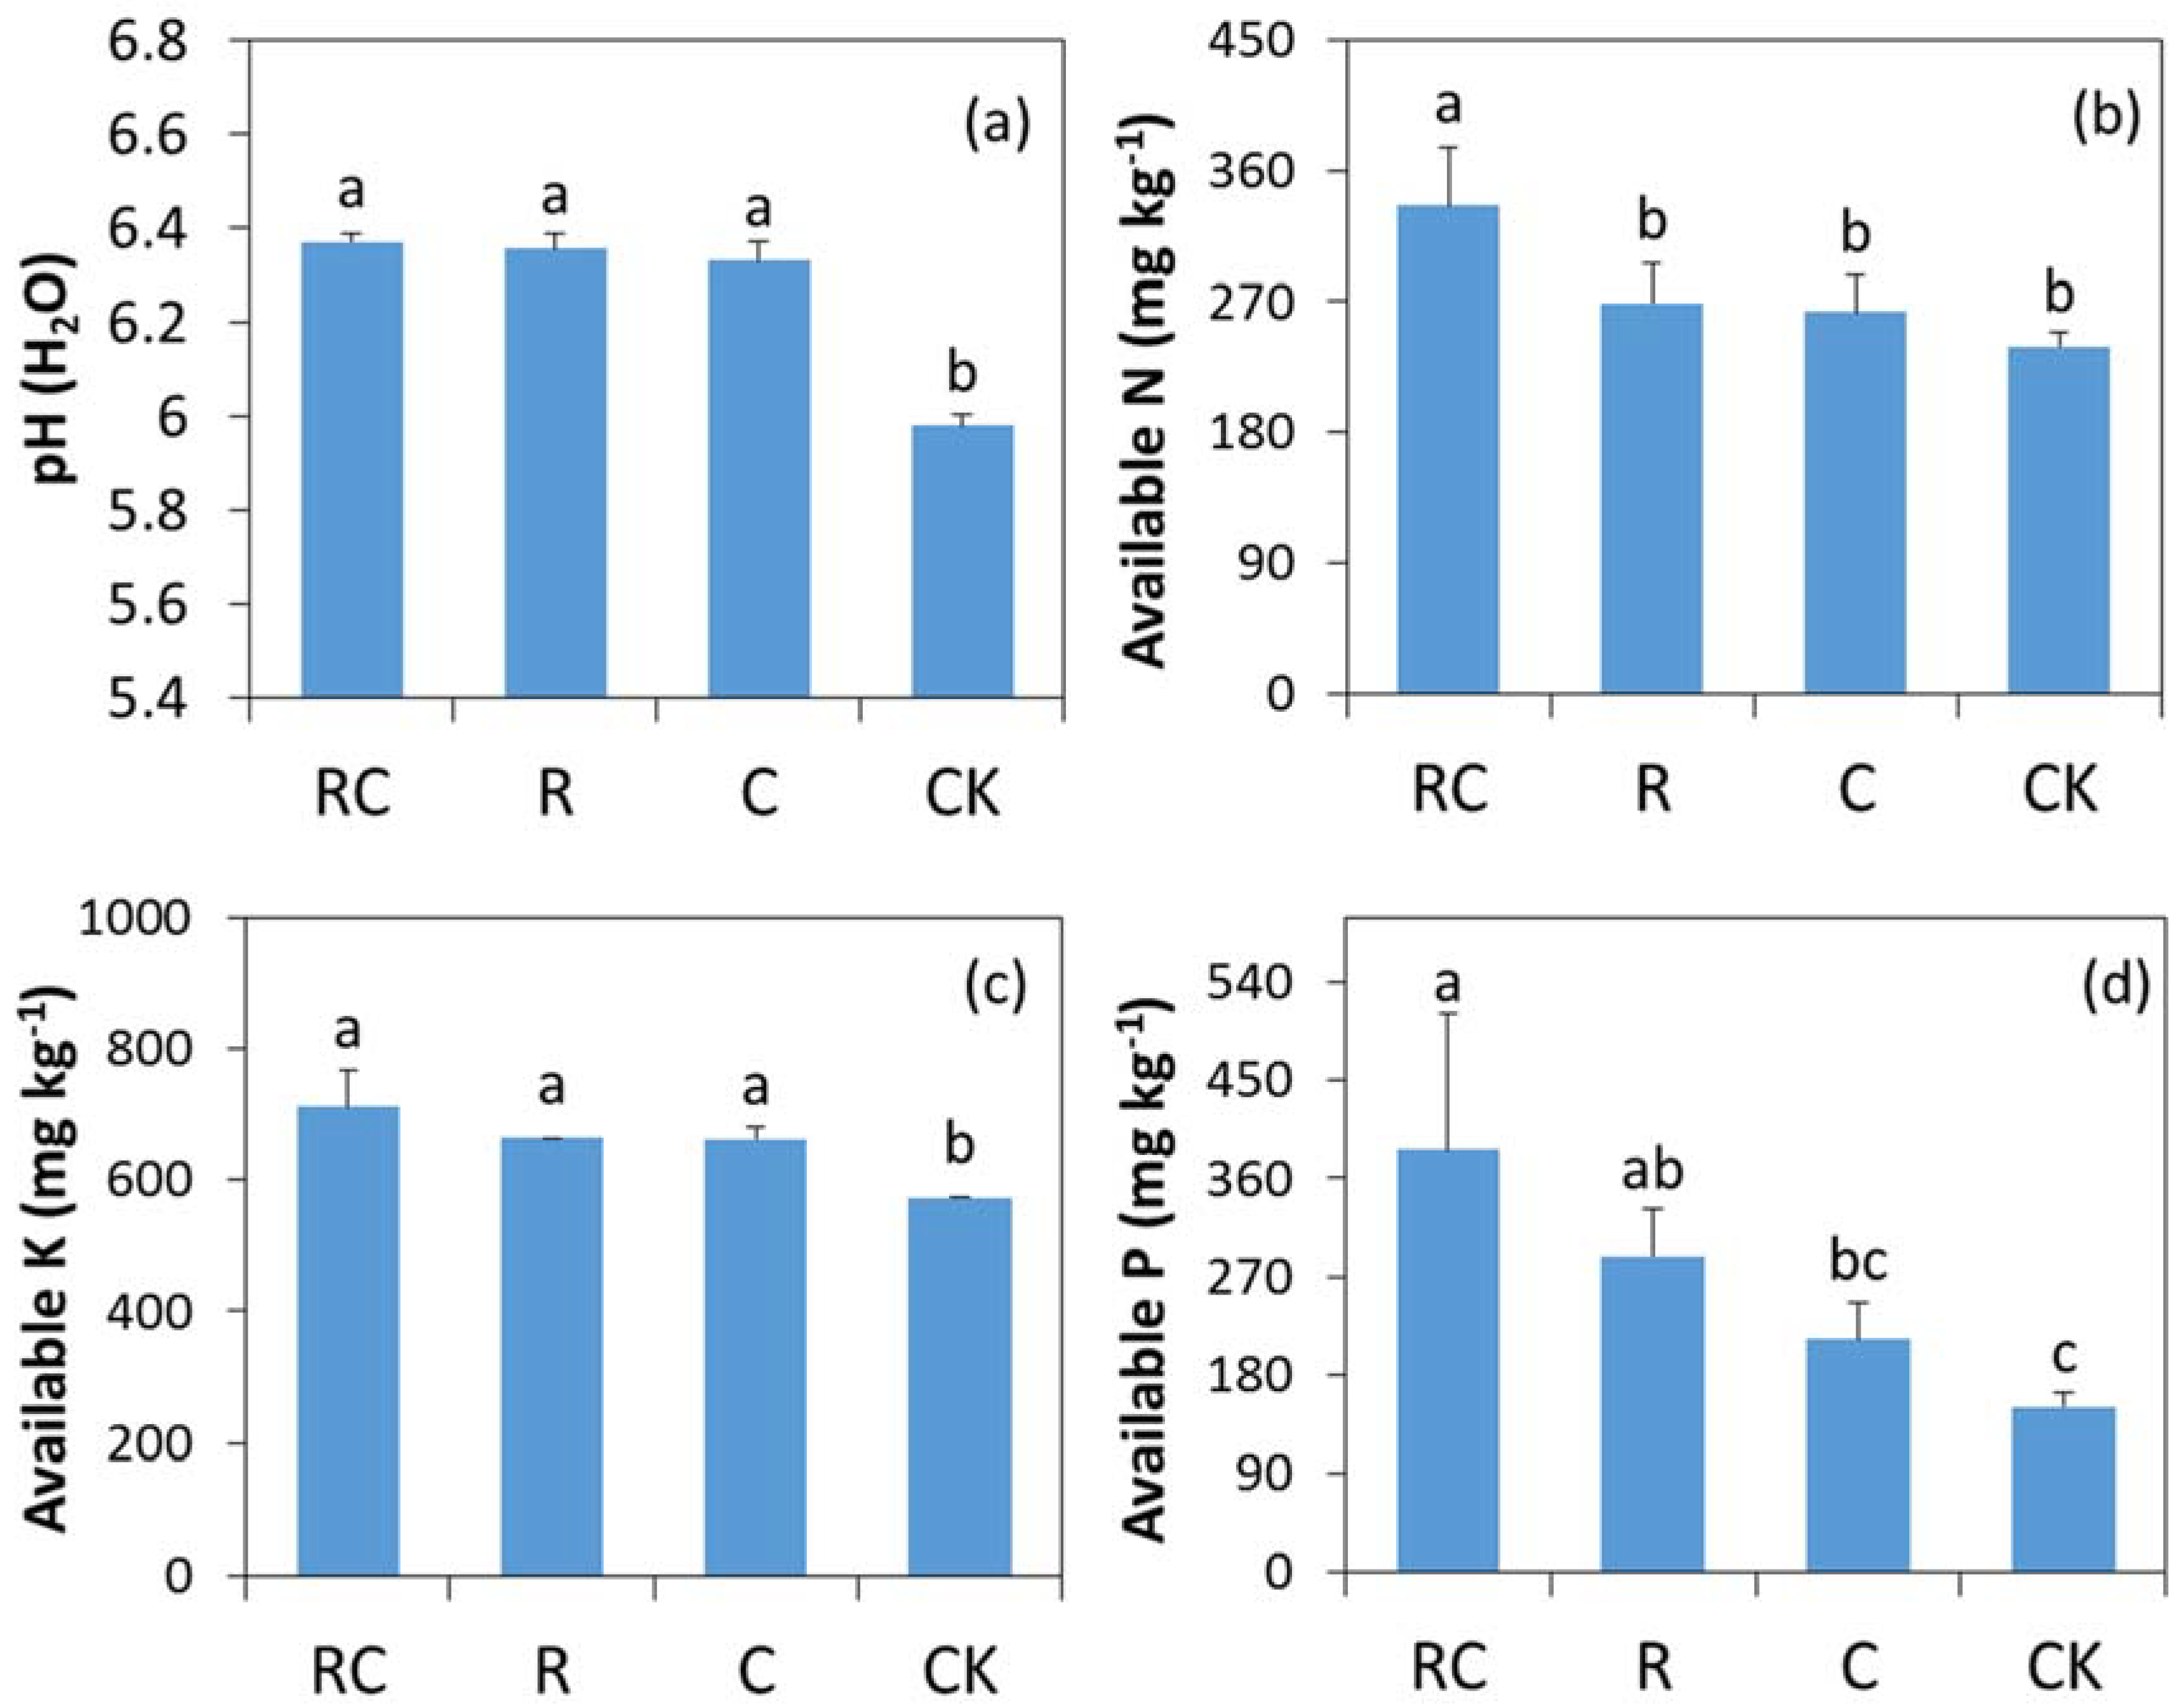
3.1. Soil pH, Available N, P, and K

All treatments significantly increased soil pH as compared with CK, but the differences in soil pH among the RC, R, and C treatments were not significant (Figure 1a). Mixed rice straw and biochar application significantly increased soil AN, AP, and AK, while R and C had no significant effect over that of CK (Figure 1b–d).

3.2. Soil Active Organic Carbon Fractions

A significantly higher ROC, ranging from 4.9 to 7.1 mg kg−1, was recorded under RC treatment and content was the lowest for CK treatment (Figure 2a). ROC content was significantly higher for R treatment as compared to C treatment. Similarly, the LFOC content was significantly higher for the RC and R treatments as compared to the C and CK treatment soils (Figure 2b). DOC increased by 54.3%, 32.7%, and 16.7% for the RC, R, and C treatments as compared with CK treatment, respectively (Figure 2c). DOC content was significantly higher for the RC and R treatments as compared to C treatment. No significant difference was observed in SOC content among all the treatments, including CK treatment (Figure 2d).

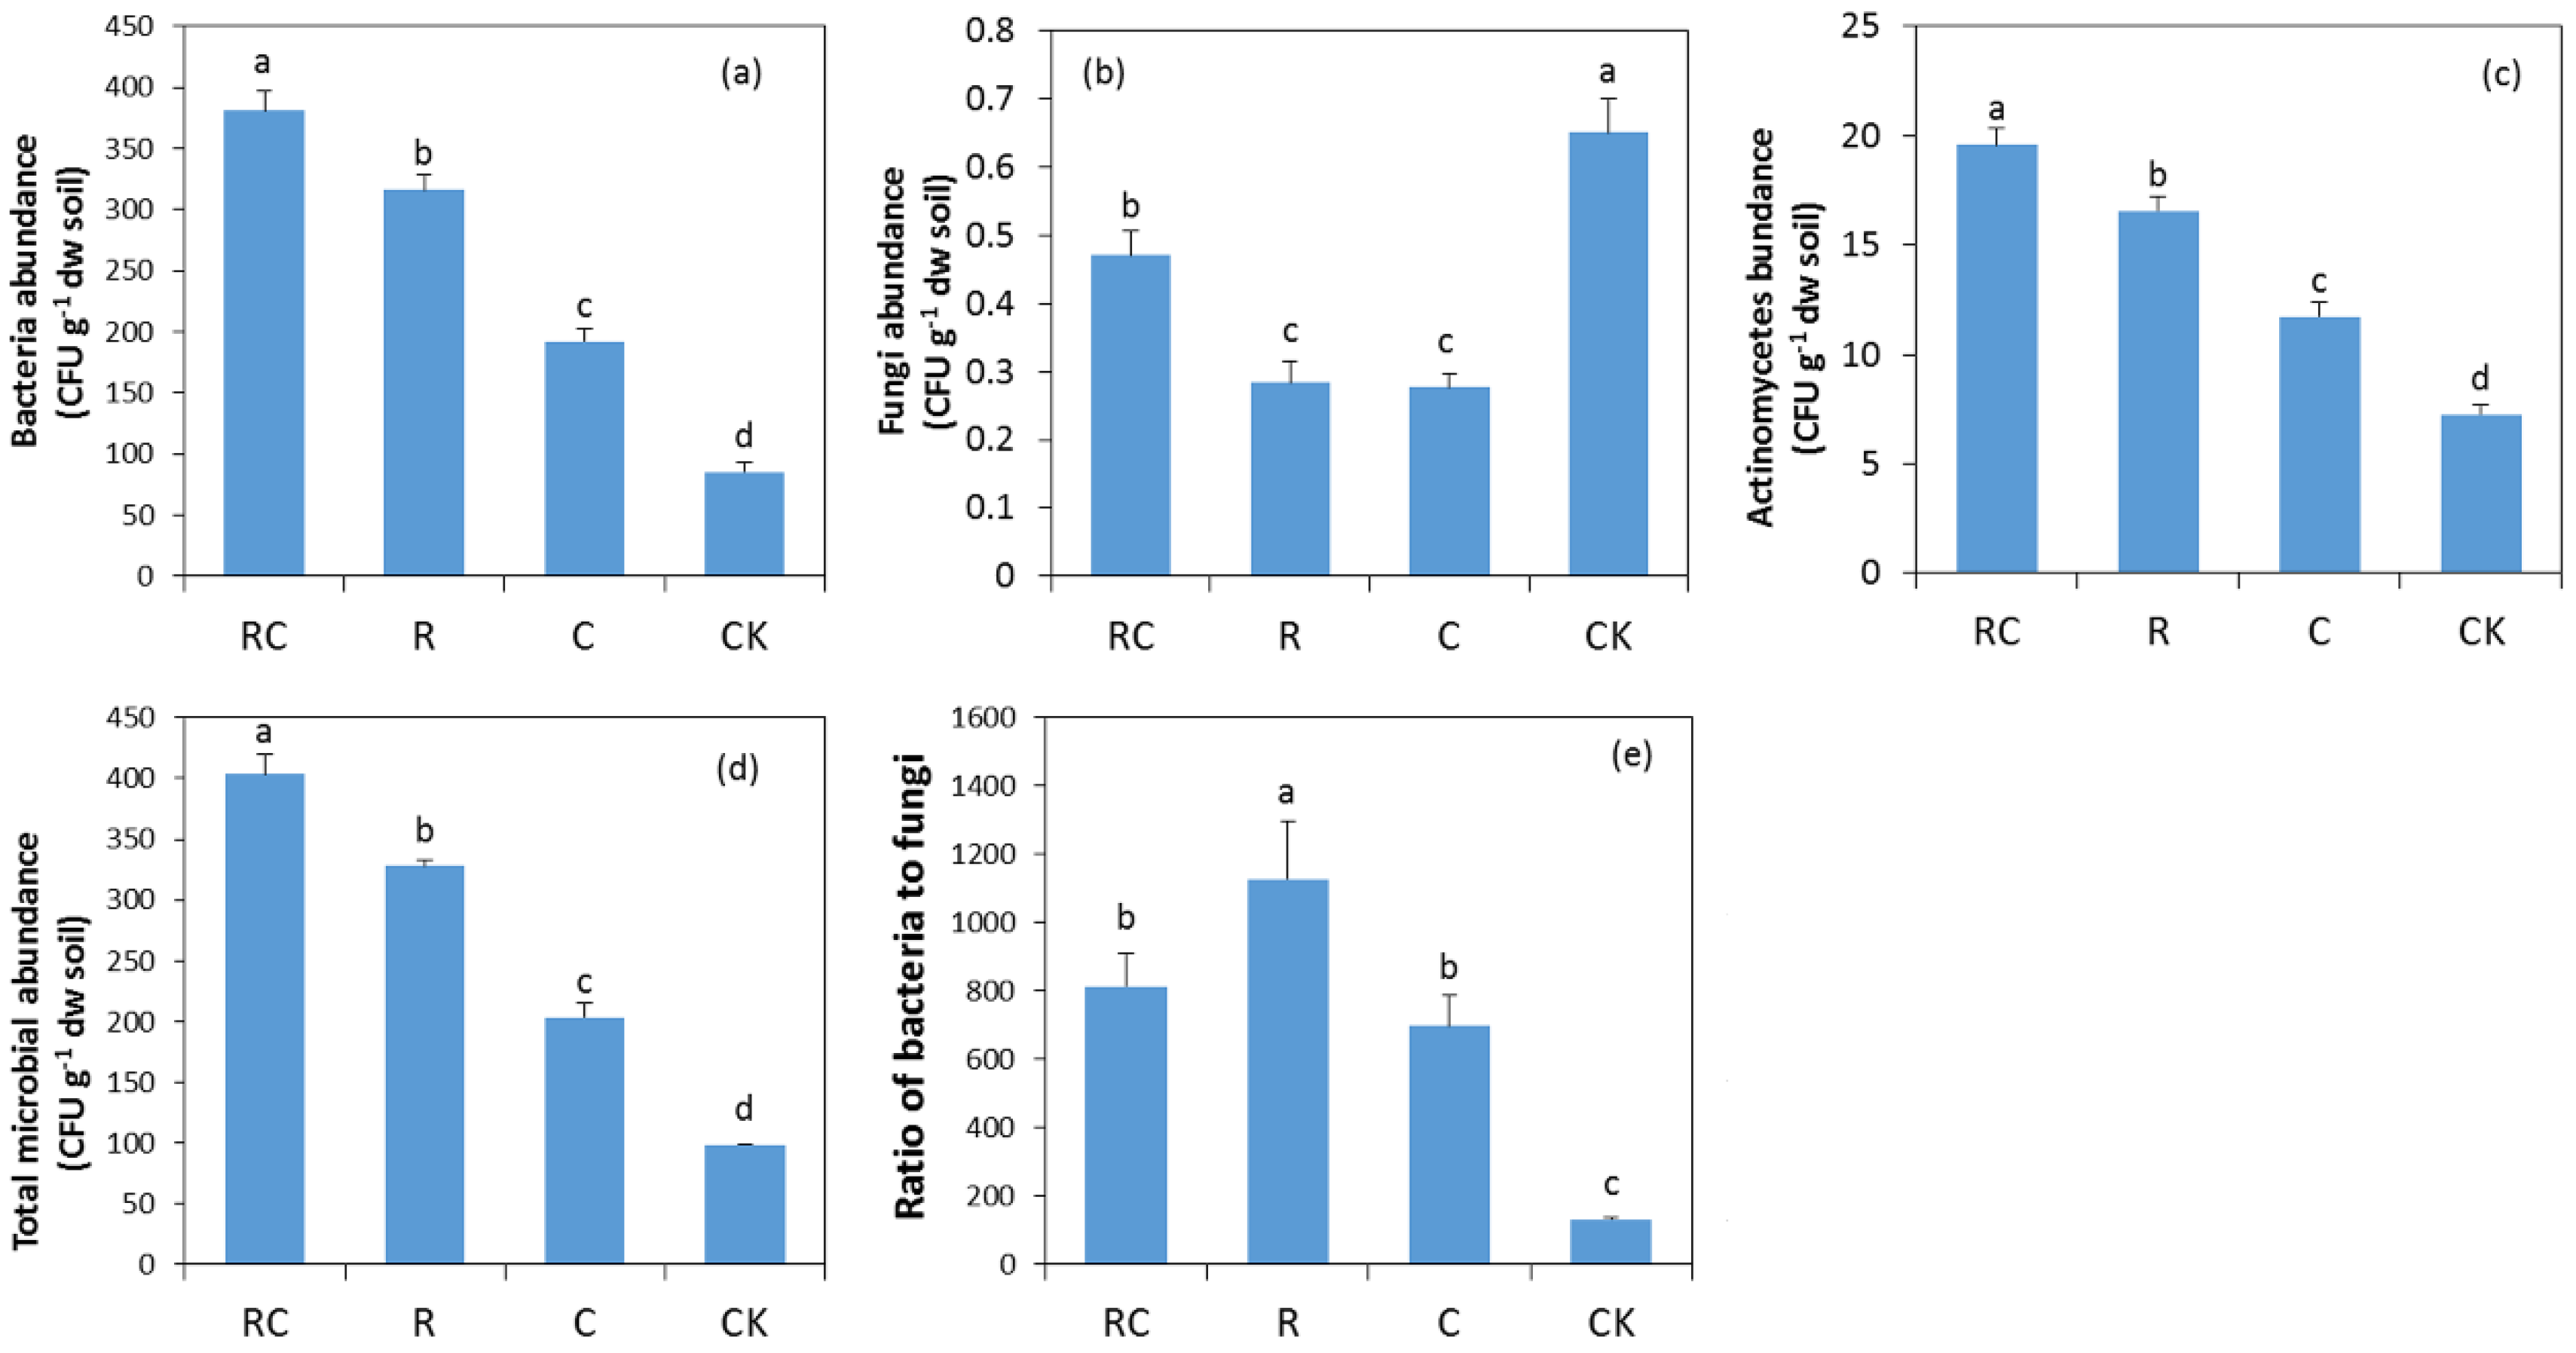
3.3. Soil Microbial Abundance

All treatments significantly increased the abundance of bacteria as compared with CK treatment (Figure 3a). The abundance of bacteria increased by 348.2%, 315% and 190.6% under RC, R, and C treatments, as compared to CK treatment, respectively. The bacterial abundance was significantly higher under the RC and R treatments as compared to C treatment, respectively. The abundance of fungi was significantly higher in CK treatment as compared to the RC, R, and C treatments (Figure 3b). The abundance of fungi was 0.47 CFU g−1 dw (drained weight) soil for the RC treatment, which was significantly higher than that of the R and C treatments. The abundance of actinomycetes increased by 170.4%, 128.6%, and 61.9% in the RC, R, and C treatments as compared with CK treatment, respectively (Figure 3c). All treatments showed significantly increased soil TMA over that of CK treatment, while the highest TMA was recorded in the RC treatment and lowest in the C treatment (Figure 3d). The ratio of bacteria to fungi (B/F) was significantly higher for R treatment as compared to the RC and C treatments (Figure 3e), whereas the RC and C treatments had significantly increased B/F as compared to CK treatment.

3.4. Functional Diversity of the Soil Microbial Community

Soil microbial carbon metabolism (represented by AWSD) increased sharply over 24–72 h of incubation and then increased slowly under all treatments, including CK (Figure 4). After 144 h of incubation, the soil microbial carbon metabolism leveled off, irrespective of the treatment. Under the RC and R treatments, the levels of soil microbial activity were significantly higher than for the C and CK treatments, respectively. According to two-way ANOVA, all soil microbial activity significantly increased under the application of rice straw except at 144 h and 192 h. The C treatment significantly improved soil microbial carbon metabolism only at 48 h, respectively.
The RC and R treatments showed significantly increased soil microbial richness, Shannon’s diversity index and Simpson index as compared with the C and CK treatments (Table 3). No significant differences in richness, Shannon’s diversity index, and Simpson index were observed between the C and CK treatments.

3.5. Effects of Rice Straw and Biochar on Soil Chemical and Microbial Properties

To determine which management strategy, rice straw or biochar, positively affects the soil microbial community, we performed PCA using Canoco software (Figure 5). The bacterial, actinomycete, and total microbial abundances and B/F were mainly affected by the RC and R treatments (Figure 5a). The PCA biplot clearly showed that microbial diversities were mainly impacted by rice straw addition (Figure 5b).
Two-way ANOVA showed that both rice straw and biochar addition had significant effects on bacterial abundance, fungal abundance, actinomycete abundance, and TMA (Table 4), whereas only rice straw had a significant effect on microbial diversity. The interaction effects of rice straw and biochar were observed to be significant for the abundance of microbes and B/F but not microbial diversity.

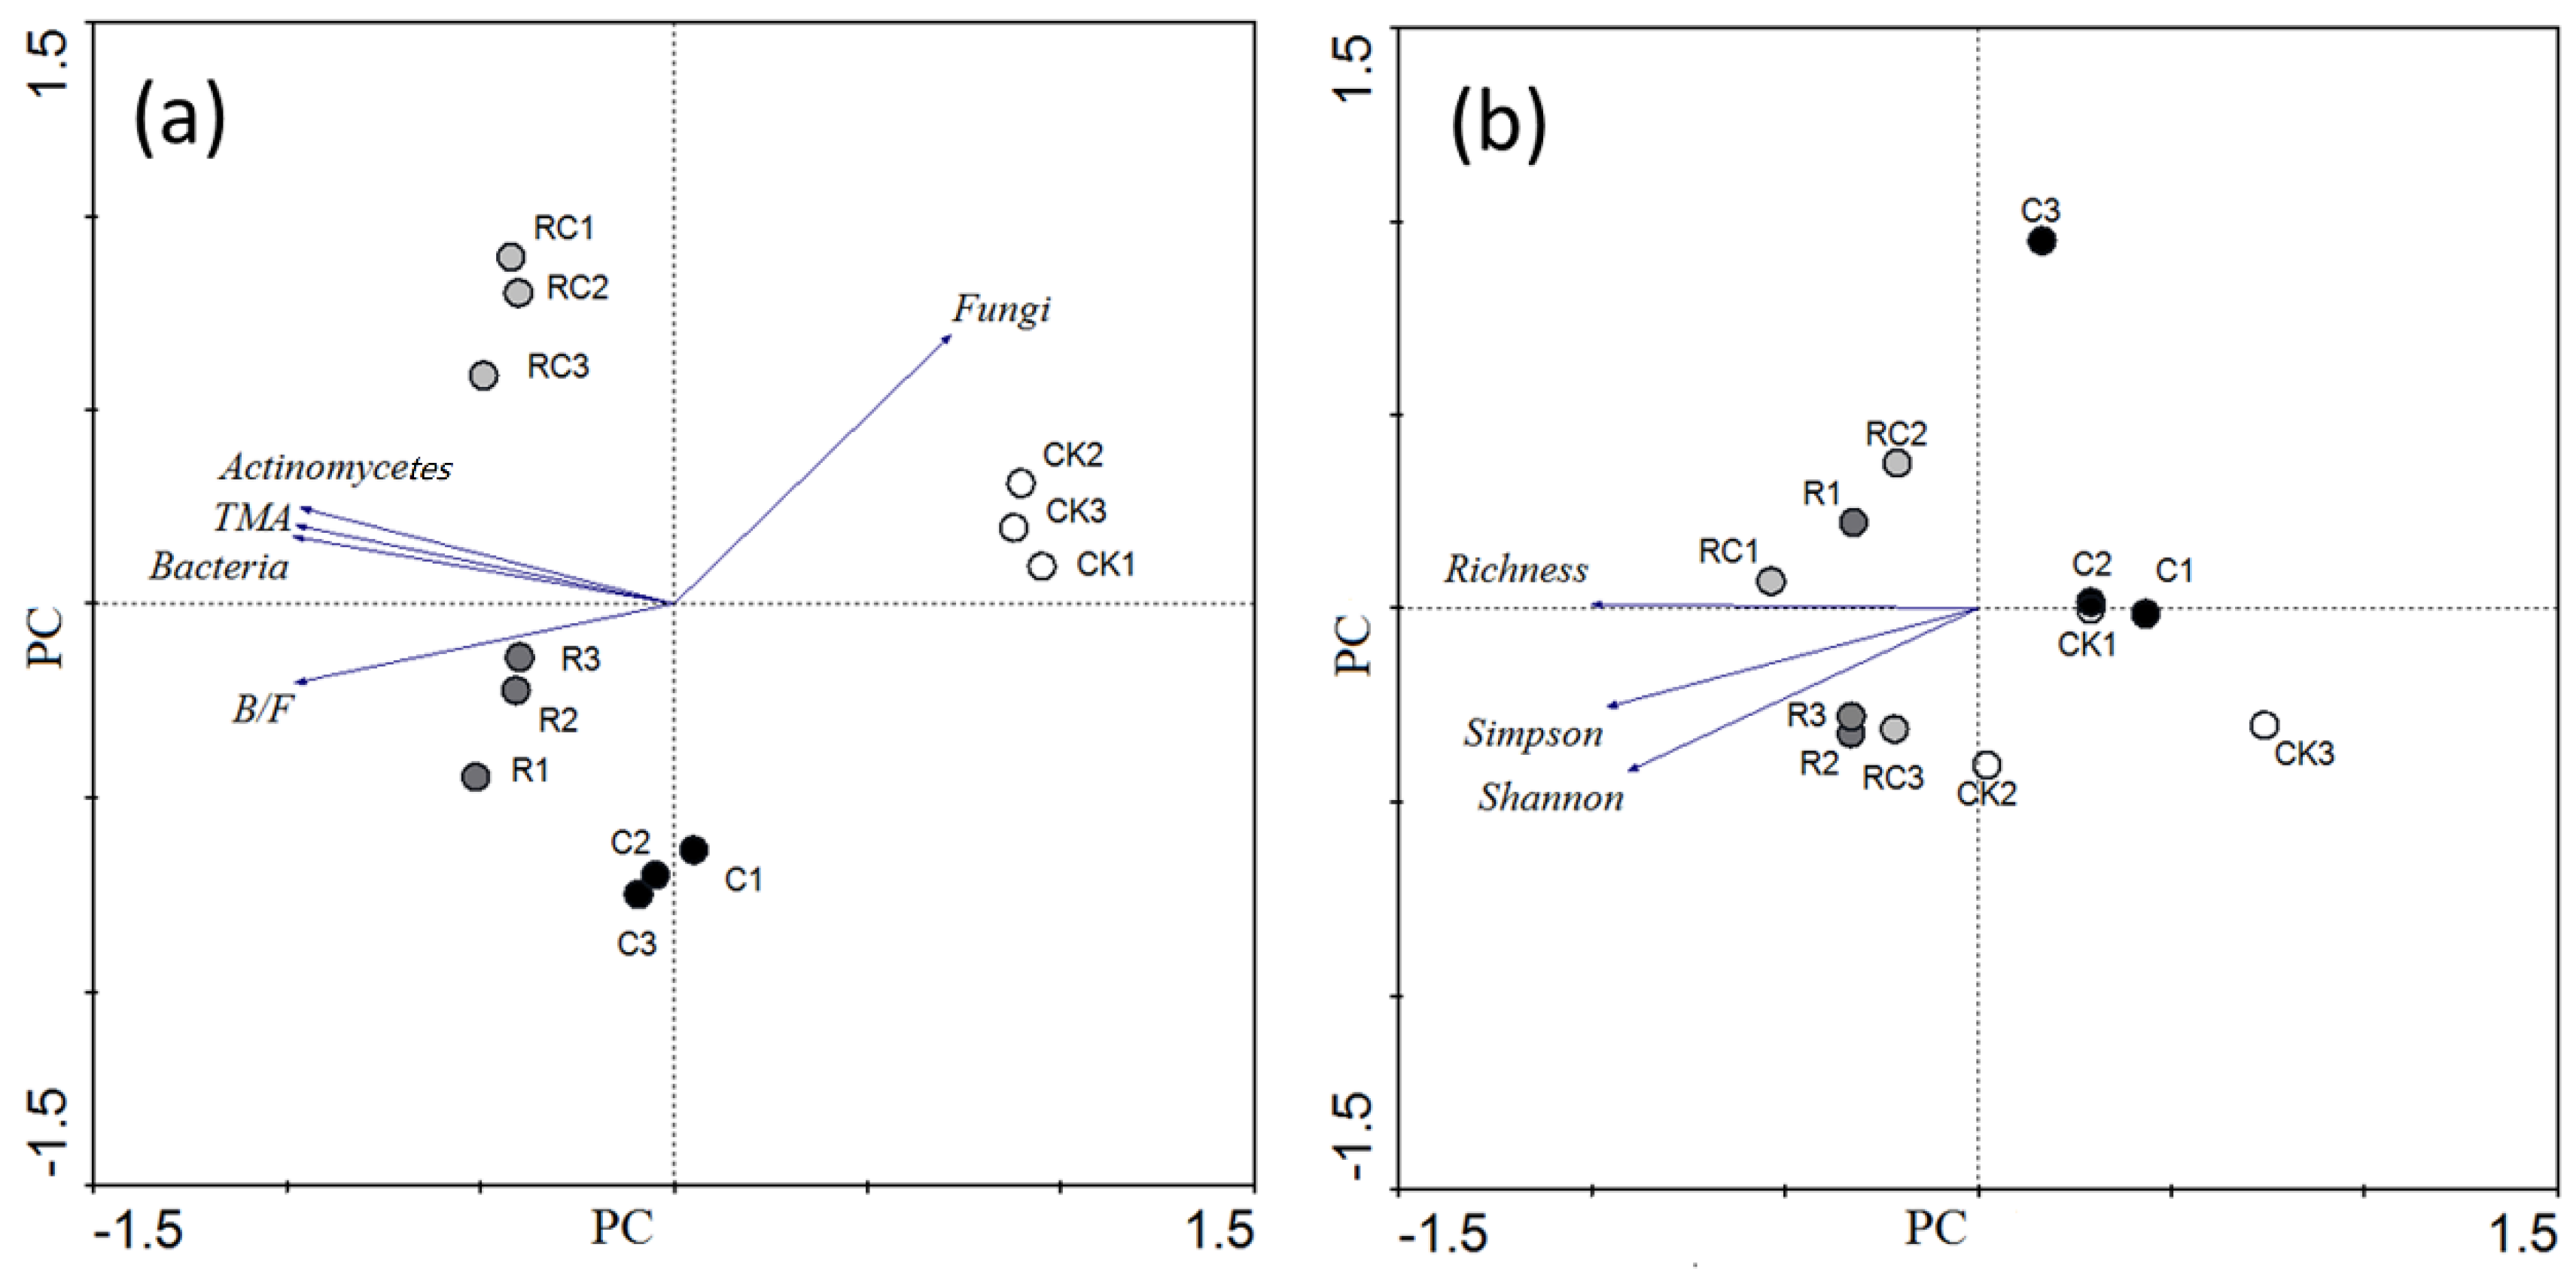
3.6. Relationships between Soil Microbial and Chemical Properties

According to the results of linear regression analysis, soil microbial diversity (richness, Shannon and Simpson indexes) were mainly determined by soil DOC (Table 5).

4. Discussion

The abundance and diversity of the microbial community greatly depends on the biotope soil pH and nutrient status [28,29,30]. The pH of brown earth soil (according to the Chinese Soil Taxonomy and here categorized as Hapli–Udic Cambisol according to the FAO Classification) is generally around 7.0 in this area. After 20 years of tomato continuous cropping, the pH of the studied soil decreased by approximately 1.0 pH unit (Table 1). Both rice straw and biochar addition increased soil pH in the present study (Figure 1a). The increase in soil pH under rice straw and biochar addition may be ascribed to their alkalinity content [31,32]. Xu et al. [33] reported that the net alkalinity (calculated as excess cations in straw) production in soil after the incorporation of plant residues contributed to the increase in soil pH, and the net alkalinity production increased with the decomposition of plant residue. Potassium is one of the most important base cations, at 6.3 g kg−1 in the rice straw used in our study (Table 2). The release of base cations, primarily K, after the decomposition of rice straw was the major reason for the soil pH increase (Figure 1c). Except for the loading of alkalinity, the adsorption of H+ and Al3+ in soil solution and exchangeable sites by biochar may decrease the acidity of soil [34].
Due to intensive application of chemical fertilizers during the last 20 years, the studied soil accumulated nutrients (Table 1). The mixed application of rice straw and biochar increased soil AN, AK, and AP (Figure 1b–d). A meta-analysis revealed that biochar addition alone decreases AN, whereas fertilization with organic fertilizers increases AN [35]. The increase in AN under RC treatment may result from stimulated N mineralization. Previous studies indicated that the N mineralization rate increased when biochar was applied with organic materials [36,37]. The increase in AP under RC and R treatment may be attributed to the change in soil pH and enhanced P mineralization by the increased microbial biomass (Figure 1d).
Soil organic carbon fractions are considered important indicators of soil quality because of their effects on soil physical, chemical, and biological properties [38,39,40,41]. In the present study, rice straw and biochar addition did not affect SOC content (Figure 2d), possibly because the treatment period was too short. SOC is insensitive to changes in soil management practices [42]. In this study, rice straw and biochar were only added for one year. However, labile organic C fractions (LOC), including ROC, FOC, and DOC, were greatly influenced by rice straw and biochar addition (Figure 2a–c). Rice straw addition may have increased LOC because the decomposition of rice straw leads to the release of dissolvable organic matter from the straw [17,43]. In contrast to rice straw, biochar contains minimal LOC, and most of its organic fractions are extremely refractory [44,45,46]. Therefore, the increase in LOC in the present study under C treatment cannot be attributed to the input of LOC from biochar. Previous studies have suggested that biochar addition usually stimulates the degradation of SOC [46] and attenuates DOC leaching [47]. These effects may explain why biochar addition increased soil LOC in our study.
The abundances of bacteria, actinomycetes, and total microbes and B/F increased more than two-fold under the application of rice straw and biochar, whereas the abundance of fungi decreased sharply (approximately 50% decrease), especially when rice straw or biochar was added alone (Figure 3 and Figure 5). In a solar greenhouse, a decrease in bacterial abundance and increased fungal abundance will result in the proliferation of soil-borne pathogens under continuous cropping systems [48,49]. After the seventh cropping cycle, the abundance of Fusarium (which is pathogenic toward a wide range of plants) as well as fungal community sizes significantly increased [4]. Thus, the addition of rice straw and biochar can alleviate both soil degradation and crop sickness under the present continuous cropping systems. However, based on soil microbial activities and diversities, rice straw was superior to the addition of biochar for the improvement of soil fertility in the present study. Greater soil microbial diversity has been considered a sign of “healthy” soil [50,51]. In our study, rice straw addition had positive effects on both soil microbial carbon metabolism and diversity, with similar effects of biochar alone or the rice straw and biochar interaction (Figure 4 and Figure 5, Table 3 and Table 4).
According to linear regression analysis, DOC was the factor that most profoundly affected soil microbial diversity in this study (Table 5). A study in a long-term grassland experimental site revealed that DOC is the key factor directly determining soil microbial diversity [52]. As a substrate of microbial metabolic processes, DOC is of great significance to microbial assimilation and dissimilation [52]. Although the microbial abundance may benefit from DOC, a higher content of DOC is required to increase soil microbial diversity. Under the mixed addition and biochar and sole addition of rice straw, DOC increased by approximately 40%, which can adequately explain the significant effect of rice straw addition on soil microbial activities and diversity. This priming effect of DOC on microbial carbon metabolism and diversity maybe a short-term phenomenon, because the positive effect of rice straw and biochar on DOC is often in the early stage after mixing with soil [43]. Thus, rice straw and biochar should be applied annually to obtain a sustaining effect.

5. Conclusions

In this study, we found that rice straw and biochar application can alleviate the acidification of continuously cropped soil, and increased the abundances of soil bacteria and actinomycetes while decreasing the fungal abundance. Although both rice straw and biochar applications increased soil DOC, rice straw, especially where it was applied with biochar, improved the activity and diversity of soil microbes as compared to biochar alone. This suggests that a mixed addition of rice straw and biochar is a better strategy to restore the degraded soil examined in this study.

Author Contributions

Y.Z. and T.L. conceived and designed the experiments; Y.Z. and Y.L. performed the experiments; Y.Z., G.Z. and X.G. analyzed the data; Z.S. contributed reagents/materials/analysis tools; Y.Z. wrote the paper.

Acknowledgments

We are grateful for the research grants from the National Natural Science Foundation of China (31372132), the Specialized Research Fund for the Doctoral Program of Chinese Higher Education (20132103110008), the Key Agricultural Program of Liaoning Province (2011215003), the Major Scientific Research Projects of Liaoning Province (Grant No.: 2014215011), and the Central Government for Popularizing Agricultural Science and Technology Projects (GCNT-LN-17).

Conflicts of Interest

The authors declare no conflict of interest.

References

  1. Panwar, N.L.; Kaushik, S.C.; Kothari, S. Solar greenhouse an option for renewable and sustainable farming. Renew. Sustain. Energy Rev. 2011, 15, 3934–3945. [Google Scholar] [CrossRef]
  2. Chai, L.L.; Ma, C.W.; Ni, J.Q. Performance evaluation of ground source heat pump system for greenhouse heating in northern China. Biosyst. Eng. 2012, 111, 107–117. [Google Scholar] [CrossRef]
  3. Han, J.P.; Shi, J.C.; Zeng, L.Z.; Xu, J.M.; Wu, L.S. Effects of nitrogen fertilization on the acidity and salinity of greenhouse soils. Environ. Sci. Pollut. Res. 2015, 22, 2976–2986. [Google Scholar] [CrossRef] [PubMed]
  4. Zhou, X.; Wu, F. Dynamics of the diversity of fungal and Fusarium communities during continuous cropping of cucumber in the greenhouse. FEMS Microbiol. Ecol. 2012, 80, 469–478. [Google Scholar] [CrossRef] [PubMed]
  5. Liang, Y.; Lin, X.; Yamada, S.; Zhou, M.; Inoue, M.; Inosako, K. Cucumber productivity and soil degradation in recropping system in greenhouse. Commun. Soil Sci. Plant Anal. 2012, 43, 1743–1748. [Google Scholar] [CrossRef]
  6. Myrold, D.D. Soil microbiology and biochemistry. BioScience 1989, 39, 819–820. [Google Scholar] [CrossRef]
  7. Hawkes, C.V.; Wren, I.F.; Herman, D.J.; Firestone, M.K. Plant invasion alters nitrogen cycling by modifying the soil nitrifying community. Ecol. Lett. 2005, 8, 976–985. [Google Scholar] [CrossRef]
  8. Rengel, Z. Genotypic differences in micronutrient use efficiency in crops. Commun. Soil Sci. Plant Anal. 2001, 32, 1163–1186. [Google Scholar] [CrossRef]
  9. Li, D.; Wu, Z.; Liang, C.; Chen, L. Characteristics and regulation of greenhouse soil environment. Chin. J. Ecol. 2004, 23, 192–197. [Google Scholar]
  10. Garnier, P.; Neel, C.; Aita, C.; Recous, S.; Lafolie, F.; Mary, B. Modelling carbon and nitrogen dynamics in a bare soil with and without straw incorporation. Eur. J. Soil Sci. 2003, 54, 555–568. [Google Scholar] [CrossRef]
  11. Pan, F.-F.; Yu, W.-T.; Ma, Q.; Zhou, H.; Jiang, C.-M.; Xu, Y.-G.; Ren, J.-F. Influence of 15N-labeled ammonium sulfate and straw on nitrogen retention and supply in different fertility soils. Biol. Fertil. Soils 2017, 53, 303–313. [Google Scholar] [CrossRef]
  12. Liu, C.; Lu, M.; Cui, J.; Li, B.; Fang, C. Effects of straw carbon input on carbon dynamics in agricultural soils: A meta-analysis. Glob. Chang. Biol. 2014, 20, 1366–1381. [Google Scholar] [CrossRef] [PubMed]
  13. Fließbach, A.; Mäder, P. Microbial biomass and size-density fractions differ between soils of organic and conventional agricultural systems. Soil Biol. Biochem. 2000, 32, 757–768. [Google Scholar] [CrossRef]
  14. Drenovsky, R.E.; Vo, D.; Graham, K.J.; Scow, K.M. Soil water content and organic carbon availability are major determinants of soil microbial community composition. Microb. Ecol. 2004, 48, 424–430. [Google Scholar] [CrossRef] [PubMed]
  15. Enami, Y.; Okano, S.; Yada, H.; Nakamura, Y. Influence of earthworm activity and rice straw application on the soil microbial community structure analyzed by PLFA pattern. Eur. J. Soil Biol. 2001, 37, 269–272. [Google Scholar] [CrossRef]
  16. García-Orenes, F.; Guerrero, C.; Roldán, A.; Mataix-Solera, J.; Cerdà, A.; Campoy, M.; Zornoza, R.; Bárcenas, G.; Caravaca, F. Soil microbial biomass and activity under different agricultural management systems in a semiarid Mediterranean agroecosystem. Soil Tillage Res. 2010, 109, 110–115. [Google Scholar] [CrossRef]
  17. Zavalloni, C.; Alberti, G.; Biasiol, S.; Vedove, G.D.; Fornasier, F.; Liu, J.; Peressotti, A. Microbial mineralization of biochar and wheat straw mixture in soil: A short-term study. Appl. Soil Ecol. 2011, 50, 45–51. [Google Scholar] [CrossRef]
  18. Moreno-Barriga, F.; Díaz, V.; Acosta, J.; Muñoz, M.; Faz, Á.; Zornoza, R. Organic matter dynamics, soil aggregation and microbial biomass and activity in Technosols created with metalliferous mine residues, biochar and marble waste. Geoderma 2017, 301, 19–29. [Google Scholar] [CrossRef]
  19. Wollum, A.G. Cultural methods for soil microorganisms. In Methods of Soil Analysis. Part 2. Chemical and Microbiological Properties; Black, C.A., Evans, D.D., White, J.L., Ensminger, L.E., Clark, F.E., Eds.; American Society of Agronomy: Madison, WI, USA, 1982; pp. 781–802. [Google Scholar]
  20. Dong, M.; Wang, Y.F.; Kong, F.Z.; Jiang, G.M.; Zhang, Z.B. Observation and Analysis of Terrestrial Biocommuities; Standard Press of China: Beijing, China, 1996. [Google Scholar]
  21. Lawley, R.A.; Campbell, R.; Newman, E.I. Composition of the bacterial flora of the rhizosphere of three grassland plants grown separately and in mixtures. Soil Biol. Biochem. 1983, 15, 605–607. [Google Scholar] [CrossRef]
  22. Martin, J.P. Use of acid, rose Bengal, and streptomycin in the plate method for estimating soil fungi. Soil Sci. 1950, 69, 215–232. [Google Scholar] [CrossRef]
  23. Cartwright, J.M. Average Well Color Development (AWCD) data based on Community Level Physiological Profiling (CLPP) of soil samples from 120 points locations within limestone cedar glades at Stones River National Battlefield near Murfreesboro, Tennessee. US Geol. Surv. Data Release 2015, 10. [Google Scholar] [CrossRef]
  24. Gul, S.; Whalen, J.K.; Thomas, B.W.; Sachdeva, V.; Deng, H. Physico-chemical properties and microbial responses in biochar-amended soils: Mechanisms and future directions. Agric. Ecosyst. Environ. 2015, 206, 46–59. [Google Scholar] [CrossRef]
  25. Olsen, S.R.; Sommers, L.E.; Evans, D.D.; White, J.L.; Ensminger, L.E.; Clark, F.E. (Eds.) Methods of Soil Analysis. Part 2. Chemical and Microbiological Properties; American Society of Agronomy: Madison, WI, USA, 1982; pp. 1035–1049. [Google Scholar]
  26. Rukun, L.U. Analysis Method of Soil Agricultural Chemistry; Agriculutural Science and Technology Press: Beijing, China, 1999. [Google Scholar]
  27. Strickland, T.; Sollins, P. Improved method for separating light-and heavy-fraction organic material from soil. Soil Sci. Soc. Am. J. 1987, 51, 1390–1393. [Google Scholar] [CrossRef]
  28. Sun, D.S.; Li, K.J.; Bi, Q.F.; Zhu, J.; Zhang, Q.C.; Jin, C.W.; Lu, L.L.; Lin, X.Y. Effects of organic amendment on soil aggregation and microbial community composition during drying-rewetting alternation. Sci. Total Environ. 2017, 574, 735–743. [Google Scholar] [CrossRef] [PubMed]
  29. Tao, J.M.; Liu, X.D.; Liang, Y.L.; Niu, J.J.; Xiao, Y.H.; Gu, Y.B.; Ma, L.Y.; Meng, D.L.; Zhang, Y.G.; Huang, W.K.; et al. Maize growth responses to soil microbes and soil properties after fertilization with different green manures. Appl. Microbiol. Biotechnol. 2017, 101, 1289–1299. [Google Scholar] [CrossRef] [PubMed]
  30. Wang, R.Z.; Dorodnikov, M.; Dijkstra, F.A.; Yang, S.; Xu, Z.W.; Li, H.; Jiang, Y. Sensitivities to nitrogen and water addition vary among microbial groups within soil aggregates in a semiarid grassland. Biol. Fertil. Soils 2017, 53, 129–140. [Google Scholar] [CrossRef]
  31. Sohi, S.P.; Krull, E.; Lopez-Capel, E.; Bol, R. A review of biochar and its use and function in soil. Adv. Agron. 2010, 105, 47–82. [Google Scholar]
  32. Verheijen, F.; Jeffery, S.; Bastos, A.C.; Van Der Velde, M.; Diafas, I. Biochar Application to Soils: A Critical Scientific Review of Effects on Soil Properties, Processes, and Functions; EUR. Scientific and Technical Research Series: Luxembourg, 2010. [Google Scholar]
  33. Xu, J.M.; Tang, C.; Chen, Z.L. The role of plant residues in pH change of acid soils differing in initial pH. Soil Biol. Biochem. 2006, 38, 709–719. [Google Scholar] [CrossRef]
  34. Syuhada, A.B.; Shamshuddin, J.; Fauziah, C.I.; Rosenani, A.B.; Arifin, A. Biochar as soil amendment: Impact on chemical properties and corn nutrient uptake in a Podzol. Can. J. Soil Sci. 2016, 96, 400–412. [Google Scholar] [CrossRef]
  35. Nguyen, T.T.N.; Xu, C.-Y.; Tahmasbian, I.; Che, R.; Xu, Z.; Zhou, X.; Wallace, H.M.; Bai, S.H. Effects of biochar on soil available inorganic nitrogen: A review and meta-analysis. Geoderma 2017, 288, 79–96. [Google Scholar] [CrossRef]
  36. Nocentini, C.; Guenet, B.; Di Mattia, E.; Certini, G.; Bardoux, G.; Rumpel, C. Charcoal mineralisation potential of microbial inocula from burned and unburned forest soil with and without substrate addition. Soil Biol. Biochem. 2010, 42, 1472–1478. [Google Scholar] [CrossRef]
  37. Luo, Y.; Durenkamp, M.; De Nobili, M.; Lin, Q.; Brookes, P. Short term soil priming effects and the mineralisation of biochar following its incorporation to soils of different pH. Soil Biol. Biochem. 2011, 43, 2304–2314. [Google Scholar] [CrossRef]
  38. Haynes, R.J. Labile organic matter fractions as central components of the quality of agricultural soils: An overview. Adv. Agron. 2005, 85, 221–268. [Google Scholar]
  39. Yan, D.; Wang, D.; Yang, L. Long-term effect of chemical fertilizer, straw, and manure on labile organic matter fractions in a paddy soil. Biol. Fertil. Soils 2007, 44, 93–101. [Google Scholar] [CrossRef]
  40. Benbi, D.K.; Brar, K.; Toor, A.S.; Sharma, S. Sensitivity of labile soil organic carbon pools to long-term fertilizer, straw and manure management in rice-wheat system. Pedosphere 2015, 25, 534–545. [Google Scholar] [CrossRef]
  41. He, Y.T.; Zhang, W.J.; Xu, M.G.; Tong, X.G.; Sun, F.X.; Wang, J.Z.; Huang, S.M.; Zhu, P.; He, X.H. Long-term combined chemical and manure fertilizations increase soil organic carbon and total nitrogen in aggregate fractions at three typical cropland soils in China. Sci. Total Environ. 2015, 532, 635–644. [Google Scholar] [CrossRef] [PubMed]
  42. Zhao, S.; Li, K.; Zhou, W.; Qiu, S.; Huang, S.; He, P. Changes in soil microbial community, enzyme activities and organic matter fractions under long-term straw return in north-central China. Agric. Ecosyst. Environ. 2016, 216, 82–88. [Google Scholar] [CrossRef]
  43. Wang, W.; Li, L.; Wu, K.; Zhang, K.; Jie, J.; Yang, Y. Preparation of Ni–Mo–S catalysts by hydrothermal method and their hydrodeoxygenation properties. Appl. Catal. A Gen. 2015, 495, 8–16. [Google Scholar] [CrossRef]
  44. Zimmerman, A.R. Abiotic and microbial oxidation of laboratory-produced black carbon (biochar). Environ. Sci. Technol. 2010, 44, 1295–1301. [Google Scholar] [CrossRef] [PubMed]
  45. Bruun, E.W.; Hauggaard-Nielsen, H.; Ibrahim, N.; Egsgaard, H.; Ambus, P.; Jensen, P.A.; Dam-Johansen, K. Influence of fast pyrolysis temperature on biochar labile fraction and short-term carbon loss in a loamy soil. Biomass Bioenergy 2011, 35, 1182–1189. [Google Scholar] [CrossRef]
  46. Cross, A.; Sohi, S.P. The priming potential of biochar products in relation to labile carbon contents and soil organic matter status. Soil Biol. Biochem. 2011, 43, 2127–2134. [Google Scholar] [CrossRef]
  47. Eykelbosh, A.J.; Johnson, M.S.; Couto, E.G. Biochar decreases dissolved organic carbon but not nitrate leaching in relation to vinasse application in a Brazilian sugarcane soil. J. Environ. Manag. 2015, 149, 9–16. [Google Scholar] [CrossRef] [PubMed]
  48. Feng, T.; Wang, Y.Y.; Zhang, Y.H.; Shi, X.H.; Qin, C.H.; Zhang, S.A.; Jin, S.C.; Zhang, H.; Zhang, J. Effects of wheat and soybean stubbles on soil sickness in continuous cropping of cucumber. Allelopath. J. 2016, 39, 43–53. [Google Scholar]
  49. Fu, H.; Zhang, G.; Zhang, F.; Sun, Z.; Geng, G.; Li, T. Effects of continuous tomato monoculture on soil microbial properties and enzyme activities in a solar greenhouse. Sustainability 2017, 9, 317. [Google Scholar] [CrossRef]
  50. Watts, D.B.; Torbert, H.A.; Feng, Y.C.; Prior, S.A. Soil microbial community dynamics as influenced by composted dairy manure, soil properties, and landscape position. Soil Sci. 2010, 175, 474–486. [Google Scholar] [CrossRef]
  51. Tautges, N.E.; Sullivan, T.S.; Reardon, C.L.; Burke, I.C. Soil microbial diversity and activity linked to crop yield and quality in a dryland organic wheat production system. Appl. Soil Ecol. 2016, 108, 258–268. [Google Scholar] [CrossRef]
  52. Li, H.; Yang, S.; Xu, Z.W.; Yan, Q.Y.; Li, X.B.; Van Nostrand, J.D.; He, Z.L.; Yao, F.; Han, X.G.; Zhou, J.Z.; et al. Responses of soil microbial functional genes to global changes are indirectly influenced by aboveground plant biomass variation. Soil Biol. Biochem. 2017, 104, 18–29. [Google Scholar] [CrossRef]
Figure 1. Soil pH (a), available N (b), available K (c) and available P (d) under mixed rice straw and biochar addition (RC), rice straw addition (R), biochar addition (C) and in control (CK) conditions. Values are the means of three replicates (± SE). Different letters indicate significant differences among the means of the different treatments.
Agronomy 08 00065 g001
Figure 2. Soil readily oxidizable organic carbon (ROC, (a)), light fraction organic carbon (LFOC, (b)), dissolved organic carbon (DOC, (c)), and soil organic carbon (SOC, (d)) under mixed rice straw and biochar addition (RC), rice straw addition (R), biochar addition (C), and control (CK) conditions. Values are the means of three replicates (± SE). Different letters indicate significant differences among the means of the different treatments.
Agronomy 08 00065 g002
Figure 3. Soil bacterial abundance (a), fungal abundance (b), actinomycete abundance (c), total microbial abundance (d), and the ratio of bacterial to fungal abundance (e) under mixed rice straw and biochar addition (RC), rice straw addition (R), biochar addition (C), and control (CK) conditions. Values are the means of three replicates (±SE). Different letters indicate significant differences among the means of the different treatments.
Agronomy 08 00065 g003
Figure 4. Changes in soil microbial community average well color development (AWCD) with incubation time under mixed rice straw and biochar addition (RC), rice straw addition (R), biochar addition (C), and control (CK) conditions. Values are the means of three replicates (±SE). R and C in the panel indicate significant rice straw and biochar effects, respectively. *, ** represent significance at p < 0.05 and p < 0.01 levels, respectively.
Agronomy 08 00065 g004
Figure 5. Principal component analysis (PCA) of (a) contributions of rice straw and biochar to the microbial abundance and (b) microbial diversity.
Agronomy 08 00065 g005
Table 1. Chemical properties of the studied soil.
pHEC µs cm−1SOM %Bulk Density g cm−3ANAPAKTNTPTKSandSiltClay
kg ha−1kg ha−1%
6.1379.23.31.26581.9542.816484.0 × 1039.3 × 1037.2 × 10447.5735.0617.36
Note: electrical conductivity (EC), soil organic matter (SOM), available nitrogen (AN), available phosphorus (AP), available potassium (AK), total nitrogen (TN), total phosphorus (TP), and total potassium (TK).
Table 2. Nutrient contents of the rice straw and biochar.
AmendmentsT NTP2O5T K2OTCTHTOpHEC µs/cm
g kg−1
Rice straw9.81.66.3604.852.7186.3--
Biochar2.530.781.68888.221.625.39.60190.0
Note: total nitrogen (TN), total P2O5 (TP2O5), and total K2O (TK2O), total carbon (TC), total hydrogen (TH), total oxygen (TO), electrical conductivity (EC).
Table 3. Effects of rice straw and biochar on soil microbial diversity.
TreatmentRichnessShannonSimpson
RC23 a3.17 a0.95 a
R23 a3.19 a0.95 a
C18 b3.00 b0.94 b
CK18 b3.04 b0.94 b
Note: mixed rice straw and biochar addition (RC), rice straw addition (R), biochar addition(C), and soil without rice straw and biochar addition (CK). Richness represents the evenness of microorganism, while the Shannon and Simpson indexes were used for microbial diversity. Values followed by the same lowercase letters are not significantly different at p < 0.05 levels (LSD, Least Significant Difference) in the same column.
Table 4. Results (F and p values) of two-way ANOVA of the effect of rice straw (R) and biochar (C) addition on soil microbial abundances and diversity.
Factors BacteriaFungiActinomycetesTMAB/FRichnessShannonSimpson
RF89417.4529129182.631.022.625.0
p0.0000.0030.0000.0000.0000.0010.0010.001
CF15020.21012284.340.0320.9860.177
p0.0000.0020.0000.0000.0710.8620.350.685
R*CF8.991823.755.9451.70.0320.1610.001
p0.0170.0000.0890.0410.0000.8620.6980.973
Note: TMA, total microbial abundance; B/F, ratio of bacteria to fungi.
Table 5. Summary of linear regression models for the effects of soil variables on microbial community diversity.
EquationVariableR2p
RichnessY = 0.674x + 6.650DOC0.5840.040
ShannonY = 0.018x + 2.721DOC0.4180.023
SimpsonY = 0.001x + 0.922DOC0.4930.011

