Genetic Diversity of Clinal Freezing Tolerance Variation in Winter Wheat Landraces
by
 and
and
Jinita Sthapit Kandel
1,2, 
Meng Huang
3,
Zhiwu Zhang
3, 
Daniel Z. Skinner
4 and
Deven R. See
1,4,* 1
Department of Plant Pathology, Washington State University, Pullman, WA 99164, USA
2
Crop Improvement and Protection Research Unit, USDA-ARS, Salinas, CA 93905, USA
3
Department of Crop and Soil Sciences, Washington State University, Pullman, WA 99164, USA
4
Wheat Health, Genetics, and Quality Research Unit, USDA-ARS and Washington State University, Pullman, WA 99164, USA
*
Author to whom correspondence should be addressed.
Agronomy 2018, 8(6), 95; https://doi.org/10.3390/agronomy8060095
Submission received: 6 May 2018
/
Revised: 9 June 2018
/
Accepted: 12 June 2018
/
Published: 14 June 2018
(This article belongs to the Special Issue Quantitative Trait Locus Mapping for Crop Plants)
Abstract
:Wheat (Triticum aestivum L.) is a major cereal crop grown across a wide range of environments, but its productivity around the world is challenged by various biotic and abiotic factors. Wheat landraces from around the world are a source of unexploited genetic diversity that can be essential for modern wheat-breeding programs in search of resistance to abiotic stresses like freezing tolerance. This genetic diversity study of 553 winter wheat landraces based on single-nucleotide polymorphisms (SNPs) revealed separate clusters of landraces related to the latitude of origin. Linkage block analysis revealed genomic regions with specific alleles skewed towards landraces from higher latitudes, suggesting that migration to higher latitudes resulted in the fixing of specific alleles. Electrolyte leakage was used to measure the tolerance of freezing to −14 °C, −16 °C, and −18 °C of 192 landraces. There was a significant negative correlation between latitude and electrolyte leakage, with an R2 value of 0.14, (p < 0.0001), in a regression analysis indicating greater freezing tolerance in landraces from higher latitudes. Genome-wide association studies identified regions in chromosomes 4A and 6A associated with higher latitudes and freezing tolerance, respectively. Landraces with freezing tolerance may be useful in developing new germplasm as novel sources of greater cold hardiness.
1. Introduction
Wheat, Triticum spp., is a major cereal crop that is grown across a wide range of environments covering more land than any other commercial crop in the world, mainly concentrated within the latitudes of 30 and 60° N and 27 and 40° S [1,2]. Cultivation of wheat started around 10,000 years ago in the Fertile Crescent during the Neolithic Revolution when the hunter–gatherer lifestyle transitioned into agriculture-based societies. Agriculture expanded further from the Fertile Crescent, and cultivated crops and domesticated animals spread together [3]. Movement to new climates accompanied by natural polyploidization led Triticum spp. to increase in genetic diversity and adapt to a wide range of environmental regimes [4]. The Karacadag region of southeast Turkey in the Fertile Crescent is regarded as the “core area” where several wild progenitors of various domesticated cereals and legumes appeared together. Archaeological evidence indicates that the core area was an active cultural center from which the culture along with crop domestication spread to other parts [3,5,6]. The first cultivated wheats were einkorn wheat and emmer wheat [7]. Natural stands of wild diploid einkorn (T. boeoticum) and wild tetraploid emmer (T. dicoccoides) are still found widely across the Fertile Crescent [8,9]. Phylogenetic analysis based on amplified fragment length polymorphism (AFLP) fingerprinting indicated that cultivated einkorn (T. monococcum) is closely related to wild einkorn wheat from the Karacadag Mountains, suggesting that the Karacadag region may have been the site for first domestication of einkorn wheat [8,10].
Domestication of tetraploid emmer wheat, which likely took place in the southeastern part of present-day Turkey, was an important event in the process of wheat evolution [9]. The emmer wheat was derived by natural hybridization of wild diploids, with the A genome contributed by Triticum urartu (2n = 14, AA) [11,12], and the B genome by a relative of Ae. speltoides (2n = 14, BB) [13]. Wild emmer has brittle ears that shatter at maturity and is different from the domesticated emmer wheat (T. dicoccum), which has a non-brittle rachis with hulled seeds [3]. During the Neolithic and early Bronze ages, emmer wheat was the principal crop in the Fertile Crescent [3,14]. Mutation events in hulled emmer led to the development of free-threshing tetraploid wheat T. turgidum L. [15,16], which is now cultivated widely around the world.
Common or bread wheat is an allohexaploid derived from the natural hybridization of the tetraploid wheat with the diploid goatgrass, Aegilops tauschii (2n = 14, DD) [17,18,19]. The evolution of hexaploid wheat began outside the Fertile Crescent around 9000 years ago, when tetraploids reached the range of Aegilops tauschii (DD) extending from Armenia to the coastal areas of the Caspian Sea [10,14,19]. Several events of natural hybridization may have contributed to the evolution of modern-day hexaploid wheat [20]. The first hexaploid wheat was similar to T. spelta (hexaploid, hulled wheat), which may have undergone hybridization with free-threshing tetraploids to give rise to free-threshing hexaploid forms [17]. The Q gene, located at the long arm of chromosome 5A, is responsible for the free-threshing character and is also pleotropic to other important traits of domestication including rachis fragility, shape and softening of glumes, spike length, and culm height [3,21,22]. The Q gene was an important factor in wheat evolution, leading to the rapid spread of free-threshing wheat worldwide [22].
Agriculture spread east–west rather than north–south as movement to the north or south requires clinal adaptation to different day lengths and climates that occur with the change in latitude [10,23]. The spread across central Europe, from Hungary to Belgium and eastern France, was particularly rapid [24]. While migrating to new uncolonized areas, people carried crops and farming knowledge with them. Establishment of techniques to adapt crops and livestock may have helped in the rapid spread of agriculture into new areas with cultivable lands [25]. In addition to suitable environment, cultural selection of specific crops among the communities may have played a role in the transfer of fewer sets of crops to the new cultivable areas from the earlier colonized areas [24]. Introduction of the crop plant to new environments and territories allows for the selection of new mutations that establish geographic races that are expected to display phenotypic variation, particularly across latitudes [26,27]. Solar radiation and temperatures decrease with the increase in latitude. With the movement of crop domestication towards the north, the crops were selected for cold hardiness in order to adapt to lower average temperatures and harsh winters at those latitudes [28,29].
Exotic germplasm, including wild species and wheat landraces from different parts of the world, are a potential source of unexploited genetic diversity that can be introduced into modern wheat breeding [30,31]. Genetic information on these germplasms can provide direct evidence for the adaptation of crops to climatic conditions and can shed light on the genomic basis that influenced the agricultural spread into different regions [23,32].
Wheat is grown at latitudes as high as 60° N, but many wheat cultivars suffer significant yield losses due to freezing injury and a lack of winter hardiness [33,34,35]. Genetic control of cold tolerance in wheat is a complex trait and quantitative trait loci (QTL) or chromosome regions associated with cold tolerance have been identified on chromosomes 1A, 1D, 2A, 2B, 3A, 5A, 5B, 6A, 6B, 6D, and 7B [36,37,38,39,40]. Perhaps the most significant chromosomal region impacting freezing tolerance is the Fr-A2 locus, a region of chromosome 5A that has been investigated many times [41,42,43,44,45,46]. This region contains many C-repeat Binding Factor (CBF) genes encoding transcription factors known to be instrumental in the regulation of many cold-responsive genes and may account for nearly 25% of the variation in freezing tolerance in some populations [46]. Other genes contributing to cold tolerance and overwintering ability are the genes controlling vernalization requirement (VRN) and photoperiod sensitivity (PPD). Vernalization requirement and the ability to acquire freezing tolerance are intricately associated [47], as are photoperiod sensitivity and the ability to express genes enabling low-temperature tolerance [48]. VRN genes are mapped to the long arms of homeologous group 5 chromosomes 5A, 5B, and 5D [49]. PPD-1 genes are located on the homeologous chromosomes group 2 [49] and are named PPD-A1, PPD-B1, and PPD-D1 [50] on 2A, 2B, and 2D, respectively.
Although many genomic regions associated with freezing tolerance have been identified and are being exploited in breeding programs, sufficient winter hardiness of available cultivars continues to be problematic [35]. Greater diversity of sources of cold-tolerant genotypes may contribute to further development of freezing tolerance and winter hardiness; wheat landraces from around the world are potential sources of this diversity. Therefore, the objective of this research were to assess genetic diversity of winter wheat landraces and to determine the genomic regions associated with the necessary adaptation to colder climates that occurred in wheat with migration from the Fertile Crescent to northerly latitudes.
2. Materials and Methods
SNP marker analysis of winter wheat landraces. The USDA-ARS National Small Grains Collection (NSGC), Aberdeen, ID, provided 553 winter wheat landraces (Table S1) for this study, collected from 31 countries with collection sites ranging from latitudes 27.5° N to 60° N and longitudes 9° W to 129.6° E. These landraces were included in a single-nucleotide polymorphic (SNP) genotyping experiment using the Illumina 9K wheat iSelect assay (http://www.illumina.com) conducted for the Triticeae Coordinated Agricultural Project (http://www.triticeaecap.org) by the USDA-ARS, Biosciences Research Lab, Fargo, North Dakota. The SNPs were based on expressed sequence tags (ESTs), and therefore originated in the transcribed regions of expressed genes. Data for 9000 SNP markers was obtained, but after filtering monomorphic and low-quality SNPs, and markers with minor allele frequencies (MAF) of less than 5%, data for 5476 informative SNP markers were retained and used for further analysis in this study.
Landrace accessions were divided into 10 groups based on latitude of origin. Principal coordinates analysis (PCoA) was performed using the covariance-standardized method based on distance matrix of the landraces in GenAlex 6.41 [51]. Population structure of 553 landraces was inferred using STRUCTURE software [52] version 2.3.3. For STRUCTURE analysis, in addition to 5% cutoff for missing data and MAF, only one marker from same position, based on 9K SNP consensus map [53], was included. Altogether 591 SNPs at an interval of 4 cM (centimorgans) were selected covering the whole wheat genome. An admixture model was used with correlated allele frequencies. The burn-in period was set at 50,000 and MCMC (Markov chain Monte Carlo) repetitions at 100,000. Analysis was replicated five times for each number of assumed clusters (K) from K = 1 to 10. The output data from STRUCTURE were assessed through STRUCTURE HARVESTER [54], where the best number of clusters (K) was determined by the Evanno method [55]. The data for the best K were run on program CLUMPP (CLUster Matching and Permutation Program [56]) to correctly align the clusters labeled from all five replications in STRUCTURE.
The landrace accessions were divided into two groups based on the latitude of origin (below and above 40° N latitude) and linkage block analysis was performed across the whole genome based on the consensus map of 9K SNPs [53]. Two groups were separated considering remarkable genetic variation between landraces below and above 40° N latitude conferred by PCoA analysis. Genotypic data (SNPs called A or B) for all the accessions were normalized based on a randomly selected accession (PI 351046). All of the SNP calls for PI 351046 were changed to “A” and calls for other genotypes were changed accordingly. Normalization helped with better visualization of the allelic variation in linkage blocks of the two groups.
SNP tags of interest were further investigated by identifying their physical location using the search functions in the Triticeae toolbox (https://triticeaetoolbox.org), then examining the corresponding annotation provided in the wheat genome assembly at Ensembl (http://archive.plants.ensembl.org/Triticum_aestivum/Info/Index). When necessary, further searching of the GenBank database (http://www.ncbi.nlm.nih.gov) was carried out using BLASTn tool.
Electrolyte leakage test for freezing tolerance. The electrolyte leakage method measures damage to the cell membrane by detecting leaked cell contents when cells are exposed to stress conditions such as freezing temperature [57]. Increased permeability of injured cells with ruptured cell membranes release cell contents at a greater rate in comparison to a healthy intact cell in water [57]. Thus, lower electrolyte leakage recorded after freezing treatment indicated that the tissue was more cold-tolerant. The electrolyte leakage method has been used since the 1930s for many experimental purposes, such as to estimate the hardiness of plants [58] and compare root and shoot injuries of woody plants due to frost [59]. Bajji et al. (2002) [60] used the electrolyte leakage technique with durum wheat as a predictive test to evaluate water stress tolerance, and Cuevas et al. (2015) [61] used electrolyte leakage to evaluate freezing tolerance of young wheat plants. From the 553 winter wheat landraces described above, 192 from 29 countries within the latitudes ranging from 27.5° N to 60° N were selected for electrolyte leakage analysis.
Plants were grown in Sunshine Mix LC1 planting medium (Sun Gro Horticulture, Bellevue, WA, USA) in six-container packs (Model 1020, Blackmore Co., Belleville, MI, USA). Each of the six containers in each pack was planted with 20 seeds of one of the wheat lines to be tested. Seeds were germinated and plants were grown at 22 °C in a growth chamber (Model E15, Conviron, Pembina, ND, USA) under cool, white fluorescent lights (about 300 µmol m−2 s−1 at the soil surface) with a 16-h photoperiod until the seedlings reached the three-leaf stage. The plants were then transferred to 4 °C with a 16 h photoperiod (about 250 µmol m−2 s−1 at mid-plant height) for five weeks to induce cold acclimation prior to freezing/electrolyte leakage tests.
In preparation for the tests, the plants and planting medium from one cell were removed from the cell packs and immediately submerged in ice water. The soil was rinsed from the plants to expose the crowns of the plants, the plants were clipped just below the crowns, removing the roots, residual caryopses were removed, and the shoots of the plants were removed at the top of the lowermost leaf sheath, resulting in about 5 cm of crown and “stem” region of the plants remaining. These plants were briefly placed in ice water to rinse away cellular fluid from the cut surfaces; they were blotted dry and individual plants were placed in 15 mL polypropylene, screw-cap tubes and immediately placed on ice. Each of the 192 wheat lines tested was represented by three plants in each test.
The tubes containing the plants were placed in racks that were transferred from the ice to a Microclimate® benchtop environmental chamber (Cincinnatti SubZero, Cincinnatti, OH, USA) at 0 °C. The temperature was lowered to the target temperature (−14, −16, or −18 °C) at a rate of 2 °C h−1. The temperature in the chamber was monitored using thermistor probes and a Hydra Data Bucket temperature monitor (Fluke Inc, Everett, WA, USA). When the temperature had been maintained at the target temperature for 1 h, the tubes containing the plants were removed and immediately plunged into crushed ice. The tubes were held on ice for 30–60 min. to allow the temperature of the plants to slowly return to 0 °C, then 5 mL of ultrapure water were added to each tube and tubes were incubated at room temperature with shaking at 80 rpm for 12 h. The conductivity of the solution was then measured using a benchtop conductivity meter (Hanna Instruments, Woonsocket, RI, USA, Model HI216). The tubes were then immersed in liquid nitrogen until frozen solid and then allowed to thaw and return to room temperature. The conductivity of the solution was again measured and cell damage was estimated as the ratio of the conductivity of the solution before freezing in liquid nitrogen, relative to the conductivity of the solution after freezing in liquid nitrogen (complete cellular disruption).
The entire experiment was repeated and the electrolyte leakage data were analyzed with PROC GLM and PROC REG available in SAS (Statistical Analysis System, Cary, NC, USA). The damage estimates (proportion of total cellular leakage) were arcsin-square root transformed for analysis purposes, but are shown in the original scale in this report. Least-square means were compared using the pdiff option of PROC GLM. Geographic distribution of relative freezing tolerance was visualized using spline regression and the background world map option available in JMP software (http://www.jmp.com).
Genome-wide association analysis. Genome-wide association studies (GWAS) was performed by using FarmCPU package [62]. GWAS were conducted in two phases. The first phase was to identify the genetic loci associated with population structure (based on principal component PC1, calculated in R software) and latitude in 553 landraces. The second phase used two genetic loci associated with population structure and one locus associated with latitude as covariates, and freezing tolerance (measured as electrolyte leakage) as observations in 192 landraces. For each landrace, the electrolyte leakage scores for all replications at all three temperatures were averaged and analyzed for GWAS. The threshold p-value for significant marker-trait association was based on a Bonferroni-corrected threshold with 0.01.
3. Results
3.1. Genetic Diversity of Winter Wheat Landraces Based on SNPs
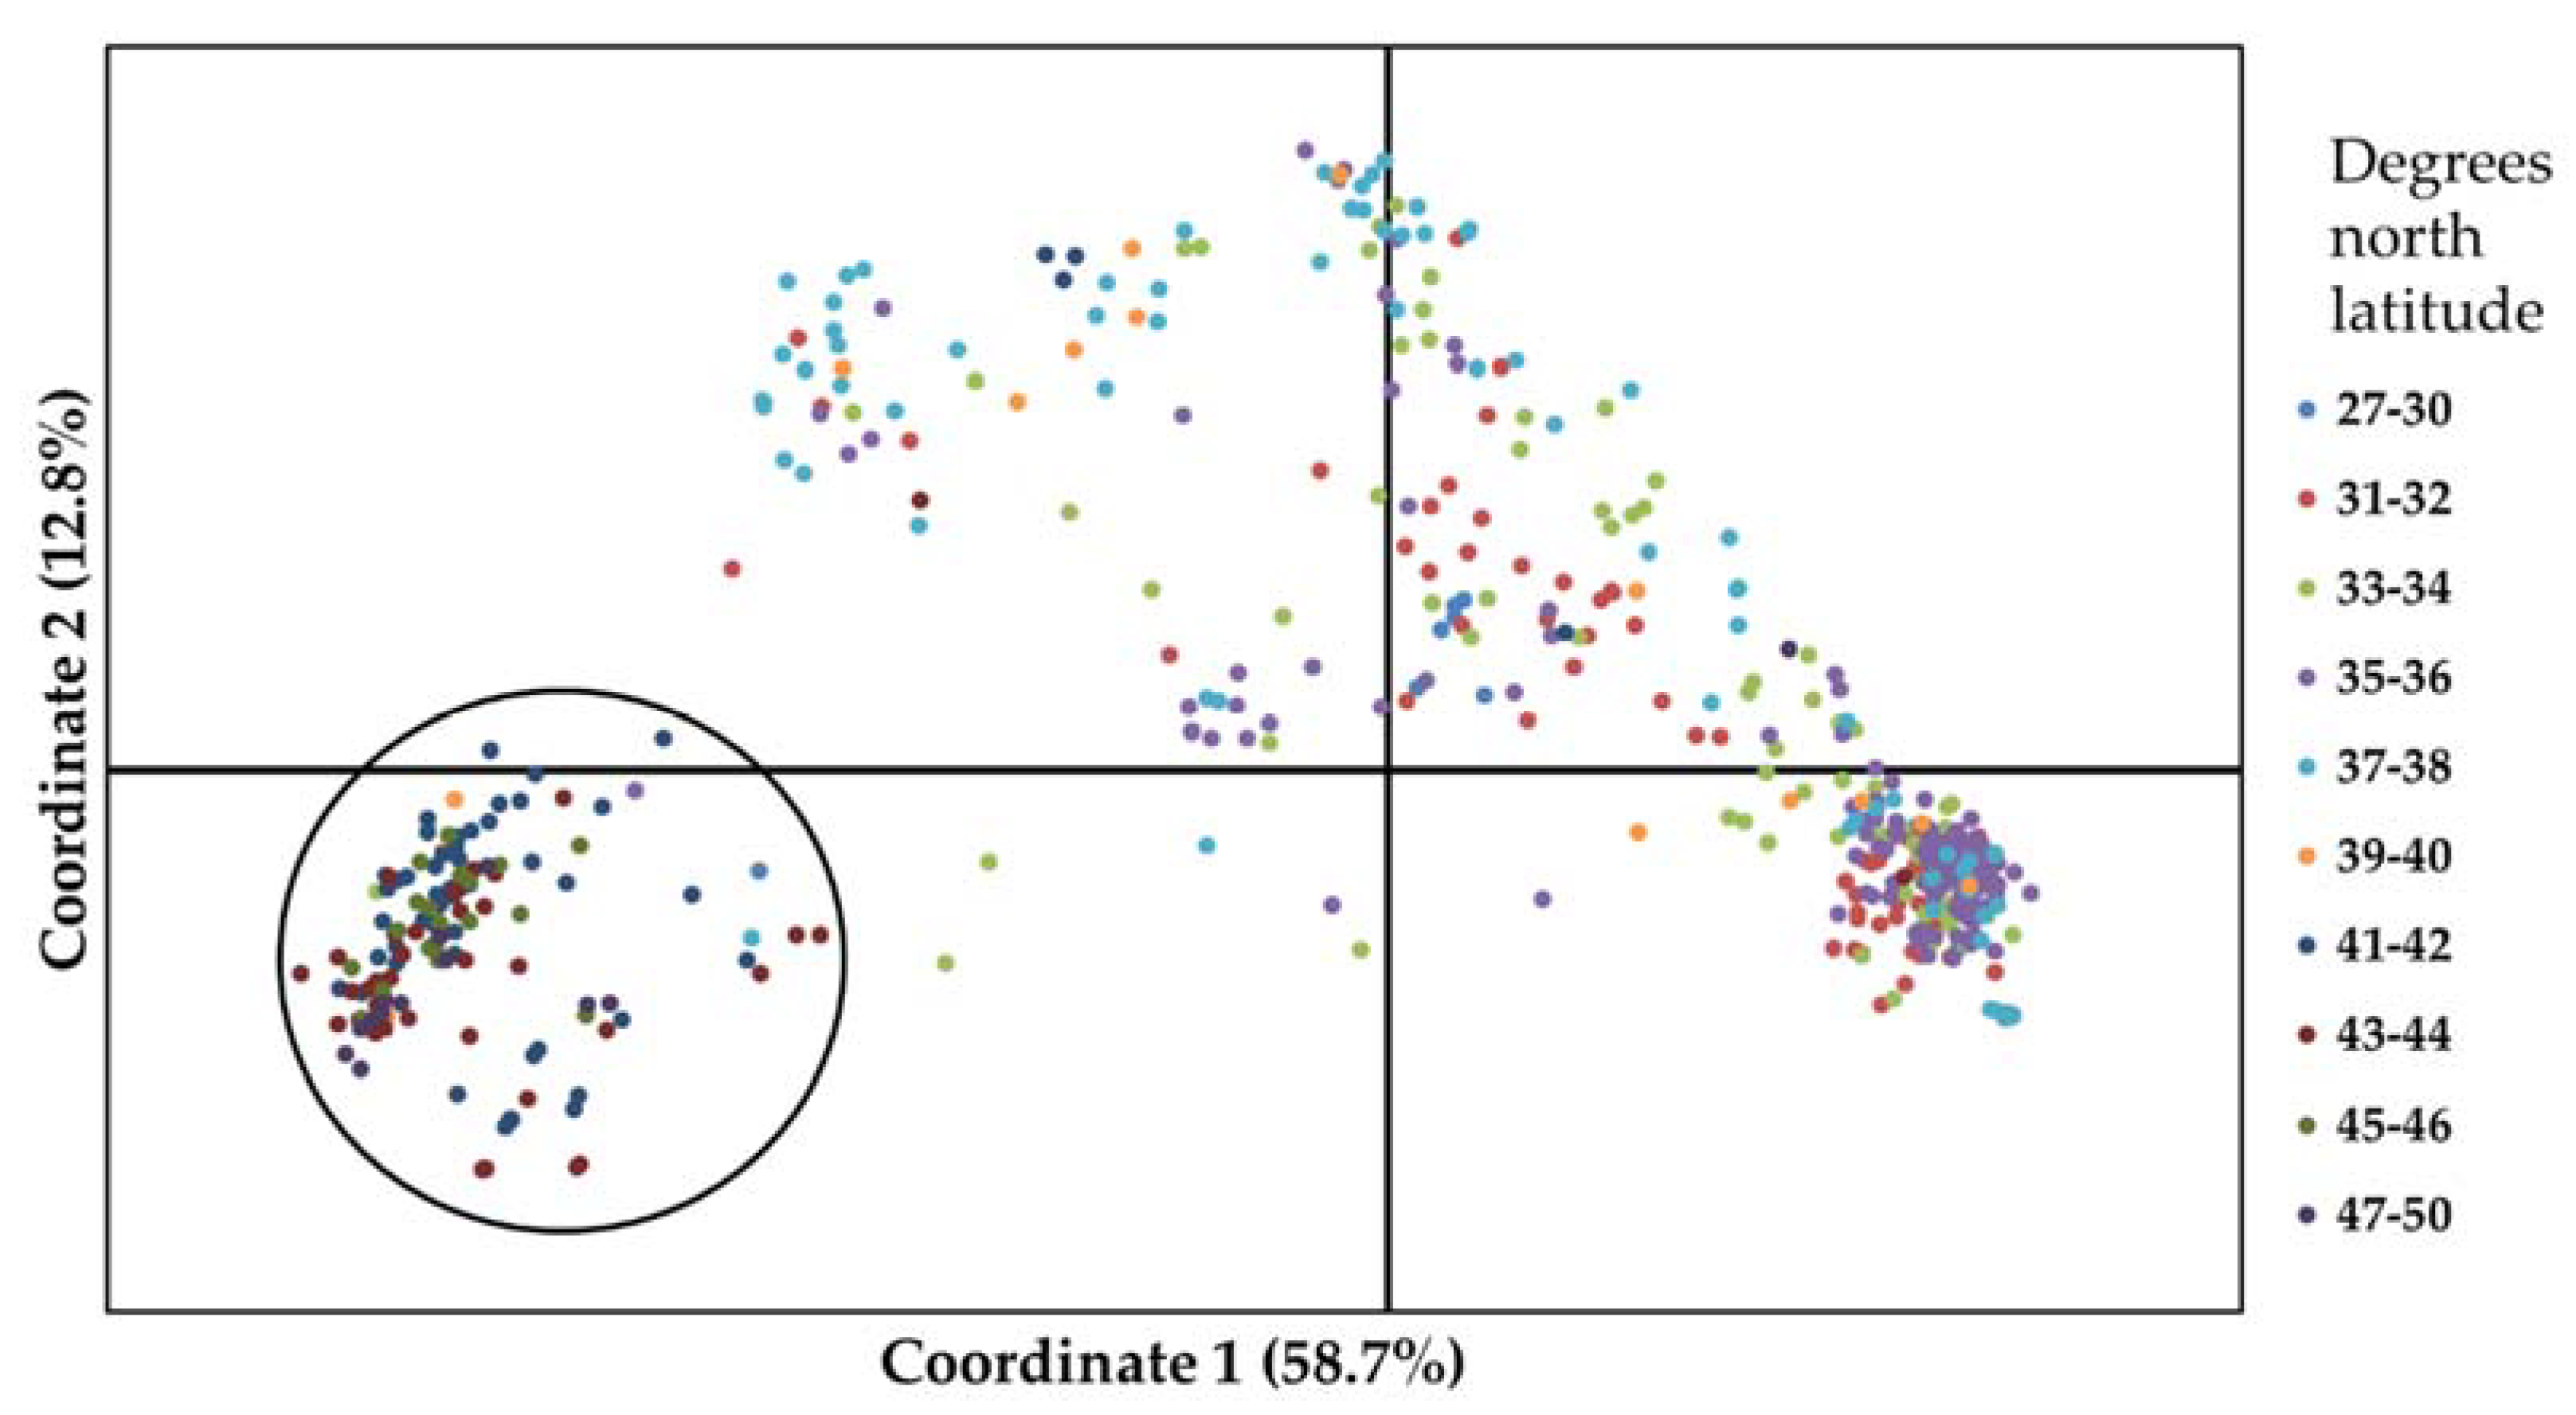
In the PCoA of 553 winter wheat landraces based on 5476 SNPs, the first and second axes of the PCoA accounted for 58.67% and 12.83% of the total genetic variation of landraces, respectively (Figure 1). When landraces were labeled according to the region of origin the landraces from Western Asia formed a dense group at the lower right quadrant and spread across upper right and left quadrants (Figure 1). East and South Asian landraces clustered within the West Asian spread. All the European landraces were in a distinct cluster at the lower left quadrant except for a few East and South European landraces. Interestingly, when the landraces were labeled based on ranges of latitudes of their origin, it became apparent that there was a separate cluster containing nearly all of the landraces from latitudes higher than 40° N at the lower left quadrant (circled on Figure 1) distinct from all the other landraces from latitudes lower than 40° N. Population structure analysis on 553 winter wheat landraces revealed the best K = 2 based on the delta-K method. The majority of the landraces from lower latitudes (<40° N) grouped together in one cluster and landraces from higher latitudes (>40° N) grouped into another (Figure S1).
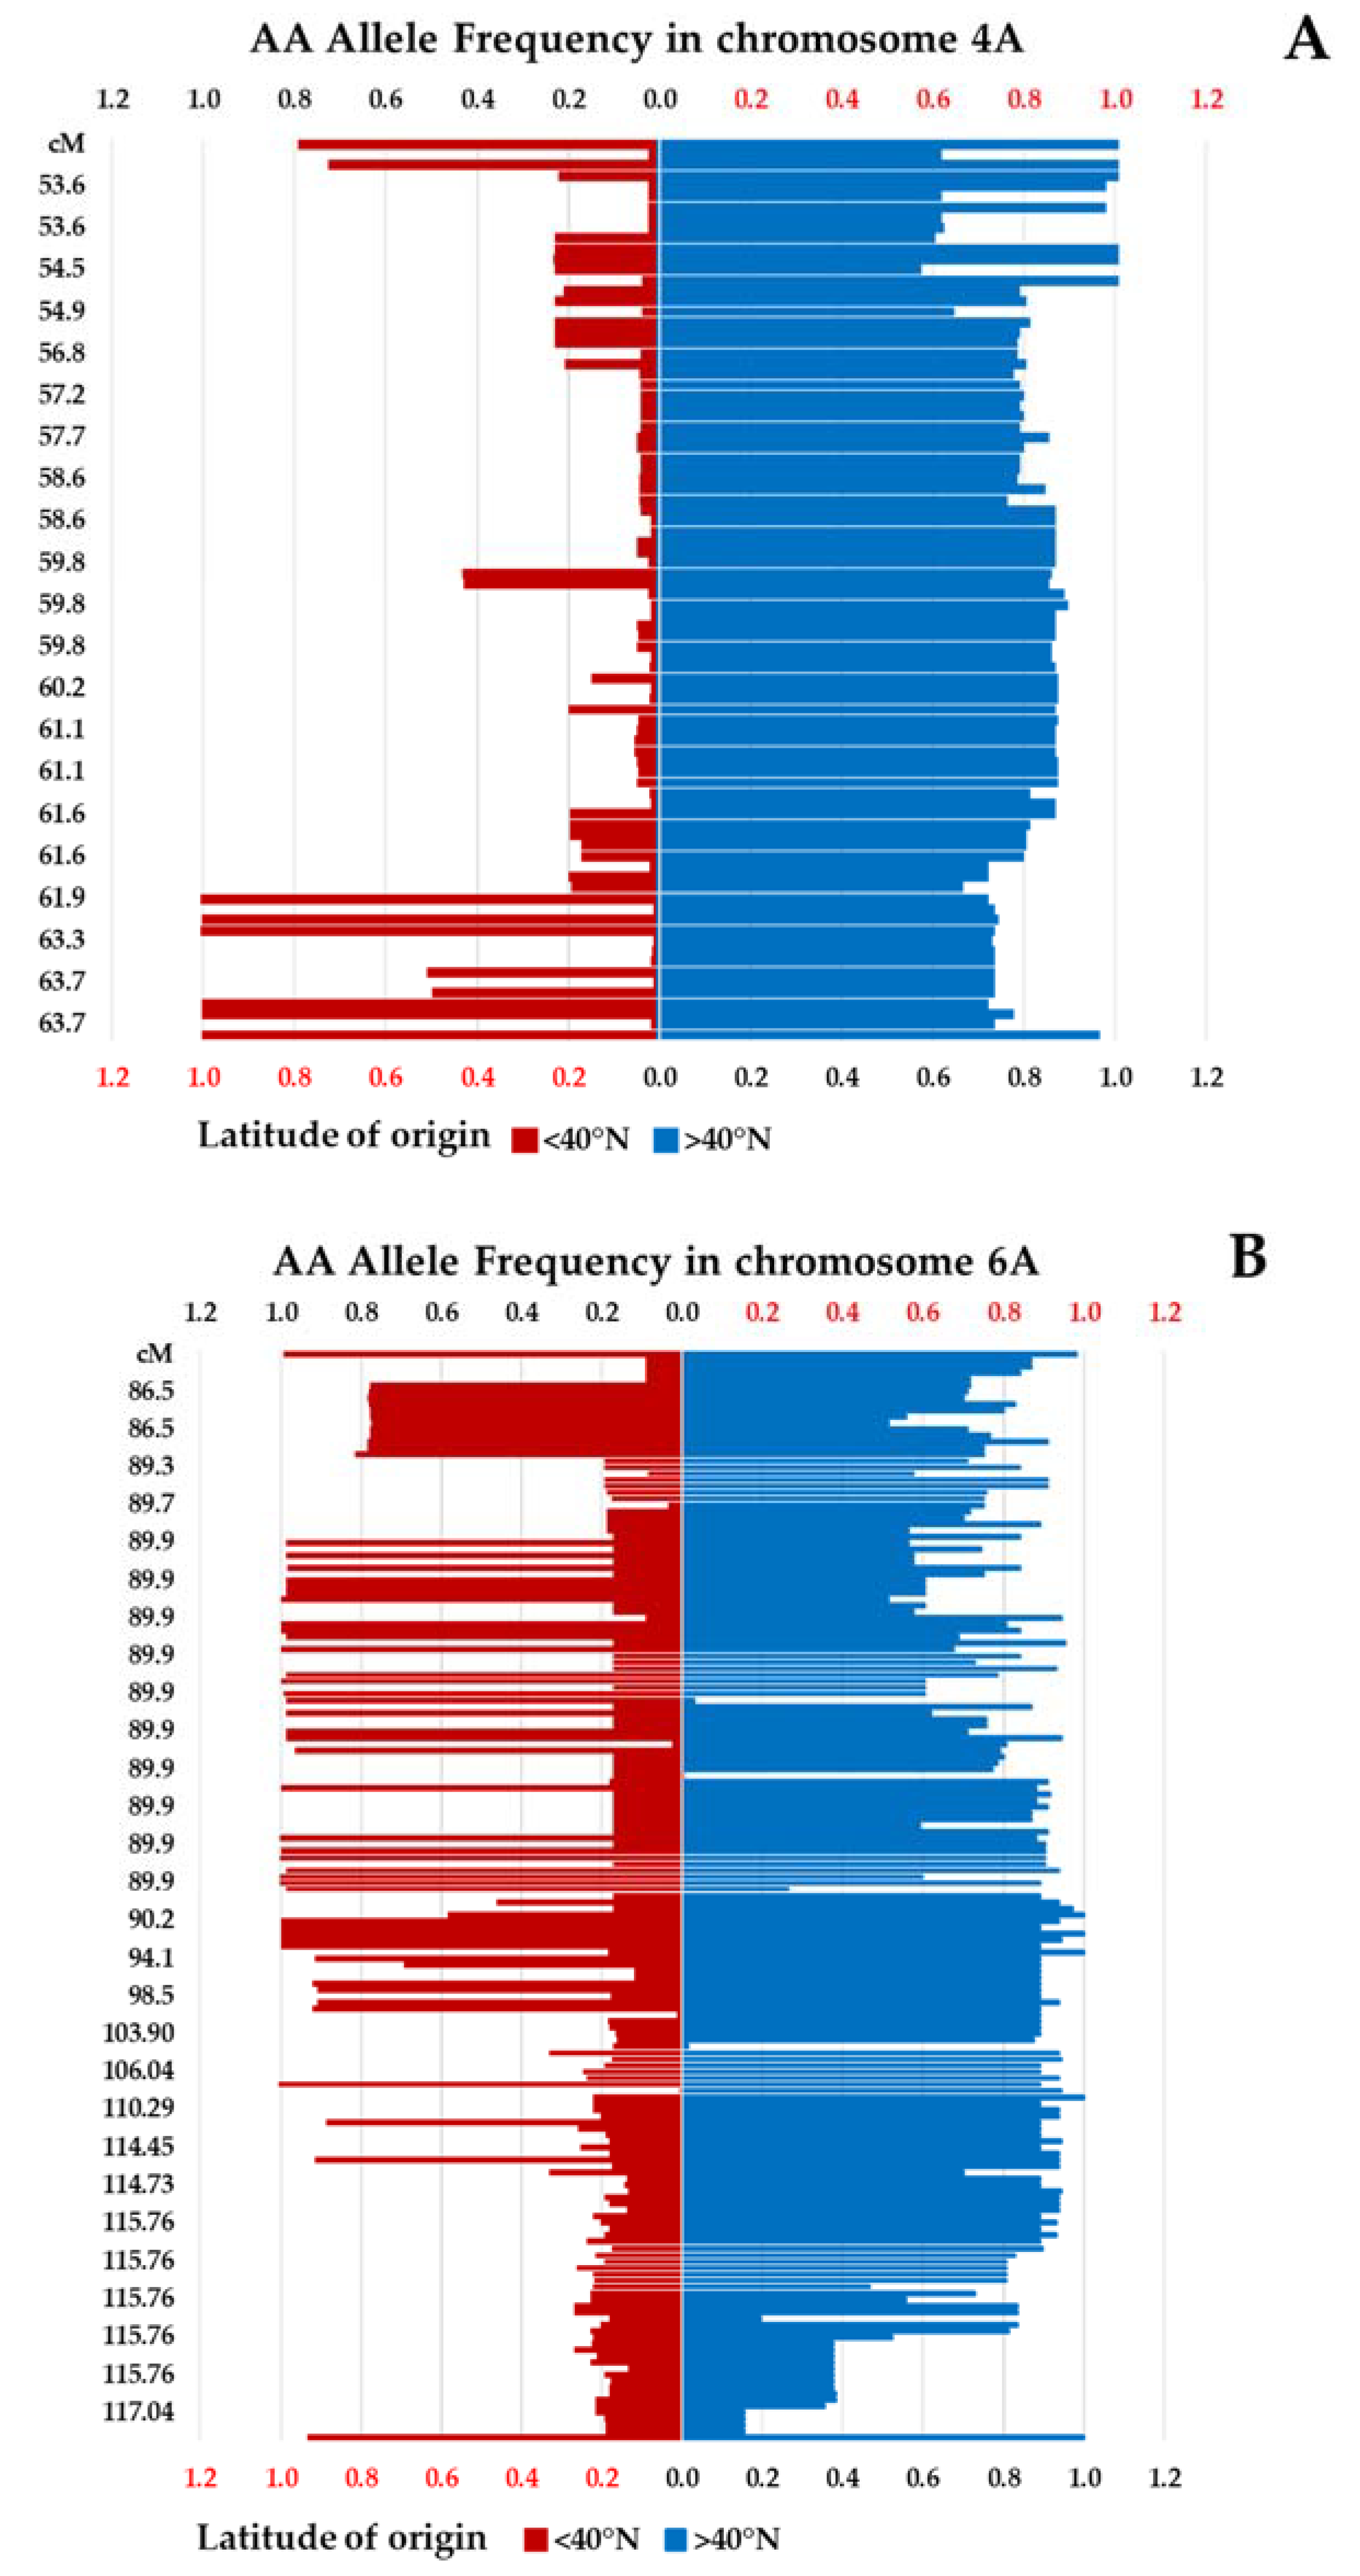
Histograms for allele frequencies for all of the SNPs considering two groups of winter wheat landraces (from below or above 40° N latitude) revealed linkage blocks with allele frequencies highly skewed towards one of the groups, suggesting them to be from genomic regions that differentiated with movement towards the north. These genomic regions included linkage blocks from chromosomes 2A, 4A, 5B, and 6A. In chromosome 2A, the majority of SNPs between 116 cM to 125 cM had ≥80% of ‘A’ allele in landraces from higher latitudes and ≤20% of ‘A’ allele in landraces from lower latitudes. Similarly, 53 cM to 62 cM in chromosome 4A, 58 cM to 60 cM in chromosome 5B, and at 89 cM in 6A, and 103 cM to 117 cM in chromosome 6A had ≥80% of ‘A’ allele in landraces from higher latitudes and ≤20% of ‘A’ allele in landraces from lower latitudes. Examples are shown in Figure 2.
Genome-wide association studies based on 5476 SNPs identified SNPs associated with population structure and latitudes. Several SNP markers from all chromosomes showed association with population structure, most strongly, SNP IWA3431 from chromosome 2A and IWA6597 from 4A. Further information on these SNP tags including possible gene identification of the corresponding transcripts is provided in Table 1.
SNP tag IWA7271 from chromosome 4A was strongly associated with latitude (p < 10−50, Table 1). The wheat genome assembly at Ensembl revealed that SNP IWA7271 is from within an exon of a gene designated as Traes_4AS_1658FFBB2.1, consisting of five exons and three introns. The five exons were manually assembled into a continuous sequence and used to query the GenBank database using the nucleotide BLAST function. The result indicated the DNA transcript sequence containing SNP tag IWA7271 is 70% identical over 2957 base pairs (Expect value = 0.0) to a gene identified from Zea mays encoding a subunit of phosphatidylinositol N-acetyglucosaminyltransferase (Sequence ID: XM_008660105.2). The translated protein product of Traes_4AS_1658FFBB2.1 also matched the Zea mays amino acid sequence of the phosphatidylinositol N-acetyglucosaminlytransferase gene, accession AQL07576, with an Expect value of 0.0 (using protein BLAST). These observations suggest that SNP tag IWA7271 occurred within a gene that may be involved in cell membrane function and glycolipid biosynthesis.
3.2. Electrolyte Leakage Test
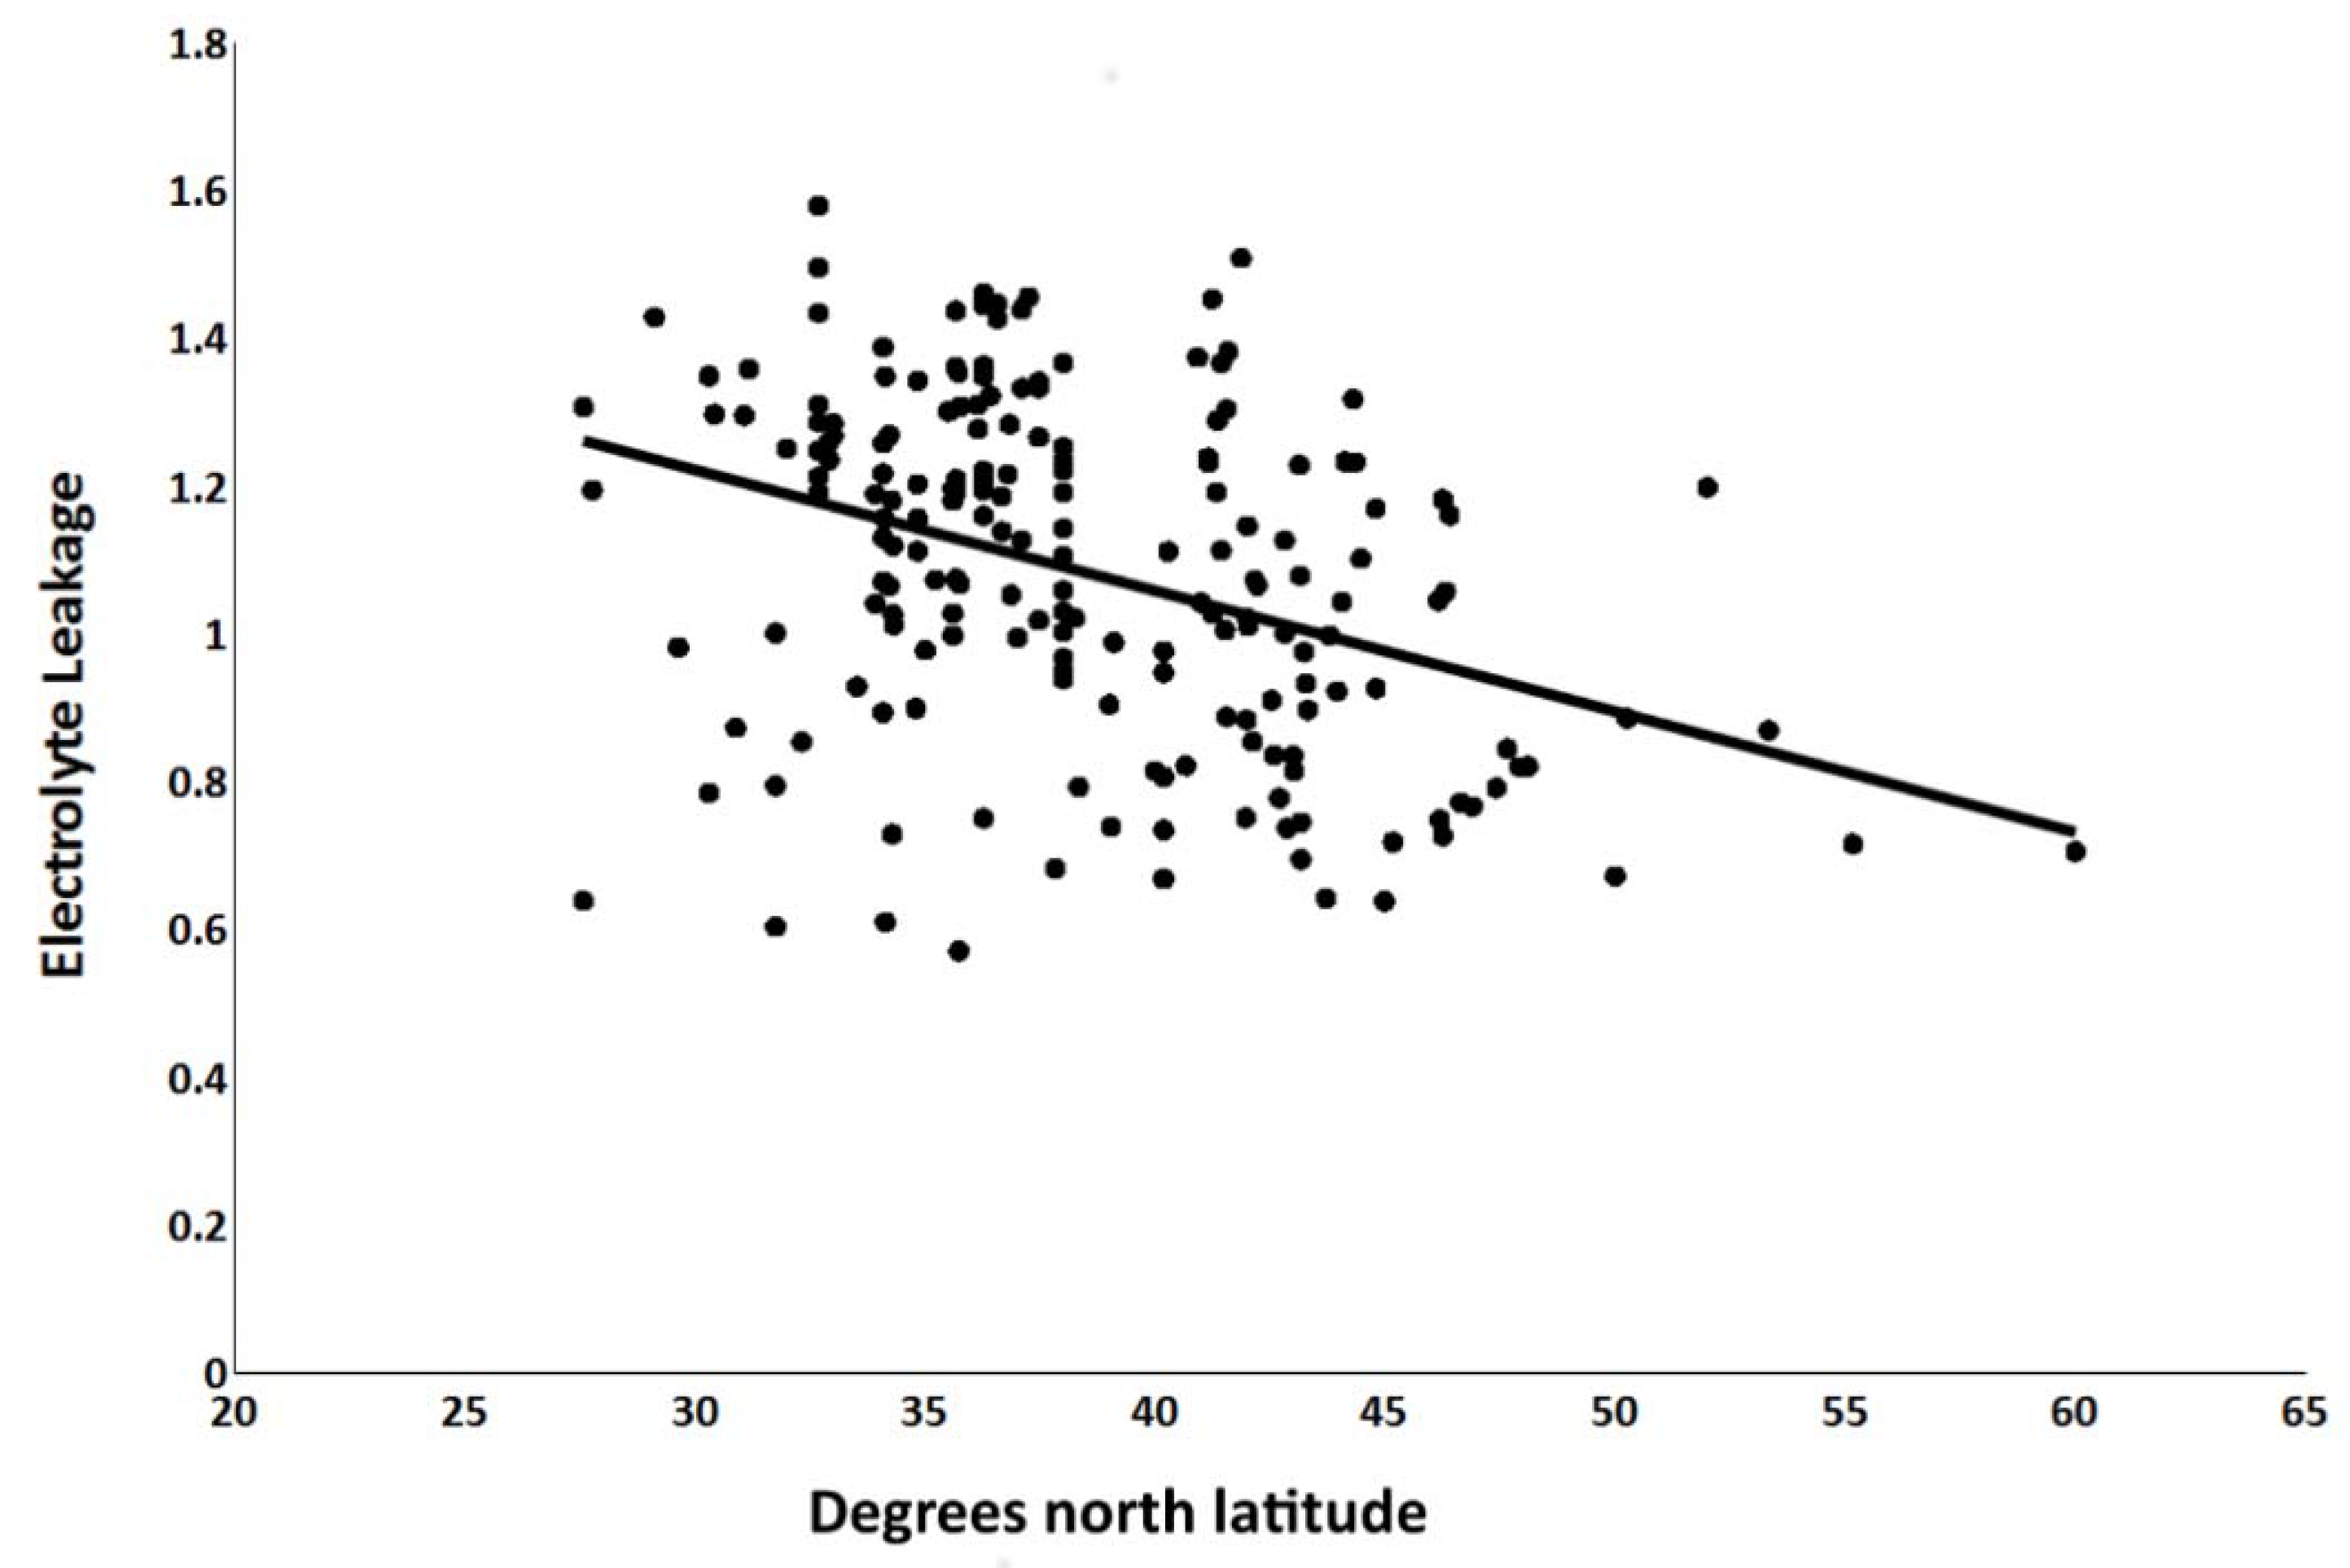
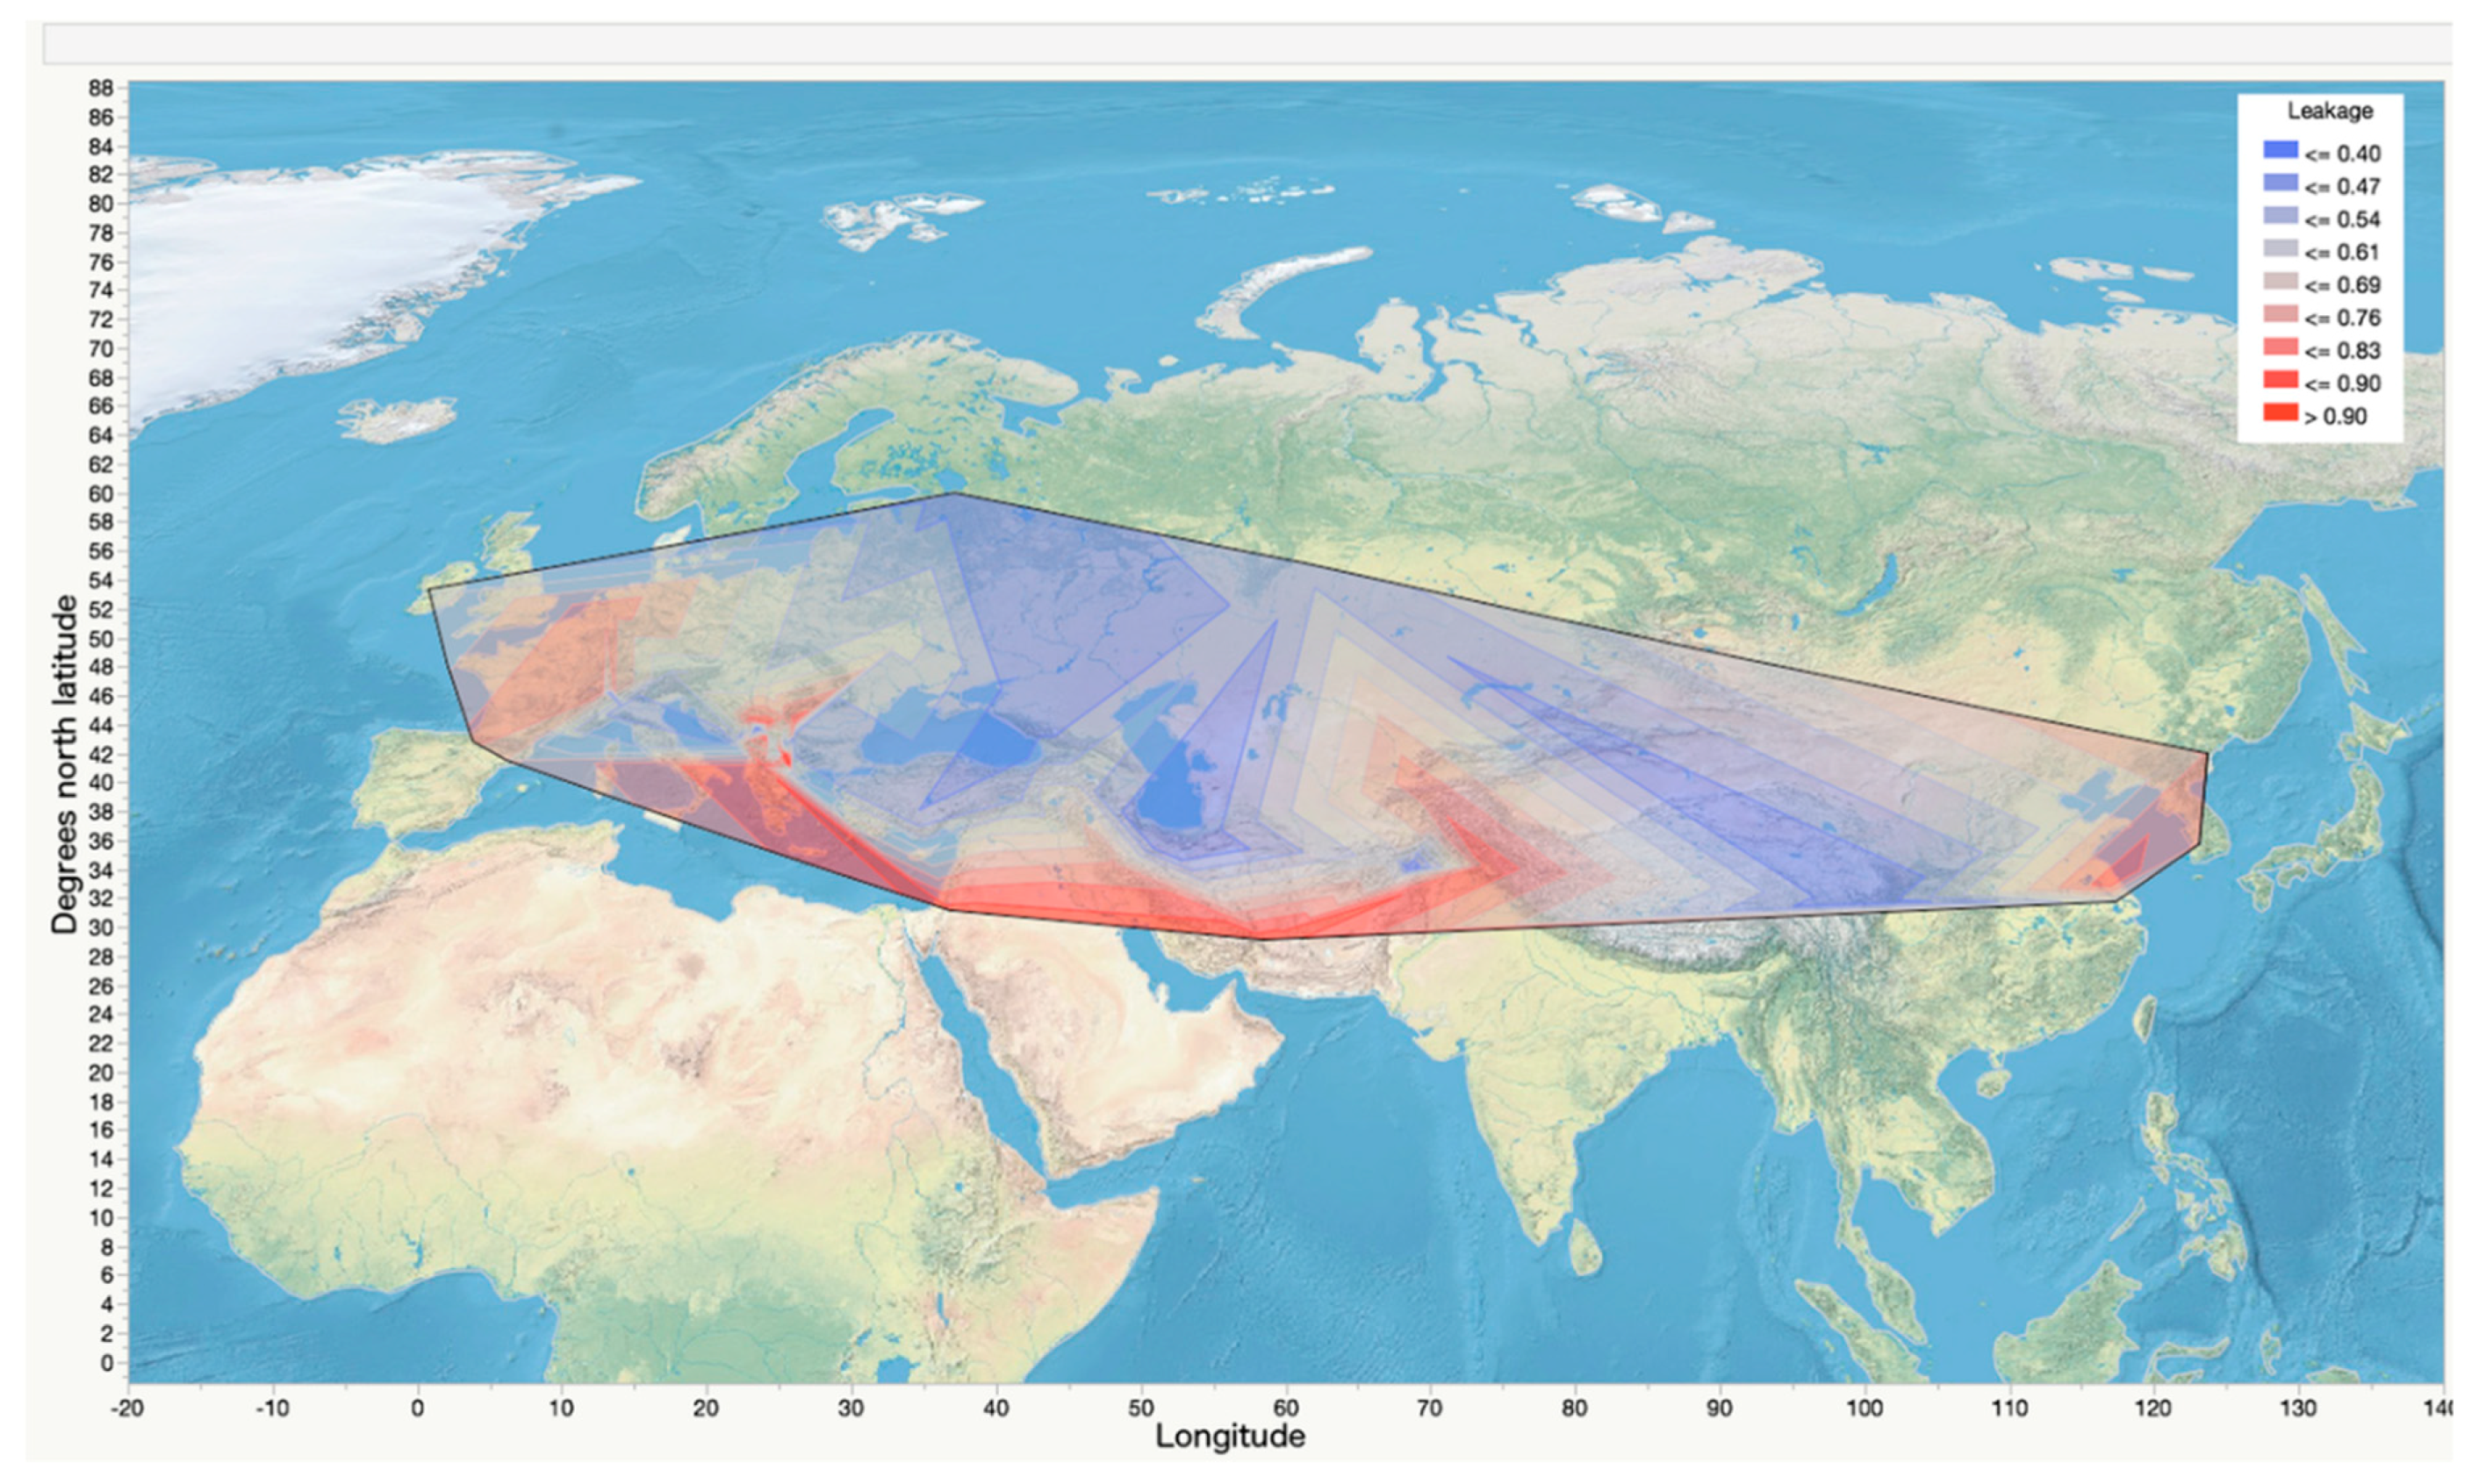
The mean electrolyte leakage, expressed as the conductivity following the freezing test as a proportion of conductivity after freezing in liquid nitrogen, was 0.63 at −14 °C, 0.74 at −16 °C, and 0.78 at −18 °C. The analysis of variance indicated that 53% of the variation in the electrolyte leakage measurements can by ascribed to the latitude from which the wheat landraces were collected (Table 2). The freezing challenge temperature the plants were exposed to accounted for 41% of the variation; replications and subsamples accounted for 6% (Table 2). Even at the lowest treatment temperature of −18 °C, there were landraces with electrolyte leakage measures of 0.3 to 0.5, suggesting those landraces may be highly cold-tolerant (Figure S2). The regression analysis based on all of the data indicated a highly significant negative relationship of latitude and electrolyte leakage with an R2 value of 0.14, (p < 0.0001), indicating a general trend toward less damage (greater cold tolerance) in landraces from higher latitudes (Figure 3). A contour plot of electrolyte leakage superimposed on the world map clearly showed a relationship of greater freezing tolerance with increased latitude of origin (Figure 4).
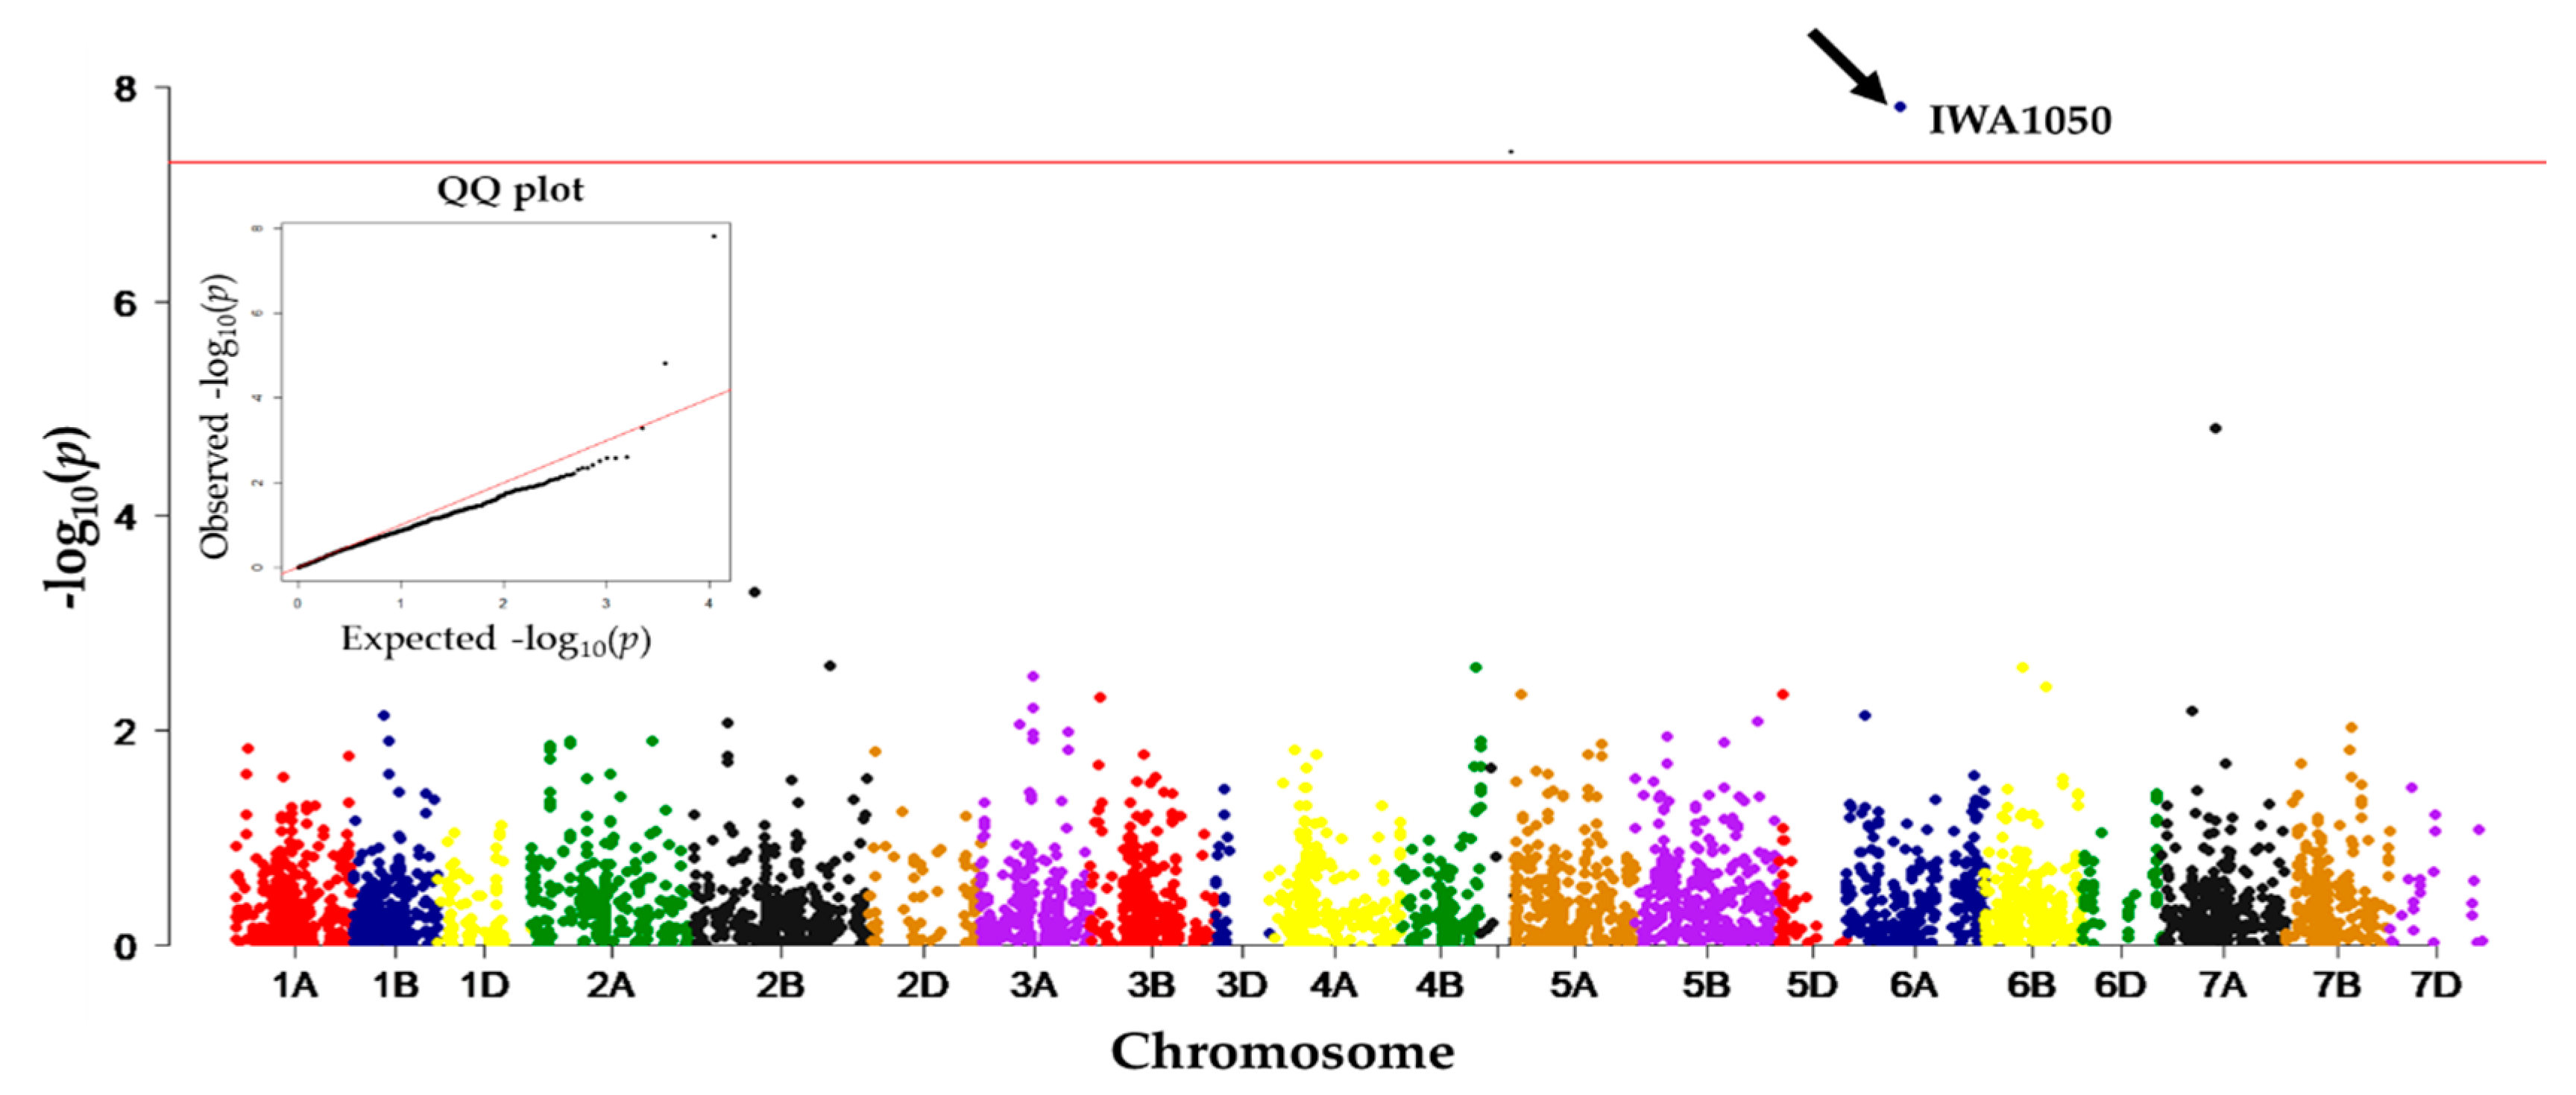
A genome-wide association study based on the 5476 SNPs identified SNPs associated with electrolyte leakage, with SNP IWA1050 from chromosome 6A the most significant (Figure 5). Among the A or G allele of IWA1050, allele A was favorable for freezing tolerance. The wheat genome assembly at Ensembl revealed that SNP IWA1050 is from within a gene designated as Traes_6AS_58D403D66, which encodes a chlorophyll a/b binding protein.
4. Discussion
In the genetic diversity studies of winter wheat landraces, landraces from latitudes higher than 40° N formed a separate cluster in the PCoA analysis based on 5476 SNPs, suggesting genetic variation due to adaptation to different environments. The latitudinal gradient is associated with distinct differences in climatic factors that can result in strong natural selection for local adaptation of plants. Plant species adapted to broad geographic regions have exhibited substantial variation in morphology, physiology, and development, most obvious along the latitudinal or altitudinal gradient [63]. During the Neolithic Revolution, with the spread of agricultural practices, crop plant species spread to new geographical regions. Migration to new regions offered an opportunity for adaptation to the new environment, which in turn contributed to the genetic variation in the adapted species. We observed this type of genetic variation among the 553 winter wheat landraces examined.
Linkage block analysis of the entire wheat genome identified regions from chromosomes 2A, 4A, 5B, and 6A to have specific alleles skewed towards landraces from higher latitudes (e.g., Figure 2), suggesting that loci on those chromosomes may have played a role in adaptation to more northerly latitudes. Similarly, GWAS identified SNPs on chromosomes 4A (IWA6597), and 2A (IWA3431) to be significantly associated with population structure, and a SNP on 4A (IWA7271) to be associated with variation in latitude of origin (Table 1). These results suggest that there were major genetic modifications in certain genomic regions of the hexaploid wheat genome when wheat was migrated to higher latitudes. Observations of linkage blocks and significant marker-latitude association in GWAS indicated that those modifications were genetically fixed on certain chromosomes and were carried along during the course of migration. As adaptation to higher latitudes also basically adapts plants to colder environments, it is possible that the linkage blocks and GWAS outputs are associated with cold tolerance. GWAS also identified a genetic region on chromosome 6A (IWA1050) to be significantly associated with freezing tolerance. The QQ plot demonstrated that the associations between freezing tolerance and the markers were deflated as genetic loci associated with population structure and latitudes were fitted as covariates.
The strong association of specific SNP tags (Table 1) with latitude of origin, population structure, or freezing tolerance may be indicative of the expression of the corresponding genes being necessary for adaptation. The association of SNP tag IWA7271, apparently from a gene encoding phosphatidylinositol N-acetyglucosaminyltransferase, with latitude of origin suggests that more highly-specialized membrane/lipid structures may have developed in landraces from more northerly latitudes, presumably contributing to their ability to tolerate the harsher environments. The finding of the association of freezing tolerance with an allele of SNP tag IWA1050, from a gene encoding a chlorophyll a/b binding protein, is consistent with previous findings of involvement of chlorophyll a/b binding proteins in the response of wheat plants to freezing stress [64,65]. While chlorophyll a/b binding proteins were initially discovered as part of the light-harvesting complex, recent studies have implicated these proteins in the expression of numerous traits in cereal grains, including stress responses [66,67,68,69]. Expression of these kinds of genes may result in greater intrinsic physical strength of cell walls and membranes in the landraces from higher latitudes, but also may result in differences in the ability to effectively acclimate to cold temperatures. It previously was shown that wheat lines differ in the response to the onset of low temperatures, such that some lines more rapidly and effectively acclimate to the cold than others [35].
Genetic analyses including PCoA, population structure, and linkage block analysis of these 553 winter wheat landraces from different geographical regions indicated that extensive genetic variation accompanied clinal adaptation to higher latitudes. Specific genomic regions (e.g., Figure 2) and specific genes (Table 1) appear to provide adaptive advantages. Further elucidation of the functions and efficacy of these genes and genomic regions may prove useful in expanding the geographic range of productive wheat crops.
Supplementary Materials
The following are available online at https://www.mdpi.com/2073-4395/8/6/95/s1, Figure S1: Population structure of 553 winter wheat landraces, Figure S2: Freezing tolerance of 192 winter wheat landraces across three treatment temperatures and latitude of origin of the landraces, Table S1: List of 553 winter wheat landrace accessions, their country and latitude of origin, and average electrolyte leakage of 192 accessions tested for freezing tolerance.
Author Contributions
J.S.K., D.Z.S. and D.R.S. conceived and designed the experiments; J.S.K. performed the experiments; J.S.K., M.H., Z.Z., D.Z.S. and D.R.S. analyzed the data; J.S.K., D.Z.S. and D.R.S. wrote the paper.
Funding
This research was funded by a USDA-ARS and Triticeae Coordinated Agricultural Project 2011-68002-30029 (Triticeae-CAP).
Acknowledgments
We thank Shiaoman Chao for providing SNP data for landraces included in this research. Department of Plant Pathology, College of Agricultural, Human, and Natural Resource Sciences, Agricultural Research Center, Project No. 0760, Washington State University, Pullman, WA 99164-6430, USA.
Conflicts of Interest
The authors declare no conflict of interest.
References
- Briggle, L.W.; Curtis, B.C. Wheat worldwide. In Wheat and Wheat Improvement; Agronomy Monograph 13; Heyne, E.G., Ed.; American Society of Agronomy; Crop Science Society of America; Soil Science Society of America: Madison, WI, USA, 1987; pp. 1–31. [Google Scholar]
- Nuttonson, M.Y. Wheat-Climate Relationships and the Use of Phenology in Ascertaining the Thermal and Photo-Thermal Requirements of Wheat: Based on Data of North America and Some Thermally Analogous Areas of North America in the Soviet Union and Finland; American Institute of Crop Ecology: Washington, DC, USA, 1955; p. 34. [Google Scholar]
- Salamini, F.; Ozkan, H.; Brandolini, A.; Schafer-Pregl, R.; Martin, W. Genetics and geography of wild cereal domestication in the near east. Nat. Rev. Genet. 2002, 3, 429–441. [Google Scholar] [CrossRef] [PubMed]
- Gutafson, P.; Raskina, O.; Ma, X.; Nevo, E. Wheat Evolution, Domestication, and Improvement. In Wheat Science and Trade; Carver, B.F., Ed.; Wiley-Blackwell: Ames, IA, USA, 2009; pp. 3–30. [Google Scholar]
- Gopher, A.; Abbo, S.; Lev-Yadun, S. The “when”, the “where” and the “why” of the Neolithic revolution in the Levant. Doc. Prehist. 2002, 28, 49–62. [Google Scholar] [CrossRef]
- Lev-Yadun, S.; Gopher, A.; Abbo, S. The cradle of agriculture. Science 2000, 288, 1602–1603. [Google Scholar] [CrossRef] [PubMed]
- Harlan, J.R.; Zohary, D. Distribution of wild wheats and barley. Science 1966, 153, 1074–1080. [Google Scholar] [CrossRef] [PubMed]
- Heun, M.; Schäfer-Pregl, R.; Klawan, D.; Castagna, R.; Accerbi, M.; Borghi, B.; Salamini, F. Site of einkorn wheat domestication identified by DNA fingerprinting. Science 1997, 278, 1312–1314. [Google Scholar] [CrossRef]
- Luo, M.-C.; Yang, Z.-L.; You, F.M.; Kawahara, T.; Waines, J.G.; Dvorak, J. The structure of wild and domesticated emmer wheat populations, gene flow between them, and the site of emmer domestication. Theor. Appl. Genet. 2007, 114, 947–959. [Google Scholar] [CrossRef] [PubMed]
- Diamond, J. Location, location, location: The first farmers. Science 1997, 278, 1243–1244. [Google Scholar] [CrossRef]
- Chapman, V.; Miller, T.E.; Riley, R. Equivalence of the A genome of bread wheat and that of Triticum urartu. Genet. Res. 1976, 27, 69–76. [Google Scholar] [CrossRef]
- Dvorak, J.; di Terlizzi, P.; Zhang, H.-B.; Resta, P. The evolution of polyploid wheats: Identification of the A genome donor species. Genome 1993, 36, 21–31. [Google Scholar] [CrossRef] [PubMed]
- Riley, R.; Unrau, J.; Chapman, V. Evidence on the origin of the B. genome of wheat. J. Hered. 1958, 49, 91–98. [Google Scholar] [CrossRef]
- Nevo, E.; Korol, A.B.; Beiles, A.; Fahima, T. Evolution of Wild Emmer and Wheat Improvement: Population Genetics, Genetic Resources, and Genome Organization of Wheat’s Progenitor, Triticum dicoccoides; Springer: Heidelberg, Germany, 2002. [Google Scholar]
- Feldman, M.; Kislev, M.E. Domestication of emmer wheat and evolution of free-threshing tetraploid wheat. Isr. J. Plant Sci. 2007, 55, 207–221. [Google Scholar] [CrossRef]
- Gill, B.S.; Friebe, B. Cytogenetics, phylogeny and evolution of cultivated wheats. In Bread Wheat—Improvement and Production; FAO Plant Production and Protection Series; Curtis, B.C., Rajaram, S., Gomez Macpherson, H., Eds.; Food and Agriculture Organization of the United Nations: Rome, Italy, 2002; Volume 30. [Google Scholar]
- McFadden, E.S.; Sears, E.R. The origin of Triticum spelta and its free-threshing hexaploid relatives. J. Hered. 1946, 37, 81–89. [Google Scholar] [CrossRef] [PubMed]
- Cox, T.S. Deepening the wheat gene pool. J. Crop Prod. 1997, 1, 1–25. [Google Scholar] [CrossRef]
- Dvorak, J.; Luo, M.-C.; Yang, Z.-L.; Zhang, H.-B. The structure of the Aegilops tauschii genepool and the evolution of hexaploid wheat. Theor. Appl. Genet. 1998, 97, 657–670. [Google Scholar] [CrossRef]
- Talbert, L.E.; Smith, L.Y.; Blake, N.K. More than one origin of hexaploid wheat is indicated by sequence comparison of low-copy DNA. Genome 1998, 41, 402–407. [Google Scholar] [CrossRef]
- Snape, J.W.; Law, C.N.; Parker, B.B.; Worland, A.J. Genetical analysis of chromosome 5A of wheat and its influence on important agronomic characters. Theor. Appl. Genet. 1985, 71, 518–526. [Google Scholar] [CrossRef] [PubMed]
- Simons, K.J.; Fellers, J.P.; Trick, H.N.; Zhang, Z.; Tai, Y.-S.; Gill, B.S.; Faris, J.D. Molecular characterization of the major wheat domestication gene Q. Genetics 2005, 172, 547–555. [Google Scholar] [CrossRef] [PubMed]
- Jones, G.; Jones, H.; Charles, M.P.; Jones, M.K.; Colledge, S.; Leigh, F.J.; Lister, D.A.; Smith, L.M.J.; Powell, W.; Brown, T.A. Phylogeographic analysis of barley DNA as evidence for the spread of Neolithic agriculture through Europe. J. Archaeol. Sci. 2012, 39, 3230–3238. [Google Scholar] [CrossRef]
- Colledge, S.; Conolly, J.; Shennan, S. The evolution of Neolithic farming from SW Asian origins to NW European limits. Eur. J. Archaeol. 2005, 8, 137–156. [Google Scholar] [CrossRef]
- Bogucki, P. How agriculture came to North-Central Europe. In Europe’s First Farmers; Price, T.D., Ed.; Cambridge University Press: Cambridge, UK, 2000. [Google Scholar]
- Ladizinsky, G. Founder effect in crop-plant evolution. Econ. Bot. 1985, 39, 191–199. [Google Scholar] [CrossRef]
- Santamaria, L.; Figuerola, J.; Pilon, J.J.; Mjelde, M.; Green, A.J.; De Boer, T.; King, R.A.; Gornall, R.J. Plant performance across latitude: The role of plasticity and local adaptation in an aquatic plant. Ecology 2003, 84, 2454–2461. [Google Scholar] [CrossRef] [Green Version]
- Sakai, A. Freezing resistance in willows from different climates. Ecology 1970, 51, 485–491. [Google Scholar] [CrossRef]
- Ying, C.C.; Bagley, W.T. Genetic variation of eastern cottonwood in an eastern Nebraska provenance study. Silvae Genet. 1976, 25, 67–73. [Google Scholar]
- Fu, Y.-B.; Somers, D.J. Genome-wide reduction of genetic diversity in wheat breeding. Crop Sci. 2009, 49, 161–168. [Google Scholar] [CrossRef]
- Zamir, D. Improving plant breeding with exotic genetic libraries. Nat. Rev. Genet. 2001, 2, 983–989. [Google Scholar] [CrossRef] [PubMed]
- Purugganan, M.D.; Fuller, D.Q. The nature of selection during plant domestication. Nature 2009, 2009 457, 843–848. [Google Scholar] [CrossRef]
- Patterson, F.L.; Shaner, G.E.; Ohm, H.W.; Foster, J.E. A historical perspective for the establishment of research goals for wheat improvement. J. Prod. Agric. 1990, 3, 30–38. [Google Scholar] [CrossRef]
- Thomashow, M.F. Plant cold acclimation: Freezing tolerance genes and regulatory mechanisms. Ann. Rev. Plant Physiol. Plant Mol. Biol. 1999, 50, 571–599. [Google Scholar] [CrossRef] [PubMed]
- Fowler, D.B. Wheat production in the high winter stress climate of the Great Plains of North America—An experiment in crop adaptation. Crop Sci. 2012, 52, 11–20. [Google Scholar] [CrossRef]
- Law, C.N.; Jenkins, G. A genetic study of cold resistance in wheat. Genet. Res. 1970, 15, 197–308. [Google Scholar] [CrossRef]
- Limin, A.E.; Danyluk, J.; Chauvin, L.-P.; Fowler, D.B.; Sarhan, F. Chromosome mapping of low-temperature induced WCS120 family genes and regulation of cold-tolerance expression in wheat. Mol. Gen. Genet. 1997, 253, 720–727. [Google Scholar] [CrossRef] [PubMed]
- Baga, M.; Chodaparambil, S.V.; Limin, A.E.; Pecar, M.; Fowler, D.B.; Chibbar, R.N. Identification of quantitative trait loci and associated candidate genes for low-temperature tolerance in cold-hardy winter wheat. Funct. Integr. Genom. 2007, 7, 53–68. [Google Scholar] [CrossRef] [PubMed]
- Case, A.J.; Skinner, D.Z.; Garland-Campbell, K.A.; Carter, A.H. Freezing tolerance-associated quantitative trait loci in the Brundage × Coda wheat recombinant inbred line population. Crop Sci. 2014, 54, 982–992. [Google Scholar] [CrossRef]
- Kruse, E.B.; Carle, S.W.; Wen, N.; Skinner, D.Z.; Murray, T.D.; Garland-Campbell, K.A. Genomic regions associated with tolerance to freezing stress and snow mold in winter wheat. Genes Genomes Genet. 2017, 7, 775–780. [Google Scholar] [CrossRef] [PubMed]
- Vagujfalvi, A.; Galiba, G.; Cattivelli, L.; Dubcovsky, J. The cold-regulated transcriptional activator CBF3 is linked to the frost-tolerance locus Fr-A2 on wheat chromosome 5A. Mol. Genet. Genom. 2003, 269, 60–67. [Google Scholar]
- Motomura, Y.; Kobayashi, F.; Iehisa, J.; Takumi, S. A major quantitative trait locus for cold-responsive gene expression is linked to frost-resistance gene Fr-A2 in common wheat. Breed. Sci. 2013, 63, 58–67. [Google Scholar] [CrossRef] [PubMed]
- Pearce, S.; Zhu, J.; Boldizsar, A.; Vagujfalvi, A.; Burke, A.; Garland-Campbell, K.; Galiba, G.; Dubcovsky, J. Large deletions in the CBF gene cluster at the Fr-B2 locus are associated with reduced frost tolerance in wheat. Theor. Appl. Genet. 2013, 126, 2683–2697. [Google Scholar] [CrossRef] [PubMed]
- Todorovska, E.; Kolev, S.; Christov, N.; Balint, A.; Kocsy, G.; Vagujfalvi, A.; Galiba, G. The expression of CBF genes at Fr-2 locus is associated with the level of frost tolerance in Bulgarian winter wheat cultivars. Biotechnol. Biotechnol. Equip. 2014, 28, 392–401. [Google Scholar] [CrossRef] [PubMed]
- Zhu, J.; Pearce, S.; Burke, A.; See, D.; Skinner, D.Z.; Dubcovsky, J.; Garland-Campbell, K. Copy number and haplotype variation at the VRN-A1 and central FR-A2 loci are associated with frost tolerance in hexaploid wheat. Theor. Appl. Genet. 2014, 127, 1183–1197. [Google Scholar] [CrossRef] [PubMed]
- Würschum, T.; Longin, C.F.H.; Hahn, V.; Tucker, M.R.; Leiser, W.L. Copy number variations of CBF genes at the Fr-A2 locus are essential components of winter hardiness in wheat. Plant J. 2017, 89, 764–773. [Google Scholar] [CrossRef] [PubMed]
- Brule-Babel, A.L.; Fowler, D.B. Genetic control of cold hardiness and vernalization requirement in winter wheat. Crop Sci. 1988, 28, 879–884. [Google Scholar] [CrossRef]
- Mahfoozi, S.; Limin, A.E.; Fowler, D.B. Influence of vernalization and photoperiod responses on cold hardiness in winter cereals. Crop Sci. 2001, 41, 1006–1011. [Google Scholar] [CrossRef]
- Snape, J.W.; Butterworth, K.; Whitechurch, E.; Worland, A.J. Waiting for fine times: Genetics of flowering time in wheat. In Wheat in a Global Environment. Developments in Plant Breeding; Bedo, Z., Lang, L., Eds.; Springer: Dordrecht, The Netherlands, 2001; Volume 9, pp. 67–74. [Google Scholar]
- McIntosh, R.A.; Dubcovsky, J.; Rogers, W.J.; Morris, C.; Appels, R.; Xia, X.C. Catalogue of Gene Symbols for wheat: 2012 Supplement. KOMUGI Wheat Genetic Resources Database. 2013. Available online: https://Shigen.nig.ac.jp/wheat/komugi/genes/macgene/supplement2012.pdf (accessed on 27 March 2018).
- Peakall, R.; Smouse, P.E. Genalex 6: Genetic analysis in Excel. Population genetic software for teaching and research. Mol. Ecol. Resour. 2006, 6, 288–295. [Google Scholar] [CrossRef]
- Pritchard, J.K.; Stephens, M.; Donnelly, P. Inference of population structure using multilocus genotype data. Genetics 2000, 155, 945–959. [Google Scholar] [PubMed]
- Cavanagh, C.R.; Chao, S.; Wang, S.; Huang, B.E.; Stephen, S.; Kiani, S.; Forrest, K.; Saintenac, C.; Brown-Guedira, G.L.; Akhunova, A.; et al. Genome-wide comparative diversity uncovers multiple targets of selection for improvement in hexaploid wheat landraces and cultivars. Proc. Natl. Acad. Sci. USA 2013, 110, 8057–8062. [Google Scholar] [CrossRef] [PubMed] [Green Version]
- Earl, D.A.; vonHoldt, B.M. STRUCTURE HARVESTER: A website and program for visualizing STRUCTURE output and implementing the Evanno method. Conserv. Genet. Res. 2012, 4, 359–361. [Google Scholar] [CrossRef]
- Evanno, G.; Regnaut, S.; Goudet, J. Detecting the number of clusters of individuals using the software STRUCTURE: A simulation study. Mol. Ecol. 2005, 14, 2611–2620. [Google Scholar] [CrossRef] [PubMed]
- Jakobsson, M.; Rosenberg, N.A. CLUMPP: A cluster matching and permutation program for dealing with label switching and multimodality in analysis of population structure. Bioinformatics 2007, 23, 1801–1806. [Google Scholar] [CrossRef] [PubMed]
- McKay, H.M. Electrolyte leakage from fine roots of conifer seedlings: A rapid index of plant vitality following cold storage. Can. J. For. Res. 1992, 22, 1371–1377. [Google Scholar] [CrossRef]
- Dexter, S.T.; Tottingham, W.E.; Graber, L.F. Investigations of the hardiness of plants by measurement of electrical conductivity. Plant Physiol. 1932, 7, 63–78. [Google Scholar] [CrossRef] [PubMed]
- Murray, M.B.; Cape, J.N.; Fowler, D. Quantification of frost damage in plant tissues by rates of electrolyte leakage. New Phytol. 1989, 113, 307–311. [Google Scholar] [CrossRef] [Green Version]
- Bajji, M.; Kinet, J.-M.; Lutts, S. The use of the electrolyte leakage method for assessing cell membrane stability as a water stress tolerance test in durum wheat. Plant Growth Regul. 2002, 36, 61–70. [Google Scholar] [CrossRef]
- Cuevas, C.; Bellinger, B.S.; Skinner, D.Z. Membrane stability of winter wheat plants exposed to subzero temperatures for variable lengths of time. Commun. Plant Sci. 2015, 5, 9–14. [Google Scholar]
- Liu, X.; Huang, M.; Fan, B.; Buckler, E.S.; Zhang, Z. Iterative usage of fixed and random effect models for powerful and efficient genome-wide association studies. PLoS Genet. 2016, 12, E1005767. [Google Scholar] [CrossRef] [PubMed]
- Endler, J.A. Geographic Variation, Speciation, and Clines; Princeton University Press: Princeton, NJ, USA, 1977; p. 246. [Google Scholar]
- Skinner, D.Z. Post-acclimation transcriptome adjustment is a major factor in freezing tolerance of winter wheat. Funct. Integr. Genom. 2009, 9, 513–523. [Google Scholar] [CrossRef] [PubMed]
- Skinner, D.Z. Genes upregulated in winter wheat (Triticum aestivum L.) during mild freezing and subsequent thawing suggest sequential activation of multiple response mechanisms. PLoS ONE 2015, 10, E0133166. [Google Scholar] [CrossRef] [PubMed]
- Churin, Y.; Adam, E.; Kozma-Bognar, L.; Nagy, F.; Borner, T. Characterization of two Myb-like transcription factors binding to CAB promoters in wheat and barley. Plant Mol. Biol. 2003, 52, 447–462. [Google Scholar] [CrossRef] [PubMed]
- Wang, X.; Cai, J.; Jiang, D.; Liu, F.; Dai, T.; Cao, W. Pre-anthesis high-temperature acclimation alleviates damage to the flag leaf caused by post-anthesis heat stress in wheat. J. Plant Physiol. 2011, 168, 585–593. [Google Scholar] [CrossRef] [PubMed]
- Wang, X.; Cai, J.; Liu, F.; Dai, T.; Cao, W.; Wollenweber, B.; Jiang, D. Multiple heat priming enhances thermo-tolerance to a later high temperature stress via improving subcellular antioxidant activities in wheat seedlings. Plant Physiol. Biochem. 2014, 74, 185–192. [Google Scholar] [CrossRef] [PubMed]
- Xia, Y.; Ning, Z.; Bai, G.; Li, R.; Yan, G.; Siddique, K.H.M.; Baum, M.; Guo, P. Allelic variations of a light harvesting chlorophyll a/b-binding protein gene (Lhcb1) associated with agronomic traits in barley. PLoS ONE 2012, 7, e37573. [Google Scholar] [CrossRef] [PubMed]
Figure 1.
Principal coordinates analysis (PCoA) based on 5476 SNP markers on 553 winter wheat landraces. Landraces are color coded based on ranges of latitudes of their origin. The circled accessions indicate clustering of most of the accessions from ≥40° north latitude.
Figure 1.
Principal coordinates analysis (PCoA) based on 5476 SNP markers on 553 winter wheat landraces. Landraces are color coded based on ranges of latitudes of their origin. The circled accessions indicate clustering of most of the accessions from ≥40° north latitude.

Figure 2.
Linkage block analysis for the distribution of allele frequencies of 553 winter wheat landraces from higher (>40° N) and lower (<40° N) latitudes in (A) chromosome 4A and (B) chromosome 6A.
Figure 2.
Linkage block analysis for the distribution of allele frequencies of 553 winter wheat landraces from higher (>40° N) and lower (<40° N) latitudes in (A) chromosome 4A and (B) chromosome 6A.

Figure 3.
Regression analysis of freezing tolerance on latitude of origin of 192 winter wheat landraces. Freezing tolerance was measured as electrolyte leakage of cold-acclimated seedlings following freezing to −14, −16, or −18 °C. Electrolyte leakage was expressed as the arcsine-transformed proportions of leakage after the freezing challenge relative to leakage after freezing in liquid nitrogen. R2 = 0.14, p < 0.0001.

Figure 4.
Contour plot of spline regression of freezing tolerance on latitude of origin of 192 wheat landraces collected from latitudes 27.5° N to 60° N and longitudes 9° W to 129.6° E, superimposed on a map of the world. Freezing tolerance was defined as electrolyte leakage following freezing to −14, −16, or −18° C, expressed as a proportion of leakage following immersion in liquid nitrogen; lower numbers indicate greater freezing tolerance.

Figure 5.
Manhattan plot, and QQ (quantile-quantile) plot, from genome-wide association studies for freezing tolerance (measured as electrolyte leakage) in 192 winter wheat landraces using 5476 SNPs. Deflation of the QQ plot was due to the use of genetic loci associated with population structure and latitude as covariates.


Table 1.
Genome-wide association studies results showing significant SNPs for population structure, latitude, and electrolyte leakage (as a measure of freezing tolerance) in winter wheat landraces.
Table 1.
Genome-wide association studies results showing significant SNPs for population structure, latitude, and electrolyte leakage (as a measure of freezing tolerance) in winter wheat landraces.
| SNP a | CHR b | cM c | MAF d | Obs e | p-Value | Trait | Possible Gene Identification f |
|---|---|---|---|---|---|---|---|
| IWA3431 | 2A | 117.57 | 0.37 | 553 | 3.02 × 10−124 | Population structure | Translation initiation factor |
| IWA6597 | 4A | 57.56 | 0.26 | 553 | 1.11 × 10−107 | Population structure | Unknown function, transmembrane domains |
| IWA7271 | 4A | 46.27 | 0.23 | 553 | 1.02 × 10−50 | Latitude | phosphatidylinositol N-acetyglucosaminyltransferase |
| IWA1050 | 6A | 85.53 | 0.41 | 192 | 1.52 × 10⁻⁸ | Electrolyte leakage | chlorophyll a/b binding protein |
a single-nucleotide polymorphic marker; b chromosome number; c position of the SNP marker in the chromosome in centimorgan (cM); d minor allele frequency; e number of observations; f possible gene identification based on annotations in the wheat genome assembly at Ensembl (http://archive.plants.ensembl.org/Triticum_aestivum/Info/Index) or a BLAST search of the GenBank database (http://www.ncbi.nlm.nih.gov).
Table 2.
Analysis of variance reporting significant effect of the geographic latitude of origin and the test temperature on freezing tolerance of 192 winter wheat (Triticum aestivum L.) landrace accessions.
Table 2.
Analysis of variance reporting significant effect of the geographic latitude of origin and the test temperature on freezing tolerance of 192 winter wheat (Triticum aestivum L.) landrace accessions.
| Source of Variation | df a | Sum of Squares b | % Explained Variation |
|---|---|---|---|
| Latitude | 1 | 21.6 *** | 52.5 |
| Test temperature | 2 | 17.0 *** | 41.5 |
| Replications | 1 | 2.3 | 5.6 |
| Subsamples | 2 | 0.2 | 0.4 |
| Model | 6 | 41.1 | |
| Error | 2949 | 258.4 |
a degrees of freedom; and b stars (***) indicate significance at p < 0.001.
© 2018 by the authors. Licensee MDPI, Basel, Switzerland. This article is an open access article distributed under the terms and conditions of the Creative Commons Attribution (CC BY) license (http://creativecommons.org/licenses/by/4.0/).
Share and Cite
MDPI and ACS Style
Sthapit Kandel, J.; Huang, M.; Zhang, Z.; Skinner, D.Z.; See, D.R. Genetic Diversity of Clinal Freezing Tolerance Variation in Winter Wheat Landraces. Agronomy 2018, 8, 95. https://doi.org/10.3390/agronomy8060095
AMA Style
Sthapit Kandel J, Huang M, Zhang Z, Skinner DZ, See DR. Genetic Diversity of Clinal Freezing Tolerance Variation in Winter Wheat Landraces. Agronomy. 2018; 8(6):95. https://doi.org/10.3390/agronomy8060095
Chicago/Turabian StyleSthapit Kandel, Jinita, Meng Huang, Zhiwu Zhang, Daniel Z. Skinner, and Deven R. See. 2018. "Genetic Diversity of Clinal Freezing Tolerance Variation in Winter Wheat Landraces" Agronomy 8, no. 6: 95. https://doi.org/10.3390/agronomy8060095
Note that from the first issue of 2016, this journal uses article numbers instead of page numbers. See further details here.