Article

Long-Term Winter Wheat (Triticum aestivum L.) Seasonal Irrigation Amount, Evapotranspiration, Yield, and Water Productivity under Semiarid Climate

1
Department of Plant and Environmental Sciences, New Mexico State University, Agricultural Science Center at Farmington, P.O. Box 1018, Farmington, NM 87499, USA
2
ADA Consulting Africa, 07 BP 14284, Lomé, Togo
3
Department of Biological Systems Engineering, University of Nebraska-Lincoln, Lincoln, NE 68583-0726, USA
*
Author to whom correspondence should be addressed.
Agronomy 2018, 8(6), 96; https://doi.org/10.3390/agronomy8060096
Submission received: 10 May 2018 / Revised: 14 June 2018 / Accepted: 16 June 2018 / Published: 16 June 2018

Abstract

:
A long-term field experiment was conducted from 2002 to 2014 for the evaluation of yield and water productivity of three winter wheat varieties—Kharkof, Scout 66, and TAM107—under sprinkler irrigation at New Mexico State University Agricultural Science Center at Farmington, NM. Winter wheat daily evapotranspiration was estimated following the United Nations Food and Agriculture Organization FAO crop coefficient approach (ETc = Kc ETo), and crop water use efficiency (CWUE), evapotranspiration water use efficiency (ETWUE), and irrigation water use efficiency (IWUE) were estimated for each growing season. There was inter-annual variation in seasonal precipitation and irrigation amounts. Seasonal irrigation amounts varied from 511 to 787 mm and the total water supply varied from 590 to 894 mm with precipitation representing a range of 7.7–24.2%. Winter wheat daily actual evapotranspiration (ETc) varied from 0.1 to 14.5 mm/day, averaging 2.7 mm/day during the winter wheat growing seasons, and the seasonal evapotranspiration varied from 625 to 890 mm. Grain yield was dependent on winter wheat variety, decreased with years, and varied from 1843.1 to 7085.7 kg/ha. TAM107 obtained the highest grain yield. Winter wheat CWUE, IWUE, and ETWUE were also varietal dependent and varied from 0.22 to 1.01 kg/m3, from 0.26 to 1.17 kg/m3, and from 0.29 to 0.92 kg/m3, respectively. CWUE linearly decreased with seasonal water, and IWUE linearly decreased with seasonal irrigation amount, while CWUE, IWUE, and ETWUE were positively correlated with the grain yield for the three winter wheat varieties, with R2 ≥ 0.85 for CWUE, R2 ≥ 0.69 for IWUE, and R2 ≥ 0.89 for ETWUE. The results of this study can serve as guidelines for winter wheat production in the semiarid Four Corners regions. Additional research need to be conducted for optimizing winter wheat irrigation management relative to planting date and fertilization management to reduce the yield gap between winter wheat actual yield and the national average yield.

1. Introduction

Wheat (Triticum aestivum L.) is the third most common field crop grown in the United States in terms of planted acreage and total production, behind maize and soybean. For wheat production in the 2016–2017 fiscal year, 22.316 million tons of wheat were produced in the United States (US) on 20.23 million hectares of cropland [1], and the projected US wheat planted area for 2017/18 is projected slightly lower at 18.62 million hectares. While wheat is generally grown in the Great Plains region, wheat is produced in other regions, including the southwestern United States. Wheat production is limited by soil water availability, soil qualities, management practices, and climatic conditions [2]. The USDA [3] indicated that wheat yield is lower in the Plains than in the eastern half of the United States due to the lower yielding spring wheat cultivated in the Plains, non-optimal soil moisture, higher air temperature during the growing season, and the extreme heat during the crop maturity period. New Mexico was ranked 33rd in the US in wheat production, with a harvested area of 54,632 ha. The value of production was $23 million in 2015 and decreased to $17 million in 2017 [1,4]. Wheat has distinct varieties that are produced in different regions or over different seasons relative to climatic variation, elevation and moisture availability [5]. In the US Grain Plains, winter wheat variety Kharkof yield varied from 1755 to 2918 kg/ha and from 1480 to 3577 kg/ha in two nurseries for the 1959–2008 period [6]. Graybosch and Peterson [6] indicated there is little genetic gain for wheat in the southern US Great Plains with no improvement in yields of newly released varieties. Irmak et al. [2] reported winter wheat grain yield ranging from 330 to 7990 kg/ha averaging 4550 kg/ha with evapotranspiration water use efficiency (ETWUE) range of 0.76–0.93 kg/m3 in the South Central Nebraska. Chen et al. [7] reported winter wheat grain yield that varied from 2947.3 kg/ha to 6248.9 kg/ha in the North China Plain. Sun et al. [8] reported winter wheat yield varying from 3328 to 5584 kg/ha in the same environment. Large variation in winter wheat was reported across China by Liu et al. [9]. Winter wheat yield downward trends were reported by Qiu et al. [10] at annual mean yield decreasing rate of 782 kg/ha due to the reduction in the fallow period. Nielsen et al. [11,12] observed increase in winter wheat grain yields in the US Central Great Plains by 14.1 kg/ha for 1 mm increase in plant-available water in the soil profile at planting and by 12.5 kg/ha for every 10 mm of wheat soil-water uptake after 130 mm of water use. Good agricultural practices adoption could help overcome yield depression factor and stabilize and increase winter wheat under actual and future climatic conditions across the globe.
Winter wheat seasonal water use varies across locations, and the yield-water use relationship also varies across different regions, which constitutes a challenge for information transfer [13]. It is therefore important to develop a winter wheat seasonal evapotranspiration-yield production function under local conditions. Winter wheat seasonal actual evapotranspiration (ETc) was 600 mm and 490 mm during two consecutive seasons in Southcentral Nebraska [2]. Seasonal ETc varied from 791 to 957 mm for the three seasons at Bushland, Texas [14]. Irrigated winter wheat ETc varied from 227 to 519 mm as a function of irrigation regimes while the rainfed winter wheat ETc varied from 213 to 227 mm [15]. Drerup et al. [16] reported winter wheat seasonal ETc of 403 mm and 430 mm at Duelmen, Germany.
Winter wheat average yield across the State of New Mexico was 1681, 1480, and 2018 kg/ha in 2015, 2016, and 2017, respectively, against national average yields of 2858, 3719, and 3376 kg/ha for the respective years, representing on average 52% of the national average yield [1]. Efforts should be made to improve winter wheat yield in the southwestern United States. In the Four Corners region, the lack of the irrigation water from the Navajo Indian Irrigation Project (NIIP) during the initial crop stage affects winter wheat plants’ standing before dormancy. The severe drought during the winter period affects plant survival from dormancy, winter wheat yield, and the total production in this region. The objectives of this study were to evaluate long-term grain yield of winter wheat and to determine water productivity of three winter wheat varieties under semiarid climate at Farmington, New Mexico.

2. Materials and Methods

2.1. Station Area

A long-term experiment was conducted at the New Mexico State University (NMSU) Agricultural Science Center at Farmington (Latitude 36.69’ North, Longitude 108.31’ West) for the period of 2002–2014. Minimum air temperature (Tmin), maximum air temperature (Tmax), average air temperature (Tmean), mean relative humidity (RHmean), wind speed (u2), and solar radiation (Rs) were collected on a daily basis from an automated weather station installed at the site by the New Mexico Climate Center. Annual average weather conditions are summarized in Table 1. The daily average weather data were used for daily reference evapotranspiration estimation during each winter wheat growing season.

2.2. Experimental Design and Crop Management

Three varieties of winter wheat (Kharkof, Scout 66, and TAM107) were arranged in a complete randomized block design with four replications. These winter wheat varieties were continuously used as checks in a large Southern Regional Performance Nursery for winter wheat coordinated by the USDA based at the University of Nebraska-Lincoln. The planting rate was 112 kg of seed per hectare. Germination test was done before planting and the germination rate varied with seasons from 91 to 98% and averaged 96%. The planting date, harvesting date, applied fertilizer rate, seasonal precipitation, and seasonal applied irrigation are summarized in Table 2. The field was kept weed-free by herbicide application or hand weeding as needed. The crops were inspected for insect infestation and treated prior to any significant damage occurring. Irrigation scheduling was based on reference evapotranspiration and winter wheat crop coefficients. The field was fully irrigated by a center pivot irrigation system to avoid any water stress. The pivot was equipped with Mid Elevation Spray Application (MESA) with pads mounted on flexible drop hoses.

2.3. Crop Seasonal Evapotranspiration Estimation

Crop seasonal evapotranspiration (ETc) was determined through the FAO crop coefficient approach (ETc = Kc ETo) [17,18]:
ETc = Kc × ETo
Grass reference evapotranspiration was estimated with the standardized Penman-Monteith equation [19].
ETo = 0.408 Δ ( Rn G ) + ( γ Cn   u 2 / ( T + 273 ) ) ( es ea ) Δ + γ ( 1 + Cd   u 2 )
where ETo is the reference evapotranspiration (mm day−1), Δ is the slope of saturation vapor pressure versus air temperature curve (kPa °C−1), Rn is the net radiation at the crop surface (MJ m−2 day−1), G is the soil heat flux density at the soil surface (MJ m−2 day−1), T is the mean daily air temperature at 1.5–2.5 m height (°C), u2 is the mean daily wind speed at 2 m height (m s−1), es is the saturation vapor pressure at 1.5–2.5 m height (kPa), ea is the actual vapor pressure at 1.5–2.5 m height (kPa), es-ea is the saturation vapor pressure deficit (kPa), γ is the psychrometric constant (kPa °C−1), and Cn and Cd are constants with values of 900 °C mm s3 Mg−1 day−1 and 0.34 s m−1. The procedure developed by Allen et al. [18] was used to compute the needed parameters.
Winter wheat was grown under non-limiting water and fertilizer conditions, and the standard FAO crop coefficient values [18] were used for crop actual evapotranspiration estimation. As the crop develops, the ground coverage, crop height, and leaf area change, and the crop Kc is affected by climate conditions, soil moisture status, and crop growth stages. Due to differences in evapotranspiration during various growth stages, the Kc for a given crop varies over the growing period. The winter wheat growing period consists of the initial stage, crop development stage, mid-season stage, and late-season stage. Winter wheat growing season actual evapotranspiration was also calculated as a cumulative daily ETc. Winter wheat crop coefficients developed under a standard climatic condition by Allen et al. [18] as 0.4, 1.15, and 0.25 for the initial, mid-season, and late-season were also used to estimate winter wheat ETc for the study period. During crop development and late season stages, crop coefficient Kc was linearly interpolated between two typical values of Kc. The ETc during initial stage mainly consists of evaporation. Therefore, adjustment of Kc for this stage mainly depends on climatic factors. As per the FAO-56 method, crop coefficient is affected by several factors among which is the plant height. The typical mid- and late-season stage Kc values were adjusted with climatic condition and winter wheat crop height.
Kc   Stage = KcStagei + [ 0.04 ( u 2 2 ) 0.004   ( RHmin 45 ) ] ( h 3 ) 0.3
where KcStagei is the standard value according to FAO-56 approach [18], u2 is the value for daily wind speed at 2 m height over grass during the growth stage (m/s), RHmin is the value for daily minimum relative humidity during the growth stage (%), and h is the plant height for each growth stage (m) (0.1–10 m).

2.4. Thermal Unit (TU)

Thermal unit is the accumulation of the growing degree days (GDD), which is cumulative air temperature that contributes to plant growth during the growing season and is expressed as follows:
TU = i = 1 n Tmax + Tmin 2 Tbase
where Tmax = maximum air temperature, Tmin = minimum air temperature, Tbase = base temperature threshold for winter wheat (0 °C), and n = number of days. The base temperature for calculating growing degree days is the minimum threshold air temperature at which plant growth starts. The maximum and minimum air temperature thresholds of 30 °C and 0 °C, respectively, were used. All temperature values exceeding the threshold should be reduced to 30 °C, and values below 0 °C were taken as 0 °C because no growth occurs above or below the threshold air temperature values. If the average daily air temperature was below the base temperature, the TU value was assumed to be zero.

2.5. Crop Water Use Efficiency

Crop water use efficiency termed as water productivity is generally defined as crop yield per unit volume of water used, including effective rainfall and irrigation water. Crop water use efficiency related to crop evapotranspiration (CWUE), evapotranspiration water use efficiency (ETWUE), and seasonal irrigation water use efficiency (IWUE) were estimated by the following equations:
CWUE = Yield Seasonal   water   supply
ETWUE = Yield Winter   wheat   seasonal   ETa
IWUE = Yield Seasonal   irrigation   amount
where CWUE, ETWUE and IWUE are in kg/m3, yield is in kg/ha, and winter wheat seasonal ETc and the seasonal irrigation amount are in m3/ha. Rainfed winter wheat production had negligible grain yield at the experimental site.

2.6. Statistical Analysis

The effects of wheat varieties and the seasons and their potential interaction on wheat yield, evapotranspiration, CWUE, IWUE, and ETWUE were analyzed using analysis of variance (ANOVA) in PROC MIXED in SAS [20]. Separation of means was determined with the least significant difference (LSD) statement at the 5% significance level to identify any potential significant differences between three varieties.

3. Results and Discussion

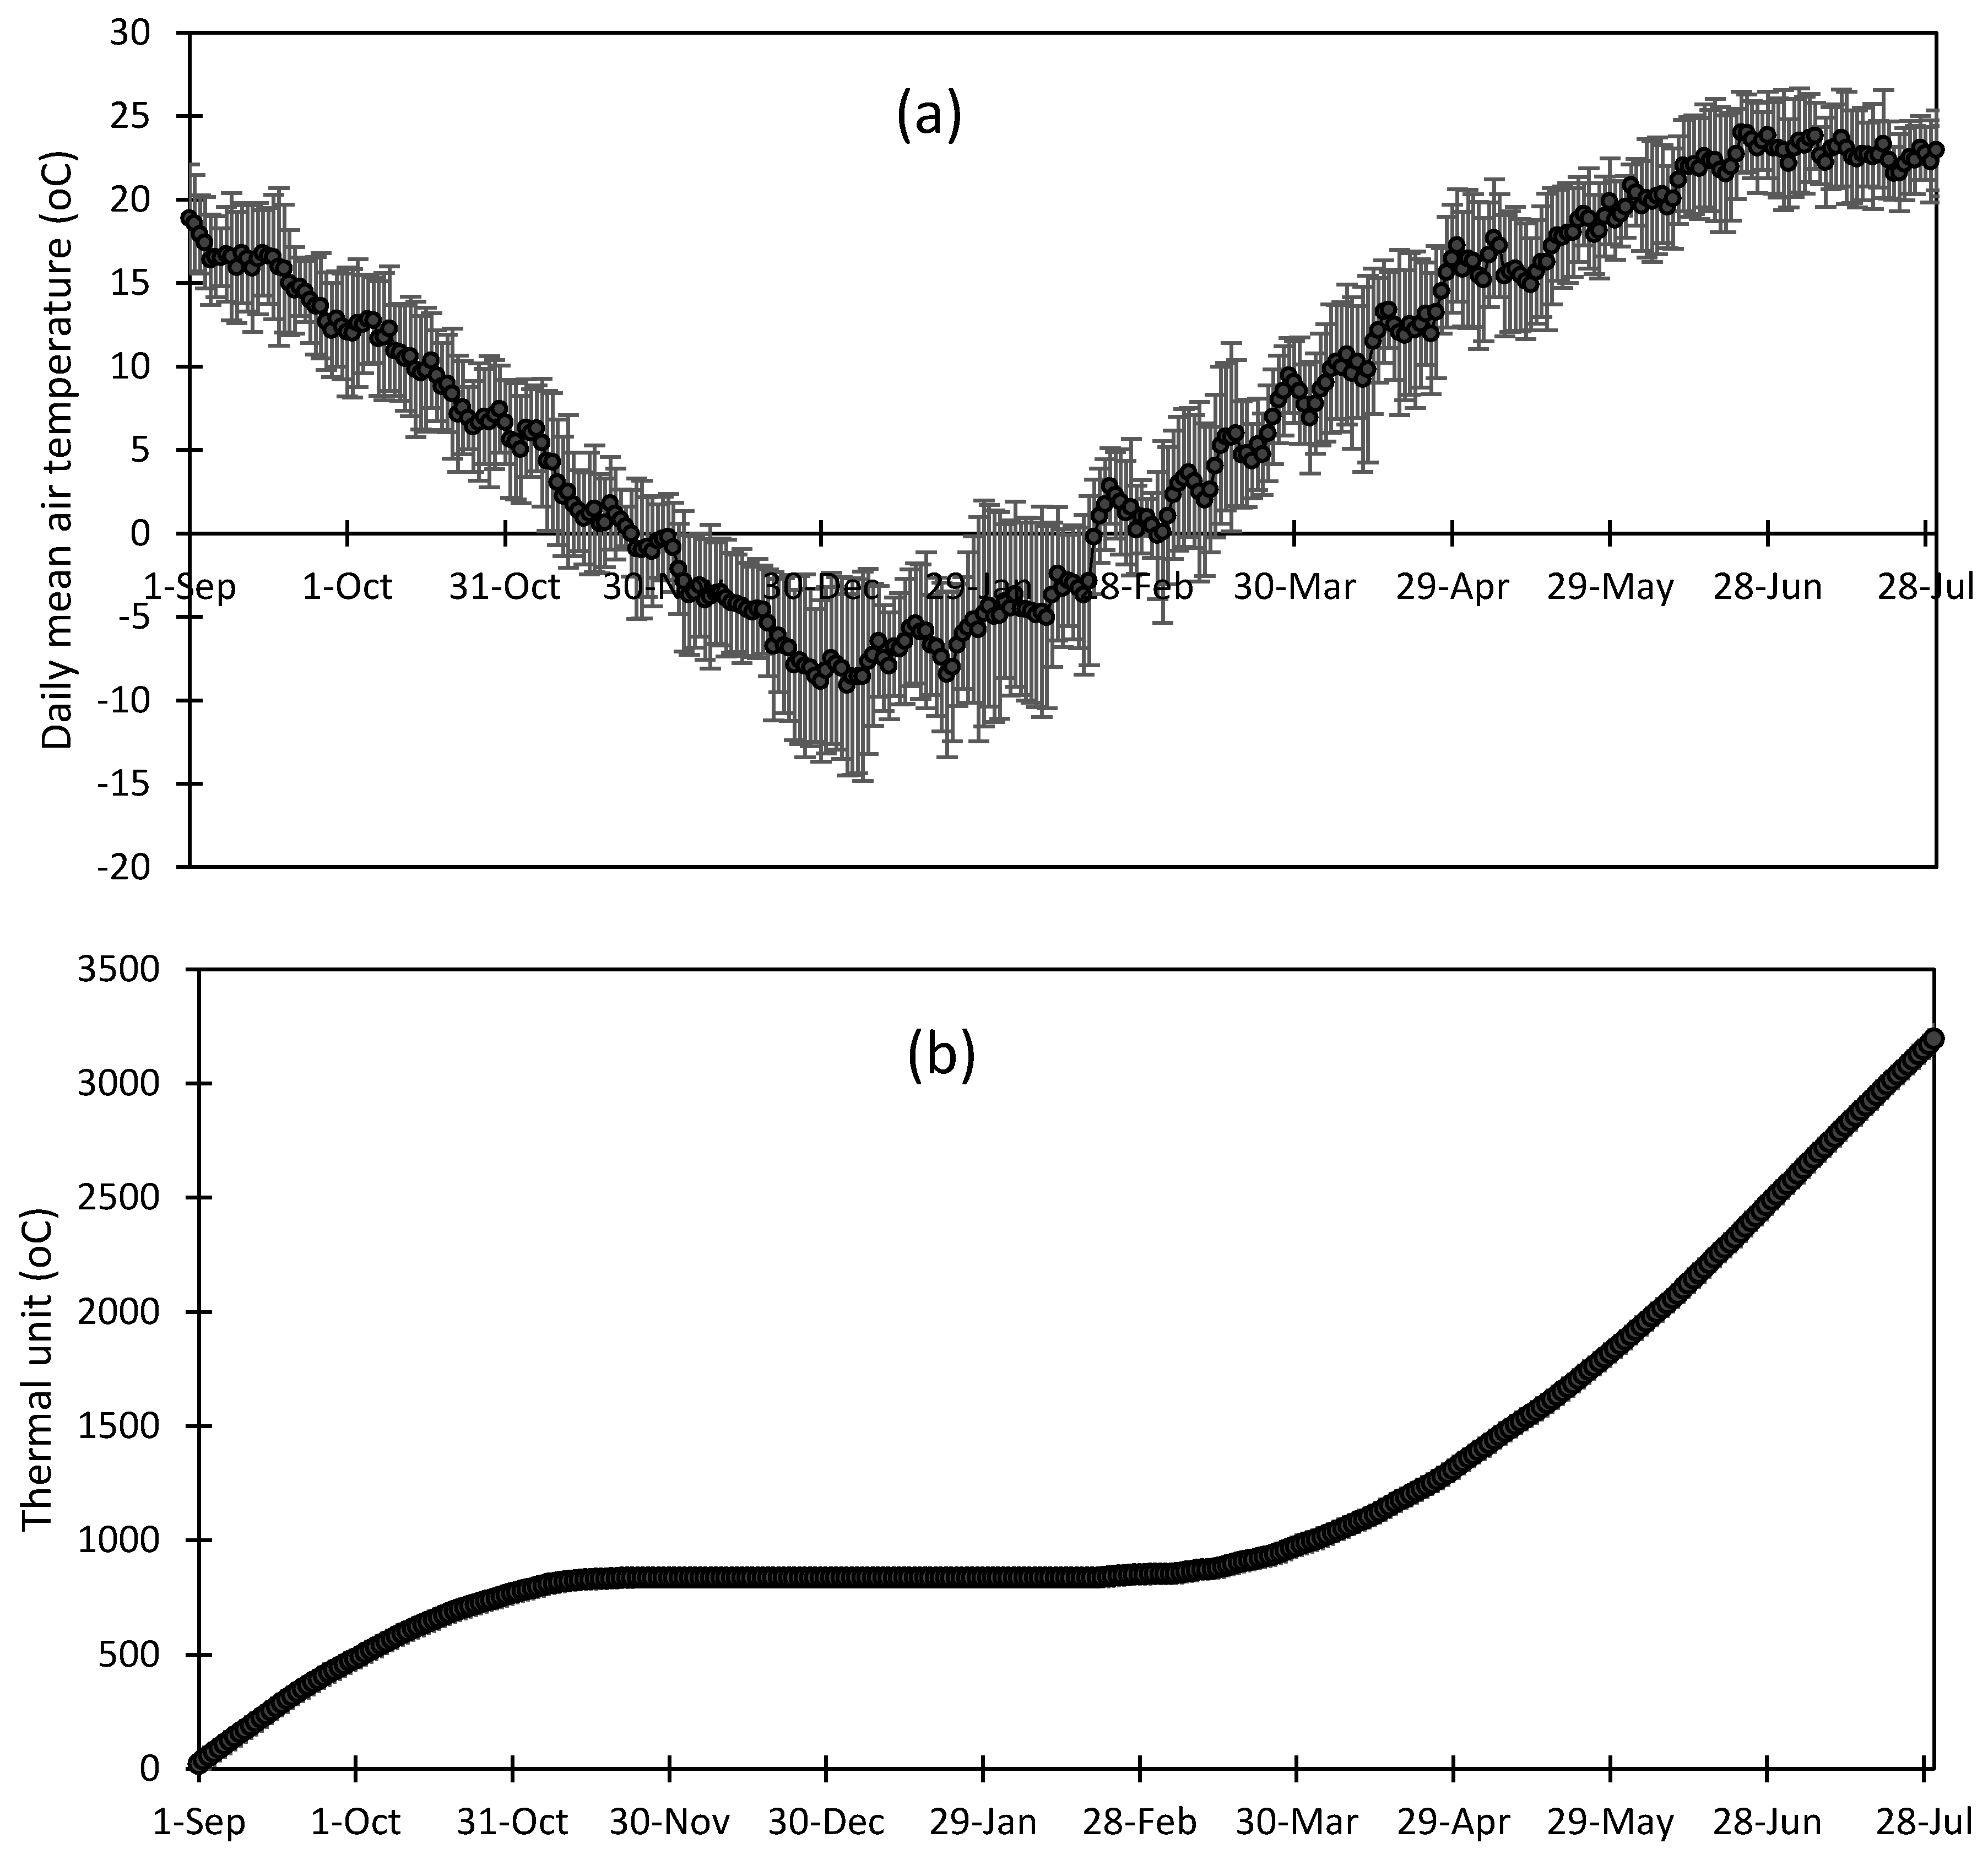
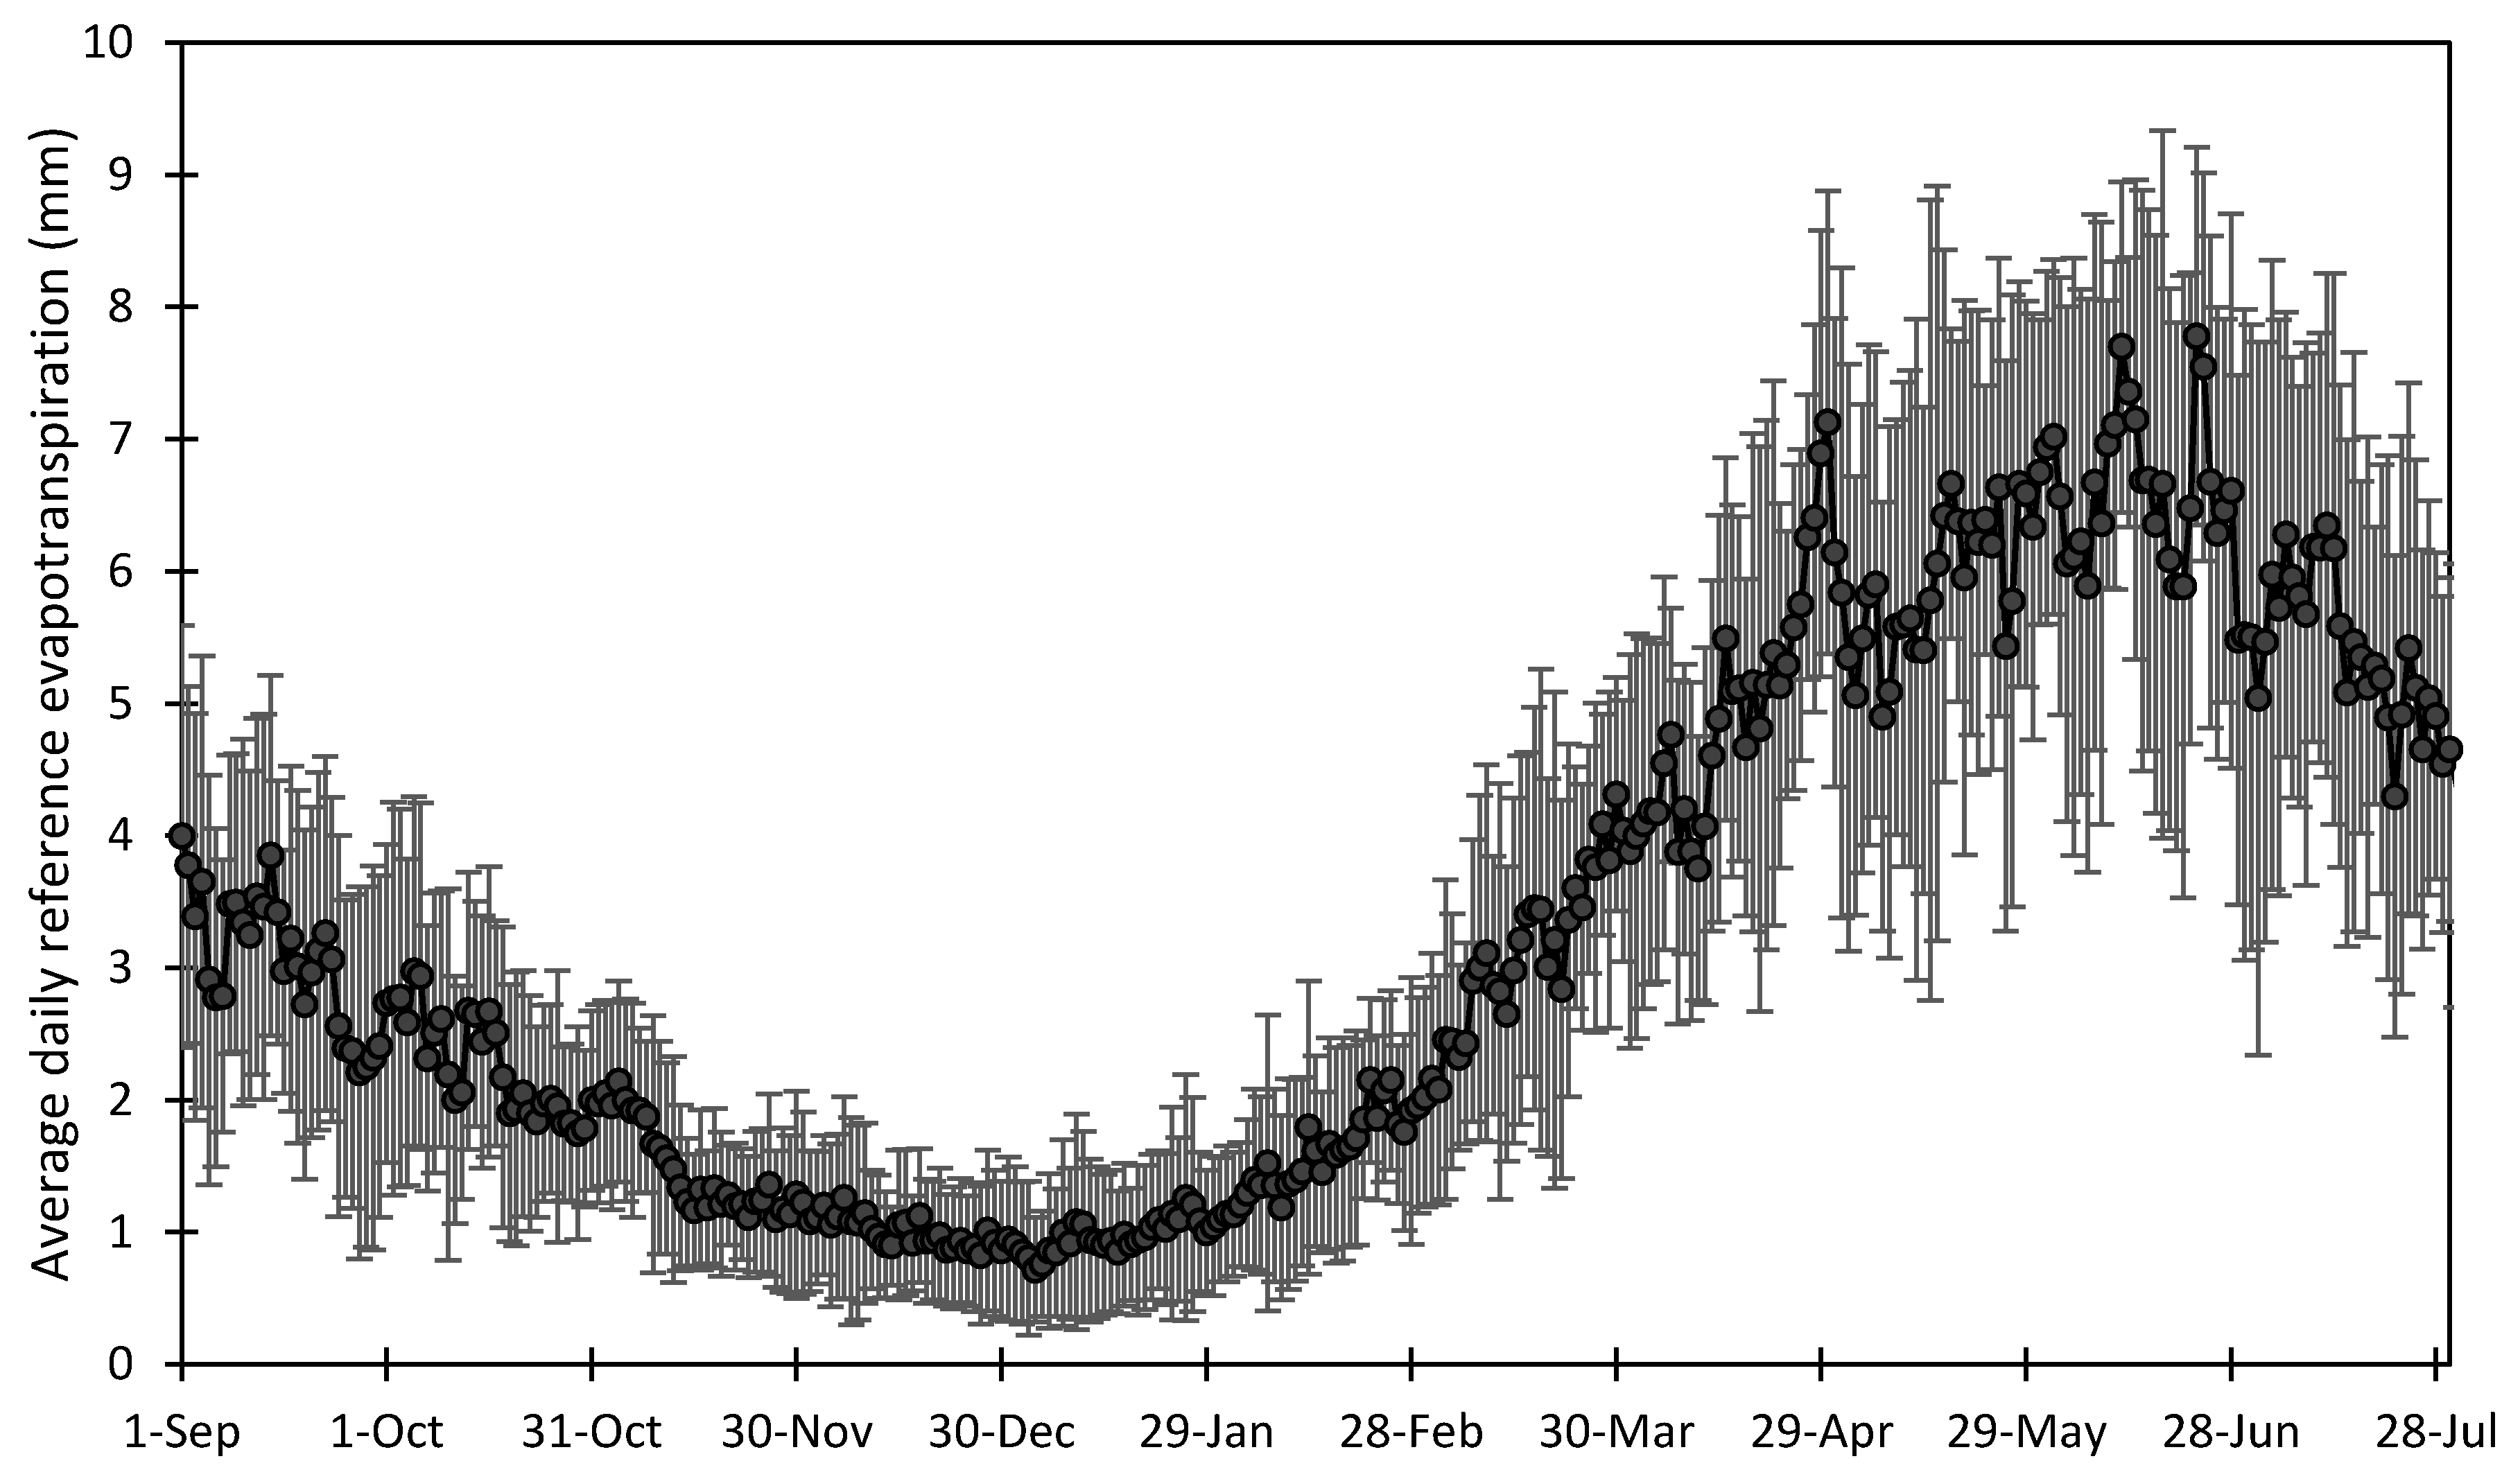
3.1. Climatic Conditions during the Winter Wheat Growing Seasons

Seasonal average climatic condition is summarized in Table 1. Seasonal average wind speed varied from 2.7 to 3.8 m/s. The strongest wind speed (3.8 m/s) was obtained during winter wheat growing season 2010–2011. Seasonal average Tmax varied from 12.0 to 16.6 °C; Tmin varied from 1.7 to 3.5 °C and the seasonal average mean air temperature varied from 6.8 to 10.0 °C. Winter wheat season 2008–2009 was the warmest season and the 2002–2003 season was the coldest during the study period. Average daily mean air temperature decreased from 18 °C early September to −9 °C in January and increased thereafter and reached 23 °C in July (Figure 1a). Average daily air temperature was below winter wheat base temperature (0 °C) from November 24 to February 21st that correspond to the winter wheat dormancy period with no growth occurring during that period. No accumulation on thermal unit occurs during that period as shown in Figure 1b. Seasonal average relative humidity varied with the growing seasons and ranged from 46.1 to 68.8%. The 2010–2011 season was the driest one and the 2002–2003 season was the wettest. Less variation was observed in the seasonal average solar radiation which varied from 14.6 to 16.2 MJ m−2. The least solar radiation was received during the 2002–2003 season while the greatest was received during the 2007–2008 growing season. Daily reference evapotranspiration (ETo) at the site had similar trends as the average air temperature and decreased from 4 mm early September to 0.8 mm early January and increased thereafter to 7.7 mm around mid-June and decreased again toward the end of July (Figure 2). Daily ETo was at its minimum value during winter wheat dormancy period and increased with warmer air temperature after the very low air temperatures during December (Figure 1a,b and Figure 2).

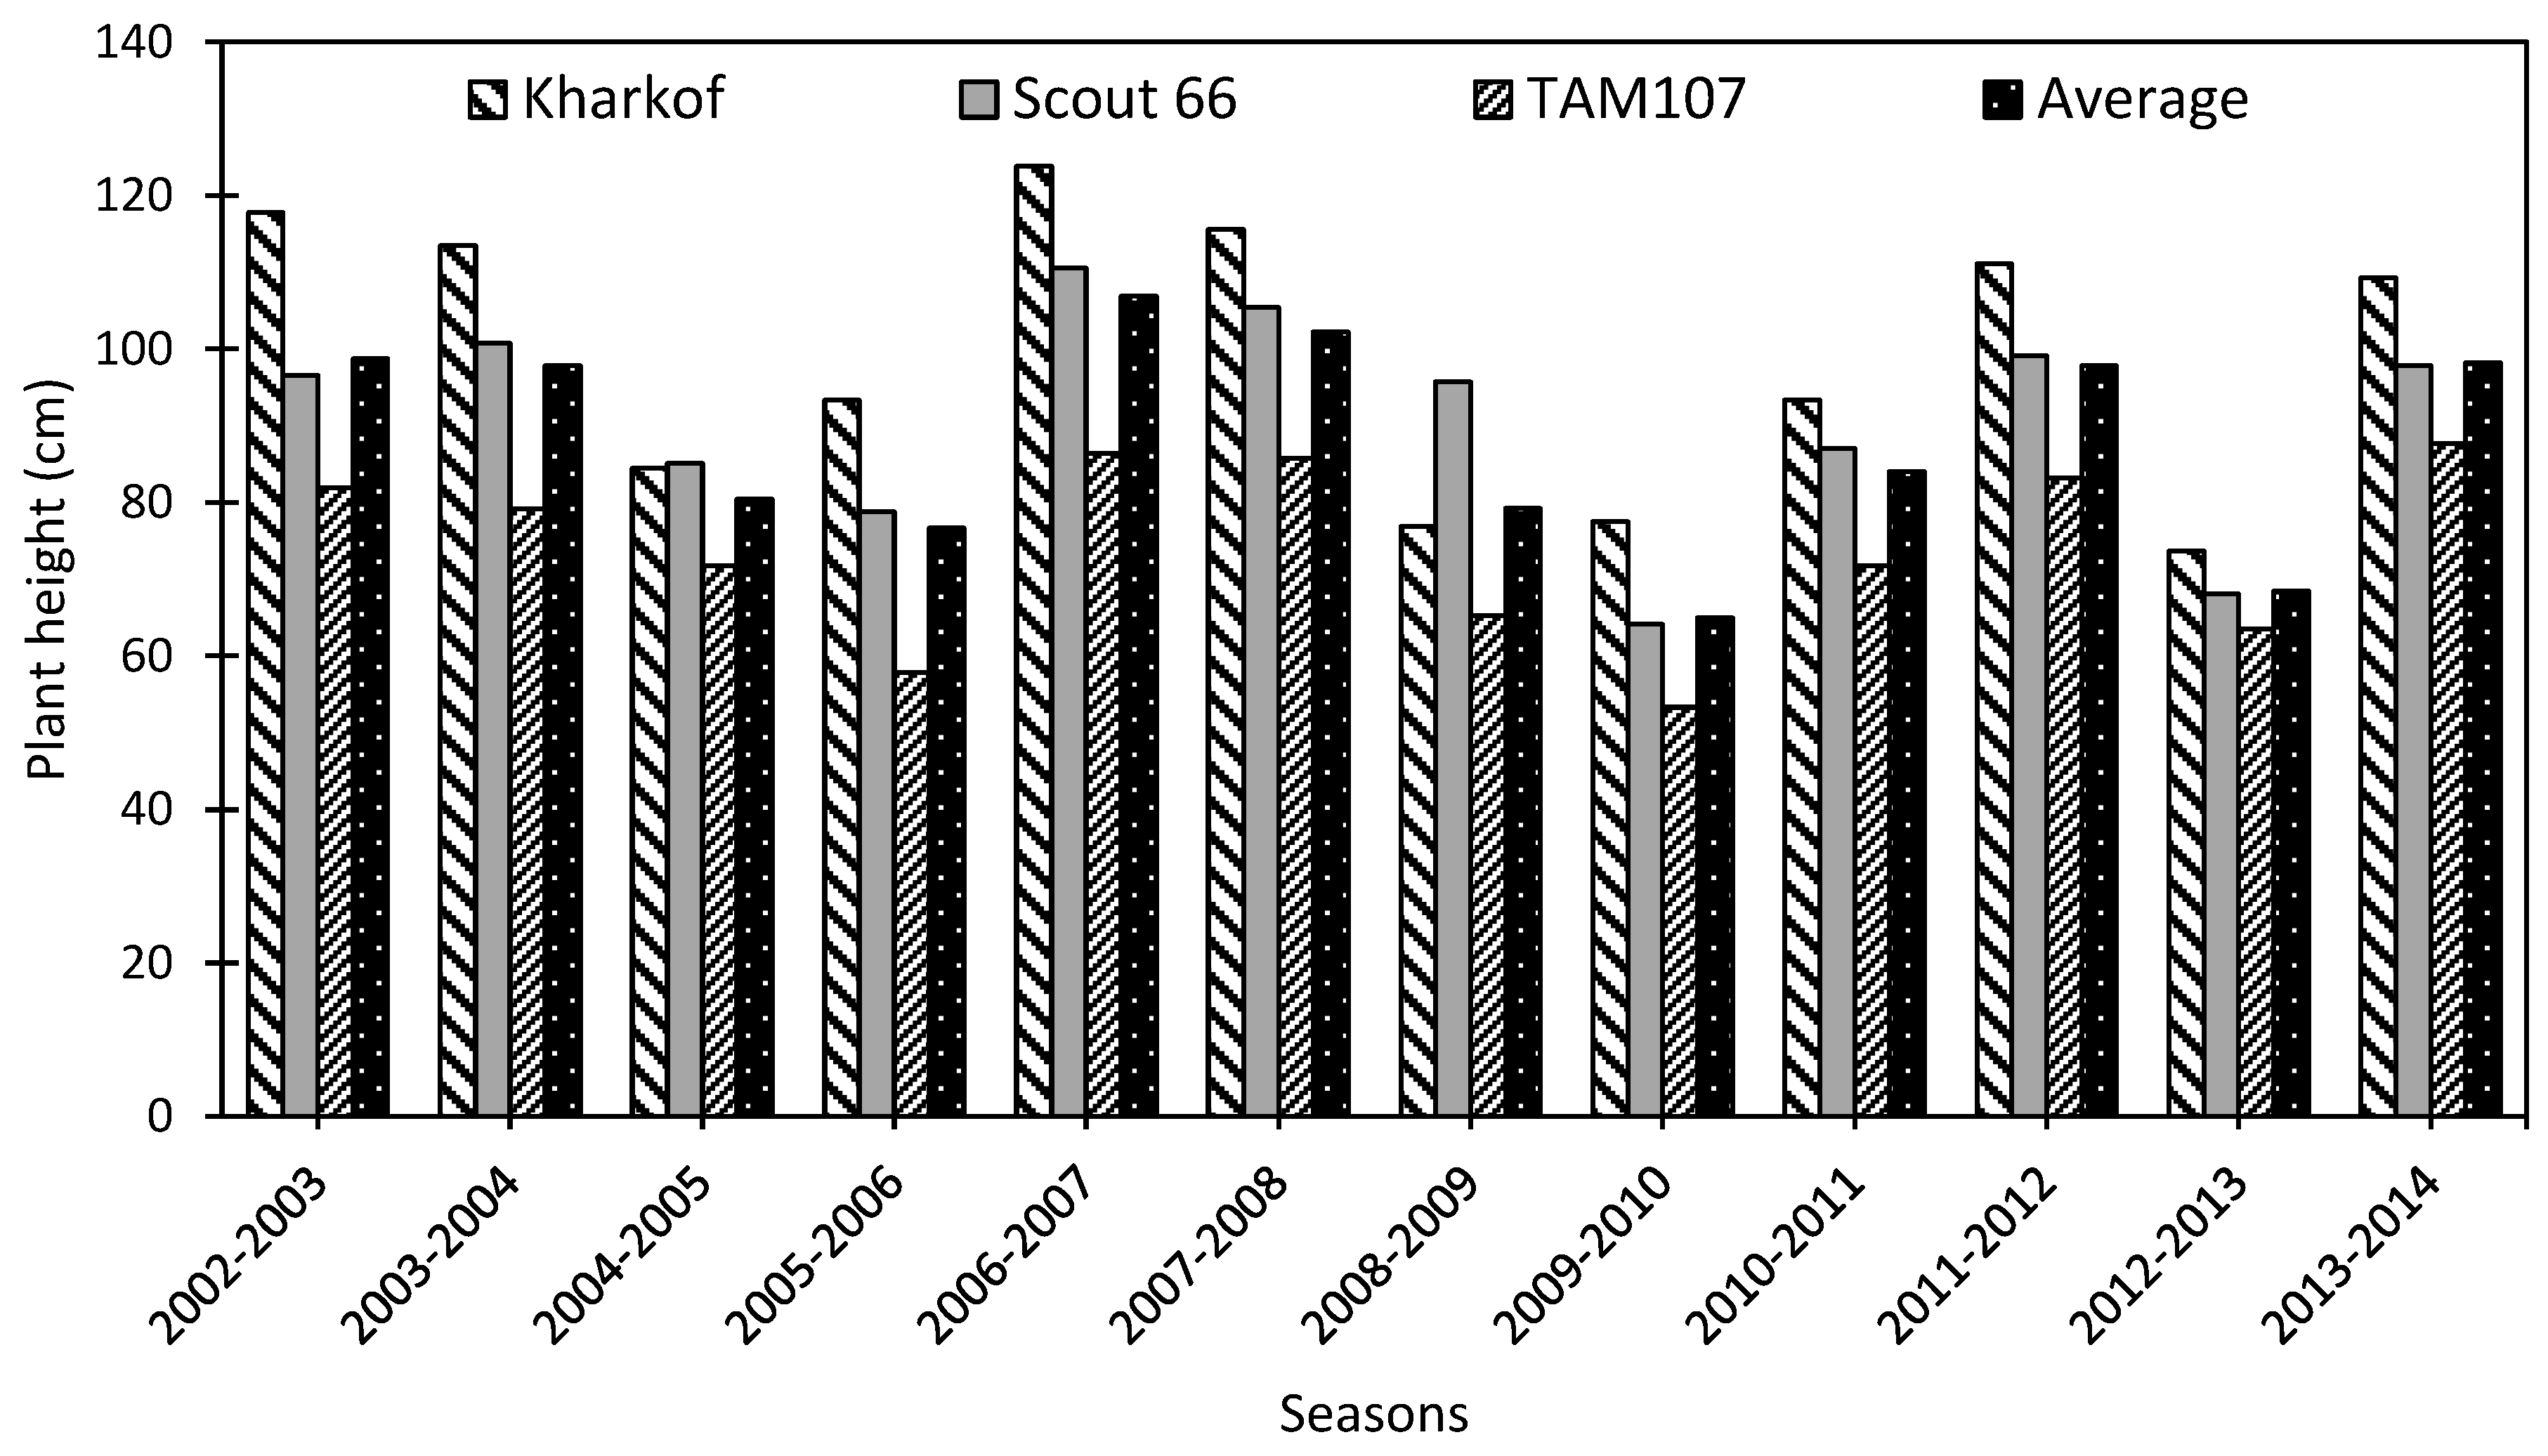
3.2. Winter Wheat Water Use

Seasonal total precipitation varied from 80 to 190 mm and averaged 129 mm. The 2007–2008 season was the wettest season, and the 2006–2007 season was the driest season during the study period (Table 2). There was inter-annual variation in winter wheat seasonal irrigation. Seasonal irrigation amounts varied from 511 to 787 mm and averaged 654 mm per winter wheat growing season (Table 2). The highest applied irrigation amount occurred during the 2013–2014 growing season while the lowest applied irrigation amount was observed during the 2006–2007 growing season. It was contrasting to have applied the least irrigation amount during the driest season 2006–2007 however, average wind speed was low (2.8 m/s), Tmean was 8.2 °C, and the average relative humidity was high (60.3) compared to other winter wheat growing seasons (Table 1). Total seasonal water supply varied from 590 to 894 mm and averaged 784 mm. The inter-annual variation in climatic conditions might have impacted the seasonal irrigation amount and the total water supply. Moreover, the rotation of the experimental field from one center pivot to another also might have been another source of variability in applied irrigation from season to season. The center pivots at the site are different and may have different application efficiency. With this long-term study, irrigation management and scheduling might have changed from season to season due to changes in human resources at the research site. However, winter wheat was not under water stress during the active growing and development stages after the dormancy period during all the growing period.

3.3. Winter Wheat Evapotranspiration

Wheat water use, estimated with the FAO crop coefficient approach, did not show any significant difference between the three varieties even if plant height was function of crop varieties (Figure 3). There were significant differences between winter wheat varieties and the least significant difference (LSD) values were 8.9, 9.9, 8.1, 9.6, 7.3, 8.9, 11.7, 9.1, 6.8, 9.7, 5.3, and 5.6 cm consecutively from the 2002–2003 to 2013–2014 growing seasons. Average daily ETc varied from 0.1 on extreme cold days to 14.5 mm during the summer period and averaged 2.7 mm day−1 during the winter wheat growing seasons (Table 3). From crop emergence to late November, crop ETc was reduced to evaporation, and crop ETc was lowest during the cold period from late November through late February during plant dormancy and increased with increasing thermal unit from March when the air temperature increased above winter wheat base temperature and induced crop growth and development. Irmak et al. (2015) reported that winter wheat ETc mainly depends on the aerodynamic variables and physiologically nonproductive air temperature. There was inter-annual variation in the wheat ETc varied from 626 to 887 mm. (Table 3). The highest ETc was obtained during the 2010–2011 growing season while the lowest ETc was obtained during the 2002–2003 growing season. The 2010–2011 season showed the strongest wind with the seasonal average wind speed of 3.8 m/s and the lowest relative humidity averaging 46.1% (Table 1). There was significant increasing trend in wheat seasonal ETo with year. Winter wheat ETc value of 710 mm was reported by Musick and Porter [21] in Texas and 791–957 mm by Howell et al. [22] in Bushland, Texas under a semi-arid and advective climate. Low average ETc of rainfed winter wheat was reported as 414, 438 and 423 mm for the conventional, reduced, and to tillage near Tribune, KS for the period of 1991–2015 [23]. Irmak et al. [2] reported winter wheat seasonal ETc of 600 mm and 490 mm during two growing seasons in South Central Nebraska (Clay Center) with the highest ETc value obtained during the warmest season. Lower winter wheat ETc values in the range of 483–505 mm and 374–551 mm were also reported by Ko et al. [24] and Luo et al. [25] from their studies at in Uvalde, Texas (USA), and at Yucheng City in Shandong Province (China), respectively. Howell et al. [14] reported winter wheat seasonal ETc that varied from 791 to 957 mm during the 1989–1990, 1991–1992, and 1992–1993 winter wheat cropping seasons at Bushland, Texas. Xue et al. [26] reported irrigated winter wheat ETc ranged of 565 to 590 kg/ha in the US Southern High Plains. Musick et al. [13] and Howell et al. [14,27] reported irrigated wheat growth seasonal evapotranspiration range of 700–950 mm. During the study period of 2002–2014, seasonal precipitation during winter wheat growth period represented only 7.7% of wheat seasonal ETs in 2002–2003 and a maximum of 24.2% of wheat seasonal ET of the ET required for maximum grain yield. Therefore, winter wheat production under rainfed conditions at the study site seems impossible, revealing proper irrigation management to maximize water productivity under the semiarid climate in New Mexico.

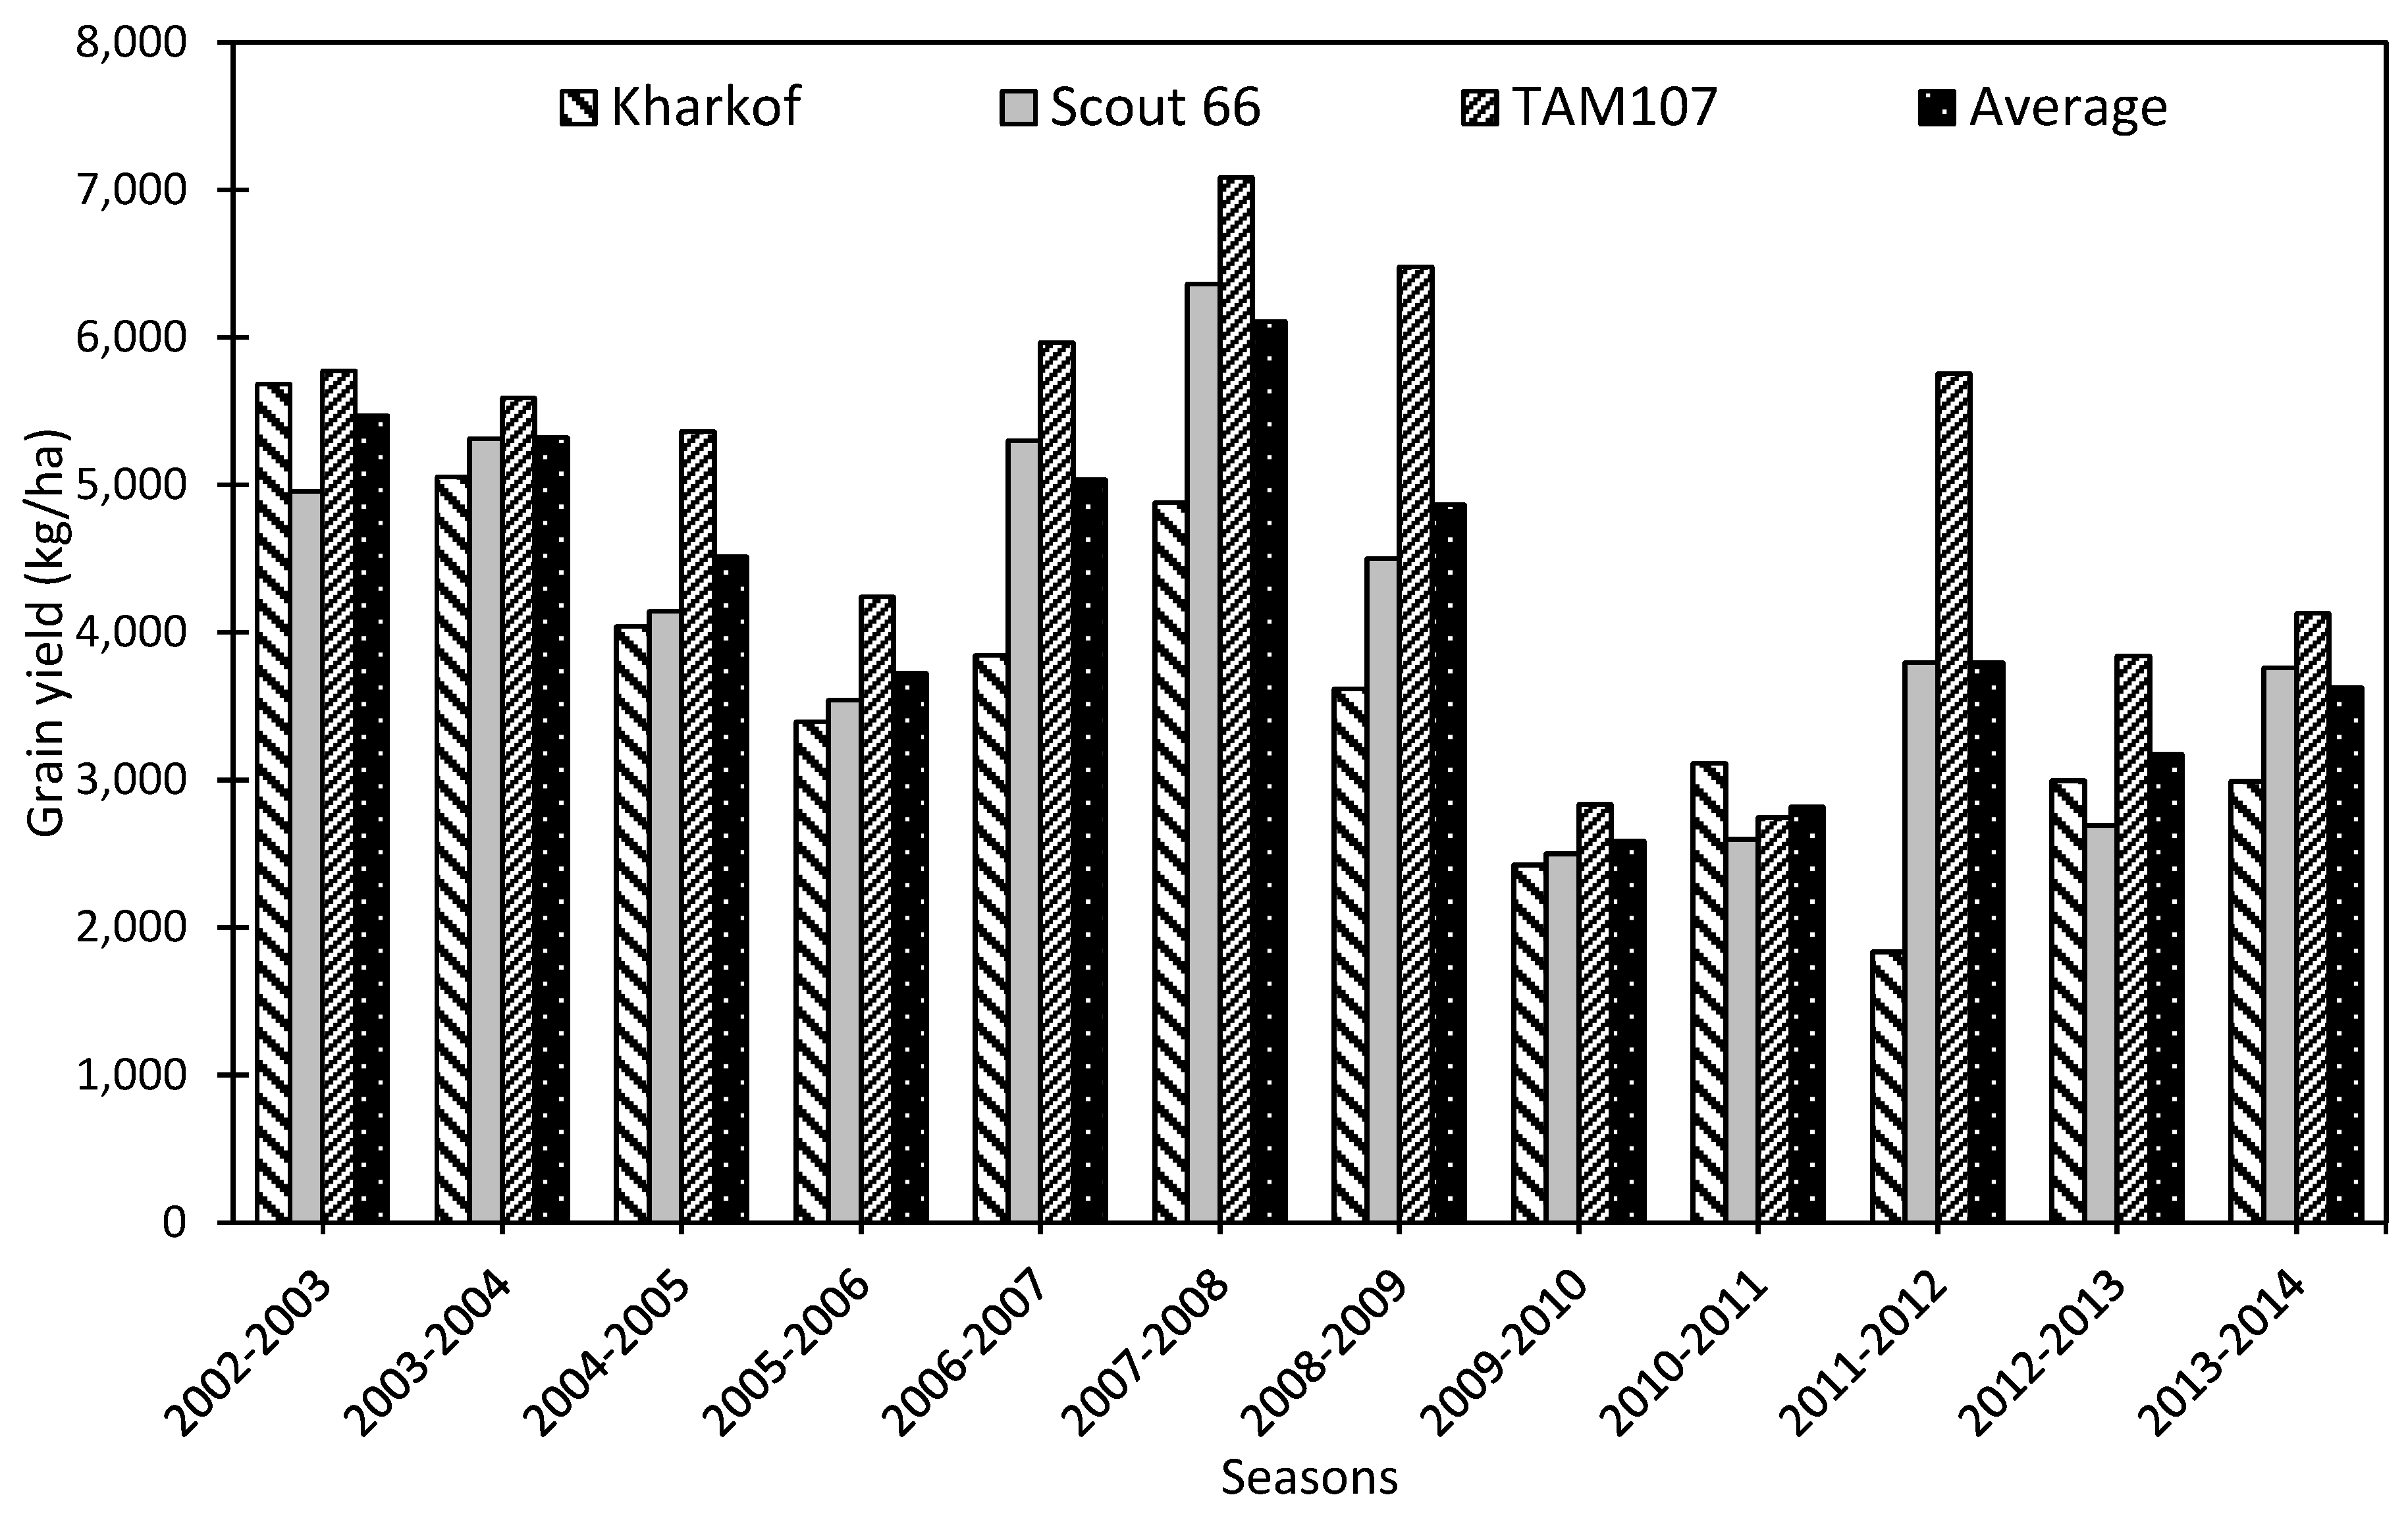
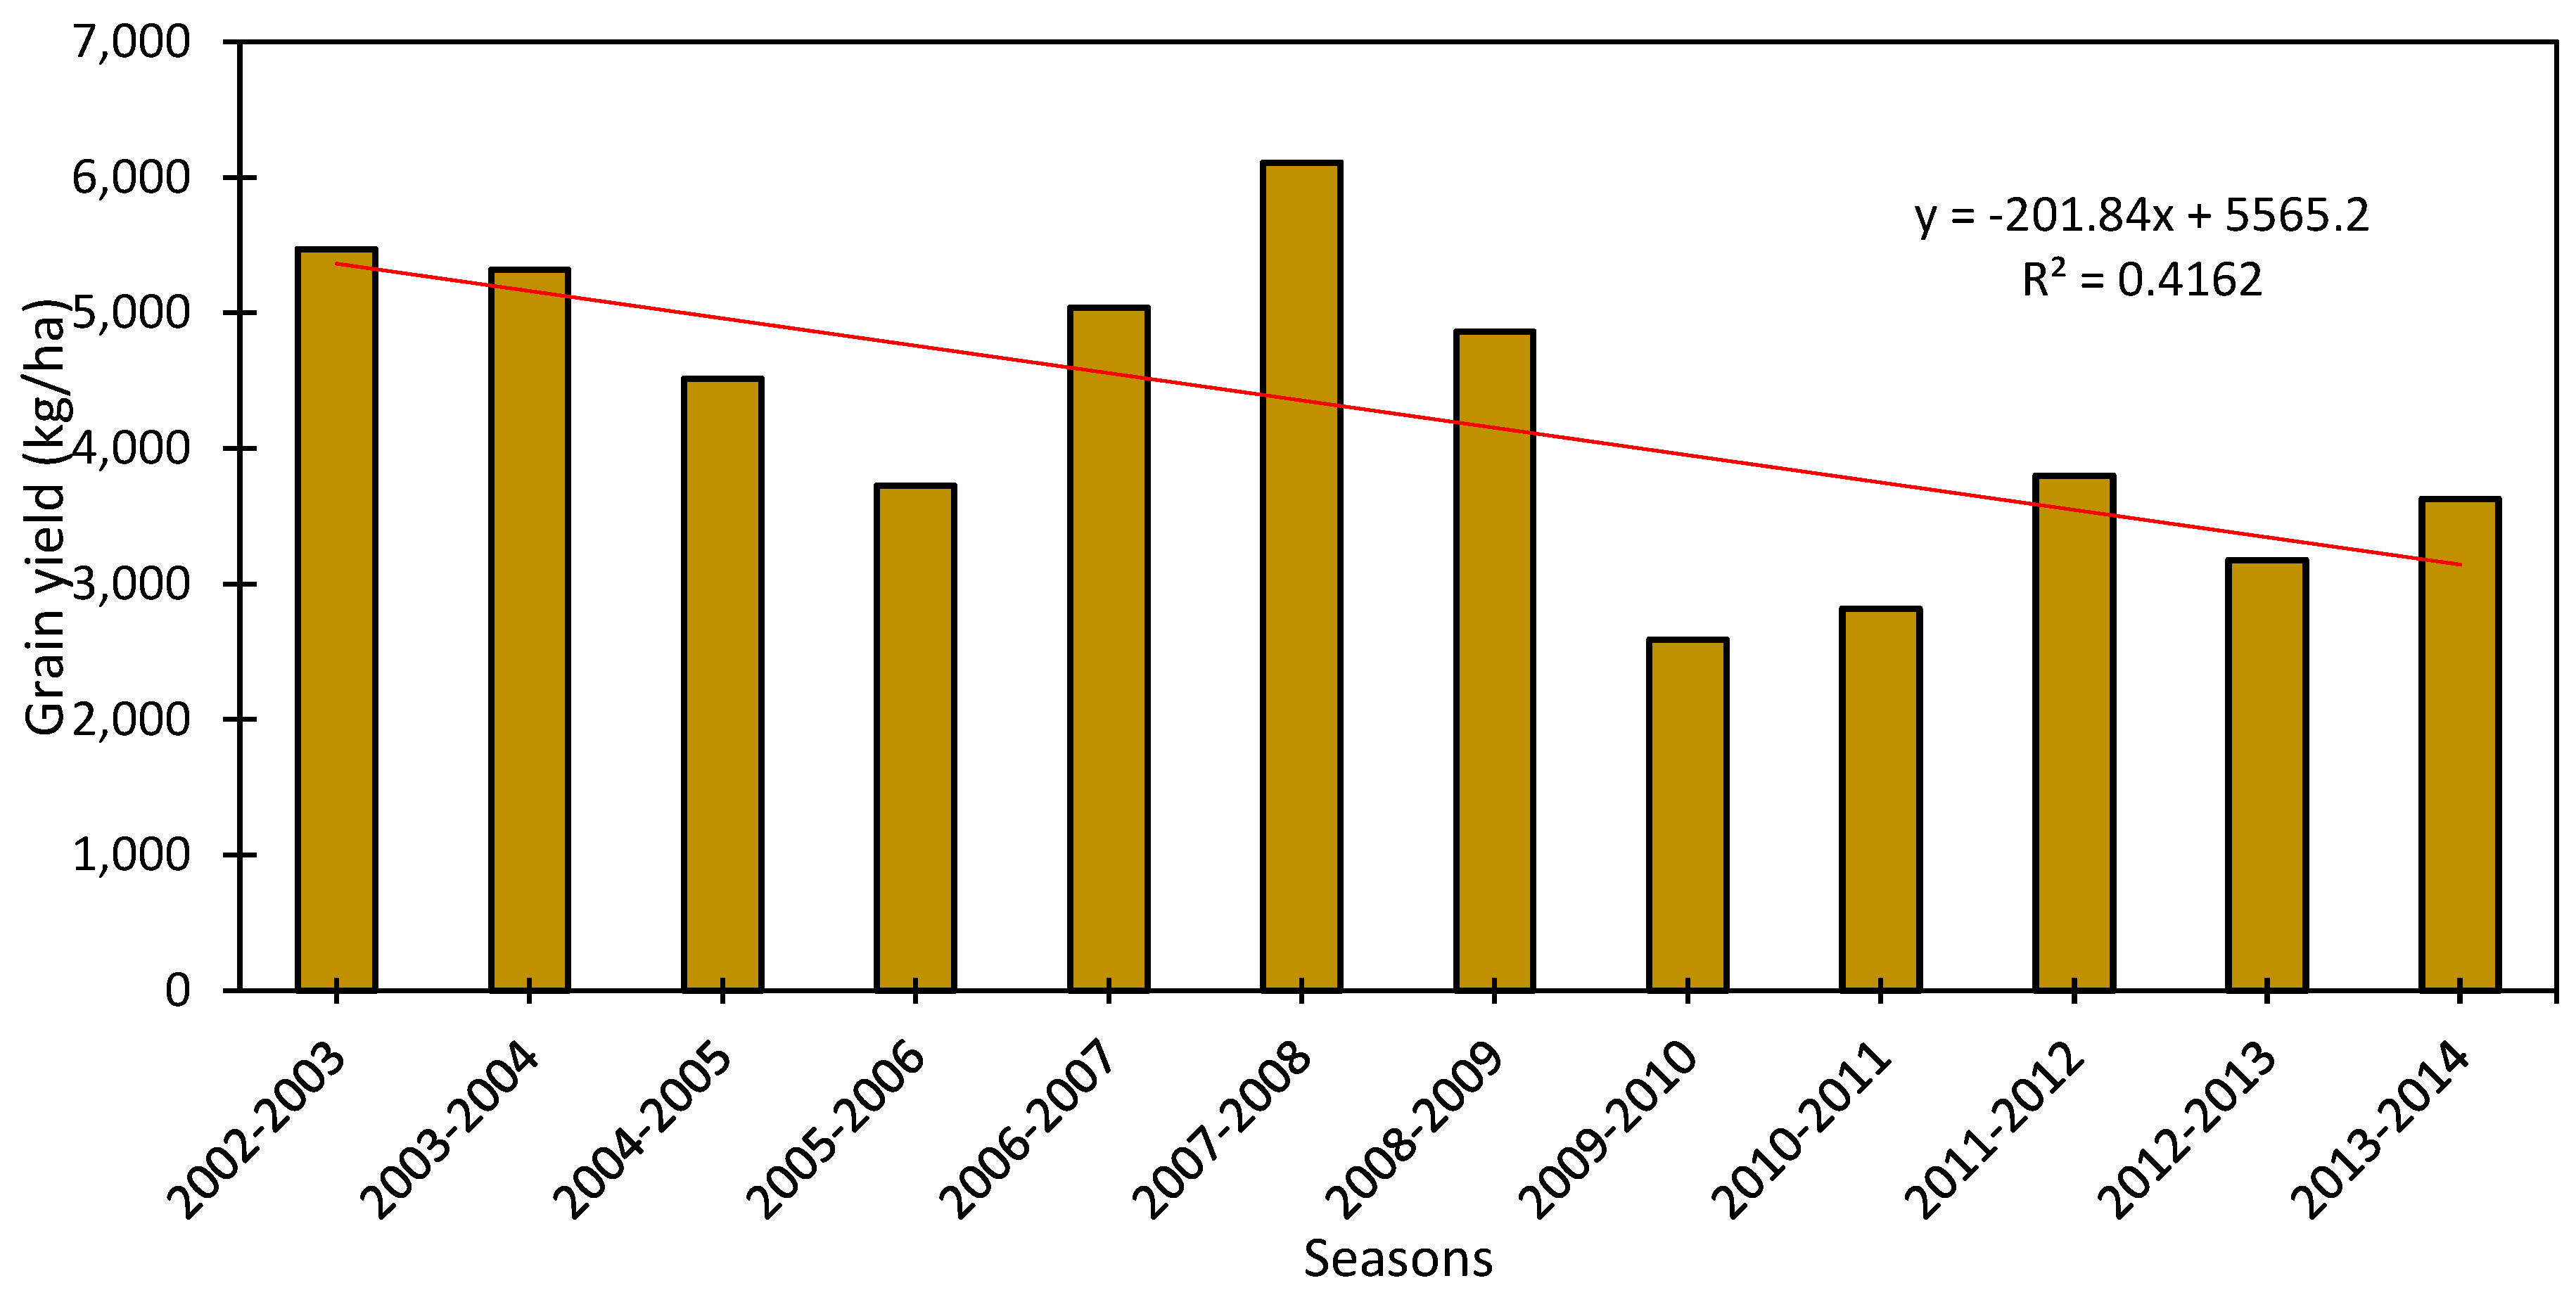
3.4. Long-Term Winter Wheat Yield

Winter wheat yield varied significantly with varieties and seasons and ranged from 1843.1 to 7085.7 kg/ha. Grain yield LSD values were 1232, 1507, 973, 1103, 1125, 1008, 935, 1025, 1088, 960, 1324, and 338 kg/ha for the respective growing seasons from 2002–2003 to 2013–2014. The variety TAM107 obtained the highest average yield of 4.983 kg/ha followed by Scout 66 with 4121.1 kg/ha and Kharkof with 3655.6 kg/ha. Kharkof grain yield varied from 5683.5 to 1834.1 kg/ha; Scout 66 grain yield varied from 2500.2 to 6360.3 kg/ha; TAM107 grain yield varied from 2743.4 to 7085.7 kg/ha (Figure 4). The highest seasonal yield of Kharkof was obtained in 2002–2003, while the Scout 66 and TAM107 showed their highest yield during the 2007–2008 season. Among the three varieties used in this study, TAM107 showed significantly higher yield from 2005 to 2009 and in 2012 and 2013. Overall Winter wheat grain yield decreased with years as shown in Figure 5 and this trend is likely biased by the 2011 and 2012 years which historic drought years. Wheat yield show poor relationship with total water supply (Table 4). The findings of this study are greater than the results reported by Graybosch and Peterson [6] who found average Kharkof grain yield for the 1959–2008 period that varied from 1755 to 2918 and averaged 2347 kg/ha across the Great Plains of North America. Morgan [28] reported winter wheat grain yield of seven genotypes varying from 3800 to 7400 kg/ha averaged 3900 kg/ha. Zhong and Shangguan [29] indicated winter wheat grain yield range of 4162–7597 kg/ha and 5407–8199 kg/ha during two growing seasons using two genotypes on the Loess Plateau, China. Baenziger et al. [30] reported Scout 66 yield of 2795 kg/ha in Southeast, 3581 kg/ha in West Central, 2217 kg/ha in South Central and 3144 kg/ha in West. Peck and Kirkham [31] reported that irrigated winter wheat yield averaged 4470 kg/ha under modified irrigation, 3640 kg/ha under normal irrigation and 1660 kg/ha under rainfed conditions at the at the Panhandle Research Station, Goodwell, Oklahoma. Irrigation management might have impacted the great variation in winter wheat yield with year as the application of irrigation early spring may increase excessive biomass production with reduced harvest index at crop maturity [32]. Liu et al. [9] found spatial variability in the irrigated winter wheat yield across China and ranged from 2236 to 4737 kg/ha in the NCP provinces, from 1563 to 4135 kg/ha in the Northwest provinces, from 1281 to 3483 kg/ha in the Southwest provinces, and from 1544 to 3425 kg/ha in the Southeast provinces. The decreasing trend in winter wheat yield revealed by the present study is in agreement with some previous studies. Decrease in winter wheat was reported by Porter and Gawith [33] and Hatfield et al. [34] who indicated that shorter growing period and decrease in plant photosynthesis and carbohydrate accumulation are the main causes due to global warming that is shortening wheat phenology [35]. Yang et al. [36] indicated that wheat yield under full irrigation had no significant decreasing trend for the period of 1955 to 2006. Fogarasi et al. [37] showed that slightly decreasing yields is projected for the next three decades for winter wheat and maize. Decrease of diurnal air temperature range resulted in 2.9% decrease in maize winter wheat production in China from 1961 to 2010 [38].

3.5. Winter Wheat Crop-, Irrigation-, and Evapotranspiration Water Use Efficiency

Winter wheat CWUE varied with seasons and varieties. Tam107 showed the highest CWUE amount the tested varieties. It ranged from 0.22 to 0.70 kg/m3 for Kharkof, from 0.30 to 0.90 kg/m3 for Scout 66 and from 0.34 to 1.01 kg/m3 from TAM107 and averaged 0.45, 0.53, and 0.64 kg/m3 for the respective wheat varieties. CWUE had linearly decreasing relationship with seasonal water supply (Figure 6) and a positive relationship with grain yield with R2 values of 0.87, 0.88 and 0.85 for Kharkof, Scout 66 and TAM107, respectively (Figure 7a). CWUE varied from 0.36 to 1.42 kg/m3 across China with the greatest CWUE obtained in the North China Plain provinces and the lowest Liu et al. [9].
IWUE of each of the winter wheat varieties is presented in Table 5. IWUE varied from 0.26 to 0.90 kg/m3 for Kharkof, from 0.35 to 1.05 kg/m3 for Scout 66, and from 0.40 to 1.17 kg/m3 for TAM107. Overall, TAM107 obtained higher average IWUE value of 0.8 than Kharkof and Scout 66 which had similar IWUE of 0.6 kg/m3. The greatest IWUE was obtained in 2003–2004 for Kharkof, 2007–2008 for Scout 66 and TAM107 (Table 5). Winter wheat IWUE showed decreasing linear relationship with the increasing seasonal irrigation amount (Figure 6b). In addition, wheat IWUE linearly increased with increasing grain yield with R2 values of 0.69, 0.81, and 0.77 for Kharkof, Scout 66 and TAM107, respectively (Figure 7b). The results of the study are in agreement with Sun et al. (2006) [8] who reported IWUE values varying from 0.23 to 0.82 kg/m3 in North China Plain.
Winter wheat ETWUE was dependent on wheat variety with inter-annual variation and averaged 0.46, 0.52 and 0.63 kg/m3 for Kharkof, Scout 66 and TAM107, respectively (Table 5). The findings of this study are lower than the results reported in the literature. This might be due to zero production under rainfed conditions under the semiarid condition of Farmington whenever under rainfed, winter wheat could emerge, evapotranspire, but could not survive the drought in contrast to other locations where rainfed production is possible. Therefore, the denominator of the ETWUE equation was overestimated when assuming null ETc under rainfed production. ETWUE had linear relationship with wheat grain yield with R2 values of 0.93, 0.91, and 0.89 for the Kharkof, Scout 66, and TAM107, respectively (Figure 7c). ETWUE of 1.84 kg/m3 were achieved with an average wheat yield of 7420 kg/ha and seasonal evapotranspiration (ET) of 404 mm in North China Plain under extremely late planting [39]. Zhang et al. [40] reported positive linear relationship between ETWUE and winter wheat grain yield in the Hebei Plain, China. Li et al. [41] reported ETWUE range of 1.57–1.75 kg/m3 and Zhang et al. [42] reported ETWUE rand 1.6–1.8 kg/m3 North China Plain. Bian et al. [43] indicated that ETWUE was function of planting pattern and varied from 1.86 to 2.22 kg/m3. Zhang et al. [44] reported winter wheat ETWUE that varied from 0.98 to 1.22 kg/m3 for rainfed conditions and from 1.20 to 1.40 kg/m3 under irrigation settings while Liu et al. [45] reported ETWUE values varying from 0.97 to 2.08 kg/m3 in China Plain. Zhang et al. [46] reported WUE values for winter wheat between 0.93 and 1.51 kg m3 and Wang et al. [47] found that ETWUE was between 0.70 and 1.30 kg/m3 in the North China Plain (NCP). For example, with the irrigated wheat in the US Southern Plains, ETWUE was 0.50–1.20 kg/m3 with a yield of 3000–8000 kg/ha [13,14,48]. Xue et al. [26] reported irrigated a winter wheat ETWUE range of 0.60–0.71 kg/m3 in the U.S. Southern High Plains.

4. Conclusions

A long-term field experiment was conducted from winter wheat season 2002–2003 to 2013–2014 to evaluate grain yield and crop water use efficiency (CWUE), evapotranspiration water use efficiency (ETWUE), and irrigation water use efficiency (IWUE) of three winter wheat varieties (Kharkof, Scout 66 and TAM107) under sprinkler irrigation. The varieties were arranged in randomized complete bloc design with four replications. Evapotranspiration-based irrigation was adopted, and seasonal irrigation amount recorded. The results showed inter-annual variation in seasonal precipitation, irrigation, evapotranspiration yield, and water productivity. Seasonal precipitation varied from 80 to 190 mm, and the seasonal irrigation amount varied from 511 to 787 mm. Winter wheat daily ETc averaged 2.7 mm/day and varied from 0.06 to 14.5 mm/day and the seasonal evapotranspiration varied from 625 to 890 mm. Overall, winter wheat grain yield varied from 1843.1 to 7085.7 kg/ha was varietal dependent and decreased with growing season. Winter wheat variety TAM107 obtained the highest grain yield. Winter wheat CWUE varied from 0.22 to 1.01 kg/m3, IWUE varied from 0.26 to 1.17 kg/m3, and ETWUE varied from 0.29 to 0.92 kg/m3. CWUE and IWUE decreased linearly with seasonal water supply and seasonal irrigation amount, respectively. All three winter wheat varieties’ CWUE, IWUE, and ETWUE had a positive relationship with grain yield. The results of this study can serve as guidelines for winter wheat producers and researchers in the semiarid Four Corners region. However, the information provided is limited, and additional research needs to the conducted for optimizing winter wheat seasonal irrigation management, fertilization management, and winter wheat sowing date to reduce the yield gap between New Mexico winter wheat actual yield and the national average yield.

Author Contributions

M.O., C.O., M.W., D.S. and D.B. designed and conducted all field trials with field data collection. K.D., S.A., K.K., M.O., S.I. and K.L. analyzed the data, wrote and revised the manuscript.

Funding

This research received no external funding.

Acknowledgments

We completed this work with the support of New Mexico State University (NMSU) and the Agricultural Science Center at Farmington and all the staff.

Conflicts of Interest

The authors declare no conflict of interest.

References

  1. United States Department of Agriculture; National Agricultural Statistics Service. Small Grains 2017 Summary (September 2017) 5 USDA. In Proceedings of the USDA NASS Data Users’ Meeting, Kansas City, MI, USA, 24 October 2017.
  2. Irmak, S.; Djaman, K.; Sharma, V. Evapotranspiration and single (normal) and basal crop coefficients of winter wheat (Triticum aestivum L.). Trans. ASABE 2015, 58, 1047–1066. [Google Scholar]
  3. United States Department of Agriculture. New Mexico Annual Bulletin—USDA; National Agricultural Statistics Service in Cooperation with New Mexico Department of Agriculture: Washington, DC, USA, 2013.
  4. United States Department of Agriculture. New Mexico Annual Bulletin—USDA; National Agricultural Statistics Service in Cooperation with New Mexico Department of Agriculture: Washington, DC, USA, 2015.
  5. Lobell, D.B.; Sibley, A.; Ortiz-Monasterio, J.I. Extreme heat effects on wheat senescence in India. Nat. Clim. Chang. 2012, 2, 186–189. [Google Scholar] [CrossRef]
  6. Graybosch, R.A.; Peterson, C.J. Genetic improvement in winter wheat yields in the Great Plains of North America, 1959–2008. Crop Sci. 2010, 50, 1882–1890. [Google Scholar] [CrossRef]
  7. Chen, S.; Sun, H.; Shao, L.; Zhang, X. Performance of winter wheat under different irrigation regimes associated with weather conditions in the North China Plain. Aust. J. Crop Sci. 2014, 8, 550–557. [Google Scholar]
  8. Sun, H.Y.; Liu, C.M.; Zhang, X.Y.; Shen, Y.J.; Zhang, Y.Q. Effects of irrigation on water balance, yield and WUE of winter wheat in the North China Plain. Agric. Water Manag. 2006, 85, 211–218. [Google Scholar] [CrossRef]
  9. Liu, J.; David Wiberg, D.; Zehnder, A.J.B.; Yang, H. Modeling the role of irrigation in winter wheat yield, crop water productivity, and production in China. Irrig. Sci. 2007, 26, 21–33. [Google Scholar] [CrossRef]
  10. Qiu, G.Y.; Wang, L.; He, X.; Zhang, X.; Chen, S.; Chen, J.; Yang, Y. Water use efficiency and evapotranspiration of winter wheat and its response to irrigation regime in the north China plain. Agric. For. Meteorol. 2008, 148, 1848–1859. [Google Scholar] [CrossRef]
  11. Nielsen, D.C.; Vigil, M.F.; Anderson, R.L.; Bowman, R.A.; Benjamin, J.G.; Halvorson, A.D. Cropping system influence on planting water content and yield of winter wheat. Agron. J. 2002, 94, 962–967. [Google Scholar] [CrossRef]
  12. Nielsen, D.C.; Vigil, M.F.; Benjamin, J.G. Evaluating decision rules for dryland rotation crop selection. Field Crops Res. 2011, 120, 254–261. [Google Scholar] [CrossRef]
  13. Musick, J.T.; Jones, O.R.; Stewart, B.A.; Dusek, D.A. Water-Yield relationship for irrigated and dryland wheat in the US southern plains. Agron. J. 1994, 86, 980–986. [Google Scholar] [CrossRef]
  14. Howell, T.A.; Steiner, J.L.; Schneider, A.D.; Evett, S.R. Evapotranspiration of irrigated winter wheat: Southern high plains. Trans. ASAE 1995, 38, 745–759. [Google Scholar] [CrossRef]
  15. Kang, G.; Wang, C.; Sun, G.; Wang, Z. Salicylic acid changes activities of H2O2 metabolizing enzymes and increases the chilling tolerance of banana seedlings. Environ. Exp. Bot. 2003, 50, 9–15. [Google Scholar] [CrossRef]
  16. Drerup, P.; Brueck, H.S.; Scherer, H.W. Evapotranspiration of winter wheat estimated with the FAO 56 approach and NDVI measurements in a temperate humid climate of NW Europe. Agric. Water Manag. 2017, 192, 180–188. [Google Scholar] [CrossRef]
  17. Jensen, M.E. Water consumption by agricultural plants. Water Defic. Plant Growth 1968, 2, 1–22. [Google Scholar]
  18. Allen, R.G.; Pereira, L.S.; Raes, D.; Smith, M. Crop evapotranspiration: Guide-lines for computing crop water requirements. In FAO Irrigation and Drainage Paper; No. 56; FAO: Rome, Italy, 1998; 300p. [Google Scholar]
  19. ASCE-EWRI. The ASCE standardized reference evapotranspiration equation. In Standardization of Reference Evapotranspiration Task Committee Final Report; Allen, R.G., Walter, I.A., Elliot, R.L., Eds.; Environmental and Water Resources Institute (EWRI) of the American Society of Civil Engineers, ASCE: Reston, VA, USA, 2005; p. 213. [Google Scholar]
  20. SAS/STAT 9.3. User’s Guide; SAS Institute Inc.: Cary, NC, USA, 2011. [Google Scholar]
  21. Musick, J.T.; Porter, K.B. Wheat. In Irrigation of Agricultural Crops. Agronomy Monograph No. 30; Steward, B.A., Nielson, D.R, Eds.; ASA; CSSA; SSSA: Madison, WI, USA, 1990; pp. 597–638. [Google Scholar]
  22. Howell, T.A.; Steiner, J.L.; Schneider, A.D.; Evett, S.R.; Tolk, J.A. Seasonal and maximum daily evapotranspiration of irrigated winter wheat, sorghum, and corn—Southern High Plains. Trans. ASAE 1997, 40, 623–634. [Google Scholar] [CrossRef]
  23. Schlegel, J.A.; Assefa, Y.; Haag, L.A.; Thompson, C.R.; Stone, L.R. Long-Term Tillage on Yield and Water Use of Grain Sorghum and Winter Wheat. Agron. J. 2018, 110, 269–280. [Google Scholar] [CrossRef]
  24. Ko, J.; Piccinni, G.; Marek, T.; Howell, T. Determination of growth-stage-specific crop coefficients (Kc) of cotton and wheat. Agric. Water Manag. 2009, 96, 1691–1697. [Google Scholar] [CrossRef]
  25. Luo, M.C.; Ma, Y.; You, F.M.; Anderson, O.D.; Kopecký, D.; Šimková, H.; Šafář, J.; Doležel, J.; Gill, B.; McGuir, P.E.; et al. Feasibility of physical map construction from fingerprinted bacterial artificial chromosome libraries of polyploid plant species. BMC Genom. 2010, 11, 122. [Google Scholar] [CrossRef] [PubMed]
  26. Xue, Q.; Rudd, J.C.; Liu, S.; Jessup, K.E.; Devkota, R.N.; Mahano, J.R. Yield determination and water-use efficiency of wheat under water-limited conditions in the U.S. Southern High Plains. Crop Sci. 2014, 54, 34–47. [Google Scholar] [CrossRef]
  27. Howell, T.A.; Tolk, J.A.; Evett, S.R.; Copeland, K.S.; Dusek, D.A. Evapotranspiration of deficit irrigated sorghum and winter wheat. In Proceedings of the USCID Fourth International Conference on Irrigation and Drainage. The Role of Irrigation and Drainage in a Sustainable Future, Sacramento, CA, USA, 3–6 October 2007; Clemmens, A.J., Ed.; U.S. Committee on Irrigation and Drainage (USDID): Denver, CO, USA, 2007; pp. 223–239. [Google Scholar]
  28. Morgan, C.L. Mid-parent advantage and heterosis in F1 hybrids of wheat from crosses among old and modern varieties. J. Agric. Sci. 1998, 130, 287–295. [Google Scholar] [CrossRef]
  29. Zhong, Y.; Shangguan, Z. Water Consumption Characteristics and Water Use Efficiency of Winter Wheat under Long-Term Nitrogen Fertilization Regimes in Northwest China. PLoS ONE 2014, 9, e98850. [Google Scholar] [CrossRef] [PubMed]
  30. Baenziger, P.S.; Graybosch, R.A.; Regassa, T.; Klein, R.N.; Kruger, G.R.; Santra, D.K.; Xu, L.; Rose, D.J.; Wegulo, S.N.; Jin, Y.; et al. Registration of ‘NE06545′ (Husker Genetics Brand Freeman) hard red winter wheat. J. Plant Regist. 2014, 8, 279–284. [Google Scholar] [CrossRef]
  31. Peck, R.A.; Kirkham, M.B. Water relations and yield of winter wheat grown under three water regimes in the high plains. Proc. Okla. Acad. Sci. 1979, 59, 53–59. [Google Scholar]
  32. Pope, D.; Hay, D. Irrigation. In Wheat Production Handbook; C-529, Coop. Ext. Serv.; Kansas State University: New York, NY, USA, 1976; pp. 12–15. [Google Scholar]
  33. Porter, J.R.; Gawith, M. Temperatures and the growth and development of wheat: A review. Eur. J. Agron. 1999, 10, 23–36. [Google Scholar] [CrossRef]
  34. Hatfield, J.L.; Boote, K.J.; Kimball, B.A.; Ziska, L.H.; Izaurralde, R.C.; Ort, D.; Thomson, A.M; Wolfe, D. Climate impacts on agriculture: Implications for crop production. Agron. J. 2011, 103, 351–370. [Google Scholar] [CrossRef]
  35. Hou, R.X.; Ouyang, Z.; Li, Y.; Wilson, G.; Li, H. Is the change of winter wheat yield under warming caused by shortened reproductive period? Ecol. Evol. 2012, 2, 2999–3008. [Google Scholar] [CrossRef] [PubMed] [Green Version]
  36. Yang, X.; Chen, C.; Luo, Q.; Li, L.; Yu, Q. Climate change effects on wheat yield and water use in oasis cropland. Int. J. Plant Prod. 2011, 5, 83–94. [Google Scholar]
  37. Fogarasi, J.; Kemény, G.; Molnár, A.; Keményné, H.Z.; Zubor-Nemes, A.; Kiss, A. Modelling climate effects on Hungarian wheat and maize yields. Stud. Agric. Econom. 2016, 118, 85–90. [Google Scholar] [CrossRef]
  38. Chen, C.; Zhou, G.S.; Pang, Y.M. Impacts of climate change on maize and winter wheat yields in China from 1961 to 2010 based on provincial data. J. Agric. Sci. 2015, 153, 825–836. [Google Scholar] [CrossRef]
  39. Wang, B.; Zhang, Y.; Hao, B.; Xu, X.; Zhao, Z.; Wang, Z.; Xue, Q. Grain Yield and Water Use Efficiency in Extremely-Late Sown Winter Wheat Cultivars under Two Irrigation Regimes in the North China Plain. PLoS ONE 2016, 11, e0153695. [Google Scholar] [CrossRef] [PubMed]
  40. Zhang, S.; Zhao, H.; Lei, H.; Shao, H.; Liu, T. Winter wheat productivity evaluated by 605 the developed remote sensing evapotranspiration model in Hebei Plain, China. Sci. World J. 2015, 2015, 384086. [Google Scholar] [CrossRef] [PubMed]
  41. Li, W.H.; Yang, J.; Gu, X. Expression divergence between duplicate genes. Trends Genet. 2005, 21, 602–607. [Google Scholar] [CrossRef] [PubMed]
  42. Zhang, Y.P.; Zhang, Y.H.; Wang, Z.M.; Wang, Z.J. Characteristics of canopy structure and contributions of non-leaf organs to yield in winter wheat under different irrigated conditions. Field Crops Res. 2011, 123, 187–195. [Google Scholar] [CrossRef]
  43. Bian, C.; Ma, C.; Liu, X.; Gao, C.; Liu, Q.; Yan, Z.; Li, Q. Responses of winter wheat yield and water use efficiency to irrigation frequency and planting pattern. PLoS ONE 2016, 11, e0154673. [Google Scholar] [CrossRef] [PubMed]
  44. Zhang, H.; Wang, X.; You, M.Z.; Liu, C.M. Water–yield relations and water-use efficiency of winter wheat in the North China Plain. Irrig. Sci. 1999, 19, 37–45. [Google Scholar] [CrossRef]
  45. Liu, H.J.; Yu, L.P.; Luo, Y.; Wang, X.P.; Huang, G.H. Responses of winter wheat (Triticum aestivum L.) evapotranspiration and yield to sprinkler irrigation regimes. Agric. Water Manag. 2011, 98, 483–492. [Google Scholar] [CrossRef]
  46. Zhang, J.H.; Sui, X.Z.; Li, B.; Su, B.L.; Li, J.M.; Zhou, D.X. An improved water-use efficiency for winter wheat grown under reduced irrigation. Field Crops Res. 1998, 59, 91–98. [Google Scholar] [CrossRef]
  47. Wang, H.; Zhang, L.; Dawes, W.R.; Liu, C. Improving water use efficiency of irrigated crops in the North China Plain measurements and modeling. Agric. Water Manag. 2001, 48, 151–167. [Google Scholar] [CrossRef]
  48. Eck, H.V. Winter wheat response to nitrogen and irrigation. Agron. J. 1988, 80, 902–908. [Google Scholar] [CrossRef]
Figure 1. Trends in (a) (2002–2014) average daily air temperature and (b) thermal unit from September 1st to July 31st.
Agronomy 08 00096 g001
Figure 2. Trends in the 2002–2014 period average daily reference evapotranspiration at the study site.
Agronomy 08 00096 g002
Figure 3. Trends in plant height of the three winter wheat varieties under sprinkler irrigation.
Agronomy 08 00096 g003
Figure 4. Trends in grain yield of the three winter wheat varieties under sprinkler irrigation.
Agronomy 08 00096 g004
Figure 5. Trends in winter wheat average grain yield under sprinkler irrigation.
Agronomy 08 00096 g005
Figure 6. Relationship between (a) winter wheat crop water use efficiency (CWUE) and the total water supply, (b) irrigation water use efficiency (IWUE) and the seasonal irrigation amount.
Agronomy 08 00096 g006
Figure 7. Relationship between winter wheat (a) crop water use efficiency (CWUE), (b) irrigation water use efficiency (IWUE), and (c) evapotranspiration water use efficiency and grain yield (ETWUE).
Agronomy 08 00096 g007
Table 1. Seasonal average climatic conditions (September–July) at the study site during winter wheat growing seasons from 2002 to 2014.
Yearu2TmaxTminTmeanRHmeanRs
(m/s)(°C)(°C)(°C)(%)(MJ m−2)
2002–20032.812.02.17.068.814.6
2003–20042.912.62.77.759.015.4
2004–20052.712.01.76.861.915.6
2005–20062.912.52.57.558.115.3
2006–20072.813.03.48.260.315.0
2007–20083.313.82.48.156.616.2
2008–20093.716.63.510.046.816.1
2009–20103.715.52.79.152.615.5
2010–20113.815.92.99.446.116.1
2011–20123.415.33.19.256.615.4
2012–20133.714.62.08.360.115.2
2013–20143.314.31.98.164.014.8
Average3.314.02.68.357.615.4
u2, wind speed; Tmax, maximum air temperature; Tmin, Minimum air temperature; RHmean, mean relative humidity; Rs, solar radiation.
Table 2. Wheat planting and harvesting date, and the applied fertilizer rate, precipitation, and irrigation applied during the 2002–2014 period.
YearPlantingHarvestingN-P2O5-K2O-ZnSO4PrecipitationIrrigationWater Supply
DateDate(kg/ha)(mm)(mm)(mm)
20022-October-2
20036-October-330-July-3280-57-67-0164559723
20046-October-320-July-04151-58-34-0151610761
200527-September-519-July-5151-58-34-0167578745
20064-October-620-July-6103-56-65-080511591
20074-October-726-July-7166-54-64-19190605795
200824-September-820-July-8146-54-63-797686783
200915-September-911-August-9168-58-67-0122711833
201015-September-1010-August-10168-58-67-0130635765
201116-September-111-August-11185-0-0-0142704846
201211-September-121-August-12112-58-67-16114737851
201316-September-1326-July-13230-117-135-4089732821
2014 13-July-14233-45-54-0107787894
Table 3. Daily maximum, minimum, and average seasonal actual evapotranspiration (ETc) and seasonal average ETc.
SeasonDaily ETc (mm)Seasonal ETc
MaxMinAverage(mm)
2002–200310.50.12.1626
2003–200411.40.12.6755
2004–200511.70.12.6738
2005–200614.50.12.5741
2006–200713.50.12.6768
2007–200813.20.12.8786
2008–200913.00.32.9884
2009–201010.00.22.6777
2010–201111.10.22.9887
2011–201211.10.22.6777
2012–201311.60.22.9866
2013–201412.70.23.1879
Table 4. Relationship between wheat grain yield and precipitation, seasonal irrigation, and total water supply.
VarietyTotal Water Supply
KharkofY = −5.1621X + 7701.1. R2 = 0.13
Scout 66Y = −1.7004X + 5453.7, R2 = 0.01
TAM107Y = −0.4897X + 5366.8, R2 = 0.0
AverageY = −13.527X + 15361, R2 = 0.45
Table 5. Trends in seasonal evapotranspiration, grain yield, irrigation water use efficiency, and evapotranspiration water use efficiency of three winter wheat varieties for the 2003–2014 period.
SeasonETc (mm)Yield (kg/ha)IWUE (kg/m3)ETWUE (kg/m3)
KharkofScout 66TAM107KharkofScout 66TAM107KharkofScout 66TAM107KharkofScout 66TAM107
2002–2003627.22626.12625.145683.54954.35771.90.610.530.620.910.790.92
2003–2004756.75755.27752.235054.65314.55590.50.900.951.000.670.700.74
2004–2005737.91739.14737.324039.44141.25362.00.660.680.880.550.560.73
2005–2006742.32740.88738.223391.03539.24239.50.590.610.730.460.480.57
2006–2007769.65768.56766.303844.75298.75966.00.751.041.170.500.690.78
2007–2008788.43786.82783.664881.26360.37085.70.811.051.170.620.810.90
2008–2009886.61884.57880.663614.34499.26478.30.530.660.940.410.510.74
2009–2010779.13777.51774.432424.62500.22836.40.340.350.400.310.320.37
2010–2011890.21887.97883.693109.72598.42743.40.490.410.430.350.290.31
2011–2012778.78777.21774.231834.13796.35755.90.260.540.820.240.490.74
2012–2013866.69865.79864.112996.82693.03837.60.410.370.520.350.310.44
2013–2014879.97878.86876.712993.33757.94128.70.410.510.560.340.430.47
Average792.0790.7788.13655.64121.14983.00.560.640.770.460.520.63

