Early-Season Soil Waterlogging and N Fertilizer Sources Impacts on Corn N Uptake and Apparent N Recovery Efficiency


1
Delta Research and Extension Center, Mississippi State University, Stoneville, MS 38776, USA
2
Division of Plant Sciences, University of Missouri, Novelty, MO 63460, USA
3
School of Natural Resources, University of Missouri, Columbia, MO 65211, USA
*
Author to whom correspondence should be addressed.
Agronomy 2018, 8(7), 102; https://doi.org/10.3390/agronomy8070102
Submission received: 10 June 2018
/
Accepted: 25 June 2018
/
Published: 27 June 2018
(This article belongs to the Special Issue Role of Plant Nutrients in Agronomic Crops)
Abstract
:Soil waterlogging resulting from extreme precipitation events creates anaerobic conditions that may inhibit plant growth and increase N losses. A three-year (2013–2015) field experiment was conducted in poorly-drained claypan soils to assess the effects of waterlogging [0 or 7-days waterlogging at V3 growth stage of corn (Zea mays L.)] and pre-plant application of different N fertilizer sources and post-waterlogging rescue N application (0 or 84 kg N ha−1 of urea plus urease inhibitor (NCU + UI) at V7) on chlorophyll SPAD meter (CM) readings, stomatal conductance, ear leaf and silage N concentrations, N uptake and apparent N recovery efficiency (ARE) of two corn hybrids with varying amounts of flood tolerance. Pre-plant N fertilizer sources included a non-treated control (CO), urea (NCU), urea plus nitrification inhibitor (NCU + NI) and polymer coated urea (PCU) applied at 168 kg N ha−1. In 7-days waterlogged plots, rescue N applications increased N uptake in PCU treatments 33% and 40% in 2013 and 2014, respectively, as well as in NCU by 48% in 2013. In 7-days waterlogged plots which received rescue N applications, NCU and PCU in 2013 resulted in higher N uptake than CO and NCU + NI by 47 to 77 kg ha−1. PCU had higher N uptake than NCU and NCU + NI by 78 and 72 kg ha−1 in 7-days waterlogged plots that received rescue N applications in 2014. Corn hybrid showed no differences in N uptake and ARE in our study. Our results indicate combining pre-plant N fertilizer source selection and rescue N applications may be a strategy to reduce possible decreases in corn N uptake caused by early season soil waterlogging in average rainfall years.
1. Introduction
Crop damage in the United States due to excess precipitation and flooding has caused significant historical crop losses and is projected to increase over the next 30 years because of increased incidence of extreme weather events leading to increased crop damage and off-farm loss of soil and nutrients from excess water [1,2,3]. Over 4.4 million hectares of crops were damaged during the US Midwest floods in 1993 and increased runoff of nutrients, such as nitrate, which contributed to hypoxia in the Gulf of Mexico [1,4]. Excessive rainfall events in the Midwest are expected to increase in the future, particularly during the spring. Dai et al. (2016) reported that an increase in early season precipitation during April, May and June is resulting in wetter soil conditions early in the growing season [5]. In addition to floods, excess soil moisture resulting from extreme weather events is also a major contributor to crop production losses [6]. A study conducted by Urban et al. (2015) over a 62-year (1950–2011) period reported that corn and soybean crop yields decreased by 1 to 3% due to excess spring moisture conditions during planting in the three Midwestern States of Illinois, Iowa and Indiana [7].
Soil waterlogging causes oxygen deficiency in soil resulting in hypoxic or anoxic conditions that inhibit plant growth by affecting photosynthesis, leaf stomatal conductance and respiration in plant roots [8]. Under waterlogged conditions, stomatal closure prevents leaf water deficits and wilting as well as limits CO2 in plant cells which consequently results in oxygen free radical accumulation. Roots grow near the soil surface as they are not able to exploit large soil volumes under waterlogged conditions [9]. Lack of oxygen availability for root respiration and the production of soil phytotoxins, which inhibit root formation and promote root decay, causes a reduction in overall root growth. Root conductance for water and nutrient uptake is decreased by waterlogging resulting in nutrient deficiency in plants [10,11]. Plant leaves can turn yellow due to a significant decrease in plant N content resulting from reduced root activity under waterlogged conditions [12]. Board (2008) reported that the main contributor to yield losses in soybean was N deficiency compared to any other nutrients (P, K, Ca, Mg, S and Zn) under waterlogged soil conditions [13]. Many studies have reported decreased plant N uptake resulting in transient N deficiency due to waterlogging, even when the plants were supplied with N applications at the time of sowing [14,15,16]. However, N fertilizer applications can increase crop grain yields and quality under soil waterlogged conditions [17,18,19]. Plant’s adaptive mechanisms to waterlogging, such as adventitious root growth and root re-growth may be enhanced and accelerated by N applications [20,21,22]. Nitrogen losses due to denitrification and leaching processes under waterlogged soil conditions can cause plant N deficiency and reduce plant N use efficiency (NUE) [23].
Nitrogen losses due to soil waterlogging may be reduced through the use of enhanced efficiency N fertilizers (EENFs) such as polymer-coated urea (PCU), urea plus a nitrification inhibitor (NI) or urea plus a urease inhibitor (UI). Detailed information about these EENFs is provided in Motavalli et al. (2008) [24]. Many studies have shown that EENFs can improve corn yields and NUE under wet soil conditions [25,26,27]. In-season N deficiencies caused by N losses under waterlogged soil conditions after initial pre-plant N applications may lower plant N uptake and reduce crop yields. However, in-season N applications can help improve grain yields if such N deficiencies occurred due to leaching or denitrification losses. Little is known about the beneficial effects of enhanced efficiency N fertilizers with short-term early-season flooding or waterlogging for reduction of N losses and improvement in N uptake and NUE for corn hybrids with varying tolerance to flooding under field conditions. Therefore, the objectives of this study were to assess the effects of early-season soil waterlogging and pre- and post-waterlogging applications of different N fertilizer sources (e.g., PCU and NI) with two different hybrids with different flood tolerance on corn N uptake and ARE.
2. Materials and Methods
2.1. Site Characterization
A field experiment was conducted at the University of Missouri’s Greenley Research Center (40°1′17″ N, 92°11′24.9″ W), near Novelty, Missouri, USA from 2013 to 2015 on a Putnam silt loam (fine, smectitic, mesic Vertic Albaqualfs), which is a poorly-drained claypan soil. A different adjacent field was used each year for the trial. Soil samples were collected before pre-plant fertilizer applications for initial soil characterization of the experimental fields in increments of 0–10, 10–20 and 20–30 cm depths using a stainless-steel push probe (Table 1). A total of four soil cores were taken from control plots of each replication and composited for initial soil characterization. The initial soil samples were air-dried, ground, passed through a stainless steel sieve with 2-mm openings and were analyzed by the University of Missouri Soil and Plant Testing Laboratory using standard soil testing procedures [28]. Daily weather conditions including daily average air temperature and total precipitation were obtained from a nearby automated weather station located at the University of Missouri’s Greenley Research Center.
2.2. Field Experiment
The experimental design was a randomized complete block with a split-split-split plot arrangement and three replications. Each block had two main plots that included waterlogging treatments of 0 (non-waterlogged) or 7-days. The size of each main plot was 24 × 24 m. Waterlogged soil conditions were established by forming earthen berms around plots with saturated soil treatments and flooding designated plots with irrigation water after the V3 growth stage of corn [29]. The depth of water ponded on the soil surface was 4 to 8 cm so that the plants were partially submerged and the upper one or two leaves were above the water surface to allow for leaf stomatal conductance and chlorophyll SPAD meter reading measurements. The berms were removed after the 7th day of waterlogging to allow ponded water to flow off the experimental site and not enter other plots.
The subplots consisted of different pre-plant N fertilizer sources and subplot size was 6 × 24 m. The pre-plant N fertilizer sources included in this study were non-coated urea (NCU), polymer coated urea (PCU; ESN®, Agrium, Inc., Calgary, AB, Canada) and non-coated urea plus a nitrification inhibitor (Instinct®, Dow AgroSciences, Indianapolis, IN, USA). A non-treated control (CO), which was not supplied with any N fertilizer, was also included in this study. Nitrogen was applied at 168 kg N ha−1 for the pre-plant N fertilizer treatments. All pre-plant fertilizer N was broadcast uniformly over the soil surface and was incorporated immediately after application to a 15 cm depth using a Tilloll 875 (Landoll Corp., Marysville, KS, USA).
Each subplot was randomly planted with two different hybrids creating a sub-sub plot. Each sub-sub plot measured 3 × 24 m. The two corn hybrids, Hybrid #1 (P1360HR) and Hybrid #2 (P1498AM) (Pioneer DuPont, Johnston, IA, USA), were selected based on the results of a greenhouse screening trial of eight commercially-available corn hybrids subjected to 21 days of waterlogged soil conditions that was conducted prior to the initiation of the field trial [30]. As a result of this screening, two corn hybrids were selected to provide one hybrid that showed tolerance (Hybrid #2; more flood tolerant hybrid) and another that was less tolerant (Hybrid #1; less flood tolerant hybrid) to flooded soil conditions [30]. The hybrids were planted with a row spacing of 76 cm at 81,512 seeds ha−1.
The rescue N fertilizer treatment was broadcast applied at the V7–V8 growth stage when corn was approximately 51 cm tall. The rate selected for the rescue N application was based on an estimate of an economically optimal N rate for yield response at the V7 corn growth stage that was determined using SPAD 502 chlorophyll meter (CM) readings (Konica Minolta, Hong Kong) taken after 7-days flooding in 2013 and from recommendation equations from Scharf et al. [31]. The sub-sub-sub plot measured 3 × 12 m. Other field treatments and crop management details are provided in Table 2. There were four rows of corn in each sub-sub plot. After the flooding treatment, the sub-sub plots were divided into two parts, each 12 m in length, and one of them was treated with 84 kg N ha−1 of a rescue post-flood broadcast application of urea plus NBPT (N-(n-butyl) thiophosphoric triamide) urease inhibitor (4.2 L Mg−1 urea; Agrotain®, Koch Agronomic Services, Wichita, KS, USA) while the other subplot did not receive any additional N.
Leaf CM readings were determined using a ten-plant average of the third leaf at the V3 crop stage during the first, third, fourth and seventh day of the waterlogging event. Leaf CM readings were also taken from the non-waterlogged plots at the same time to compare the difference with the waterlogging treatment. The chlorophyll SPAD meter (Konica Minolta, Hong Kong) measures light transmittance in the red (650 nm) and near infrared (940 nm) spectral bands and provides output in arbitrary SPAD units [31,32,33].
Leaf stomatal conductance was measured during the first, second, third, fourth and seventh day of the waterlogging period using a leaf porometer (Decagon Devices, Pullman, WA, USA). Stomatal conductance and CM readings were measured on the fully expanded third leaf of corn plants. In 2015, the leaf stomatal conductance measurements were not recorded on the first day of waterlogging due to rain. Chlorophyll meter readings and stomatal conductance measurements were taken during the day time in between 900 h to 1700 h.
Ear leaf N was determined by collecting ten ear leaves from each sub-sub-sub plot at the VT stage of corn growth. The collected ear leaves were dried, ground using a Wiley-Mill and analyzed for total N concentration by combustion using a LECO Truspec C/N analyzer (LECO Corp., St. Joseph, MI, USA).
At physiological maturity, whole aboveground plant tissue samples were collected from 3 m of one-row length for silage yield and then ground using a portable chopper. A sub-sample of each of the ground plant samples was collected for determining silage moisture content and total N. The collected plant tissue sub-samples were dried, ground in a Wiley Mill and analyzed for total N by the combustion method using a LECO Truspec C/N analyzer (LECO Corp., St. Joseph, MI, USA). Corn N uptake was calculated based on the silage yield and tissue N concentration. The NUE is expressed as apparent recovery efficiency (ARE). Apparent recovery efficiency can be calculated as:
where
- ARE = apparent recovery efficiency;
- N uptake (+N) = N uptake from treatments receiving N fertilizer applications
- N uptake (control) = N uptake from treatments that receive no N application
2.3. Statistical Analysis
Data were analyzed using the MIXED procedure of the SAS v9.4 statistical software program [34]. The MIXED procedure uses the restricted maximum likelihood (REML) estimation method. The UNIVARIATE procedure of SAS v9.4 statistical software was used for testing the normality of collected data. Replication was considered as random factor and all other factors were considered fixed. Data were combined over factors in the absence of an interaction between factors as indicated by the MIXED procedure results. Means were separated using Fisher’s Protected Least Significant Difference (LSD) at the p ≤ 0.10 probability level. The p-values from the MIXED procedure of SAS software for silage and ear leaf N concentration, corn N uptake and ARE are provided in Table 3. The ARE data in 2015 were analyzed separately for rescue treatments to account for homogeneity of variances. The N uptake data in 2015 was log transformed for analysis; however, the data was back transformed for presentation of results.
3. Results and Discussion
3.1. Climatic Conditions During the Growing Seasons
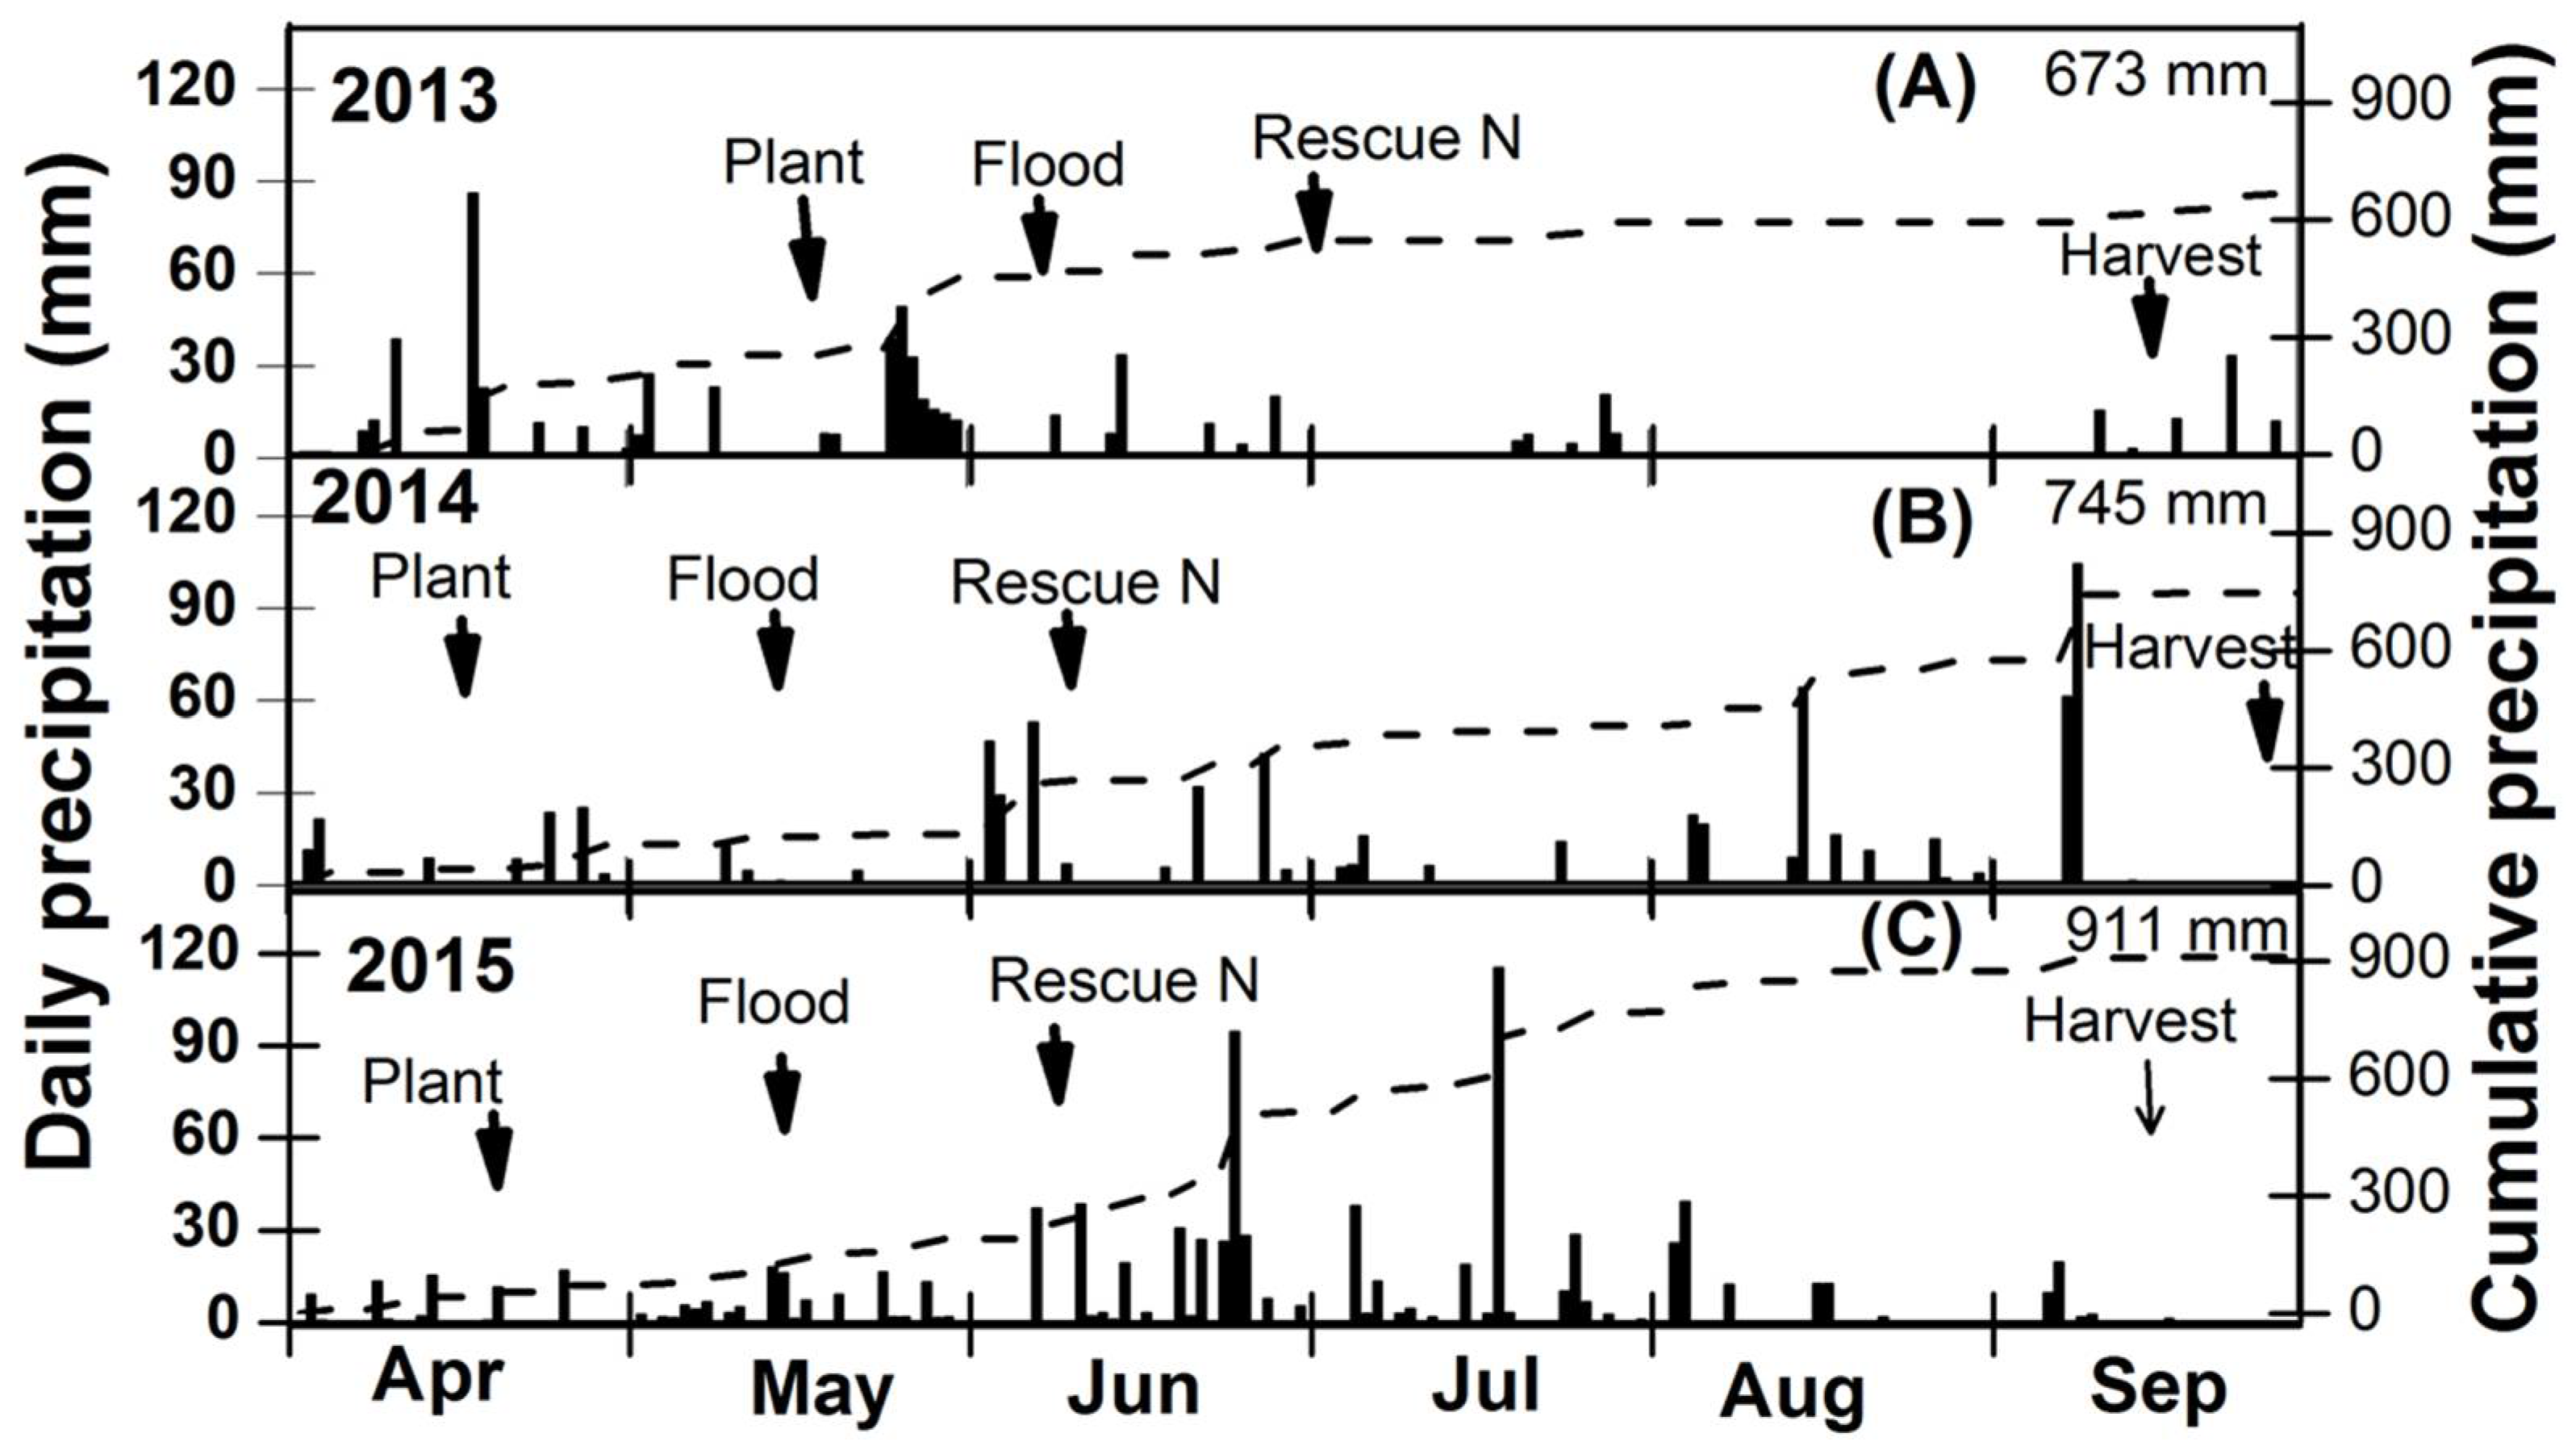
The cumulative precipitation was 238 and 166 mm higher in 2015 (911 mm) as compared to the cumulative precipitation in 2013 (673 mm) and 2014 (745 mm) (Figure 1A–C) during the growing season. The 2013 growing season had a highly variable distribution of precipitation, with extreme rains during the spring season followed by a long drought period in August and September (Figure 1A). The total precipitation was comparatively evenly distributed during the growing period in 2014 and 2015 (Figure 1B,C). Annual variation in precipitation amount and distribution resulted in different planting times for corn and the initiation of the waterlogging treatments. In 2014 and 2015, corn was planted almost a month before in April as compared to May 2013 which caused initiation of flooding in waterlogged treatments in the month of June 2013 than in May 2014 and 2015.
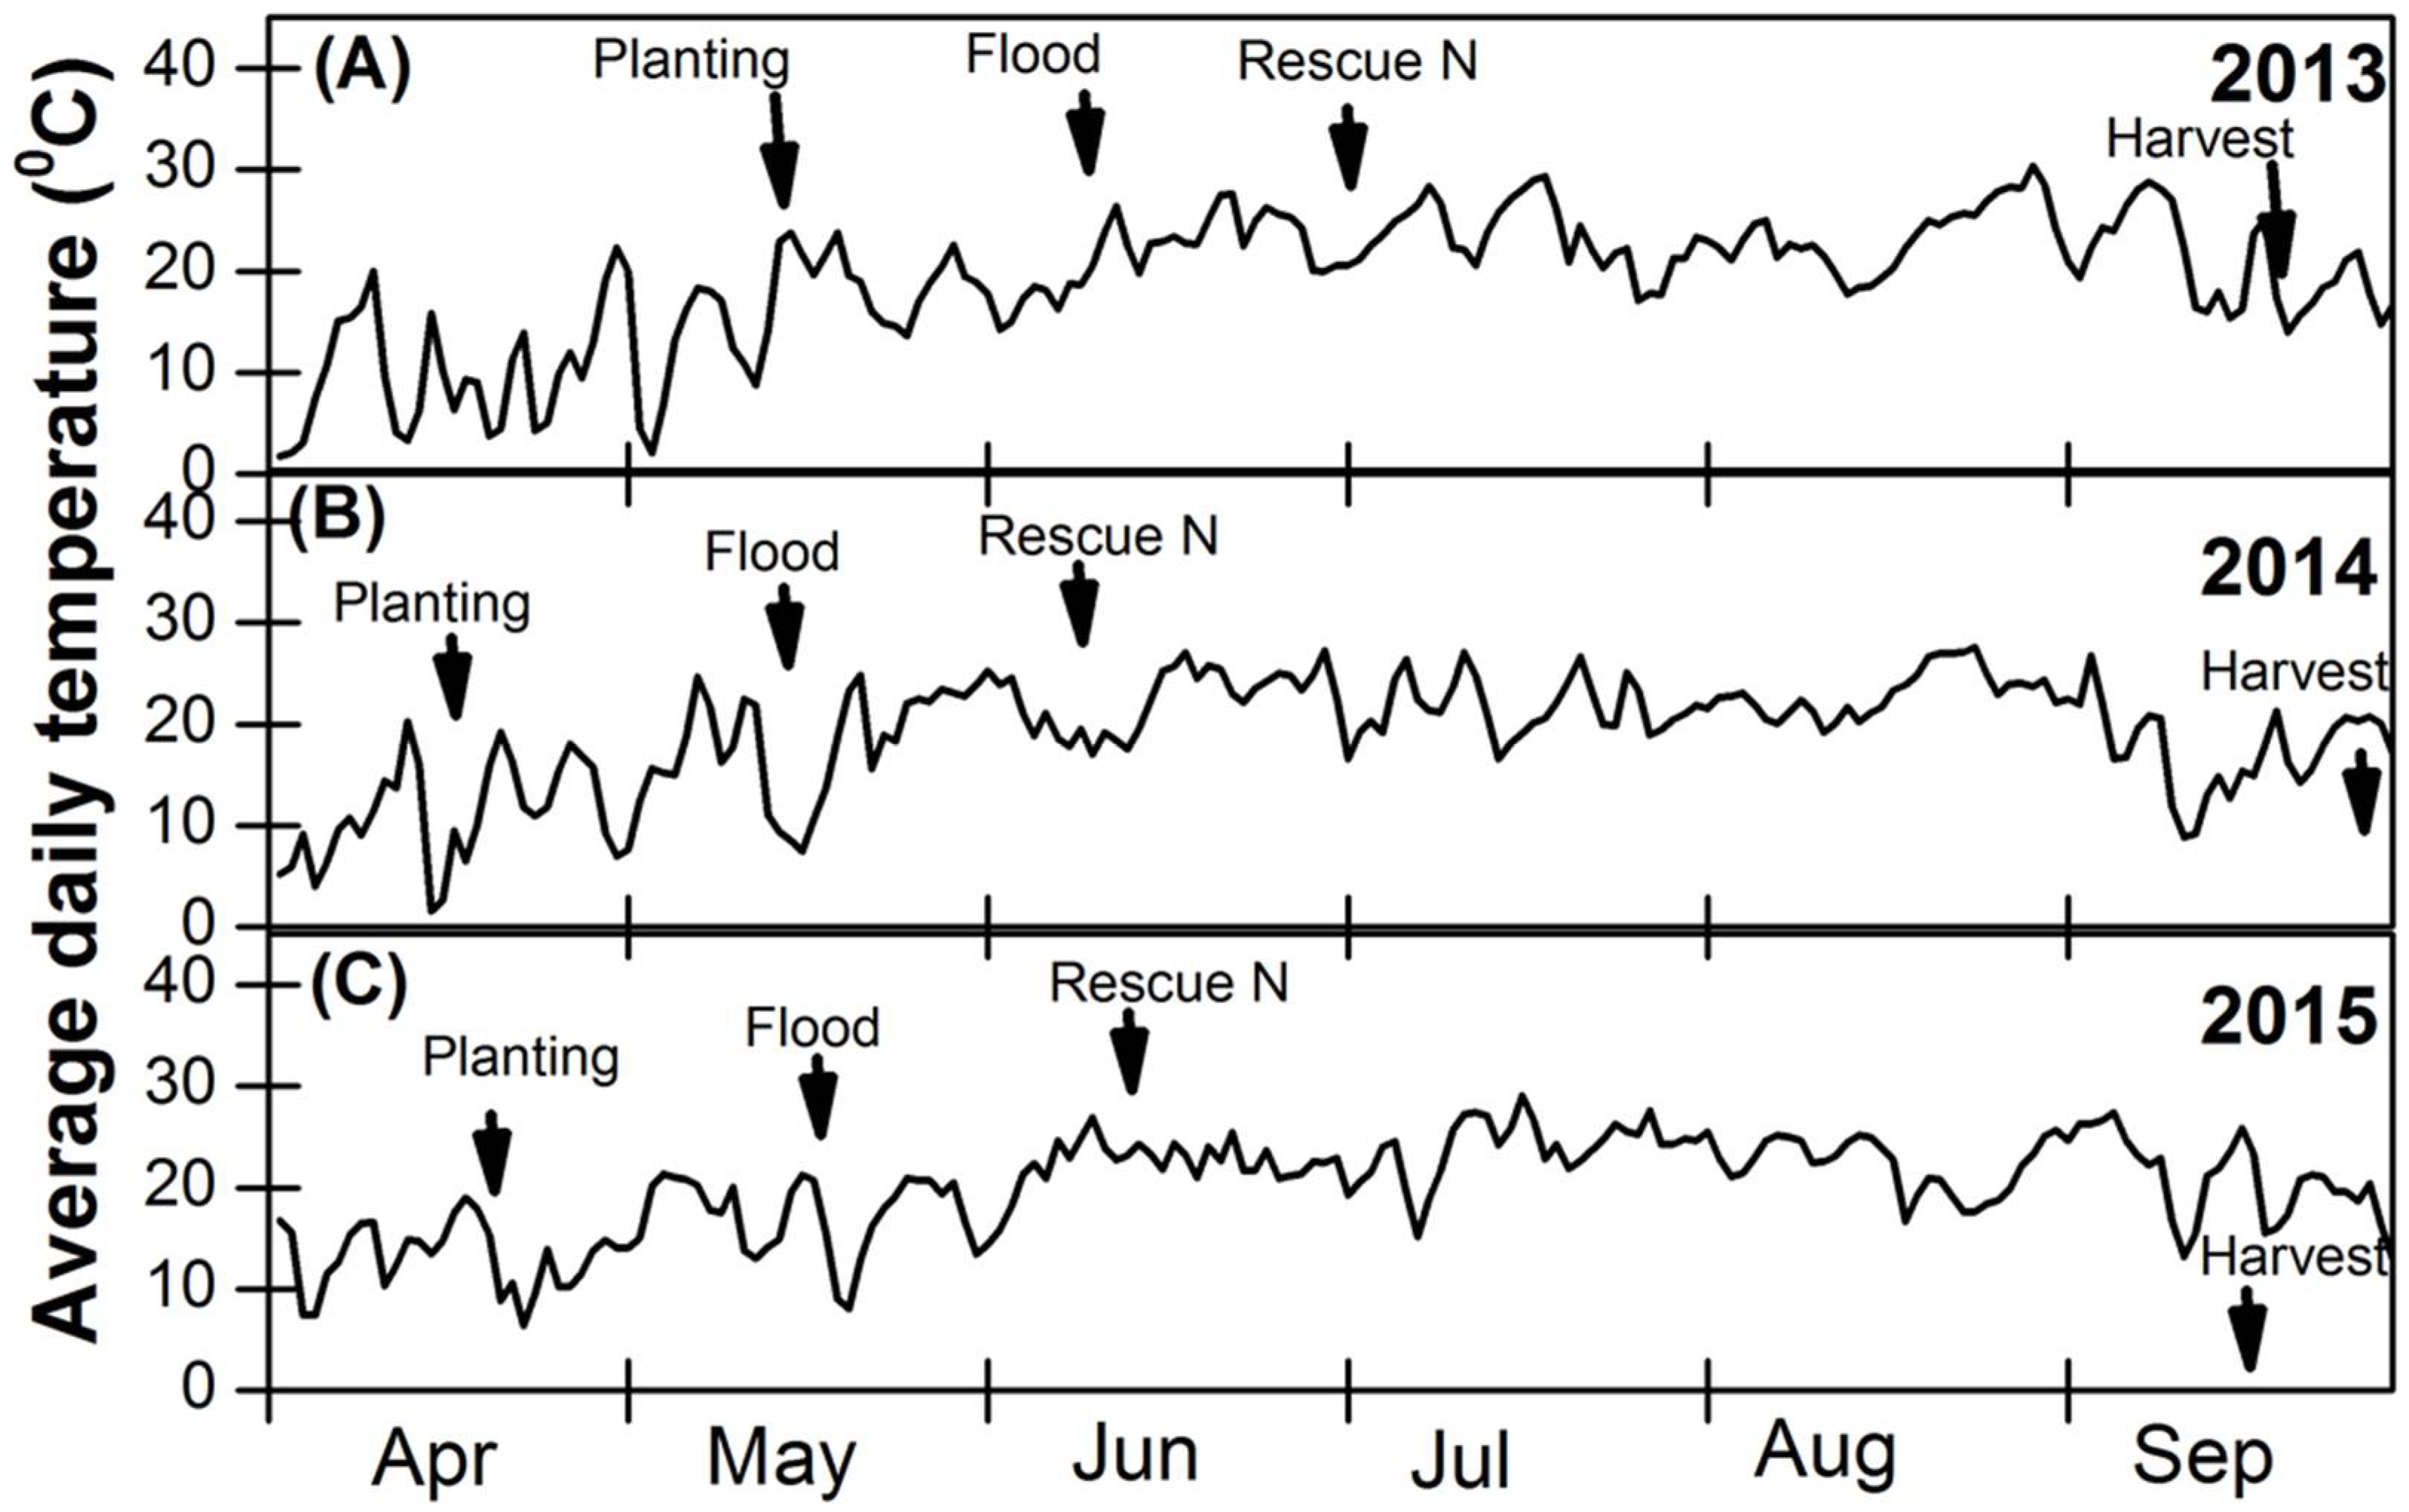
Air temperatures were comparatively lower when waterlogging treatments were initiated in 2014 and 2015 during the month of May than in June in the 2013 growing season (Figure 2A–C). The air temperature when averaged over the 7-days flooding events were 2.5 °C higher in 2013 compared to the 2014 and 2015 growing seasons. The waterlogging injury to plants also depends upon the soil temperature. The chances of survival of young corn plants when subjected to ponding has increased from 3- to 4-days if the temperatures are decreased from ≥24 °C to relatively cool temperatures (≤15 °C) [23].
3.2. Chlorophyll Meter Readings during Waterlogging
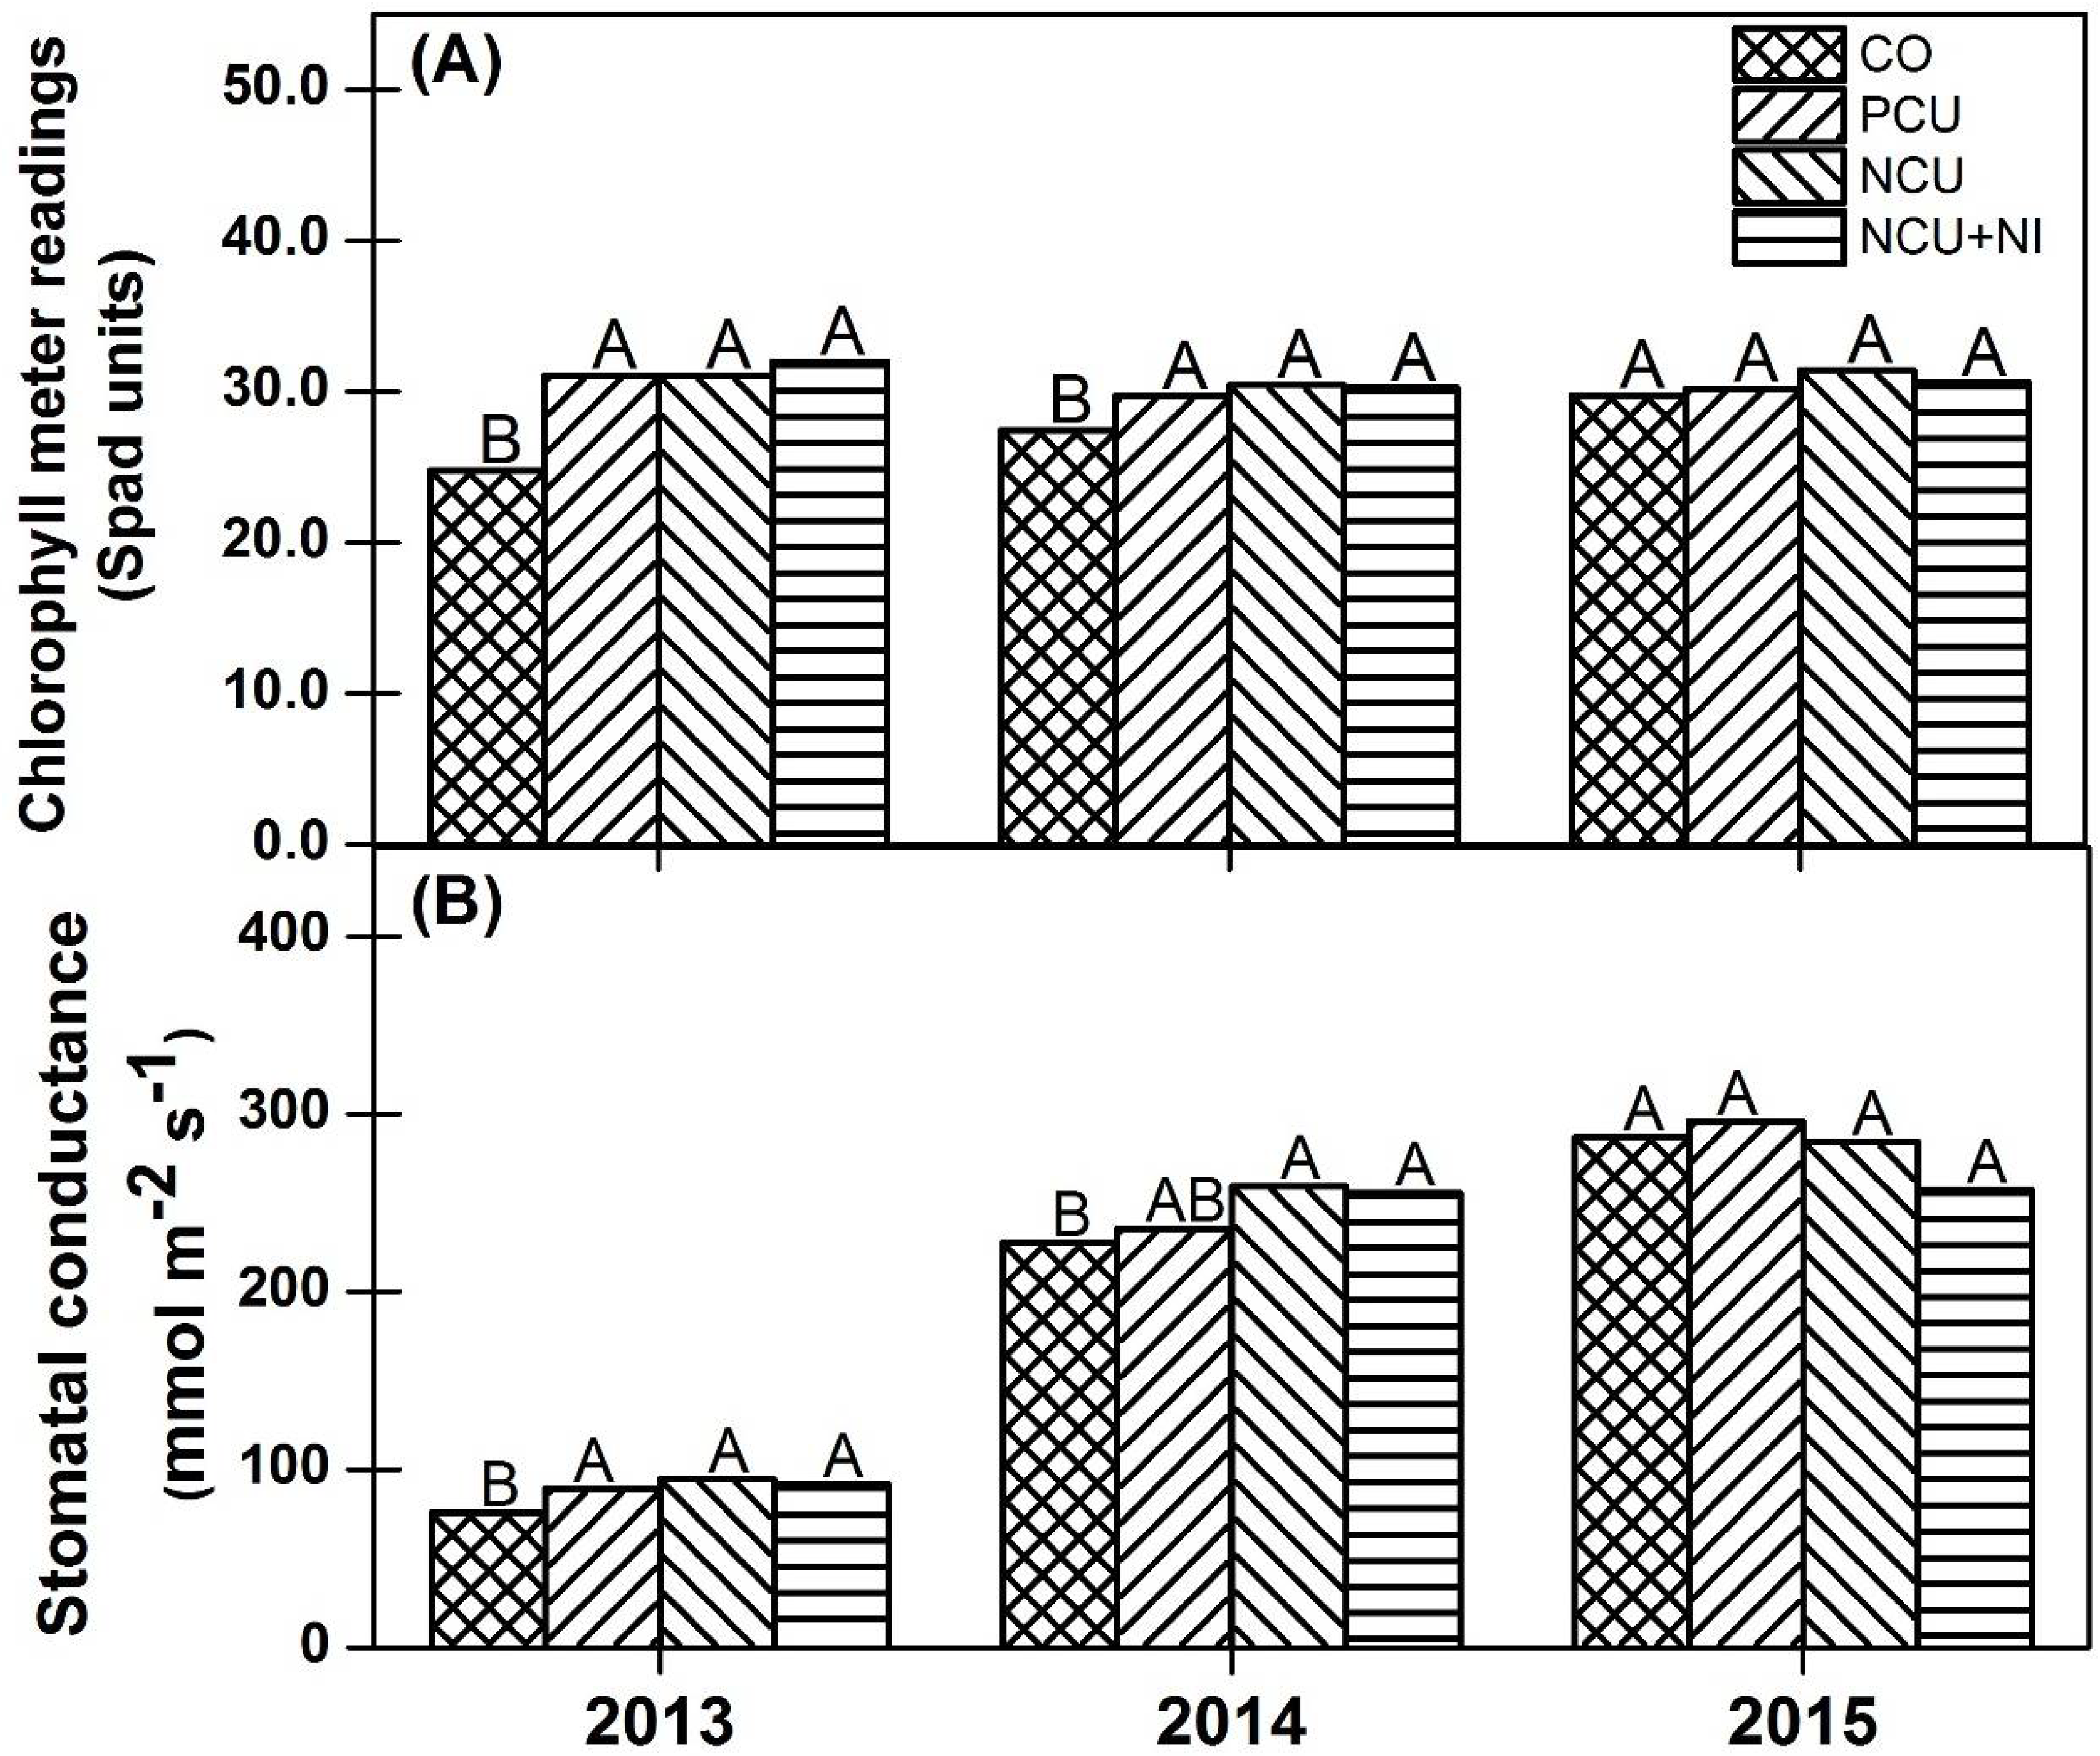
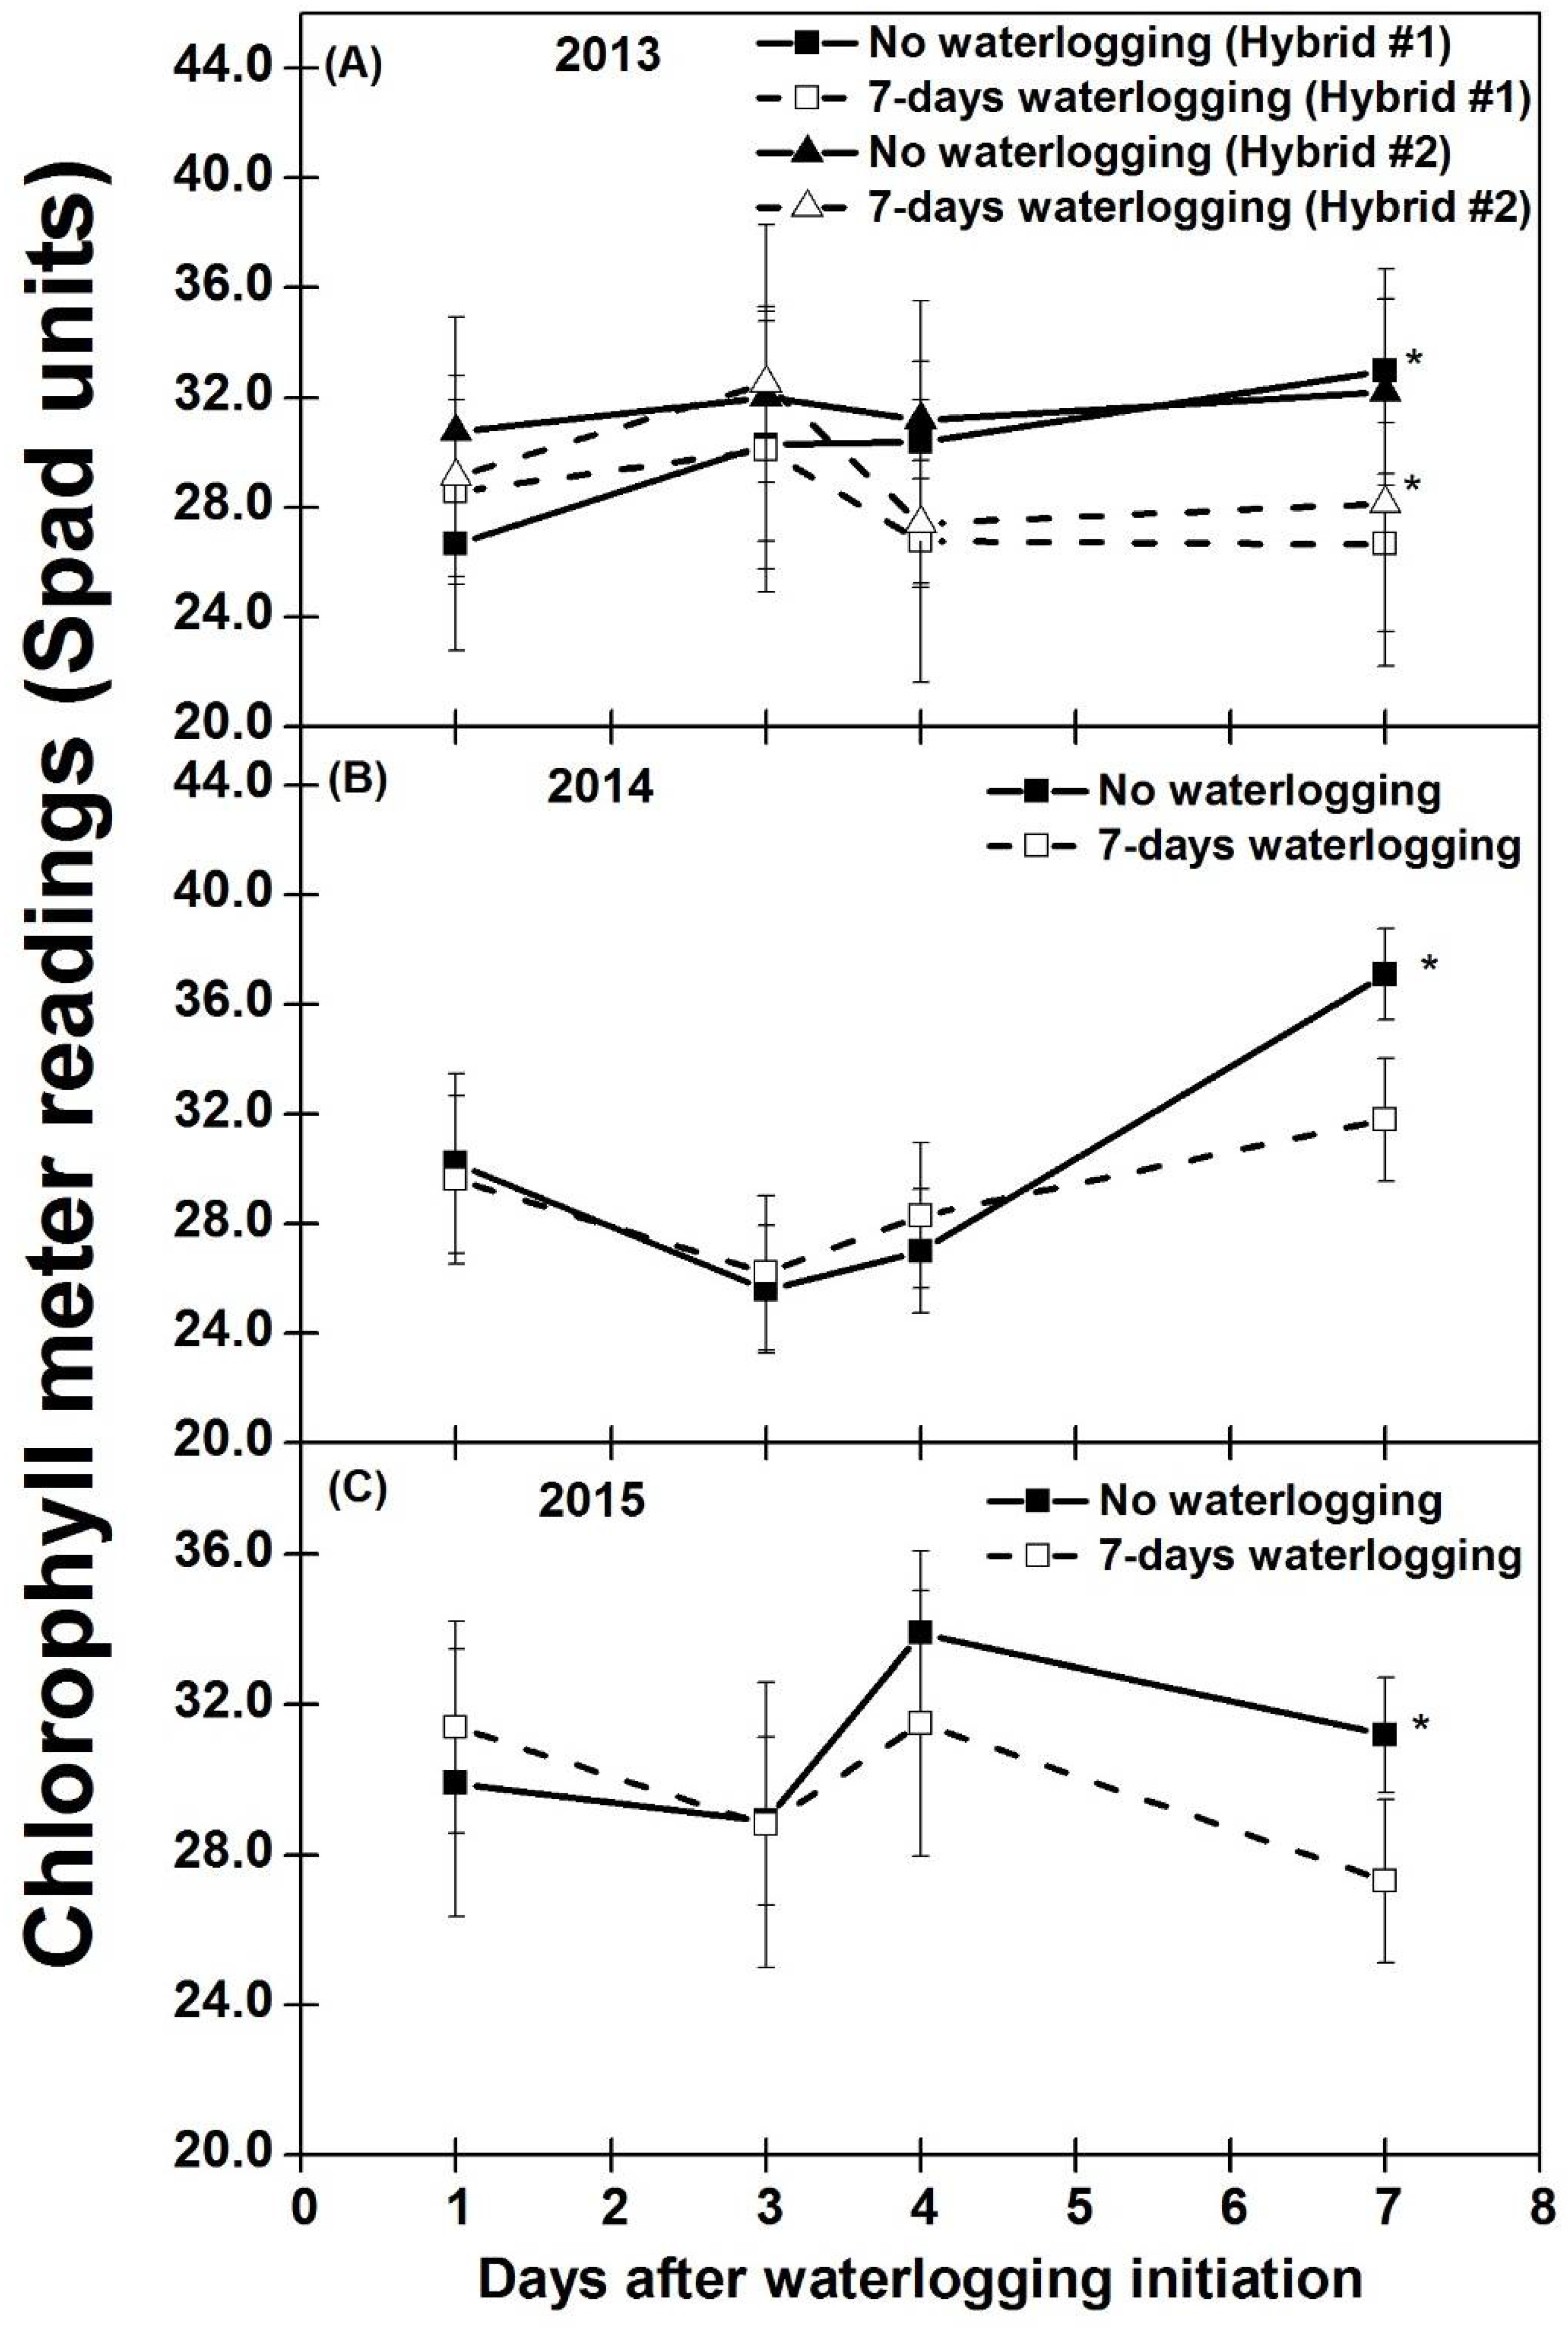
Chlorophyll meter readings were significantly affected by main effects of pre-plant N fertilizer sources (Figure 3) and corn hybrids in 2013 and 2014. The interaction between the waterlogging duration and time in 2014 and 2015 as well as interaction between waterlogging duration and hybrids with time in 2013 was significant for chlorophyll meter readings (Figure 4). Application of pre-plant N fertilizer sources including NCU, PCU and NCU + NI resulted in higher CM readings compared to CO by 6.3 to 7.2 and 2.2 to 3.0 SPAD units in 2013 and 2014, respectively (Figure 3A). No significant differences were observed between the pre-plant N fertilizer sources including PCU, NCU and NCU + NI in all three years (Figure 3A). The mean CM reading averaged over the three pre-plant N fertilizer sources of NCU, PCU and NCU + NI was 31.4 in 2013 and 30.1 in 2014. The pre-plant N fertilizer sources did not show any significant increase in CM readings over the untreated control in 2015, possibly due to comparatively wetter growing season than 2013 and 2014 which might have resulted in higher N losses and lower N uptake by corn plants. The CM readings for Hybrid #1 was 0.8 SPAD units higher in 2014 compared to Hybrid #2 (29.9 vs. 29.0 SPAD units). In contrast, Hybrid #2 (more flood tolerant) had 1.4 SPAD units higher CM readings than Hybrid #1 in 2013 (30.4 vs. 29.0 SPAD units) when averaged over other treatments (Figure 4A). There was interaction between the waterlogging duration and hybrids as shown in Figure 4A but no such interaction was found in other two years. In agreement with these results, differences in CM readings among corn hybrids have also been reported in many studies [35,36,37,38].
In 2015, 7-days of soil waterlogging reduced CM readings by 1.6 SPAD units compared to non-waterlogged treatments (29.8 vs. 31.2 SPAD units), when CM readings were averaged over the other factors (Figure 4C). On the 7th day of waterlogging, the CM readings were significantly lower in the 7-days waterlogged plots compared to non-waterlogged plots in all three years of this experiment (Figure 4A–C). Previous studies have shown that CM readings were highly correlated with leaf chlorophyll and N content [38,39,40]. In waterlogged treatments, the lower CM readings might have resulted from a decrease in leaf chlorophyll content due to chlorophyll destruction mediated by superoxide radicals formed under waterlogging stress [41,42,43,44]. Nitrogen deficiency resulting from higher leaching or denitrification processes under waterlogging conditions may have resulted in N deficiency and consequently, lowered leaf chlorophyll content and CM readings [45]. The CM readings measured on the 1st and 3rd day of waterlogging showed no differences among waterlogged and non-waterlogged treatments. The variation in CM readings between individual days might have been due to differences in daily irradiance (sunny/cloudy days) as leaf optical properties changes with irradiance due to movement of chloroplasts within plant cells [46].
3.3. Stomatal Conductance during Waterlogging
Leaf stomatal conductance was affected by the main effects of pre-plant N fertilizer sources in 2013 and 2014 (Figure 3B). The NCU + NI treatment had 16 and 28 mmol m−2 s−1 higher leaf stomatal conductance compared to the CO in 2013 and 2014, respectively. Similarly, stomatal conductance from NCU was 19 and 32 mmol m−2 s−1 higher than the CO in 2013 and 2014, respectively (Figure 3B). The stomatal conductance for PCU was similar to the CO or to NCU and NCU + NI in 2014 (Figure 3B). No differences were observed between pre-plant N fertilizers (PCU, NCU, NCU + NI) in all three years of this research. Similar to chlorophyll meter readings, pre-plant N fertilizer treatments did not result into higher stomatal conductance compared to the CO treatment in 2015. Many studies have reported an increase in leaf stomatal conductance due to N fertilizer applications in different crops [19]. Foliar N applications significantly increased stomatal conductance along with root respiratory activity, leaf greenness and photosynthetic rate in waterlogged wheat plants [19]. In contrast, Ashraf [47] reported that stomatal conductance decreased due to waterlogging irrespective of the amount of N applied before the waterlogging event. Hybrid #2 had higher stomatal conductance than Hybrid #1 in 2014 (252 vs. 237 mmol m−2 s−1) and 2015 (293 vs. 269 mmol m−2 s−1) (data not presented).
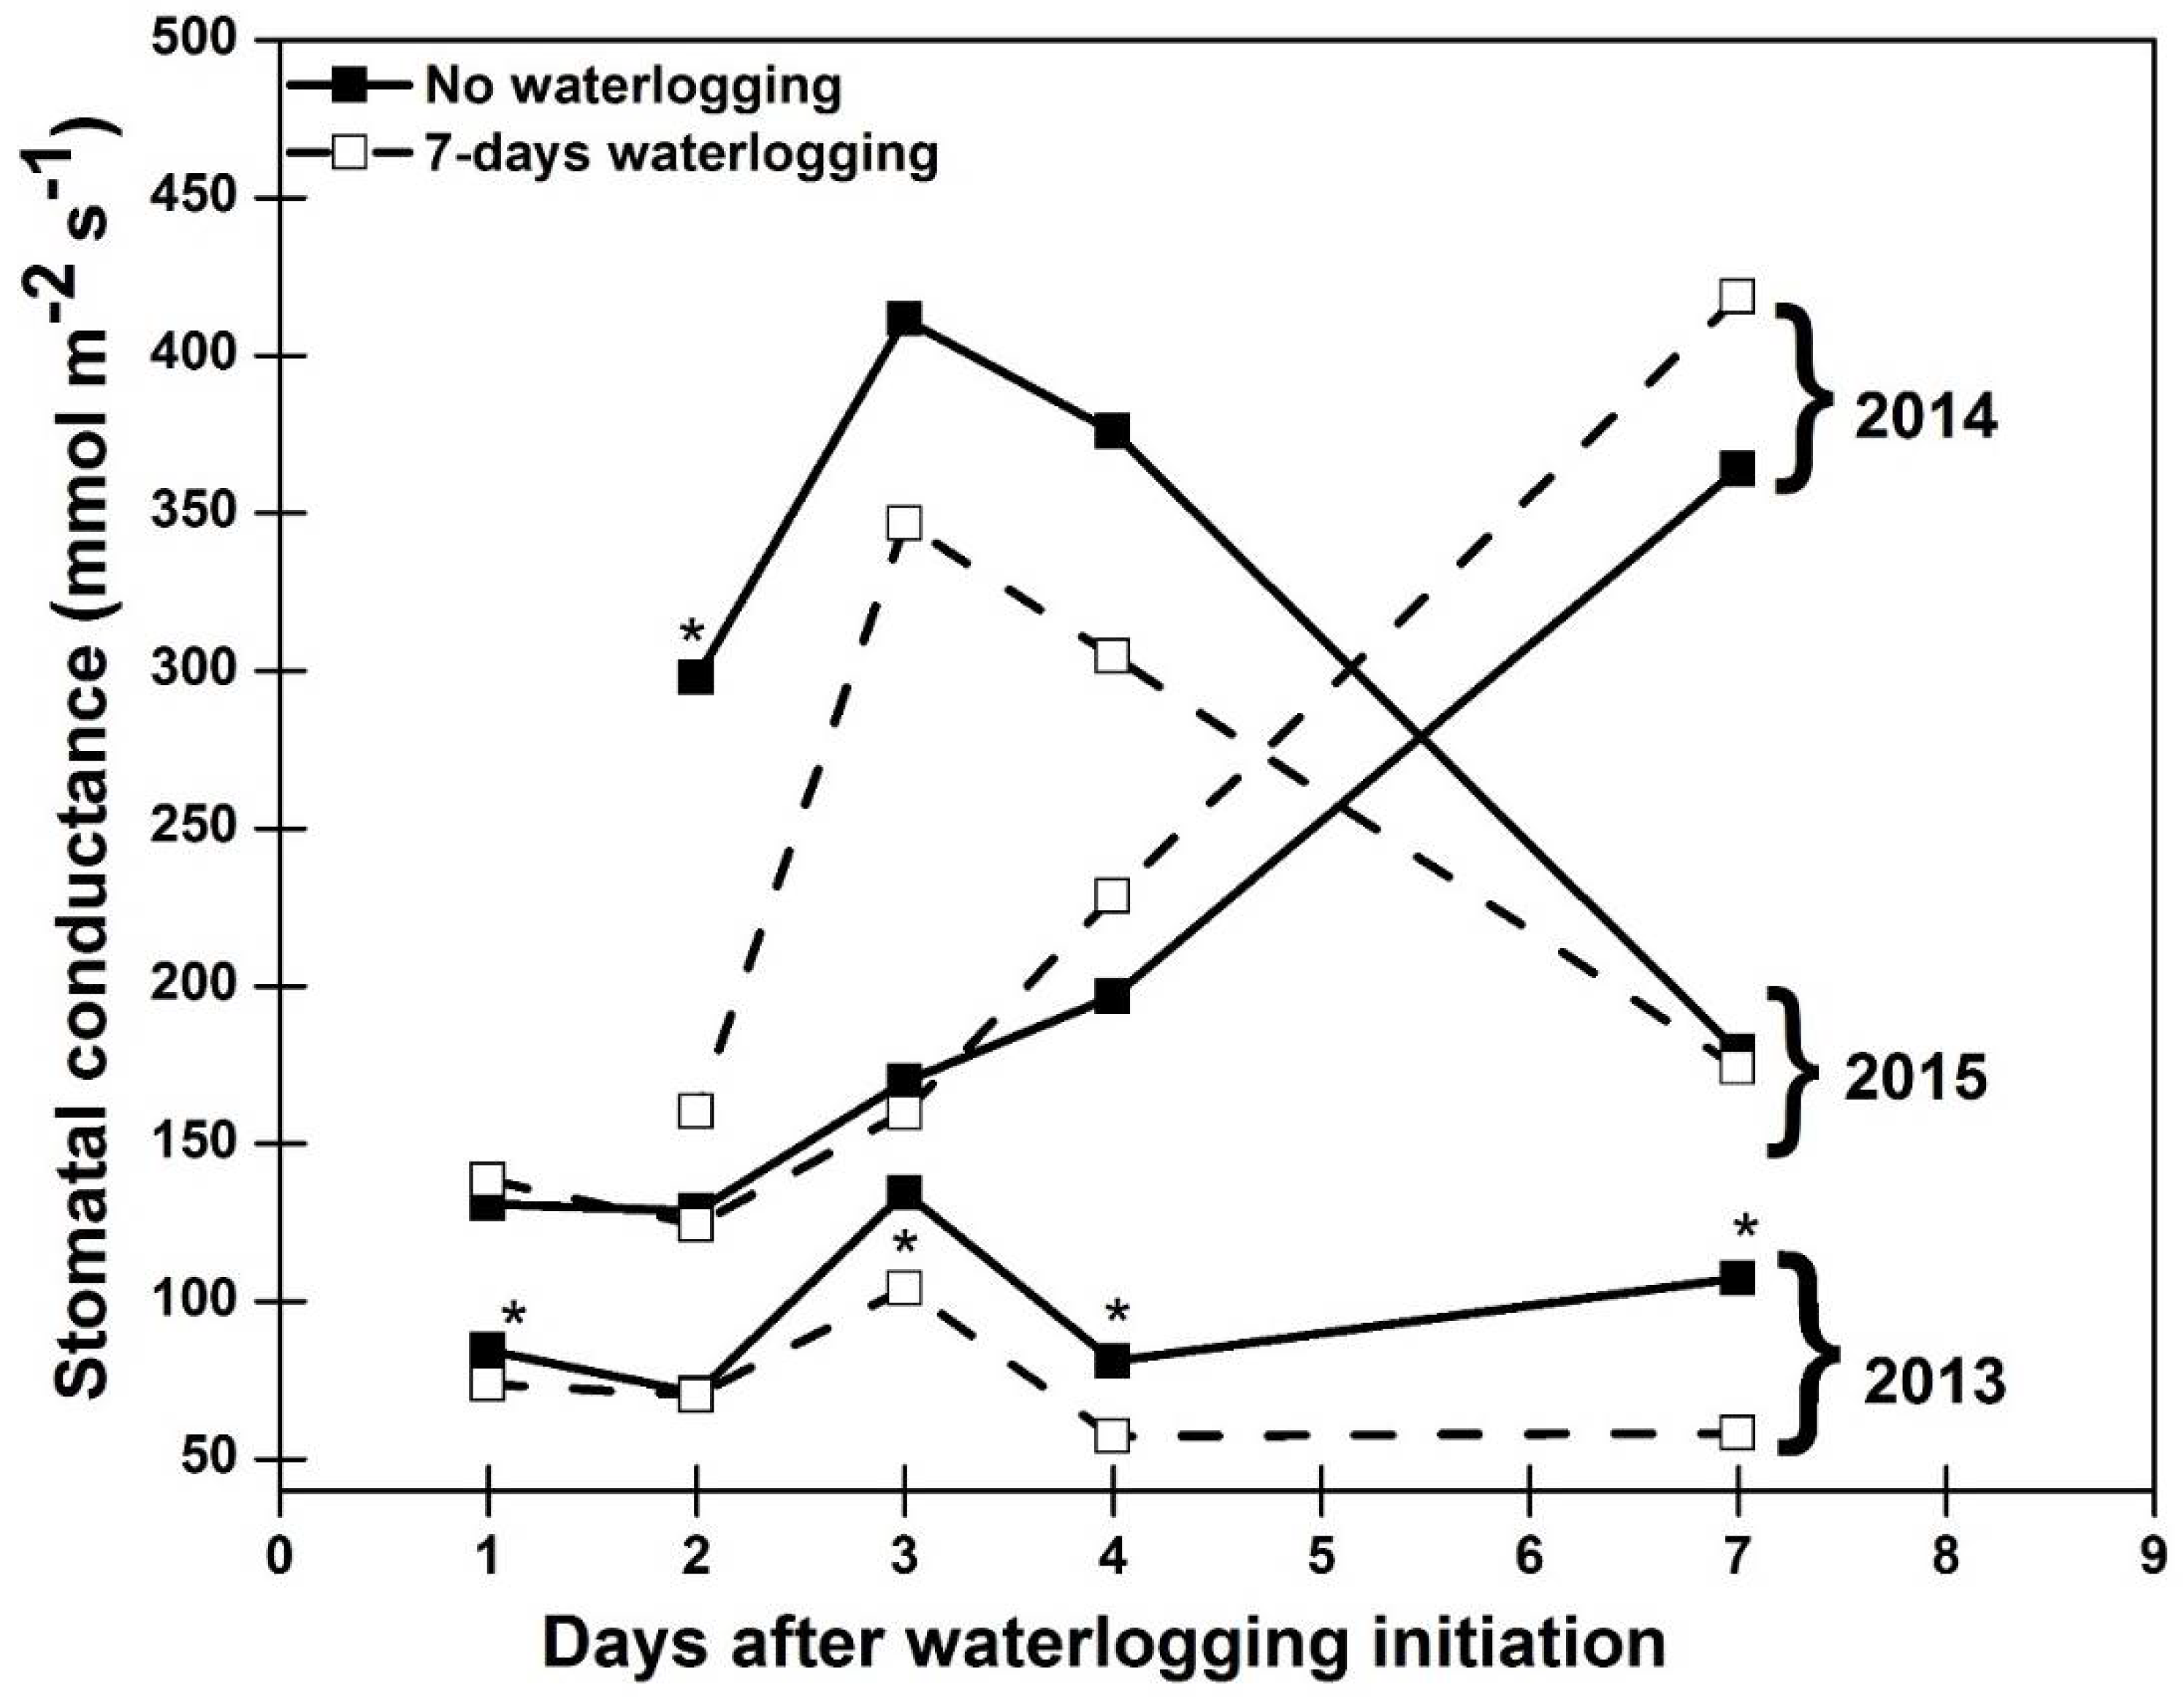
Stomatal conductance varied each day over the 7-day period in both waterlogged and non-waterlogged treatments (Figure 5). No significant differences among waterlogged and non-waterlogged treatments were observed in 2014 and 2015 except for the second day of waterlogging in 2015 (Figure 5). Wang et al. [44] reported no differences in stomatal conductance of corn seedlings at the V2 growth stage after six days of flooding in a greenhouse pot study. The stomatal conductance from each individual day showed significant differences between waterlogged and non-waterlogged treatments in 2013 except for the 2nd day after the start of the waterlogging treatment in 2013 (Figure 5). The stomatal conductance decreased by 13%, 23%, 29% and 46% in 7-days waterlogged treatments compared to non-waterlogged treatments on the first, third, fourth and seventh day of waterlogging in 2013. Similar results were reported by Ren et al. (2015) [48] where the stomatal conductance of two corn hybrids decreased by 11 to 34% due to 6-days of waterlogging at the V3 growth stage. De Souza et al. (2011) also reported lower stomatal conductance in corn plants when plants were flooded at the V6 stage compared to non-flooded plants [43]. Stomatal conductance of tomato plants decreased 30–40% after approximately 1-day of soil waterlogging [10]. Differences among years for stomatal conductance in this research might have been due to climatic factors affecting stomata opening/closing, such as sunlight/cloudiness, the wind, temperature, and/or relative humidity.
3.4. Ear Leaf N Concentration
The average ear leaf N concentration combined over all treatments in 2013, 2014 and 2015 was 27.14, 29.88 and 21.58 g kg−1, respectively (data not presented). Inconsistent responses were obtained for ear leaf N concentration during the three years of this research (Table 3). A significant three-way interaction between waterlogging duration, pre-plant N fertilizer sources and corn hybrids (Table 3) for ear leaf N concentration in 2013 is presented in Table 4. In 2013, ear leaf N concentration was significantly higher in the 7-days waterlogged treatments compared to the non-waterlogged treatments for Hybrid #1 by 4.42 g kg−1 in the CO and 4.19 g kg−1 in the NCU + NI treatments as well as for Hybrid #2 by 5.60 g kg−1 in the CO and 3.24 g kg−1 in the PCU treatments (Table 4). In contrast, many studies have found lower N concentrations in leaves due to waterlogging [13,42].
When compared separately for each N source treatments, soil waterlogging for 7-days did not cause any change in ear leaf N concentration compared to non-waterlogged treatments during the 2014 and 2015 growing season (Table 4 and Table 5). In our study, the ear leaf concentration measurements were taken at later growth stages (R2–R3) which were a long time after the waterlogging event (V3 growth stage). This might have provided sufficient time for corn plants to recover from waterlogging stress and allow for greater plant N uptake after waterlogging stress occurred. This recovery period may have resulted in higher or similar ear leaf N concentrations between waterlogged and non-waterlogged treatments in each year of this study. Also, the roots may have grown sufficiently to utilize N from the deeper layers of the soil profile. In addition, chlorophyll meter readings taken at VT growth stage on corn ear leaf (the same time when ear leaf samples were collected) were either higher or similar in waterlogged treatments compared to non-waterlogged treatments indicating similar ear leaf N concentration [30]. Higher urea-N released from PCU during and sometime after the waterlogging event in the 7-day waterlogged treatments [30] might have resulted in higher N uptake by plants during the recovery period after waterlogging resulting in higher ear leaf N concentrations compared to non-waterlogged treatments. With the CO treatment, higher ear leaf N concentrations in the waterlogged plots compared to non-waterlogged plots may be due to greater N mineralization and decomposition of corn residues from previous years due to greater moisture availability and optimum air temperatures (20 to 30 °C) during the time period between the end of waterlogging event and VT growth stage.
No significant differences were observed for the ear leaf N concentration among CO, PCU, NCU and NCU + NI in non-waterlogged treatments in 2013 for both hybrids (Table 4) as well as the 7-days waterlogged treatments in 2015 (Table 5). Ear leaf N concentration of Hybrid #1 treated with PCU was 3.27 g kg−1 lower compared to the CO but it was not significantly different than NCU and NCU + NI for the 7-days waterlogged treatments in 2013 (Table 4). In treatments receiving no rescue N, ear leaf N concentration in the CO was 4.75 g kg−1 lower than PCU in non-waterlogged treatments as well as it was 5.25 to 8.85 g kg−1 lower than all pre-plant N fertilizer sources for the 7-days waterlogged treatments in 2014. No differences were found between N sources and the CO treatment that received rescue N application in 2015.
Among non-waterlogged treatments in 2015, pre-plant N fertilizer sources including PCU, NCU and NCU + NI had 7.33 to 10.14 g kg−1 higher ear leaf N concentration than the CO (Table 5). No significant differences in ear leaf N concentration between PCU, NCU, NCU + NI and CO in the 7-days waterlogged treatments might be due to N loss caused by extremely wet conditions from the combination of 7-days of soil waterlogging and a higher number of precipitation events that followed the waterlogging treatment in 2015 (Table 5).
When data was averaged over waterlogging duration treatments, pre-plant N fertilizer sources and corn hybrids, rescue N applications (27.74 g kg−1) increased ear leaf concentration 1.21 g kg−1 compared to treatments that received no rescue N (26.53 g kg−1) in 2013. A rescue N application increased ear leaf N concentration by 8.51 g kg−1 only in the CO with 7-days waterlogging in 2014 as well as in NCU and NCU + NI in 2015 compared to treatments that received no rescue N applications (Table 4 and Table 5). In plots that received no rescue N, the ear leaf N concentration was 40% higher with pre-plant PCU in 2015 compared to the CO (Table 5). In plots that received rescue N applications in 2015, NCU + NI had 37% greater ear leaf N concentration than the CO (Table 5).
Both hybrids used in this study showed an inconsistent response of ear leaf N concentration in all three years. No differences were found between hybrids in 2013 when each N source and waterlogging duration treatments were compared separately. Hybrid #2 had 0.82 g kg−1 higher ear leaf N concentration compared to Hybrid #1 in 2014 (30.29 vs. 29.47 g kg−1) when data were averaged over all other treatments. Ear leaf N concentration was not significantly different between hybrids in treatments that received no rescue N applications in 2015. The ear leaf N concentration in treatments without rescue N applications was 19.78 g kg−1 for Hybrid #2 and 19.54 g kg−1 for Hybrid #1. However, Hybrid #1 had 2.65 g kg−1 higher ear leaf N concentration than the Hybrid #2 in 2015 with treatments that received rescue N applications. In 2015, a rescue N application increased ear leaf N concentration in Hybrid #1 (24.83 g kg−1) and Hybrid #2 (22.18 g kg−1) by 5.29 and 2.39 g kg−1, respectively, compared to treatments not receiving a rescue N treatment, when data were average over waterlogging duration and pre-plant N fertilizer sources.
3.5. Silage N Concentration
Both corn hybrids showed inconsistent responses for silage N concentration during all three years, which was similar to the ear leaf N concentration data. Hybrid #1 had 0.81 g kg−1 greater N concentration than Hybrid #2 in 2013 (11.02 vs. 10.21 g kg−1), whereas the Hybrid #2) had 0.67 g kg−1 higher N concentration compared to Hybrid #1 in 2015 (9.05 vs. 8.38 g kg−1) (data not presented). In 2014, an interaction between hybrids and rescue N applications was observed. For all treatments that received rescue N, Hybrid #1 had 9% higher N concentration in silage than Hybrid #2. No differences were observed for silage N concentration between hybrids in treatments that received no rescue N applications in 2014.
Significant interactions were observed between waterlogging duration × pre-plant N fertilizer sources × rescue N for silage N concentration in 2013 and 2015 (Table 3 and Table 6). In 2013, the silage tissue N concentration with NCU + NI that also received rescue N application with 7-days waterlogging was 42% higher than the CO treatments with non-waterlogging and no rescue N (Table 6). Silage N concentration was the same among different treatments in 2014 (Table 6). The rescue N application increased silage N concentration by 45% with the PCU treatment in non-waterlogged treatments in 2015. In non-waterlogged treatments during 2015, PCU with rescue N had 3.81 to 3.44 g kg−1 higher N concentration compared to PCU, NCU and CO that received no rescue N and the CO that received rescue N (Table 6). In non-waterlogged treatments with or without rescue N applications, no significant differences were observed among the PCU, NCU and NCU + NI treatments in 2015. A decrease in silage N concentration was not observed due to waterlogging in general in this study which may been due to greater recovery time available to plants after waterlogging stress at V3 growth stage. However, Chaudhary et al. (1975) [14] reported that corn stover and grain N concentration decreased with flooding from one to six days.
3.6. Corn N Uptake
Corn N uptake during the 2013, 2014 and 2015 growing seasons was 193, 174 and 126 kg ha−1, respectively, when data were combined over all treatments (Table 6). In 2015, a comparatively wet growing season with excessive soil moisture conditions might have reduced nutrient availability through restricted root growth which lowered overall N uptake by plants and decreased N availability due to N losses through denitrification [49]. Ahmad (1991) [50] also found that N uptake by corn plants grown in field lysimeters or growth chambers decreased due to soil surface flooding. Ren et al. (2014) [51] reported that waterlogging reduced N accumulation and nutrient movement from the stem and leaf to grain. Waterlogging can limit root absorption capacity resulting into reduced N uptake and a significant inhibition of N metabolism and protein synthesis, which can cause carbohydrate accumulation and disordered C and N metabolism [22]. Significant interactions for N uptake occurred between waterlogging duration, pre-plant N fertilizer sources and rescue N in all three years (Table 3 and Table 6).
Among treatments that received no rescue N, corn N uptake was reduced due to 7-days waterlogging by 31% in NCU treatments in 2013 as well as in NCU and PCU by 22% and 28%, respectively, in 2014 (Table 6). However, treatments that received rescue N applications, 7-days waterlogging reduced N uptake by 19% in CO and 13% in NCU + NI in 2013 as well as 40% in NCU and 17% in NCU + NI in 2014. When urea was applied early at the time of sowing or emergence, subsequent gaseous or drainage N losses occurred in waterlogged or wet soils before the plants reached peak growth and their demand for N increases, which resulted in poor N uptake and recovery [52]. In plots that received no rescue N, N uptake was not significantly different between 7-days waterlogged (93 kg ha−1) and non-waterlogged (126 kg ha−1) treatments in 2015 (Table 7). No differences in N uptake due to waterlogging durations probably resulted from excessive soil moisture conditions following the waterlogging treatment that caused lower N concentration in the aboveground biomass or silage. However, 7-days waterlogging reduced N uptake compared to non-waterlogged treatments in treatments that received rescue N application in 2015 by 85 kg ha−1 (Table 7).
In non-waterlogged treatments that received no rescue N applications, N uptake was 23% lower in the CO treatment compared to NCU in 2013 and by 31–34% lower than PCU and NCU in 2014 (Table 6). In non-waterlogged treatments, rescue N increased N uptake only in the CO treatment 31% in 2013 compared to treatments that received no rescue N application. Rescue N had no effect on N uptake in non-waterlogged treatments for all pre-plant N fertilizer sources in 2014. No differences for N uptake among pre-plant N sources of PCU, NCU and NCU + NI in 2013 and 2014 in non-waterlogged treatments. The N uptake in 2015 was affected by the main effects of the pre-plant N fertilizer sources. When data was averaged over all other factors, the N uptake from CO, PCU, NCU and NCU + NI was 79, 173, 99 and 152 kg ha−1, respectively, in 2015. The N uptake from PCU was 93 and 73 kg ha−1 higher than the CO and NCU, respectively, in 2015. However, the N uptake from NCU + NI was not significantly different either PCU or from NCU in 015. Similarly, N uptake from CO and NCU were not significantly different in 2015.
In the 7-days waterlogged treatments, rescue N applications increased N uptake of PCU 33% and 40% in 2013 and 2014, respectively, as well as NCU 48% in 2013. Similarly, Ren et al. (2017) reported that post-waterlogging application of urea with nitrapyrin [2-chloro-6-(trichloromethyl) pyridine] increased N accumulation for two corn hybrids under waterlogged conditions [22]. In treatments receiving no rescue N with 7-days waterlogging, N uptake was similar between CO, PCU, NCU and NCU + NI in 2013 and 2014. In 7-days waterlogged treatments that received rescue N applications, NCU and PCU in 2013 resulted in higher N uptake than the CO by 77 and 66 kg ha−1, respectively. In the 7-days waterlogged treatments which received rescue N, NCU and PCU in 2013 resulted in 47 to 58 kg ha−1 higher N uptake than NCU + NI. Also, PCU had 72 to 78 kg ha−1 higher N uptake than NCU and NCU + NI in 7-days waterlogged treatments that received rescue N applications in 2014 by 78 and 72 kg ha−1. Similarly, Amin et al. (2016) found that N uptake was lowest in control plots compared to plots that received N applications when mung bean (Vigna radiata L. Wilczek) plants were subjected to 4-days of waterlogging [53].
3.7. Apparent N Recovery Efficiency
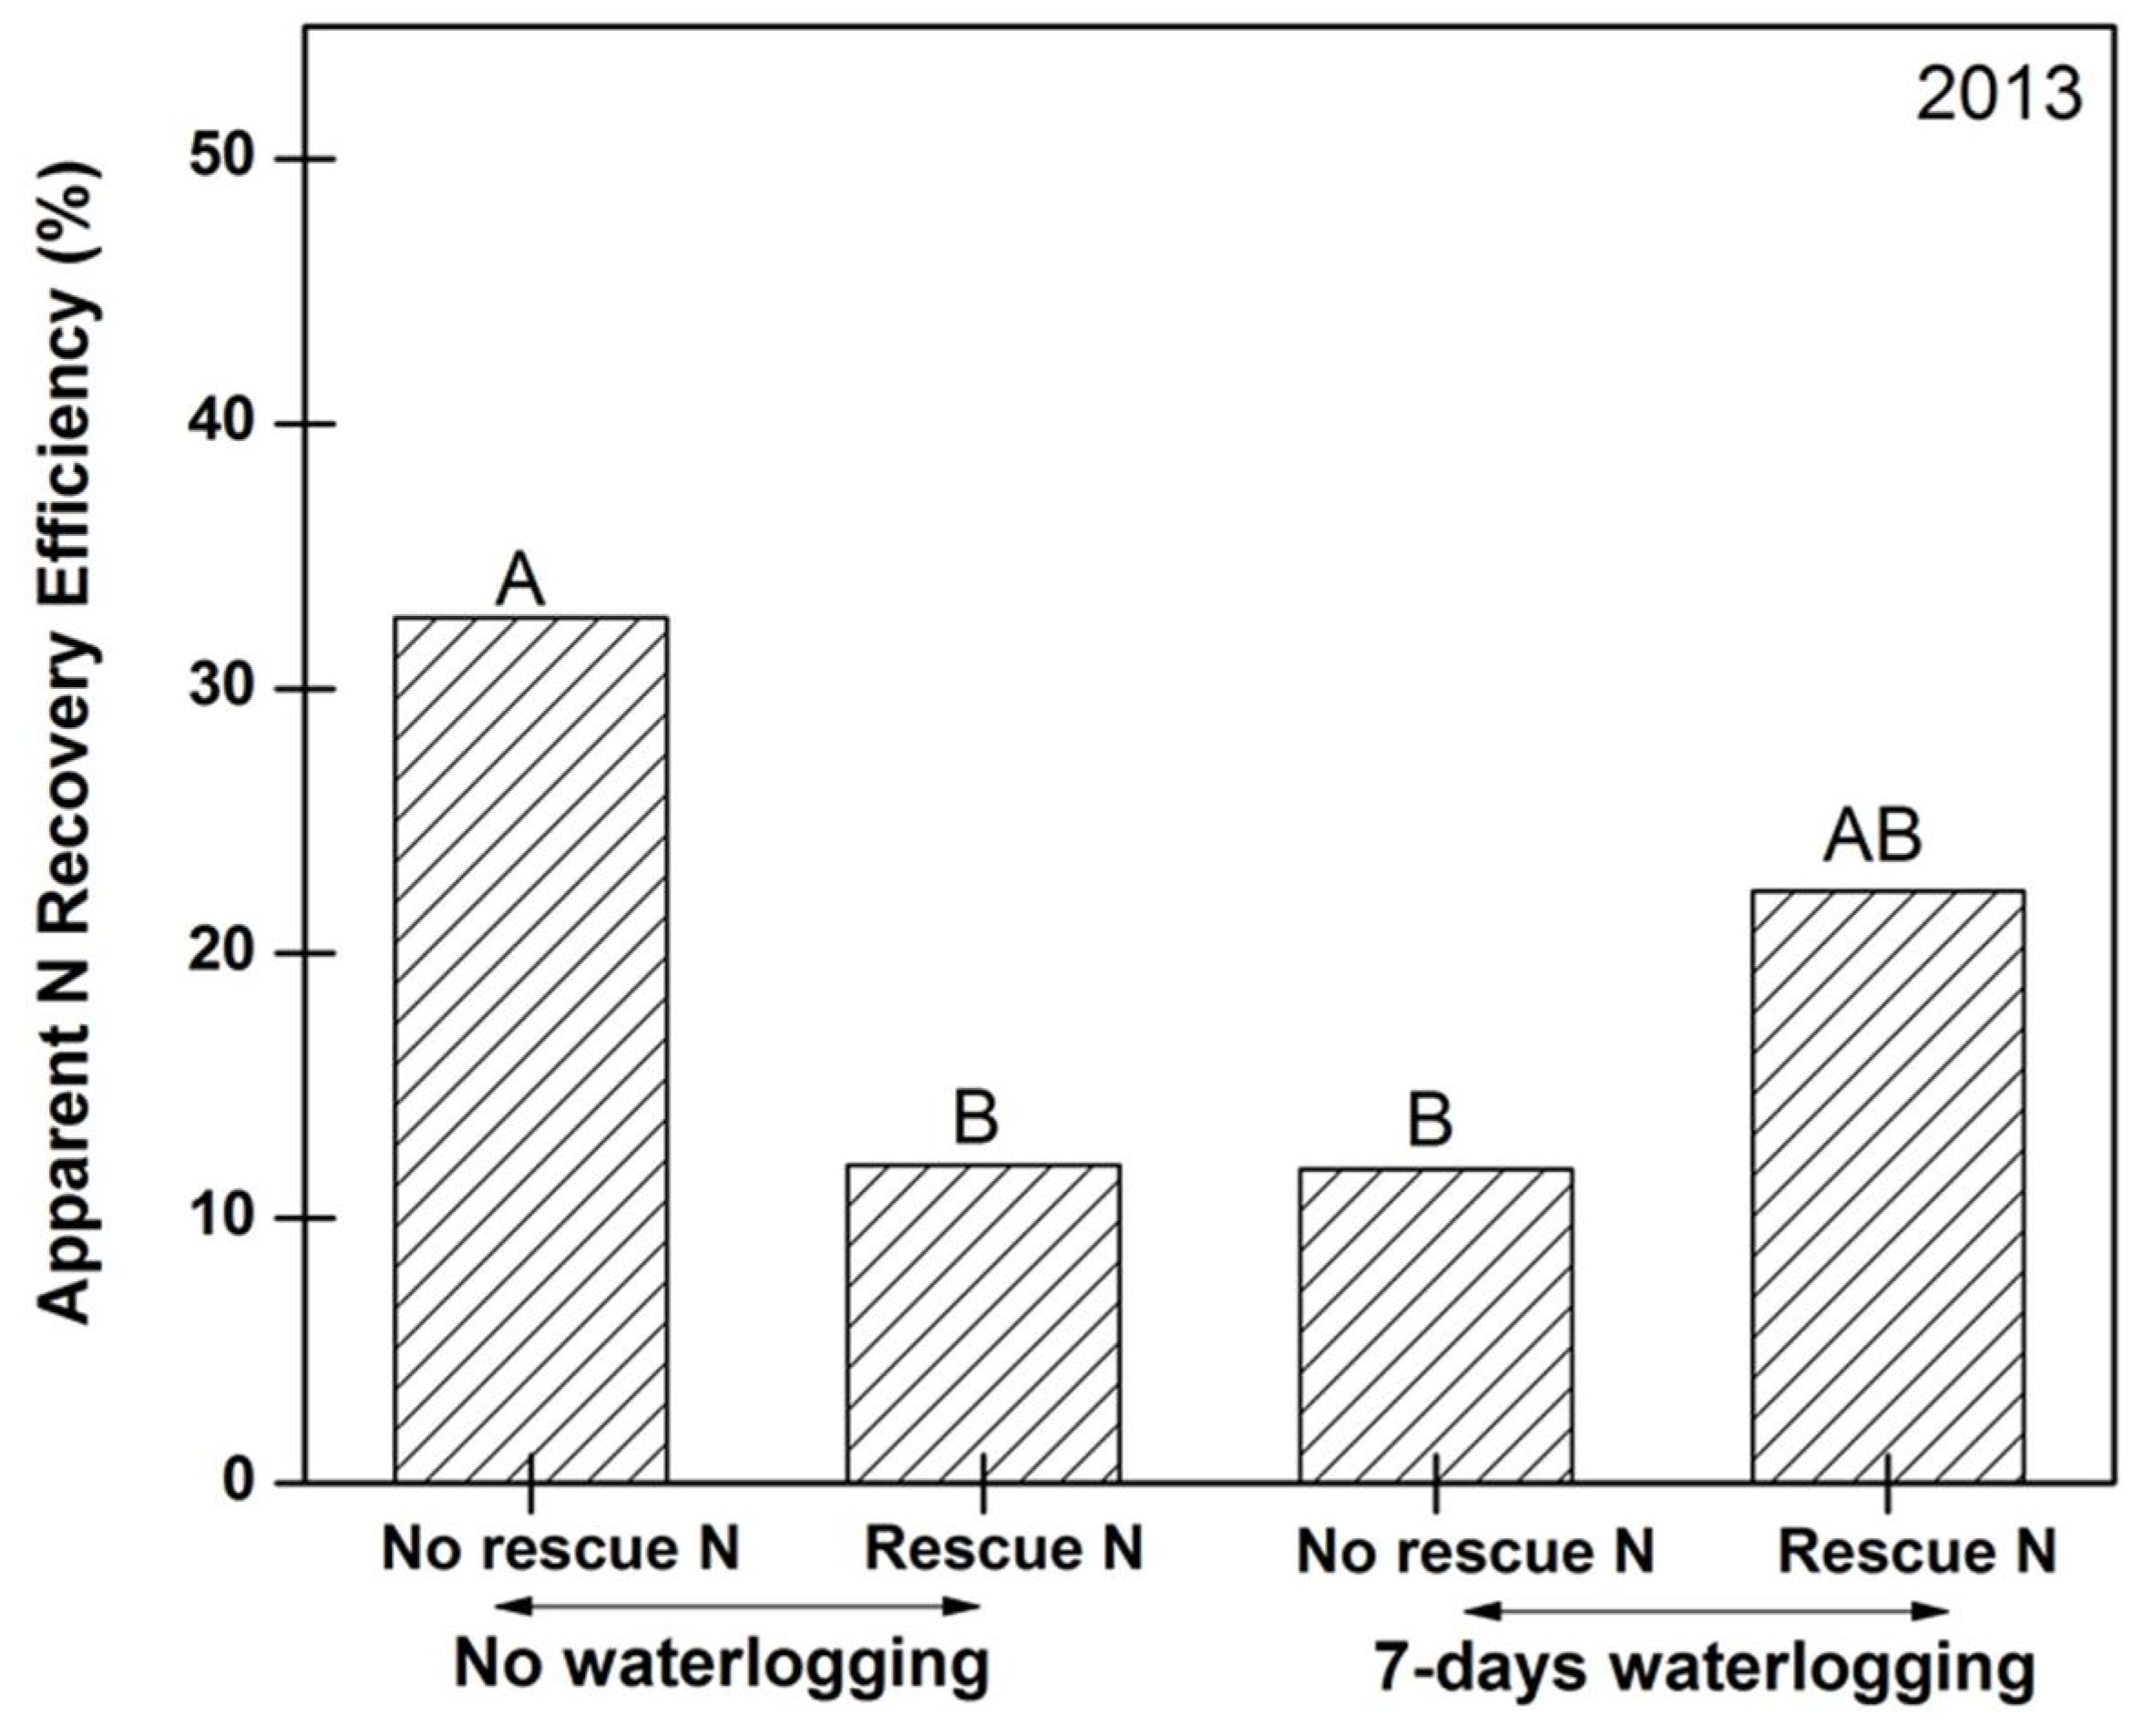
The average ARE in 2013, 2014 and 2015 was 19.7%, 24.7% and 30.4%, respectively, when data were combined over all treatments (data not presented). In treatments that received no rescue N applications, waterlogging reduced ARE by 21% compared to non-waterlogged treatments in 2013 (Figure 6). Previous studies have observed a decrease in ARE due to waterlogging [54,55]. Sigua et al. (2013) found that ARE was reduced for two of three forage species studied in a greenhouse due to continuous waterlogging for 84 days [55]. Similarly, Ren et al. (2017) reported that waterlogging for six days at V3 reduced corn N use efficiency by 19% which resulted in lower corn yields due to inhibition of N transport and assimilation [22].
In non-waterlogged treatments, rescue N applications decreased ARE by 21% in 2013 compared to treatments that received no rescue N (Figure 6). Averaged over all treatments, rescue N applications (14%) in 2014 reduced ARE by 22% compared to treatments that received no rescue N (36%) (data not presented). In 7-days waterlogging treatments, rescue N applications did not affect ARE compared to treatments that received no rescue N in 2013 (Figure 6). Lower N uptake and N utilization by plants also lowered ARE in waterlogged soils [49]. In contrast to our study, Ren et al. (2017) reported that post-waterlogging application of urea with nitrapyrin to corn increased N use efficiency and partial factor productivity of applied N fertilizer for two corn hybrids (DH605 and ZD958) but the tolerance to waterlogging was unknown between the hybrids [22].
No differences were found for ARE due to waterlogging duration, pre-plant N fertilizer sources and hybrids within the treatments that received no rescue N application in 2015. However, pre-plant N fertilizers significantly (p = 0.0681) affected the ARE within the treatments that received rescue N applications in 2015. In 2015, PCU (47%) treatments resulted in greater ARE than NCU (14%) in treatments that received rescue N application, when data was averaged over hybrids and waterlogging duration (data not presented). Apparent N recovery efficiency from NCU + NI (34%) was not significantly different from either PCU or NCU. Kissakye and Acuna (2015) [49] reported that controlled release N fertilizers increased wheat NUE by 7% and 10% under rainfed and waterlogged soil conditions compared to NCU, which might be due to the ability of controlled release fertilizers to synchronize N release with crop demand and prevent N loss during saturated conditions. In 2015, the highest ARE was obtained with PCU (71%) in the absence of waterlogging that received rescue N (data not presented). The NCU (9%) had lowest ARE in non-waterlogged soils that received no rescue N due to no increase in N uptake with NCU compared to the CO in 2015 (data not presented).
In summary, use of PCU and NI with urea compared to urea alone as well as post-waterlogging rescue N applications did not affect ARE under waterlogged soil conditions. We expected that the flood-tolerant hybrid would have greater N accumulation and utilization under waterlogged conditions than the flood-susceptible hybrid, which would result in higher N uptake and ARE. However, corn hybrids showed no difference in N uptake and ARE in all three years, even though there were differences in chlorophyll SPAD meter readings and stomatal conductance at the time of waterlogging as well as silage and ear leaf N content of the two corn hybrids used in this study. Similarly, Ren et al. (2017) [22] reported no significant differences between two corn hybrids for N accumulation, N use efficiency and partial factor productivity of applied N fertilizer under waterlogged soil conditions. The waterlogging tolerance of corn hybrids used in the field study were evaluated initially in the greenhouse study under controlled environment. However, the variable environmental conditions in the field during the growing season in three years of this research may have influenced the different responses of corn hybrids to soil waterlogging and N sources and application timing when compared to the results obtained under controlled environmental conditions in the greenhouse.
4. Conclusions
Soil waterlogging of corn for seven days at the V3 growth stage affected corn plant growth as indicated by leaf stomatal conductance and CM leaf readings at the end of seven days of waterlogging. Pre-plant N fertilizer applications of PCU, NCU and NCU increased CM readings, stomatal conductance and ear leaf N concentration compared to the CO but no beneficial effects of PCU and NCU + NI were observed over NCU. In a comparatively wet year (2015), PCU resulted in higher N uptake and ARE than NCU when data was averaged over other factors. In the waterlogged treatments, beneficial effects of a rescue N application on N uptake were observed in the first two years of this study following PCU and NCU treatments. However, there was no clear trend shown by the corn hybrids used in this study for ear leaf and silage N concentration, stomatal conductance and SPAD meter readings during the waterlogging event. Total plant N-uptake and ARE were not affected by the corn hybrids used in our study. This research indicates that a strategy of combining pre-plant N fertilizer source selection and rescue N applications may be a viable practice to reduce possible decreases in N uptake caused by early season soil waterlogging events during years with average precipitation. Additional research is needed to assess the possible benefits of different N management practices to increase flood tolerance and recovery of corn hybrids through improved N utilization.
Author Contributions
P.P.M. and K.A.N. designed the experiment and edited the manuscript. G.K. was responsible for data collection, statistical analysis and manuscript preparation.
Acknowledgments
The authors wish to acknowledge the Missouri Fertilizer and Aglime program for generously providing funding for this research project.
Conflicts of Interest
The authors declare no conflict of interest.
References
- Rosenzweig, C.; Tubiello, F.N.; Goldberg, R.; Mills, E.; Bloomfield, J. Increased crop damage in the us from excess precipitation under climate change. Glob. Environ. Chang. 2002, 12, 197–202. [Google Scholar] [CrossRef]
- Kunkel, K.E. North American trends in extreme precipitation. Nat. Hazards 2003, 29, 291–305. [Google Scholar] [CrossRef]
- Bailey-Serres, J.; Lee, S.C.; Brinton, E. Waterproofing crops: Effective flooding survival strategies. Plant Physiol. 2012, 160, 1698–1709. [Google Scholar] [CrossRef] [PubMed]
- Rosenzweig, C.; Iglesias, A.; Yang, X.; Epstein, P.R.; Chivian, E. Climate change and extreme weather events; implications for food production, plant diseases and pests. Glob. Chang. Hum. Health 2001, 2, 90–104. [Google Scholar] [CrossRef]
- Dai, S.; Shulski, M.D.; Hubbard, K.G.; Takle, E.S. A spatiotemporal analysis of Midwest US temperature and precipitation trends during the growing season from 1980 to 2013. Int. J. Climatol. 2016, 36, 517–525. [Google Scholar] [CrossRef]
- Kozdrój, J.; van Elsas, J.D. Response of the bacterial community to root exudates in soil polluted with heavy metals assessed by molecular and cultural approaches. Soil Biol. Biochem. 2000, 32, 1405–1417. [Google Scholar] [CrossRef]
- Urban, D.W.; Roberts, M.J.; Schlenker, W.; Lobell, D.B. The effects of extremely wet planting conditions on maize and soybean yields. Clim. Chang. 2015, 130, 247–260. [Google Scholar] [CrossRef]
- Terazawa, K.; Maruyama, Y.; Morikawa, Y. Photosynthetic and stomatal responses oflarix kaempferi seedlings to short-term waterlogging. Ecol. Res. 1992, 7, 193–197. [Google Scholar] [CrossRef]
- Sairam, R.; Kumutha, D.; Ezhilmathi, K.; Deshmukh, P.; Srivastava, G. Physiology and biochemistry of waterlogging tolerance in plants. Biol. Plant. 2008, 52, 401–412. [Google Scholar] [CrossRef]
- Bradford, K.J.; Hsiao, T.C. Stomatal behavior and water relations of waterlogged tomato plants. Plant Physiol. 1982, 70, 1508–1513. [Google Scholar] [CrossRef] [PubMed]
- Steffens, D.; Hutsch, B.; Eschholz, T.; Losak, T.; Schubert, S. Water logging may inhibit plant growth primarily by nutrient deficiency rather than nutrient toxicity. Plant Soil Environ. 2005, 51, 545. [Google Scholar] [CrossRef]
- Habibzadeh, F.; Sorooshzadeh, A.; Pirdashti, H.; Modarres-Sanavy, S.A.M. Alleviation of waterlogging damage by foliar application of nitrogen compounds and tricyclazole in canola. Aust. J. Crop Sci. 2013, 7, 401. [Google Scholar]
- Board, J. Waterlogging effects on plant nutrient concentrations in soybean. J. Plant Nutr. 2008, 31, 828–838. [Google Scholar] [CrossRef]
- Chaudhary, T.; Bhatnagar, V.; Prihar, S. Corn yield and nutrient uptake as affected by water-table depth and soil submergence. Agron. J. 1975, 67, 745–749. [Google Scholar] [CrossRef]
- Hodgson, A.; MacLeod, D. Seasonal and soil fertility effects on the response of waterlogged cotton to foliar-applied nitrogen fertilizer. Agron. J. 1988, 80, 259–265. [Google Scholar] [CrossRef]
- Robertson, D.; Zhang, H.; Palta, J.A.; Colmer, T.; Turner, N.C. Waterlogging affects the growth, development of tillers and yield of wheat through a severe but transient, n deficiency. Crop Pasture Sci. 2009, 60, 578–586. [Google Scholar] [CrossRef]
- Forde, B.G. Local and long-range signaling pathways regulating plant responses to nitrate. Annu. Rev. Plant Biol. 2002, 53, 203–224. [Google Scholar] [CrossRef] [PubMed]
- Wu, J.-D.; Li, J.-C.; Wang, C.-Y.; Wei, F.-Z.; Zhang, Y.; Wu, W.-M. Effects of spraying foliar nitrogen on activities of key regulatory enzymes involved in protein formation in winter wheat suffered post-anthesis high temperature and waterlogging. J. Food Agric. Environ. 2013, 11, 668–673. [Google Scholar]
- Wu, J.-D.; Li, J.-C.; Wei, F.-Z.; Wang, C.-Y.; Zhang, Y.; Sun, G. Effects of nitrogen spraying on the post-anthesis stage of winter wheat under waterlogging stress. Acta Physiol. Plant. 2014, 36, 207–216. [Google Scholar] [CrossRef]
- Ritter, W.; Beer, C. Yield reduction by controlled flooding of corn. Trans. ASAE 1969, 12, 46-0047. [Google Scholar]
- Kaur, G.; Zurweller, B.A.; Nelson, K.A.; Motavalli, P.P.; Dudenhoeffer, C.J. Soil waterlogging and nitrogen fertilizer management effects on corn and soybean yields. Agron. J. 2017, 109, 97–106. [Google Scholar] [CrossRef]
- Ren, B.; Zhang, J.; Dong, S.; Liu, P.; Zhao, B.; Li, H. Nitrapyrin improves grain yield and nitrogen use efficiency of summer maize waterlogged in the field. Agron. J. 2017, 109, 185–192. [Google Scholar] [CrossRef]
- Nielsen, R.L. Effects of Flooding or Ponding on Corn Prior to Tasseling. Corny News Network, Purdue Univ.. 2015. Available online: http://www.Kingcorn.Org/news/timeless/pondingyoungcorn.Html (accessed on 1 September 2016).
- Motavalli, P.P.; Goyne, K.W.; Udawatta, R.P. Environmental impacts of enhanced-efficiency nitrogen fertilizers. Crop Manag. 2008, 7. [Google Scholar] [CrossRef]
- Noellsch, A.; Motavalli, P.; Nelson, K.A.; Kitchen, N.R. Corn response to conventional and slow-release nitrogen fertilizers across a claypan landscape. Agron. J. 2009, 101, 607–614. [Google Scholar] [CrossRef]
- Nelson, K.A.; Scharf, P.C.; Stevens, W.E.; Burdick, B.A. Rescue nitrogen applications for corn. Soil Sci. Soc. Am. J. 2011, 75, 143–151. [Google Scholar] [CrossRef]
- Gagnon, B.; Ziadi, N.; Grant, C. Urea fertilizer forms affect grain corn yield and nitrogen use efficiency. Can. J. Soil Sci. 2012, 92, 341–351. [Google Scholar] [CrossRef] [Green Version]
- Nathan, M.V.; Stecker, J.A.; Sun, U. Soil Testing in Missouri: A Guide for Conducting Soil Tests in Missouri; Univ. Mo. Ext. Publ. EC 923; University of Missouri: Columbia, Missouri, 2012. [Google Scholar]
- Abendroth, L.J.; Elmore, R.W.; Boyer, M.J.; Marlay, S.K. Corn Growth and Development; Iowa State University Extension: Ames, IA, USA, 2011; Available online: http://store.extension.iastate.edu/Product/Corn-Growth-and-Development (accessed on 1 September 2016).
- Kaur, G. Use of Nitrogen Fertilizer Sources to Enhance Tolerance and Recovery of Corn Hybrids to Excessive Soil Moisture. Ph.D. Thesis, University of Missouri, Columbia, MO, USA, 2016. [Google Scholar]
- Scharf, P.C.; Brouder, S.M.; Hoeft, R.G. Chlorophyll meter readings can predict nitrogen need and yield response of corn in the north-central USA. Agron. J. 2006, 98, 655–665. [Google Scholar] [CrossRef]
- Markwell, J.; Osterman, J.C.; Mitchell, J.L. Calibration of the minolta spad-502 leaf chlorophyll meter. Photosynth. Res. 1995, 46, 467–472. [Google Scholar] [CrossRef] [PubMed]
- Solari, F.; Shanahan, J.; Ferguson, R.; Schepers, J.; Gitelson, A. Active sensor reflectance measurements of corn nitrogen status and yield potential. Agron. J. 2008, 100, 571–579. [Google Scholar] [CrossRef]
- Sas, I. Sas System for Windows, Version 9.3; SAS Institute: Cary, NC, USA, 2010. [Google Scholar]
- Sunderman, H.; Lamm, F. Measuring leaf chlorophyll in wheat and corn. Agric. Res. Rep. Prog. 1991, 635, 85–87. [Google Scholar]
- Zaidi, P.; Maniselvan, P.; Srivastava, A.; Yadav, P.; Singh, R. Genetic analysis of water-logging tolerance in tropical maize (Zea mays L.). Maydica 2010, 55, 17–26. [Google Scholar]
- Schepers, J.; Francis, D.; Vigil, M.; Below, F. Comparison of corn leaf nitrogen concentration and chlorophyll meter readings. Commun. Soil Sci. Plant Anal. 1992, 23, 2173–2187. [Google Scholar] [CrossRef]
- Bullock, D.; Anderson, D. Evaluation of the minolta spad-502 chlorophyll meter for nitrogen management in corn. J. Plant Nutr. 1998, 21, 741–755. [Google Scholar] [CrossRef]
- Wood, C.W.R.; Reeves, D.W.; Himelrick, D.G. Relationships between chlorophyll meter readings and leaf chlorophyll concentration, n status and crop yield: A review. Agron. N. Z. J. 1993, 23, 1–9. [Google Scholar]
- Kumagai, E.; Araki, T.; Kubota, F. Correlation of chlorophyll meter readings with gas exchange and chlorophyll fluorescence in flag leaves of rice (Oryza sativa L.) plants. Plant Prod. Sci. 2009, 12, 50–53. [Google Scholar] [CrossRef]
- Bin, Y.; Dai, Q. Ameliorative effects of exogenous active oxygen scavengers on waterlogging injury of maize plants. Acta Agric. Boreali-Sin. 1995, 10, 51–55. [Google Scholar]
- Malik, A.I.; Colmer, T.D.; Lambers, H.; Setter, T.L.; Schortemeyer, M. Short-term waterlogging has long-term effects on the growth and physiology of wheat. New Phytol. 2002, 153, 225–236. [Google Scholar] [CrossRef]
- De Souza, T.C.; Magalhães, P.C.; Pereira, F.J.; de Castro, E.M.; Parentoni, S.N. Morpho-physiology and maize grain yield under periodic soil flooding in successive selection cycles. Acta Physiol. Plant. 2011, 33, 1877–1885. [Google Scholar] [CrossRef]
- Wang, X.; Liu, T.; Li, C.; Chen, H. Effects of soil flooding on photosynthesis and growth of Zea mays L. Seedlings under different light intensities. Afr. J. Biotechnol. 2012, 11, 7676–7685. [Google Scholar]
- Rathore, T.; Warsi, M.; Singh, N.; Vasal, S. Production of maize under excess soil moisture (waterlogging) conditions. In Proceedings of the 2nd Asian Regional Maize Workshop PACARD, Los Banos, Philippines, 23 February 1998; pp. 23–27. [Google Scholar]
- Martínez, D.; Guiamet, J. Distortion of the spad 502 chlorophyll meter readings by changes in irradiance and leaf water status. Agronomie 2004, 24, 41–46. [Google Scholar] [CrossRef]
- Ashraf, M. Interactive effects of nitrate and long-term waterlogging on growth, water relations and gaseous exchange properties of maize (Zea mays L.). Plant Sci. 1999, 144, 35–43. [Google Scholar] [CrossRef]
- Ren, B.; Zhu, Y.; Li, X.; Fan, X.; Dong, S.; Zhao, B.; Liu, P.; Zhang, J. Effects of waterlogging on photosynthetic characteristics of summer maize under field conditions. Acta Agron. Sin. 2015, 41, 329–338. [Google Scholar] [CrossRef]
- Kisaakye, E.; Botwright Acuna, T.; Johnson, P.; Shabala, S. Effect of water availability and nitrogen source on wheat growth and nitrogen-use efficiency. In Proceedings of the 17th Australian Society of Agronomy Conference, Hobart, Australia, 20–24 September 2015; pp. 1–4. [Google Scholar]
- Ahmad, N. Monitoring High Water Table Effects on Corn Growth and Water Quality in Growth Chambers and Field Lysimeters; Iowa State University: Ames, IA, USA, 1991. [Google Scholar]
- Ren, B.; Zhang, J.; Li, X.; Fan, X.; Dong, S.; Liu, P.; Zhao, B. Effects of waterlogging on the yield and growth of summer maize under field conditions. Can. J. Plant Sci. 2014, 94, 23–31. [Google Scholar] [CrossRef]
- Harris, R.H.; Armstrong, R.D.; Wallace, A.J.; Belyaeva, O.N. Delaying nitrogen fertiliser application improves wheat 15N recovery from high rainfall cropping soils in south eastern australia. Nutr. Cycl. Agroecosyst. 2016, 106, 113–128. [Google Scholar] [CrossRef]
- Amin, M.; Karim, M.; Khaliq, Q.; Islam, M.; Aktar, S. Effect of nitrogen and potassium on the root growth, nutrient content and yield of mungbean (Vigna radiata L. Wilczek) under waterlogged condition. Agriculturists 2016, 13, 67–78. [Google Scholar] [CrossRef]
- Torbert, H.; Hoeft, R.; Vanden Heuvel, R.; Mulvaney, R.; Hollinger, S. Short-term excess water impact on corn yield and nitrogen recovery. J. Prod. Agric. 1993, 6, 337–344. [Google Scholar] [CrossRef]
- Sigua, G.C.; Williams, M.M.; Chase, C.C., Jr.; Grabowski, J.; Kongchum, M. Nitrogen recovery and agronomic efficiency of forages with nitrogen fertilization under flooded condition. Agric. Sci. 2013, 4, 138. [Google Scholar] [CrossRef]
Figure 1.
Daily (bars) and cumulative (line) precipitation during the 2013 (A), 2014 (B) and 2015 (C) growing seasons at the Greenley Research Center near Novelty, Missouri. Timings of major field events are indicated by arrows.
Figure 1.
Daily (bars) and cumulative (line) precipitation during the 2013 (A), 2014 (B) and 2015 (C) growing seasons at the Greenley Research Center near Novelty, Missouri. Timings of major field events are indicated by arrows.

Figure 2.
Average daily air temperature during the 2013 (A), 2014 (B) and 2015 (C) growing seasons at the Greenley Research Center near Novelty, Missouri. Timings of major field events are indicated by arrows.
Figure 2.
Average daily air temperature during the 2013 (A), 2014 (B) and 2015 (C) growing seasons at the Greenley Research Center near Novelty, Missouri. Timings of major field events are indicated by arrows.

Figure 3.
Chlorophyll meter readings (A) and stomatal conductance (B) taken during the waterlogging as affected by main effects of pre-plant N fertilizer sources events in 2013, 2014 and 2015 growing season. Data were averaged over the waterlogging duration and corn hybrids due to absence of their interaction with pre-plant N fertilizer sources. The similar letter on the bars indicate no significant differences between means at p < 0.10. Means are compared separately for each year. Abbreviations: CO, non-fertilized control; NCU, non-coated urea; PCU, polymer coated urea; NCU + NI, non-coated urea + nitrification inhibitor; NR, no rescue N application; NCU + UI, non-coated urea + urease inhibitor.

Figure 4.
Changes in chlorophyll meter readings taken during the waterlogging events in 2013 (A), 2014 (B) and 2015 (C) growing season. Vertical bars indicate ± 1 standard deviation. * Indicates significant differences between waterlogged and non-waterlogged treatments for that particular day at p < 0.10. Interaction of hybrids with waterlogging duration was significant during the 2013 (A) but not in 2014 and 2015 (B,C).

Figure 5.
Changes in leaf stomatal conductance in 7-days waterlogged and non-waterlogged treatments in the 2013, 2014 and 2015 growing season. * Indicates significant differences between 7-days waterlogged and non-waterlogged treatments for that particular day at p < 0.1.
Figure 5.
Changes in leaf stomatal conductance in 7-days waterlogged and non-waterlogged treatments in the 2013, 2014 and 2015 growing season. * Indicates significant differences between 7-days waterlogged and non-waterlogged treatments for that particular day at p < 0.1.

Figure 6.
Apparent N recovery efficiency as affected by the interaction between waterlogging duration and rescue N applications in 2013. Similar letter on the bars indicate no significant differences between means at p < 0.10.
Figure 6.
Apparent N recovery efficiency as affected by the interaction between waterlogging duration and rescue N applications in 2013. Similar letter on the bars indicate no significant differences between means at p < 0.10.


Table 1.
Selected initial soil properties by depth in 2013, 2014 and 2015. Data were averaged over three replications.
Table 1.
Selected initial soil properties by depth in 2013, 2014 and 2015. Data were averaged over three replications.
| Year | Depth | pHs ‡ | NA ‡ | CEC ‡ | Organic Matter | Bray-1 P | Exchangeable | ||
|---|---|---|---|---|---|---|---|---|---|
| Ca | Mg | K | |||||||
| cm | cmolc kg−1 | g kg−1 | kg ha−1 | ||||||
| 2013 | 0–10 | 6.0 ± 0.1 † | 2.0 ± 0.5 | 13 ± 1 | 28 ± 2 | 78 ± 12 | 4204 ± 414 | 380 ± 20 | 417 ± 13 |
| 10–20 | 6.1 ± 0.1 | 1.8 ± 0.3 | 13 ± 1 | 19 ± 3 | 18 ± 5 | 4294 ± 131 | 295 ± 20 | 138 ± 10 | |
| 20–30 | 5.4 ± 0.1 | 4.0 ± 0.0 | 16 ± 2 | 18 ± 2 | 16 ± 6 | 4233 ± 701 | 509 ± 101 | 147 ± 42 | |
| 2014 | 0–10 | 6.0 ± 0.2 | 1.7 ± 0.3 | 15 ± 0 | 23 ± 1 | 75 ± 11 | 4844 ± 194 | 499 ± 21 | 256 ± 7 |
| 10–20 | 5.7 ± 0.1 | 2.7 ± 0.3 | 15 ± 1 | 16 ± 2 | 16 ± 2 | 4298 ± 342 | 565 ± 80 | 157 ± 8 | |
| 20–30 | 4.7 ± 0.1 | 7.3 ± 0.8 | 25 ± 2 | 18 ± 3 | 11 ± 2 | 5858 ± 446 | 1273 ± 98 | 266 ± 27 | |
| 2015 | 0–10 | 5.3 ± 0.2 | 2.7 ± 0.6 | 11 ± 1 | 27 ± 2 | 93 ± 4 | 2950 ± 144 | 350 ± 11 | 364 ± 20 |
| 10–20 | 5.9 ± 0.4 | 1.5 ± 0.7 | 10 ± 0 | 19 ± 1 | 15 ± 2 | 3111 ± 91 | 353 ± 5 | 111 ± 2 | |
| 20–30 | 4.9 ± 0.2 | 4.5 ± 0.9 | 14 ± 1 | 19 ± 0 | 7 ± 2 | 3187 ± 23 | 564 ± 21 | 90 ± 5 | |
† ± standard deviation. ‡ Abbreviations: pHs, pH in 0.01 M CaCl2; NA, Neutralizable Acidity; P, Bray-1 Phosphorus; Ca, Calcium; Mg, Magnesium; K, Potassium; CEC, Cation Exchange Capacity.
Table 2.
Field treatment information and crop management for corn from 2013 to 2015.
| Year | Field Treatments and Management † | Date | Rate |
|---|---|---|---|
| 2013 | N application | 14 May | 168 kg N ha−1 |
| Planting | 15 May | 81,512 seeds ha−1 | |
| Waterlogging treatments | 3 June | ||
| Rescue N application | 1 July | 84 kg N ha−1 | |
| Weed management (PRE) | 21 May | ||
| Acetochlor ‡ | 1.10 g a.i. ha−1 | ||
| clopyralid | 0.12 g a.i. ha−1 | ||
| flumetsulam | 0.03 g a.i. ha−1 | ||
| glyphosate | 1.50 kg a.i. ha−1 | ||
| Weed management (POST) | 27 June | ||
| mesotrione | 0.10 g a.i. ha−1 | ||
| glyphosate | 1.50 kg a.i. ha−1 | ||
| Harvesting | 18 September | ||
| 2014 | N application | 18 April | 168 kg N ha−1 |
| Planting | 18 April | 81,512 seeds ha−1 | |
| Waterlogging treatments | 15 May | ||
| Rescue N application | 9 June | 84 kg N ha−1 | |
| Weed management (PRE) | 6 May | ||
| acetochlor | 1.10 g a.i. ha−1 | ||
| atrazine | 0.12 kg a.i. ha−1 | ||
| glyphosate | 1.50 kg a.i. ha−1 | ||
| Weed management (POST) | 27 June | ||
| topramezone | 0.04 kg a.i. ha−1 | ||
| glyphosate | 1.50 kg a.i. ha−1 | ||
| Harvesting | 29 September | ||
| 2015 | N application | 22 April | 168 kg N ha−1 |
| Planting | 22 April | 81,512 seeds ha−1 | |
| Waterlogging treatments | 13 May | ||
| Rescue N application | 7 June | 84 kg N ha−1 | |
| Weed management (PRE) | 6 May | ||
| metolachlor | 1.07 g a.i. ha−1 | ||
| atrazine | 0.12 g a.i. ha−1 | ||
| glyphosate | 1.50 kg a.i. ha−1 | ||
| Weed management (POST) | 20 June | ||
| topramezone | 0.04 g a.i. ha−1 | ||
| glyphosate | 1.50 kg a.i. ha−1 | ||
| Harvesting | 16 September |
Abbreviations: PRE, pre-emergence; POST, post-emergence. † All crop protection products were applied with appropriate adjuvants and additives. ‡ Chemical name for herbicides: acetochlor [2-chloro-2′-methyl-6′-ethyl-N-ethoxymethylacetanilide]; atrazine [2-chloro-4-(ethylamino)-6-(isopropylamino)-s-triazine]; flumetsulam [N-(2,6-difluorophenyl)-5-methyl-1,2,4-triazolo-[1,5a]-pyrimidine-2-sulfonamide]; glyphosate [N-(phosphonomethyl)glycine]; mesotrione [2-[4-(methylsulfonyl)-2-nitrobenzoyl-1,3-cyclohexanedione]; Metolachlor [2-chloro-N-(2-ethyl-6-methylphenyl)-N-(1-methoxypropan-2-yl)acetamide]; clopyralid [2-aminoethanol;3,6-dichloropyridine-2-carboxylic acid]; Topramezone [[3-(4,5-Dihydro-3-isoxazolyl)-2-methyl-4-(methylsulfonyl)phenyl](5-hydroxy-1-methyl-1H-pyrazol-4-yl)methanone].
Table 3.
The p-values from the MIXED procedure of SAS statistical software for corn silage N concentration, N uptake, ear leaf N concentration and apparent N recovery efficiency for the 2013, 2014 and 2015 growing seasons.
Table 3.
The p-values from the MIXED procedure of SAS statistical software for corn silage N concentration, N uptake, ear leaf N concentration and apparent N recovery efficiency for the 2013, 2014 and 2015 growing seasons.
| Source of Variation | Silage N Concentration | Corn N Uptake | Ear Leaf N Concentration | Apparent N Recovery Efficiency | |||||||
|---|---|---|---|---|---|---|---|---|---|---|---|
| 2013 | 2014 | 2015 | 2013 | 2014 | 2015 | 2013 | 2014 | 2015 | 2013 | 2014 | |
| P > F | |||||||||||
| Waterlogging duration (WD) | 0.201 | 0.780 | 0.327 | 0.570 | 0.206 | 0.077 | 0.001 | 0.628 | 0.646 | 0.636 | 0.507 |
| Pre-plant N fertilizers (PPF) | 0.545 | 0.263 | 0.867 | 0.208 | 0.315 | 0.012 | 0.201 | 0.001 | 0.008 | 0.3992 | 0.5363 |
| WD × PPF | 0.563 | 0.465 | 0.574 | 0.906 | 0.367 | 0.834 | 0.009 | 0.393 | 0.054 | 0.9273 | 0.2567 |
| Corn hybrids (CH) | 0.061 | 0.361 | 0.068 | 0.658 | 0.119 | 0.776 | 0.396 | 0.068 | 0.097 | 0.6294 | 0.3492 |
| WD × CH | 0.888 | 0.900 | 0.962 | 0.621 | 0.215 | 0.210 | 0.972 | 0.990 | 0.788 | 0.8938 | 0.1627 |
| PPF × CH | 0.663 | 0.658 | 0.300 | 0.940 | 0.291 | 0.449 | 0.140 | 0.863 | 0.731 | 0.9118 | 0.5063 |
| WD × PPF × CH | 0.565 | 0.650 | 0.891 | 0.929 | 0.707 | 0.295 | 0.027 | 0.796 | 0.881 | 0.7121 | 0.8116 |
| Rescue N (RN) | 0.003 | 0.995 | 0.017 | 0.032 | 0.616 | 0.003 | 0.000 | <0.0001 | <0.0001 | 0.3722 | 0.0027 |
| WD × RN | 0.542 | 0.944 | 0.216 | 0.810 | 0.991 | 0.011 | 0.289 | 0.020 | 0.825 | 0.0103 | 0.2227 |
| PPF × RN | 0.171 | 0.264 | 0.166 | 0.205 | 0.345 | 0.841 | 0.706 | 0.001 | 0.043 | 0.3681 | 0.8736 |
| WD × PPF × RN | 0.052 | 0.061 | 0.067 | 0.008 | 0.056 | 0.195 | 0.128 | 0.071 | 0.103 | 0.4119 | 0.2844 |
| CH × RN | 0.438 | 0.041 | 0.872 | 0.270 | 0.653 | 0.877 | 0.952 | 0.109 | 0.041 | 0.4893 | 0.2509 |
| WD × CH × RN | 0.978 | 0.275 | 0.633 | 0.862 | 0.510 | 0.296 | 0.315 | 0.946 | 0.947 | 0.6415 | 0.6254 |
| PPF x CH x RN | 0.980 | 0.360 | 0.675 | 0.927 | 0.680 | 0.313 | 0.357 | 0.754 | 0.676 | 0.9051 | 0.9418 |
| WD × PPF × CH × RN | 0.239 | 0.033 | 0.937 | 0.946 | 0.109 | 0.294 | 0.209 | 0.422 | 0.579 | 0.7748 | 0.4485 |
Table 4.
Effects of waterlogging duration, corn hybrids, rescue N application and pre-plant N fertilizer sources on ear leaf N concentration in 2013 and 2014.
Table 4.
Effects of waterlogging duration, corn hybrids, rescue N application and pre-plant N fertilizer sources on ear leaf N concentration in 2013 and 2014.
| Pre-Plant N Fertilizer Sources | Waterlogging Duration (in Days) | 2013 | 2014 | ||
|---|---|---|---|---|---|
| Corn Hybrids | Rescue N Application | ||||
| #1 | #2 | NR | NCU + UI | ||
| Ear Leaf N Concentration (g N kg−1) | |||||
| CO ‡ | 0 | 25.44ef † | 24.50f | 26.15bc | 28.67ab |
| PCU | 0 | 26.01def | 25.25f | 29.76ab | 31.81a |
| NCU | 0 | 26.42cdef | 25.88def | 30.90a | 30.29ab |
| NCU + NI | 0 | 25.17f | 26.45cdef | 28.75ab | 31.60a |
| CO | 7 | 29.87ab | 30.10a | 23.06c | 31.57a |
| PCU | 7 | 26.58cdef | 28.49abcd | 28.32ab | 31.34a |
| NCU | 7 | 29.26abc | 27.02bcdef | 31.91a | 32.57a |
| NCU + NI | 7 | 29.36abc | 28.39abcde | 29.29ab | 32.08a |
† Means followed by the same letter do not differ significantly (p < 0.10) based on Fisher’s least significant difference test. Means are compared separately for an individual year. ‡ Abbreviations: CO, non-fertilized control; NCU, non-coated urea; PCU, polymer coated urea; NCU + NI, non-coated urea + nitrification inhibitor; NR, no rescue N application; NCU + UI, non-coated urea + urease inhibitor.
Table 5.
Ear leaf N concentration as affected by the interaction of waterlogging duration, rescue N applications and pre-plant N fertilizer sources in 2015.
Table 5.
Ear leaf N concentration as affected by the interaction of waterlogging duration, rescue N applications and pre-plant N fertilizer sources in 2015.
| Pre-Plant N Fertilizer Sources | Waterlogging Duration (in Days) | Rescue N Application | ||
|---|---|---|---|---|
| 0 | 7 | NR | NCU + UI | |
| Ear Leaf N concentration (g N kg−1) | ||||
| CO ‡ | 15.55b † | 20.05ab | 16.26d | 19.34bcd |
| PCU | 25.69a | 20.83ab | 22.78abc | 23.74ab |
| NCU | 22.88a | 19.48ab | 17.93cd | 24.43ab |
| NCU + NI | 24.96a | 23.22a | 21.67bcd | 26.51a |
† Means followed by the same letter do not differ significantly (p < 0.10) based on Fisher’s least significant difference test. Means are compared separately for an individual year. ‡ Abbreviations: CO, non-fertilized control; NCU, non-coated urea; PCU, polymer coated urea; NCU + NI, non-coated urea + nitrification inhibitor; NR, no rescue N application; NCU + UI, non-coated urea + urease inhibitor.
Table 6.
Effects of waterlogging duration, pre-plant N fertilizer sources and rescue N application on silage N concentration, N uptake and apparent N recovery efficiency (ARE) among different growing seasons.
Table 6.
Effects of waterlogging duration, pre-plant N fertilizer sources and rescue N application on silage N concentration, N uptake and apparent N recovery efficiency (ARE) among different growing seasons.
| Waterlogging Duration (in Days) | Pre-Plant N Fertilizer Sources | Rescue N | Silage N Concentration | N Uptake | |||
|---|---|---|---|---|---|---|---|
| 2013 | 2014 | 2015 | 2013 | 2014 | |||
| g kg−1 | kg ha−1 | ||||||
| 0 | CO‡ | NR | 8.72b † | 7.92a | 7.31b | 132b | 159b |
| 0 | PCU | NR | 10.14ab | 10.06a | 7.67b | 177ab | 240a |
| 0 | NCU | NR | 10.75ab | 10.79a | 7.41b | 201a | 231a |
| 0 | NCU + NI | NR | 9.14ab | 8.22a | 7.83ab | 172ab | 186ab |
| 0 | CO | NCU + UI | 9.85ab | 8.91a | 7.30b | 172a | 195ab |
| 0 | PCU | NCU + UI | 10.61ab | 8.99a | 11.11a | 205a | 209a |
| 0 | NCU | NCU + UI | 10.92ab | 9.70a | 8.41ab | 184a | 227a |
| 0 | NCU + NI | NCU + UI | 10.40ab | 9.32a | 8.58ab | 182a | 205a |
| 7 | CO ‡ | NR | 11.75ab | 9.53a | 9.80ab | 169b | 171b |
| 7 | PCU | NR | 10.49ab | 10.26a | 9.02ab | 162b | 173b |
| 7 | NCU | NR | 9.97ab | 8.71a | 8.95ab | 139b | 180b |
| 7 | NCU + NI | NR | 10.21ab | 8.96a | 8.29ab | 172ab | 187ab |
| 7 | CO | NCU + UI | 10.37ab | 8.79a | 8.95ab | 139b | 183ab |
| 7 | PCU | NCU + UI | 11.84ab | 9.84a | 8.65ab | 216a | 241a |
| 7 | NCU | NCU + UI | 12.30ab | 9.68a | 9.63ab | 205a | 136b |
| 7 | NCU + NI | NCU + UI | 12.42a | 9.21a | 10.57ab | 158b | 169b |
| Average over all treatments | 10.62 | 9.31 | 8.72 | 193 | 174 | ||
† Means followed by the same letter within a column do not differ significantly (p < 0.10) based on Fisher’s least significant difference test. Data were averaged over two hybrids. ‡ Abbreviations: CO, non-fertilized control; NCU, non-coated urea; PCU, polymer coated urea; NCU + NI, non-coated urea + nitrification inhibitor; NR, no rescue N application; NCU + UI, non-coated urea + urease inhibitor.
Table 7.
Nitrogen uptake as affected by the interaction of waterlogging duration and rescue N in 2015.
Table 7.
Nitrogen uptake as affected by the interaction of waterlogging duration and rescue N in 2015.
| Waterlogging Duration (in Days) | Rescue N | N Uptake |
|---|---|---|
| kg ha−1 | ||
| 0 | NR | 126b † |
| 0 | NCU + UI | 185a |
| 7 | NR | 93b |
| 7 | NCU + UI | 100b |
† Means followed by the same letter within a column do not differ significantly (p < 0.10) based on Fisher’s least significant difference test.
© 2018 by the authors. Licensee MDPI, Basel, Switzerland. This article is an open access article distributed under the terms and conditions of the Creative Commons Attribution (CC BY) license (http://creativecommons.org/licenses/by/4.0/).
Share and Cite
MDPI and ACS Style
Kaur, G.; Nelson, K.A.; Motavalli, P.P. Early-Season Soil Waterlogging and N Fertilizer Sources Impacts on Corn N Uptake and Apparent N Recovery Efficiency. Agronomy 2018, 8, 102. https://doi.org/10.3390/agronomy8070102
AMA Style
Kaur G, Nelson KA, Motavalli PP. Early-Season Soil Waterlogging and N Fertilizer Sources Impacts on Corn N Uptake and Apparent N Recovery Efficiency. Agronomy. 2018; 8(7):102. https://doi.org/10.3390/agronomy8070102
Chicago/Turabian StyleKaur, Gurpreet, Kelly A. Nelson, and Peter P. Motavalli. 2018. "Early-Season Soil Waterlogging and N Fertilizer Sources Impacts on Corn N Uptake and Apparent N Recovery Efficiency" Agronomy 8, no. 7: 102. https://doi.org/10.3390/agronomy8070102
Note that from the first issue of 2016, this journal uses article numbers instead of page numbers. See further details here.