Article

Genome-Wide Identification and Expression Analysis of Heat Shock Transcription Factor Family in Chenopodium quinoa Willd

1
State Key Laboratory of 1Crop Stress Biology in Arid Areas and College of Agronomy, Northwest A&F University, Yangling 712100, Shaanxi, China
2
Department of Plant Science, Xizang Agriculture and Animal Husbandry College, Linzhi 860000, Tibet, China
*
Authors to whom correspondence should be addressed.
These authors contributed equally to this work.
Agronomy 2018, 8(7), 103; https://doi.org/10.3390/agronomy8070103
Submission received: 1 May 2018 / Revised: 7 June 2018 / Accepted: 21 June 2018 / Published: 28 June 2018

Abstract

:
Heat shock transcription factor (Hsf) is one of the conserved gene families in plants, playing a crucial role in growth and development, as well as in response to diverse stresses. Although it has been systematically studied in many species, little is known about the Hsf gene family in Chenopodium quinoa, especially those involved in the regulatory network of stress processes. In this study, we identified 23 Hsf genes in quinoa (CqHsfs) through a genome-wide search method based on the latest available genome information. Phylogenetic analysis classified them into three groups, and group A was further divided into nine subgroups, which was supported by conserved domain organizations. Gene structure and multiple sequence alignment analysis revealed that all of the CqHsfs possessed a similar structure organization and were highly conserved in BDB domain. Interaction network analysis identified 13 CqHsfs involved in the network pathway to regulate diverse biological processes. Expression profiles of these CqHsfs were further investigated using the RNA-seq data, and tissue-specific and stress-responsive candidates were identified. Finally, four heat-responsive CqHsfs were selected to validate their expression level through semi-quantitative RT-PCR analysis. This study reported the organization, structure, and expression profiles of the Hsf gene family in quinoa, which will contributes to further functional analysis, and helps to better understand the roles and regulatory mechanism of heat shock factors playing in quinoa and beyond.

1. Introduction

Salinity, drought, heat, and cold as well as chemical toxicity are the main environmental stresses that damage plant growth and development to cause serious yield reduction of crop productivity and economic loss annually [1]. Among them, heat stress has gradually become the most detrimental factors with the advent of global warming. Generally, high temperatures lead to cellular damage and cell program death, resulting in the impairment of plant growth and development throughout the whole ontogeny, such as seed germination, photosynthesis, respiration, and membrane stability [2]. In addition, heat stress induces the excess reactive oxygen species (ROS), which leads to oxidative stress. In the long-term evolutional process, plants have implemented various mechanisms to cope with heat stress, of which heat shock transcription factors (Hsfs) acted as the crucial factor to regulate this process. Extensive studies has revealed that Hsfs were the terminal of the heat signal transduction processes, through mediating the expression of responsive genes and related-chemicals to activate a variety of biological pathways in response to heat shock stress [2,3].
Despite variations found in gene sequence and gene size, the promoter recognition mode and basic structure of Hsfs are highly conserved in eukaryotic organisms [4]. DNA-binding domain (DBD) is the characteristic element of Hsfs, locating close to the N-terminal and having highly conserved structure. It found that all of the DBD in Hsfs consisted of a three-helical bundle (H1, H2, H3) and an antiparallel four-stranded β-sheet [5,6,7]. The hydrophobic core of DBD ensures the precise positioning of the central helix-ture-helix (H2-T-H3) structure required for specific recognition of the heat stress promoter elements (HSE) [8,9]. Heat stress promoter element motifs locate the upstream of TATA-box and consist of repetitive patterns of palindromic binding motifs (5′-AGAAnnTTCT-3′) [10]. The oligomerization domain (HR-A/B region) is composed of hydrophobic heptad repeats and separated from the conserved domain by a flexible linker with variable length, which is responsible for the formation of a helical coiled-coil structure to trimerization of Hsfs [11]. In plants, Hsf families are further divided into A, B, and C class according to their HR-A/B regions and peculiarities of their flexible linkers [4]. The nuclear export signal (NES) at the C-terminus of Hsfs is hydrophobic and rich in leucine residue, which is required for the balance of nuclear import and export processes together with nuclear localization signal (NLS) [12,13]. The C-terminal activator motifs (AHA motifs) are rich in aromatic (W, F, Y), hydrophobic (L, I, V), and acidic (E, D) amino acid residues, and play an important role in activator function of Hsf genes [14]. The AHA motifs, together with nuclear export signal (NES), represent the core of the C-terminal activation domain (CTAD) of many plant class A Hsfs [15]. However, class B and C Hsfs have no activator function because of the lacking of AHA motifs [16].
Compared to fungi and animals, plants possessed larger numbers of Hsf genes as they might play the diverse functions in preventing stress damage [16,17]. With more and more plant genomes being available, the Hsf gene family has been identified and characterized in many plant species, such as arabidopsis, rice, maize, soybean, wheat, and so on [3,18,19,20,21]. Genome-wide identification of the Hsf genes in different species not only provides useful information on the biological function analysis of this important gene family, but also contributes to reveal the origin and evolution of it. More and more Hsf genes has been functionally clarified up to now.
Quinoa (Chenopodium quinoa Willd.) is a well-known grain crop originally domesticated in the Andean area as early as 7000 years ago, which has attracted the world’s attentions due to its nutrient value and high resistance to multiple abiotic stresses [22]. The seed of quinoa contains higher protein content than other major cereals, with a well-balanced amino acid composition and richness in several minerals. Furthermore, it is adapted to the harsh climate of the Andean area, holding the excellent abiotic stresses tolerance. Thus, it is regarded as a future crop to ensure global food security and the ideal healthy food for humans [23].
However, this Hsf gene family in quinoa is not well studied and only the Hsp70 family has been investigated at present [24]. In this study, a genome-search method was performed to identify the Hsf gene family in quinoa and a total of 23 Hsf genes were found. Phylogenetic tree and conserved motifs analysis of CqHsfs clustered all the CqHsfs into three groups. Furthermore, a network interaction analysis of CpHsfs was performed. Finally, the expression patterns of 23 CqHsf genes in different tissues and different stressed conditions were investigated using RNA-seq data to obtain the tissues-specific or stress-responsive ones. Additionally, four heat-responsive CqHsfs were selected to validate their expression level through semi-quantitative RT-PCR analysis. In conclusion, this study provided the foundation to better understand the evolution and function of the Hsf gene family in quinoa and beyond.

2. Materials and Methods

2.1. Identification of Hsf Genes in the Quinoa Genome

The potential members of the quinoa Hsf gene family were identified following the method described by Wang et al. [25] with some modifications. Firstly, all the available quinoa protein sequences were obtained from the Ensembl Plants database as a local protein database [26]. Then, BLASTP (Basic Local Alignment Search Tool Proteins) search was performed using the Hsf genes of arabidopsis as queries with the e-value of 1 × 10⁻⁵ and identity of 50% as the threshold. Furthermore, the available hidden Markov model (HMM) profile of the Hsf gene family was downloaded from the PFAM database [27], and then an HMM search was performed using the hmmsearch tools embedded in HMMER3.0 [28]. Moreover, the available genome and protein sequences of quinoa, which were annotated as Hsf genes, were also downloaded from the NCBI (National Center for Biotechnology Information) database (https://www.ncbi.nlm.nih.gov). After manual redundant removal, the remaining sequences were submitted to NCBI-CDD (Conserved domain database) (http://www.ncbi.nlm.nih.gov/Structure/cdd/wrpsb.cgi) and the PFAM database to identify the presence and integrity of the conserved protein domain to obtain the candidate Hsf genes. The Mw (molecular weight), amino acids length, and theoretical pI (isoelectric point) of these identified Hsf genes were predicted by ExPASy online software.

2.2. Multiple Alignment, Phylogenetic, and Conserved Motif Analysis of CqHsfs

The Hsf protein sequences of four dicot species, including Arabidopsis (Arabidopsis thaliana L.), Poplar (Populus trichocarpa (Torr. & Gray)), soybean (Glycine max L.), and rape (Brassica rapa L.) together with four monocot species, including rice (Oryza sativa), Brachypodium (Brachypodium distachyon L.), barley (Hordeum vulgare L.), as well as maize (Zea mays L.) were downloaded from Heatsterdatabase (http://www.cibiv.at/services/hsf/db/search) [16]. Multiple sequence alignments were performed using ClustalW [29], then the phylogenetic tree was constructed using MEGA7.0 software [30] with the neighbor-joining (NJ) method, and the bootstrap was set to 1000 replications. The conserved protein domains of CqHsfs were predicted by the MEME online program [31]. The gene structure information was obtained from genome annotation file and displayed by the Gene Structure Display Server program [32].

2.3. Interaction Network Analysis of CqHsfs

The interaction network of CqHsfs was constructed based on the homologous genes between quinoa and arabidopsis by submitting the CpHsf genes to INPARANOID8 (http://inparanoid.sbc.su.se/cgi-bin/index.cgi). Then, AraNetV2 (http://www.inetbio.org/aranet) was used to obtain the homologous pairs with arabidopsis (AtHsf). Finally, the interaction network of CqHsfs was visualized by using Cytoscape_v3.2.1 software (http://www.cytoscape.org/) with the edge information.

2.4. Expression Profiles Analysis of CqHsf Genes

The available RNA-seq data of quinoa in different organs and under different stresses were obtained from the NCBI Sequence Read Archive (SRA) database (https://www.ncbi.nlm.nih.gov/sra). Detail information of the dataset we used are listed in Table S1. HISAT2 and StringTie software were used to analyze gene expression level [33]. The FPKM value (fragments per kilobase of transcript per million fragments mapped) of each gene was calculated, and the log10-transformed (FPKM + 1) values of quinoa Hsf genes were used to generate heat maps by using the Pheatmap package in R v3.0.0 software (Lucent Technologies, Murray Hill, NJ, USA).

2.5. Plant Growth, Heat Stress Treatment, and RT-PCR Analysis

Seeds of quinoa cultivar “Real Blanca” were grown in a growth chamber at controlled conditions (20 ± 1 °C, 16-h light/8-h dark cycle). Two week old seedlings were used to perform heat stress treatment. Heat stress was performed by putting the quinoa seedlings into the growth chamber with a temperature of 37 °C. Then, the leaves were collected for RNA extraction at 0, 6, 12, and 24 h after treatment. Total RNA was isolated using RNAiso Reagent (TaKaRa, Dalian, China) according to the manufacturer’s instructions. Then, 4 heat-responsive CqHsfs were randomly selected to validate the expression patterns based on semi-quantitative RT-PCR analysis follow the Chen et al.’s [34] method. The used primers are listed in Table S2 and actin (LOC110724665) was used as the inner reference. Three biological replicates for each sample were performed.

3. Results and Discussion

3.1. Genome-Wide Identification of Hsf Genes in Quinoa

To identify the potential members of Hsf genes in quinoa, both the local BLASTP and HMM search were used. After manual correction, a total of 23 unique genes with conserved HSF domains were identified as the Hsf genes in quinoa. It reported that Hsf family was one of the smallest families in angiosperms with 21 members in arabidopsis, 25 in rice, 19 in castor bean, and 27 in poplar [16]. The size of Hsf genes in quinoa is similar with that of arabidopsis and rice, but significantly lower that of soybean (52) in which recent whole genome duplication (WGD) events have occurred due to palaeopolyploid [16], suggesting there was no recent WGD or gene tandem and segmental duplication occurred in quinoa genome. Furthermore, the identified quinoa Hsf genes were named as CqHsf1 to CqHsf23 according to chromosome localization. The amino acids length, Mw, and theoretical pI of these Hsf genes were also calculated. As shown in Table 1, the protein length of putative CqHsf genes ranged from 251 to 546 amino acids, with molecular weight (Mw) ranged from 28.9 to 60.7 kDa and theoretical pI ranged from 4.74 to 8.49, respectively, showing that there were significant differences among CqHsfs in physical and chemical properties (Table 1).

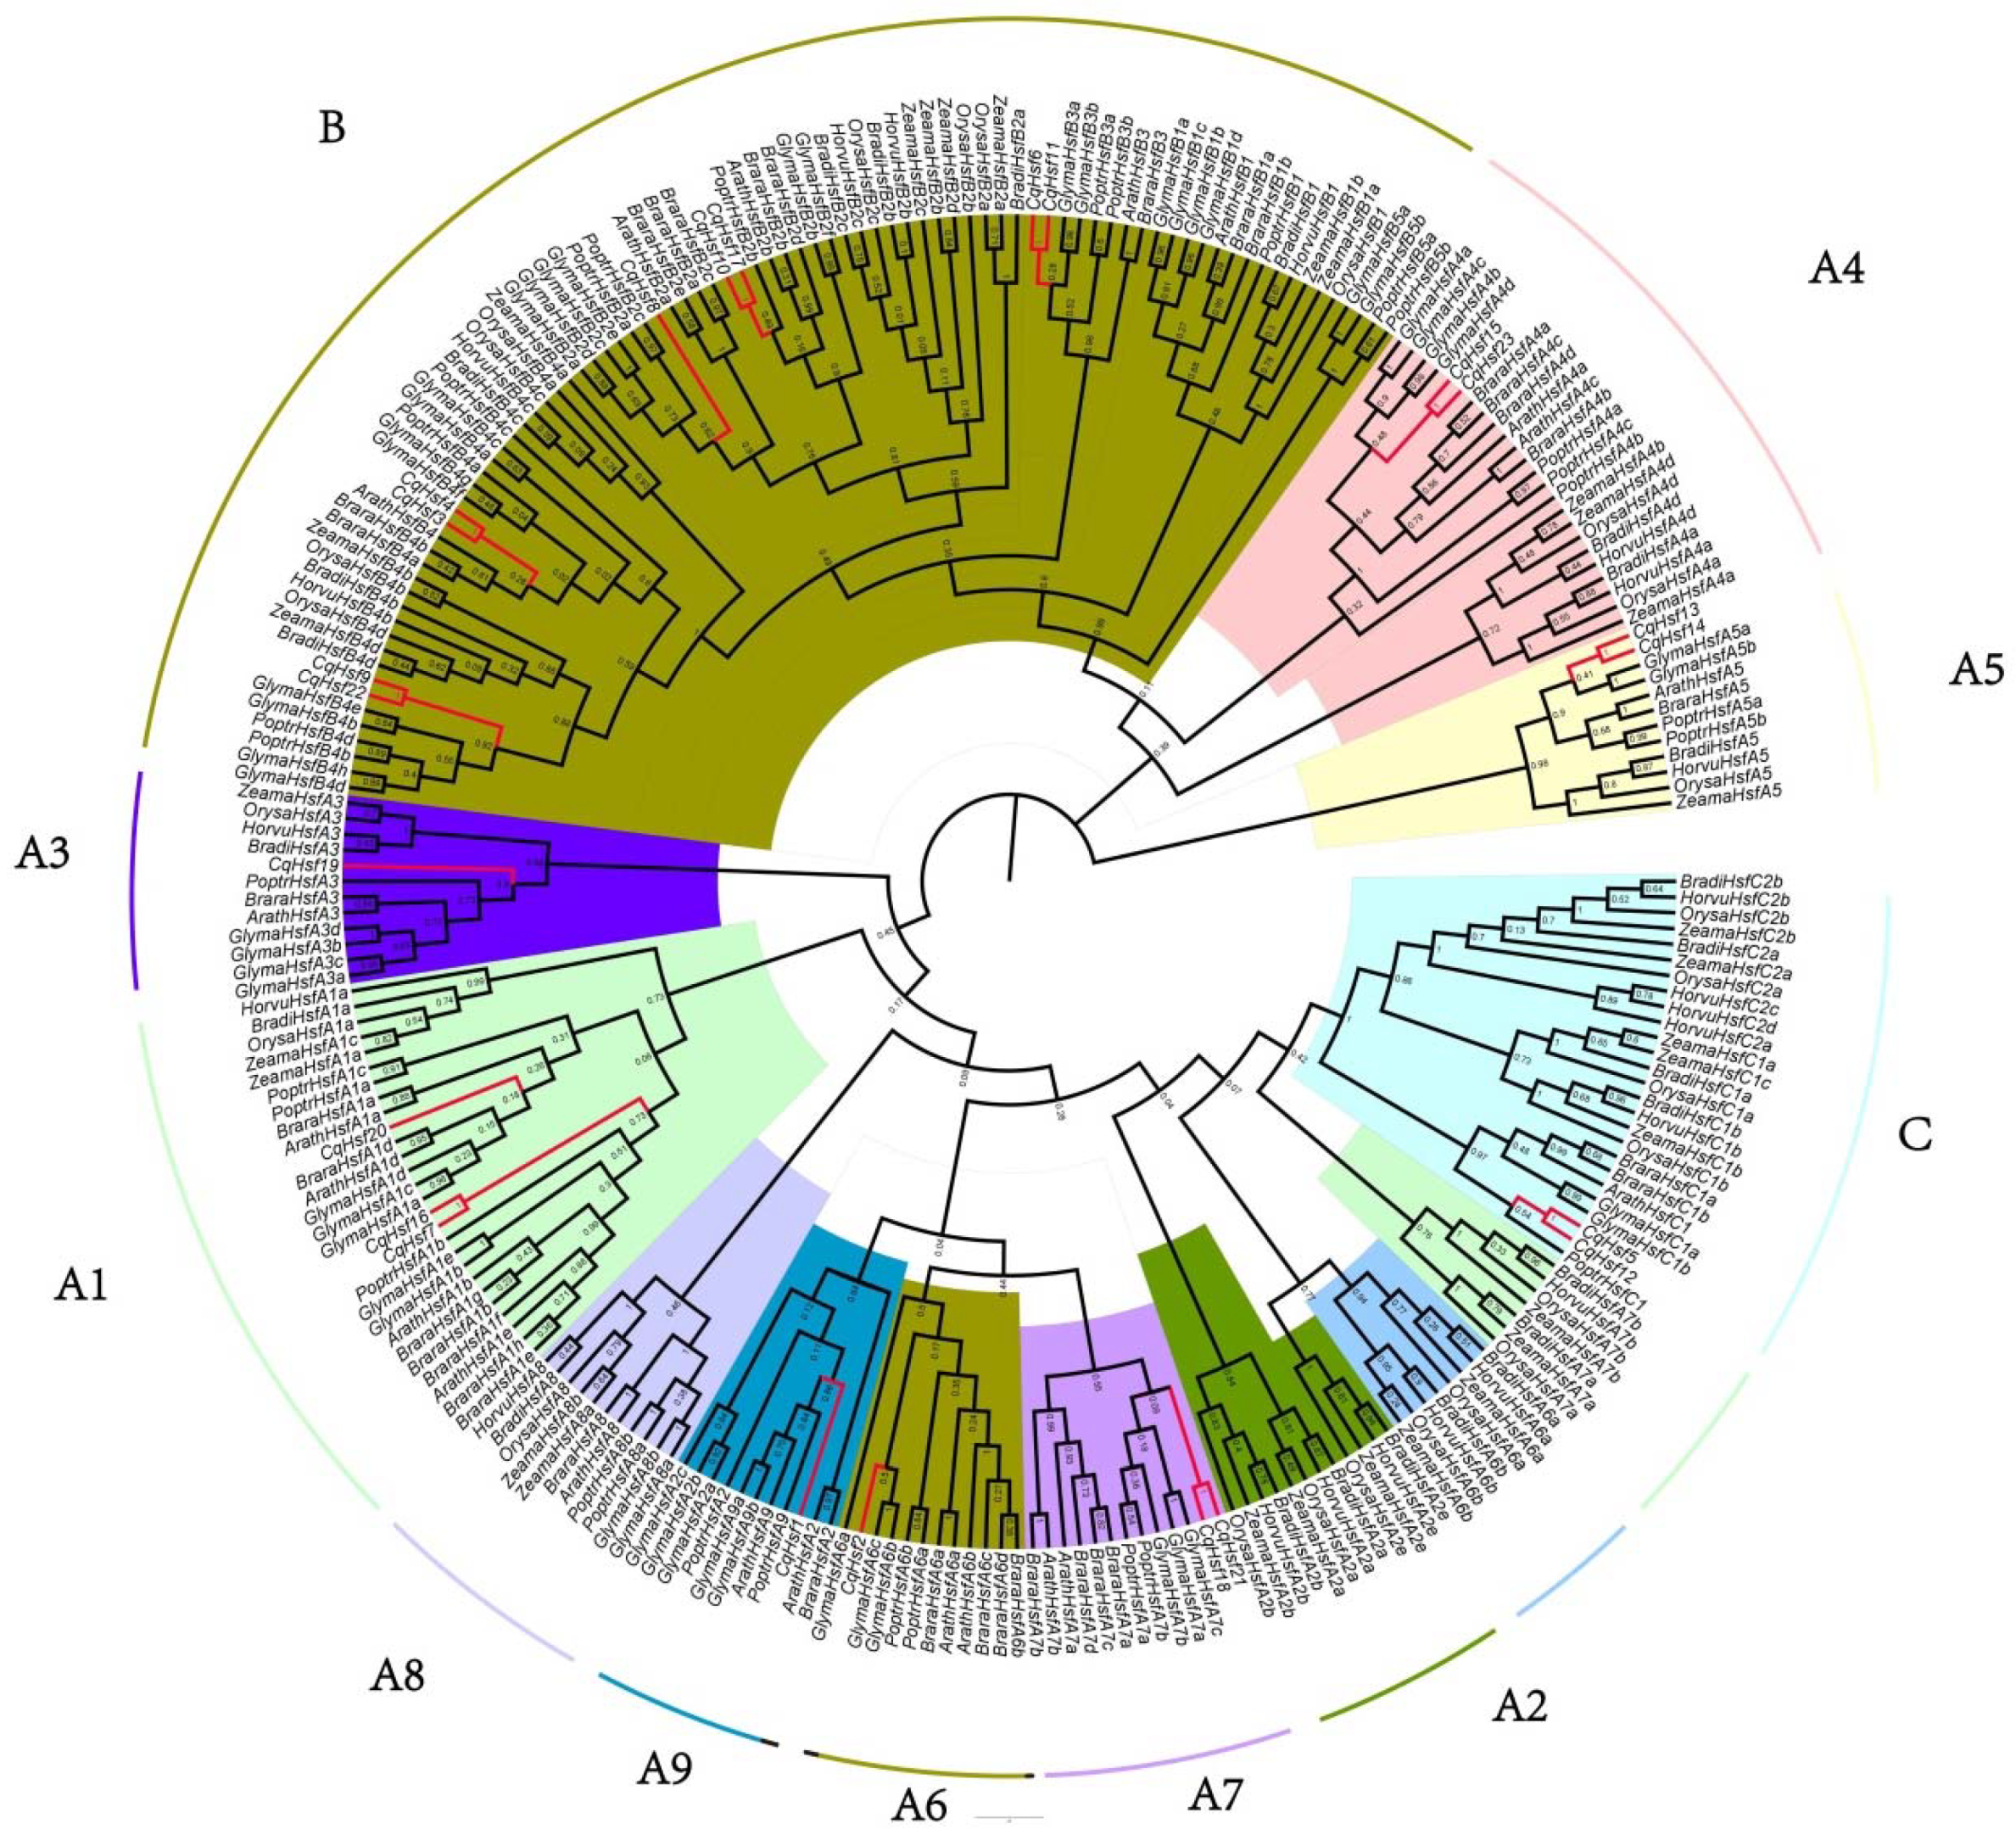
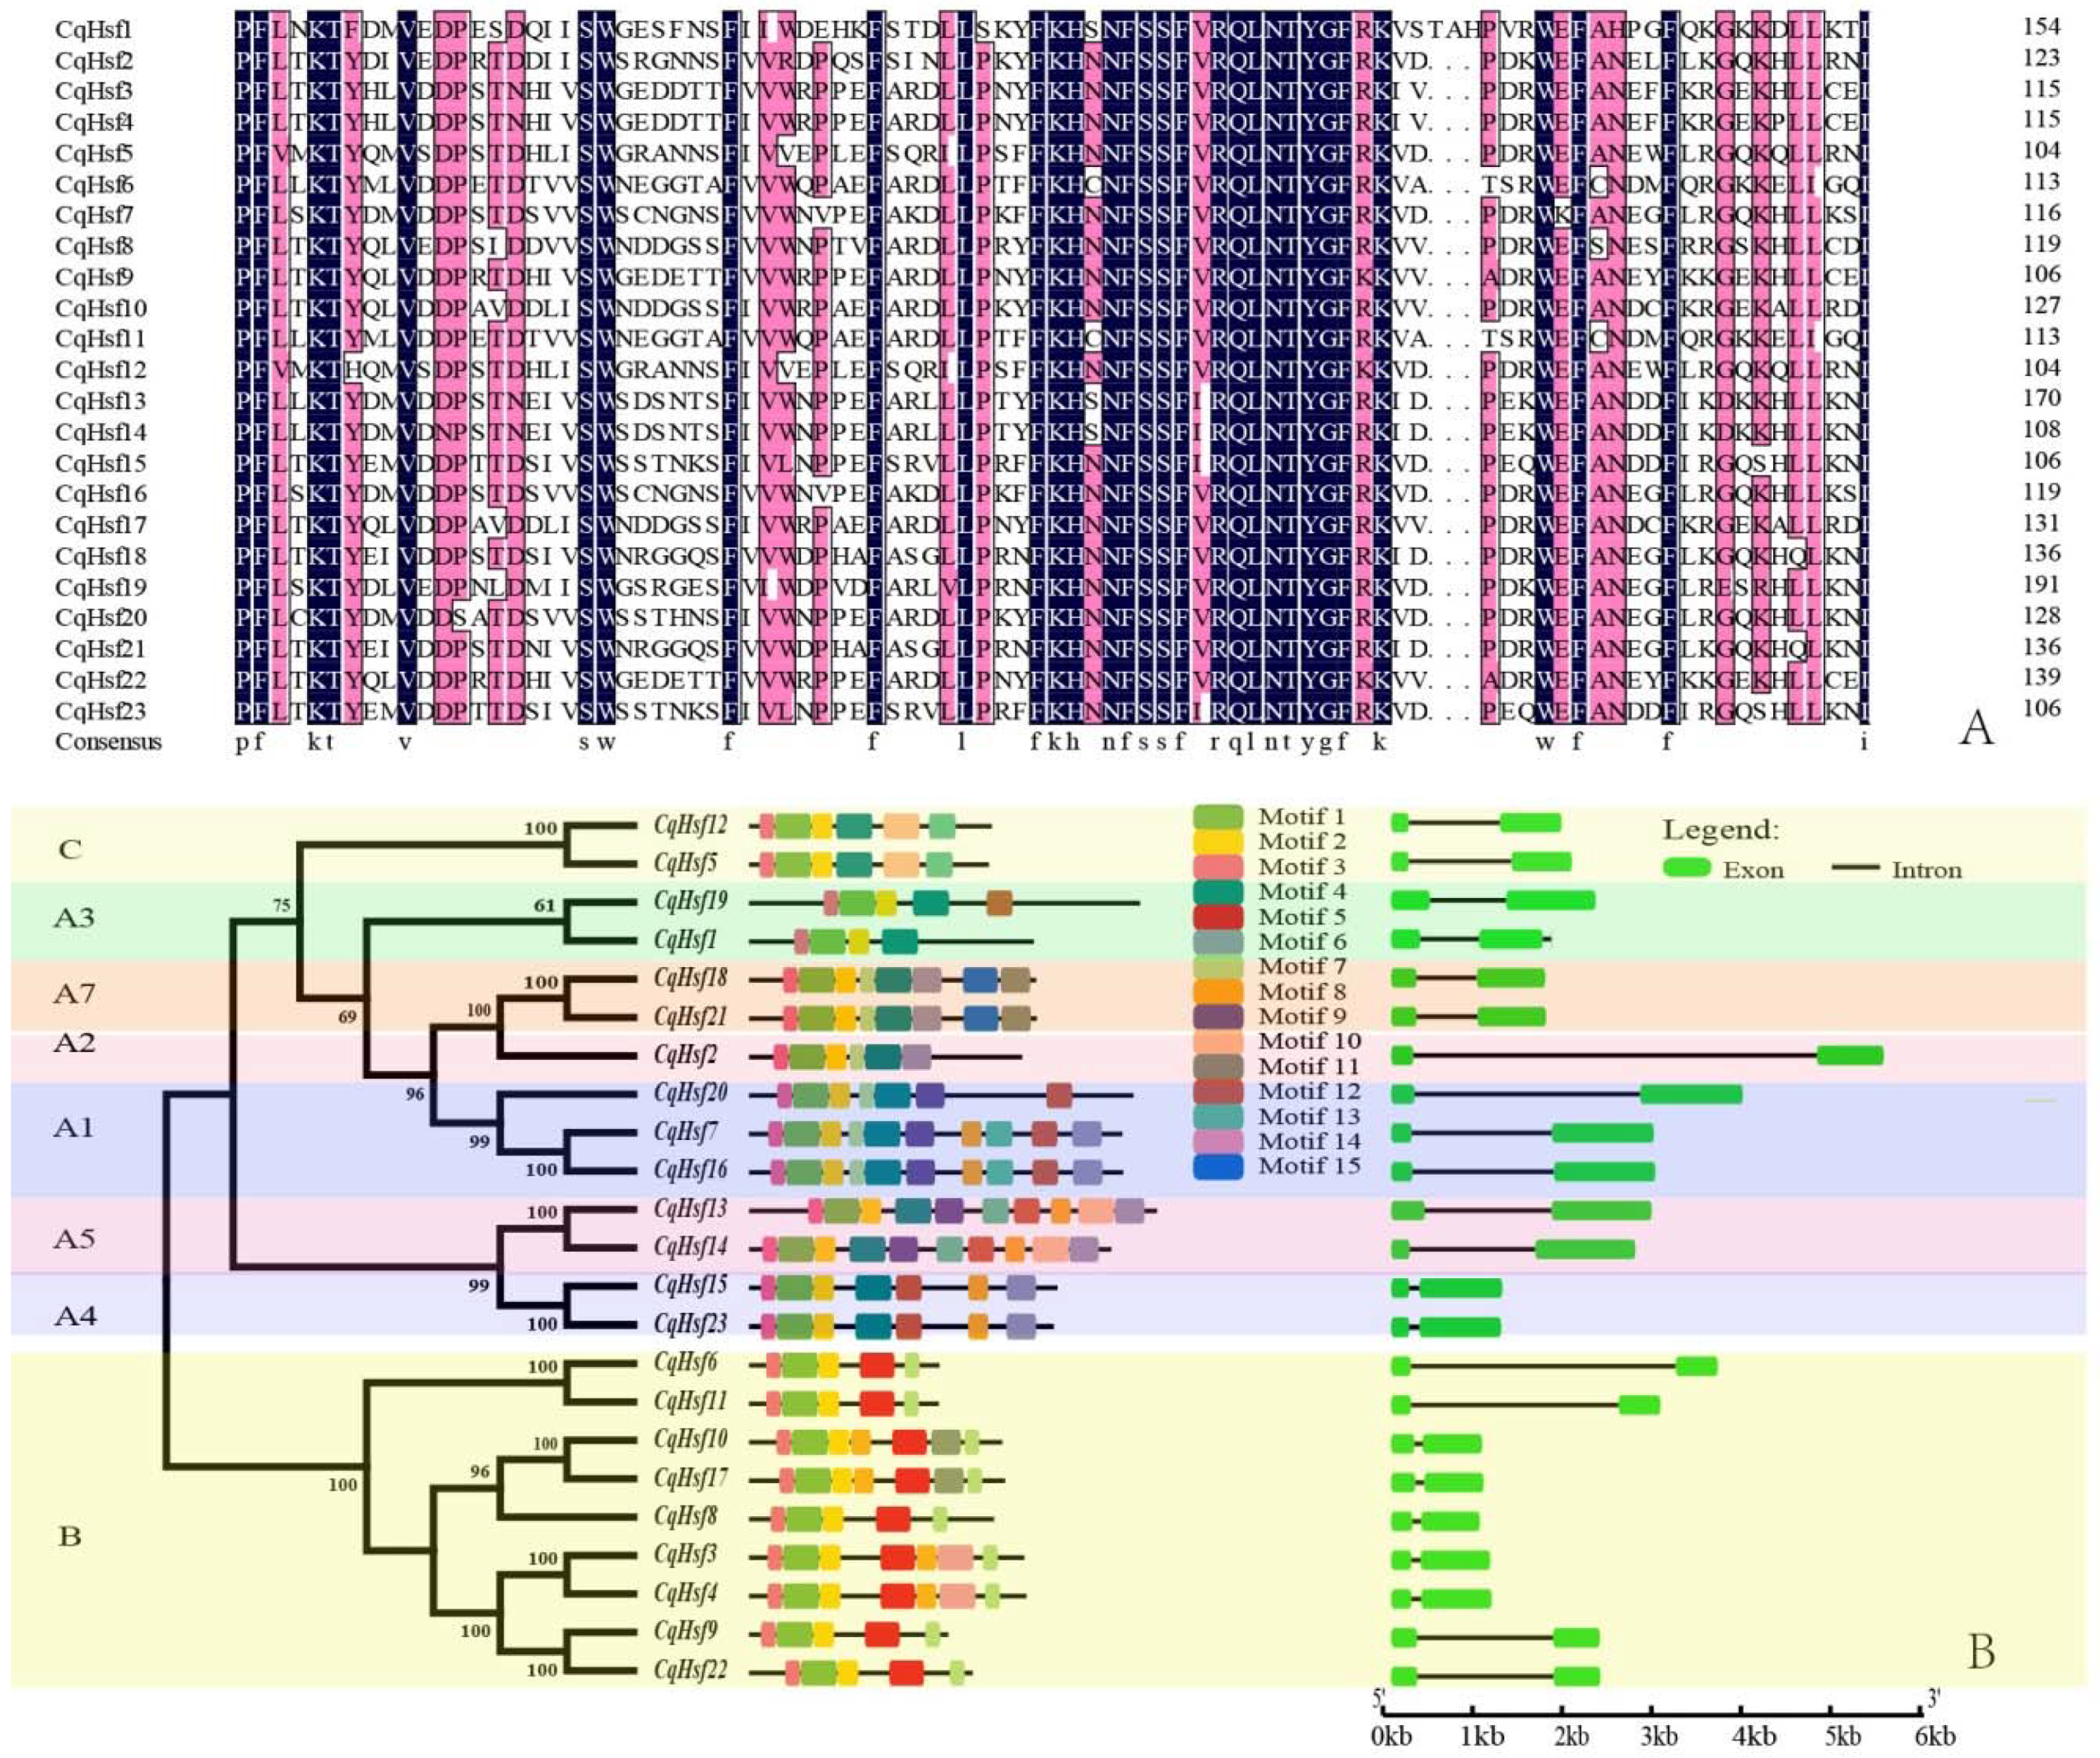
3.2. Multiple Alignment, Phylogenetic and Conserved Domains Analysis of CqHsfs

In order to understand the grouping and phylogenetic relationships of Hsf genes in quinoa, all 23 CqHsf protein sequences, together with 239 Hsfs from eight other species were used to construct the phylogenetic tree. As shown in Figure 1, the Hsf genes from different species were mainly clustered into three groups, namely A, B, and C groups. Then, the A group could be further divided into nine subgroups, which is consistent with previous reports [16,20]. Furthermore, Hsf genes from different species were unevenly clustered into these groups, indicating that the parallel evolutionary event of Hsf genes were occurred among these species, and homologous genes of model plants could provide some clues for revealing the biological function of counterpart Hsfs in quinoa.
Then, the conserved protein motifs in these quinoa Hsf genes were predicted using the MEME online tool. A total of 15 motifs were identified (Figure 2). All of the quinoa Hsf genes contained motif1, motif2, and motif3. In addition, some motifs were only found in a certain group of CqHsfs, such as motif5 and motif7 were found in group B specifically, and motif6 only existed in the group A2 subfamily. It showed that the same cluster of the CqHsfs by phylogenetic analysis shared the similar conserved domain composition, suggesting that the protein structure is remarkably conserved within the subgroup of CqHsfs, and the specific motifs might play a role in determining the specific expression or functions. Gene structure of CqHsfs was further displayed using the GSDS online tool. Result shows that all of the CqHsf genes have a similar gene structure with only two exons and one intron (Figure 2B).
To better understand the structural features and potential functions of CqHsf gene family, the conserved functional domains of them were further investigated. A total of seven different conserved functional domains were identified (Table S3), including DBD, HR-A/B, RD, NLS, AHA, RD, and NES. Among them, DBD was the most abundant domain, which is located in the N-terminus of all the CqHsf proteins, and consisted of about 100 amino acids. The DBD functional domain possesses a DNA-binding function and provides a specific recognition of the heat stress promoter elements (HSE). Multiple alignment of the DBD region showed that DBD was highly conserved in all of the CqHsfs (Figure 3). The oligomerization domain (HR-A/B region) was also found in all CqHsf proteins. Interestingly, RD conserved functional domain was specifically found in group B CqHsfs. In plants, the Hsf gene family could be divided into three categories (Classes A, B, and C) according to the peculiarities of the flexible linkers, HR-A/B regions, and RD conserved domains [16,20]. Among the 23 identified CqHsfs, twelve CqHsf genes belong to class A, nine belong to class B, and only two belong to class C. Furthermore, group A was divided into nine subfamilies according to the classification criteria as described by Scharf et al. [16], which were consistent with the phylogenetic analysis.

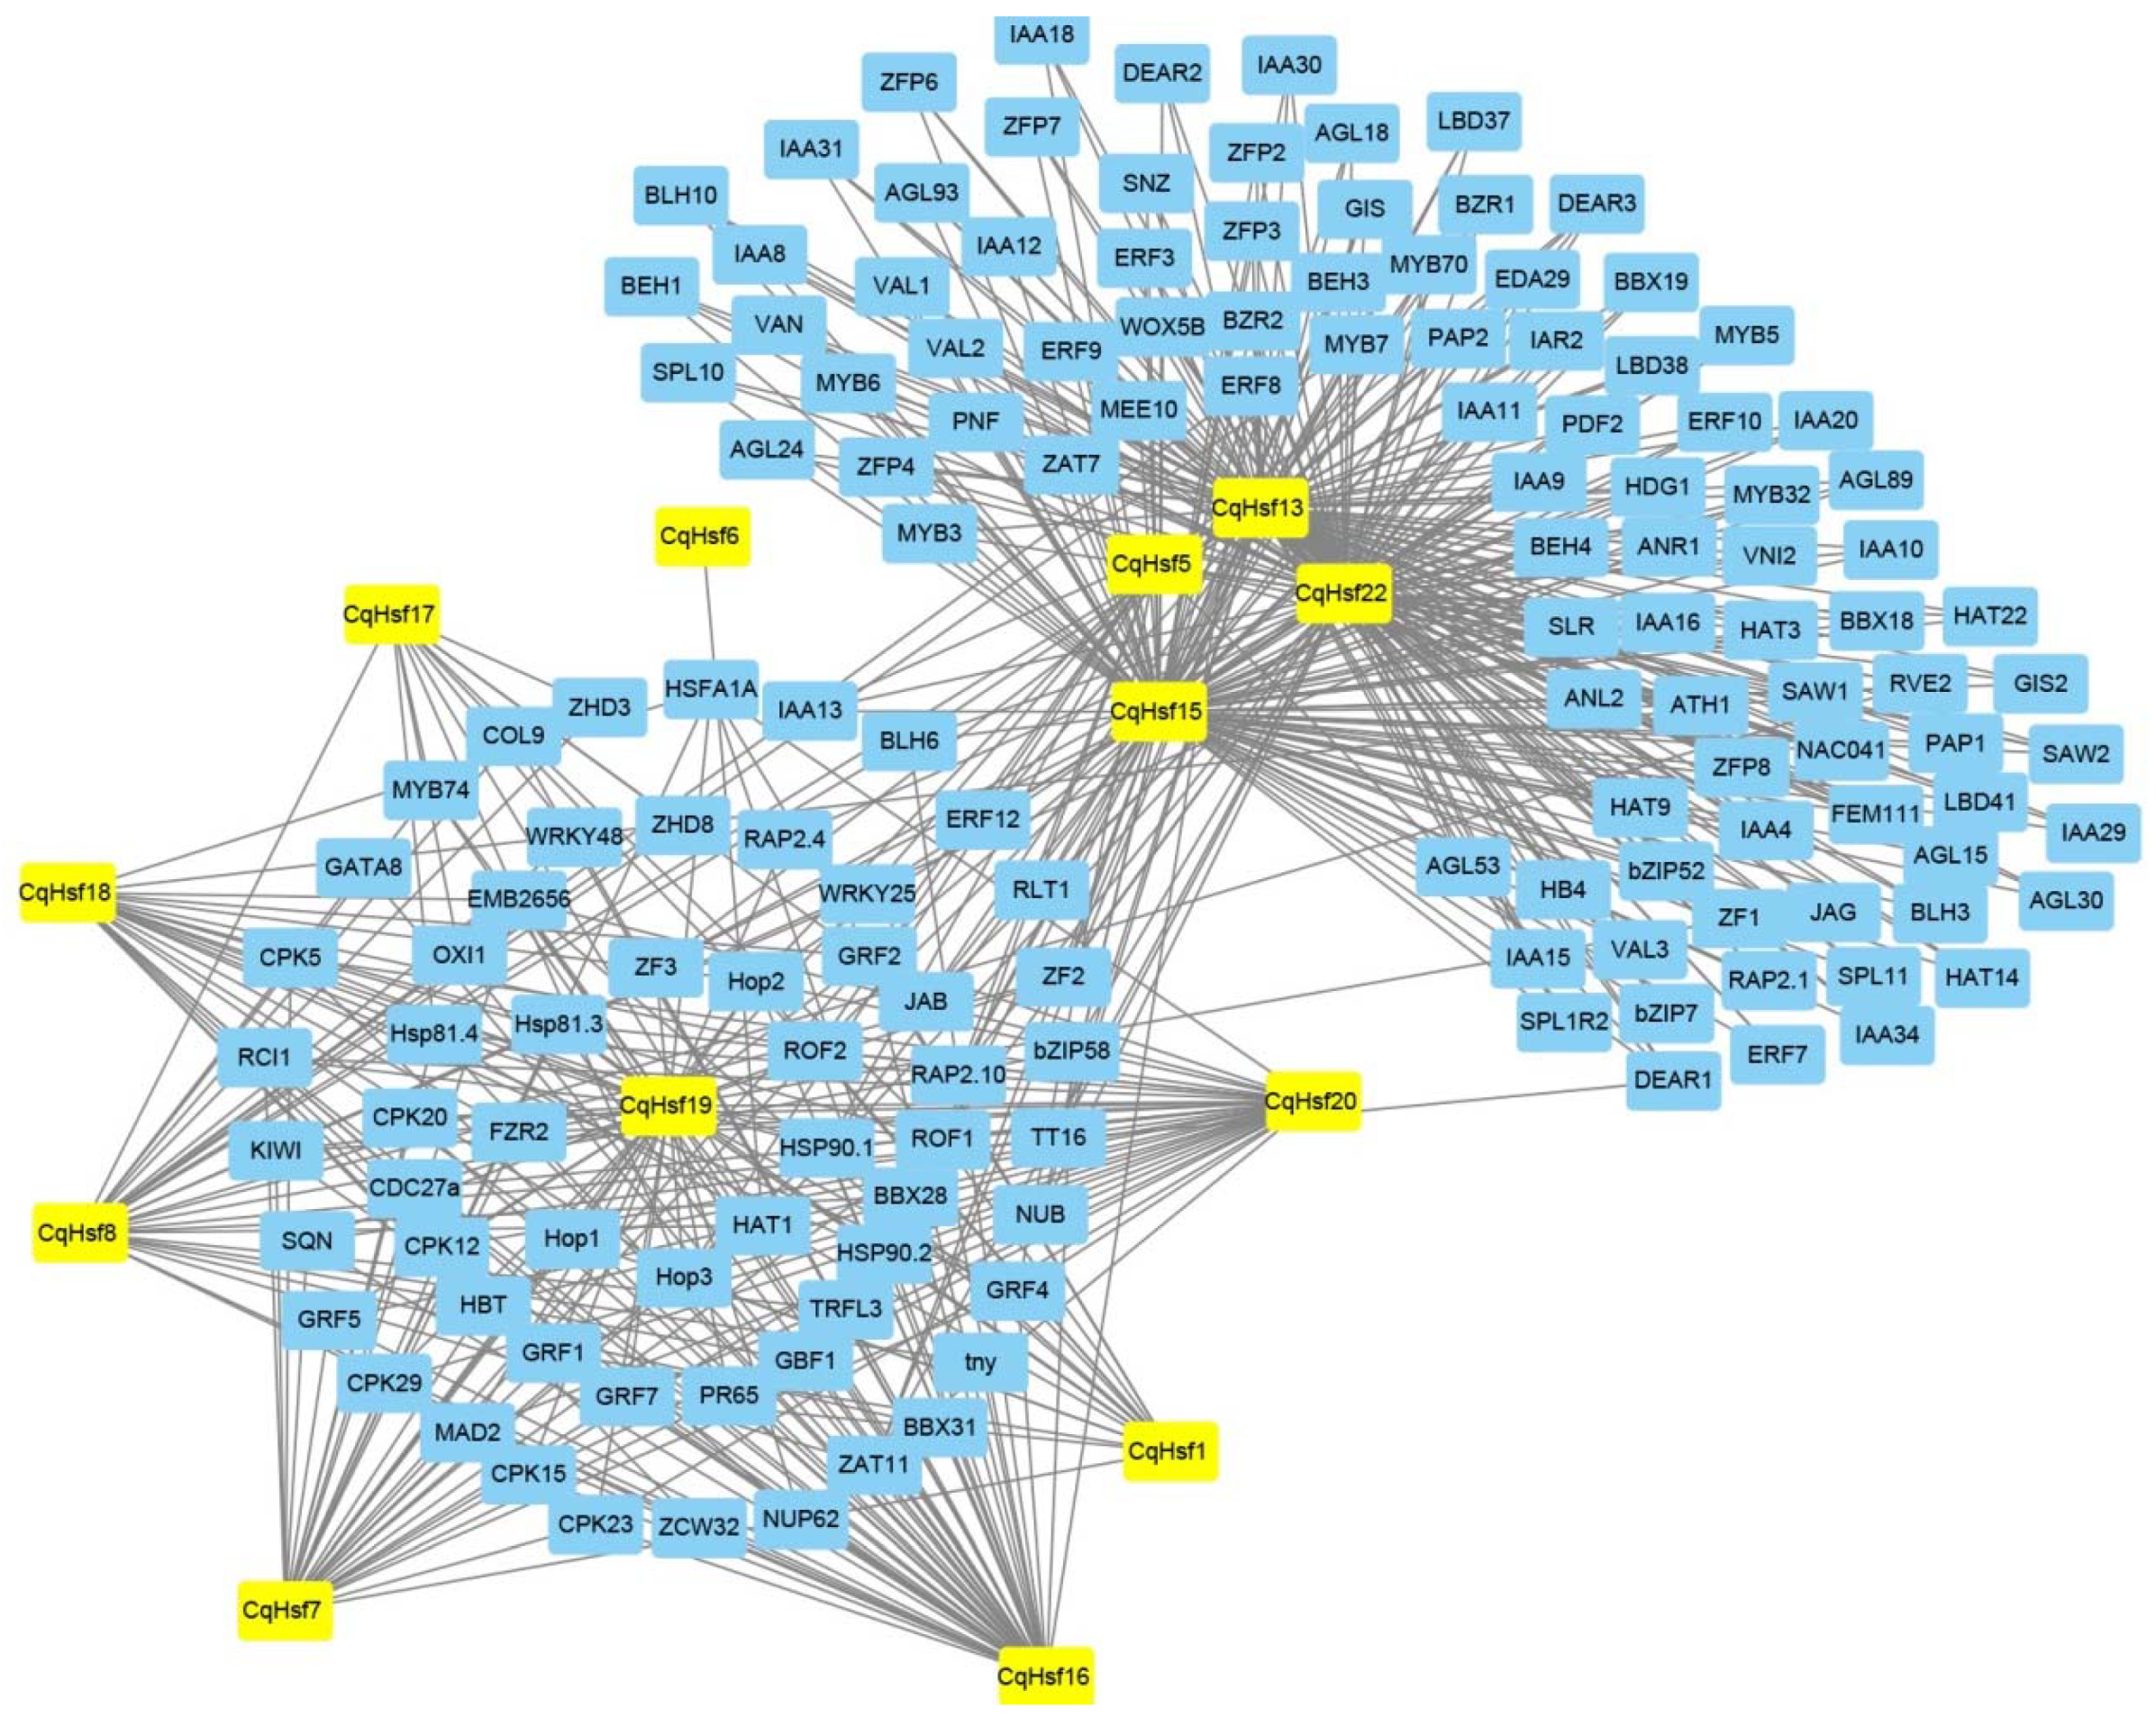
3.3. Interaction Network of CqHsfs

The interaction network of CqHsfs was predicted using the orthologous genes in arabidopsis. A total of 13 CqHsf genes were found to have orthologous with AtHsf genes (Figure 3). The 13 CqHsf genes belong to three groups, of which eight belong to group A, four belong to group B, and only one belong to group C. This result shows that the 13 CqHsf genes have interaction with a total of 151 other functional genes (Table S4). Among them, CqHsf 13, CqHsf15, CqHsf19, and CqHsf22 interacted with stress-related and growth-related transcription factor genes, such as ERF, WRKY, and MYB genes. The interaction network analysis of CqHsfs found that they play an important role in quinoa growth and development as well as stress response, which also contributed to better understanding the regulatory pathways which CqHsfs involved in controlling these biological processes.

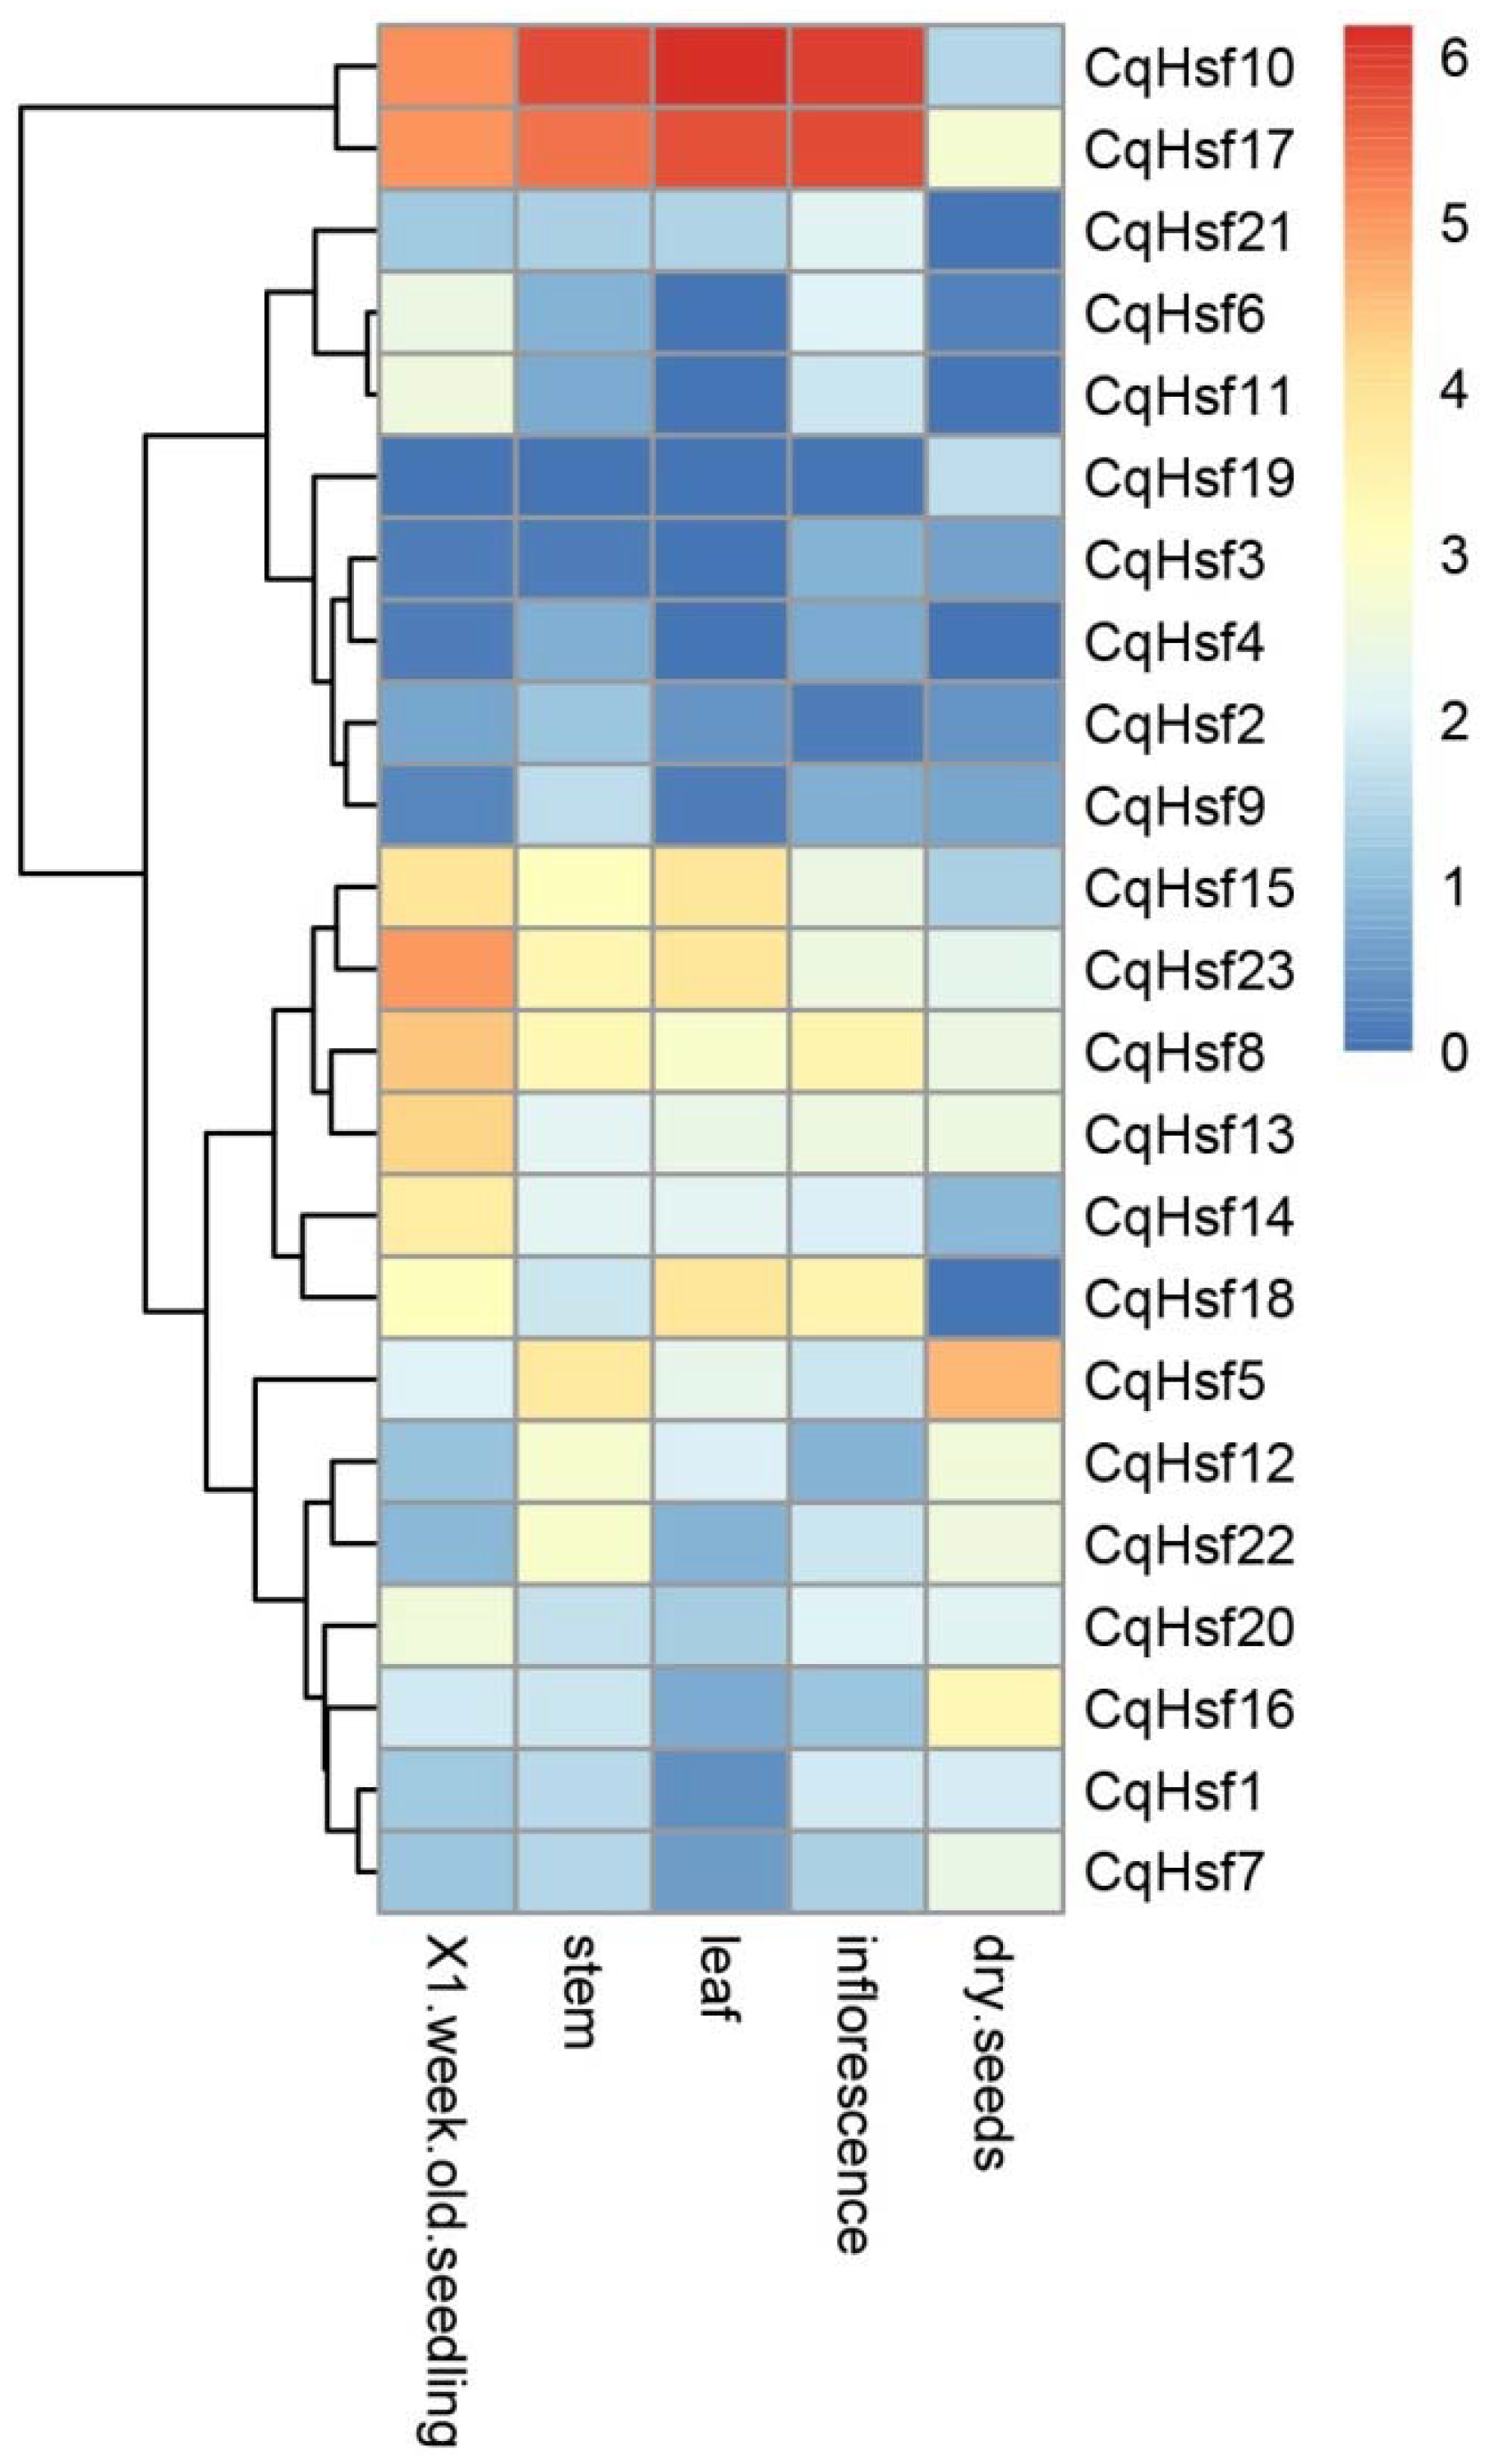
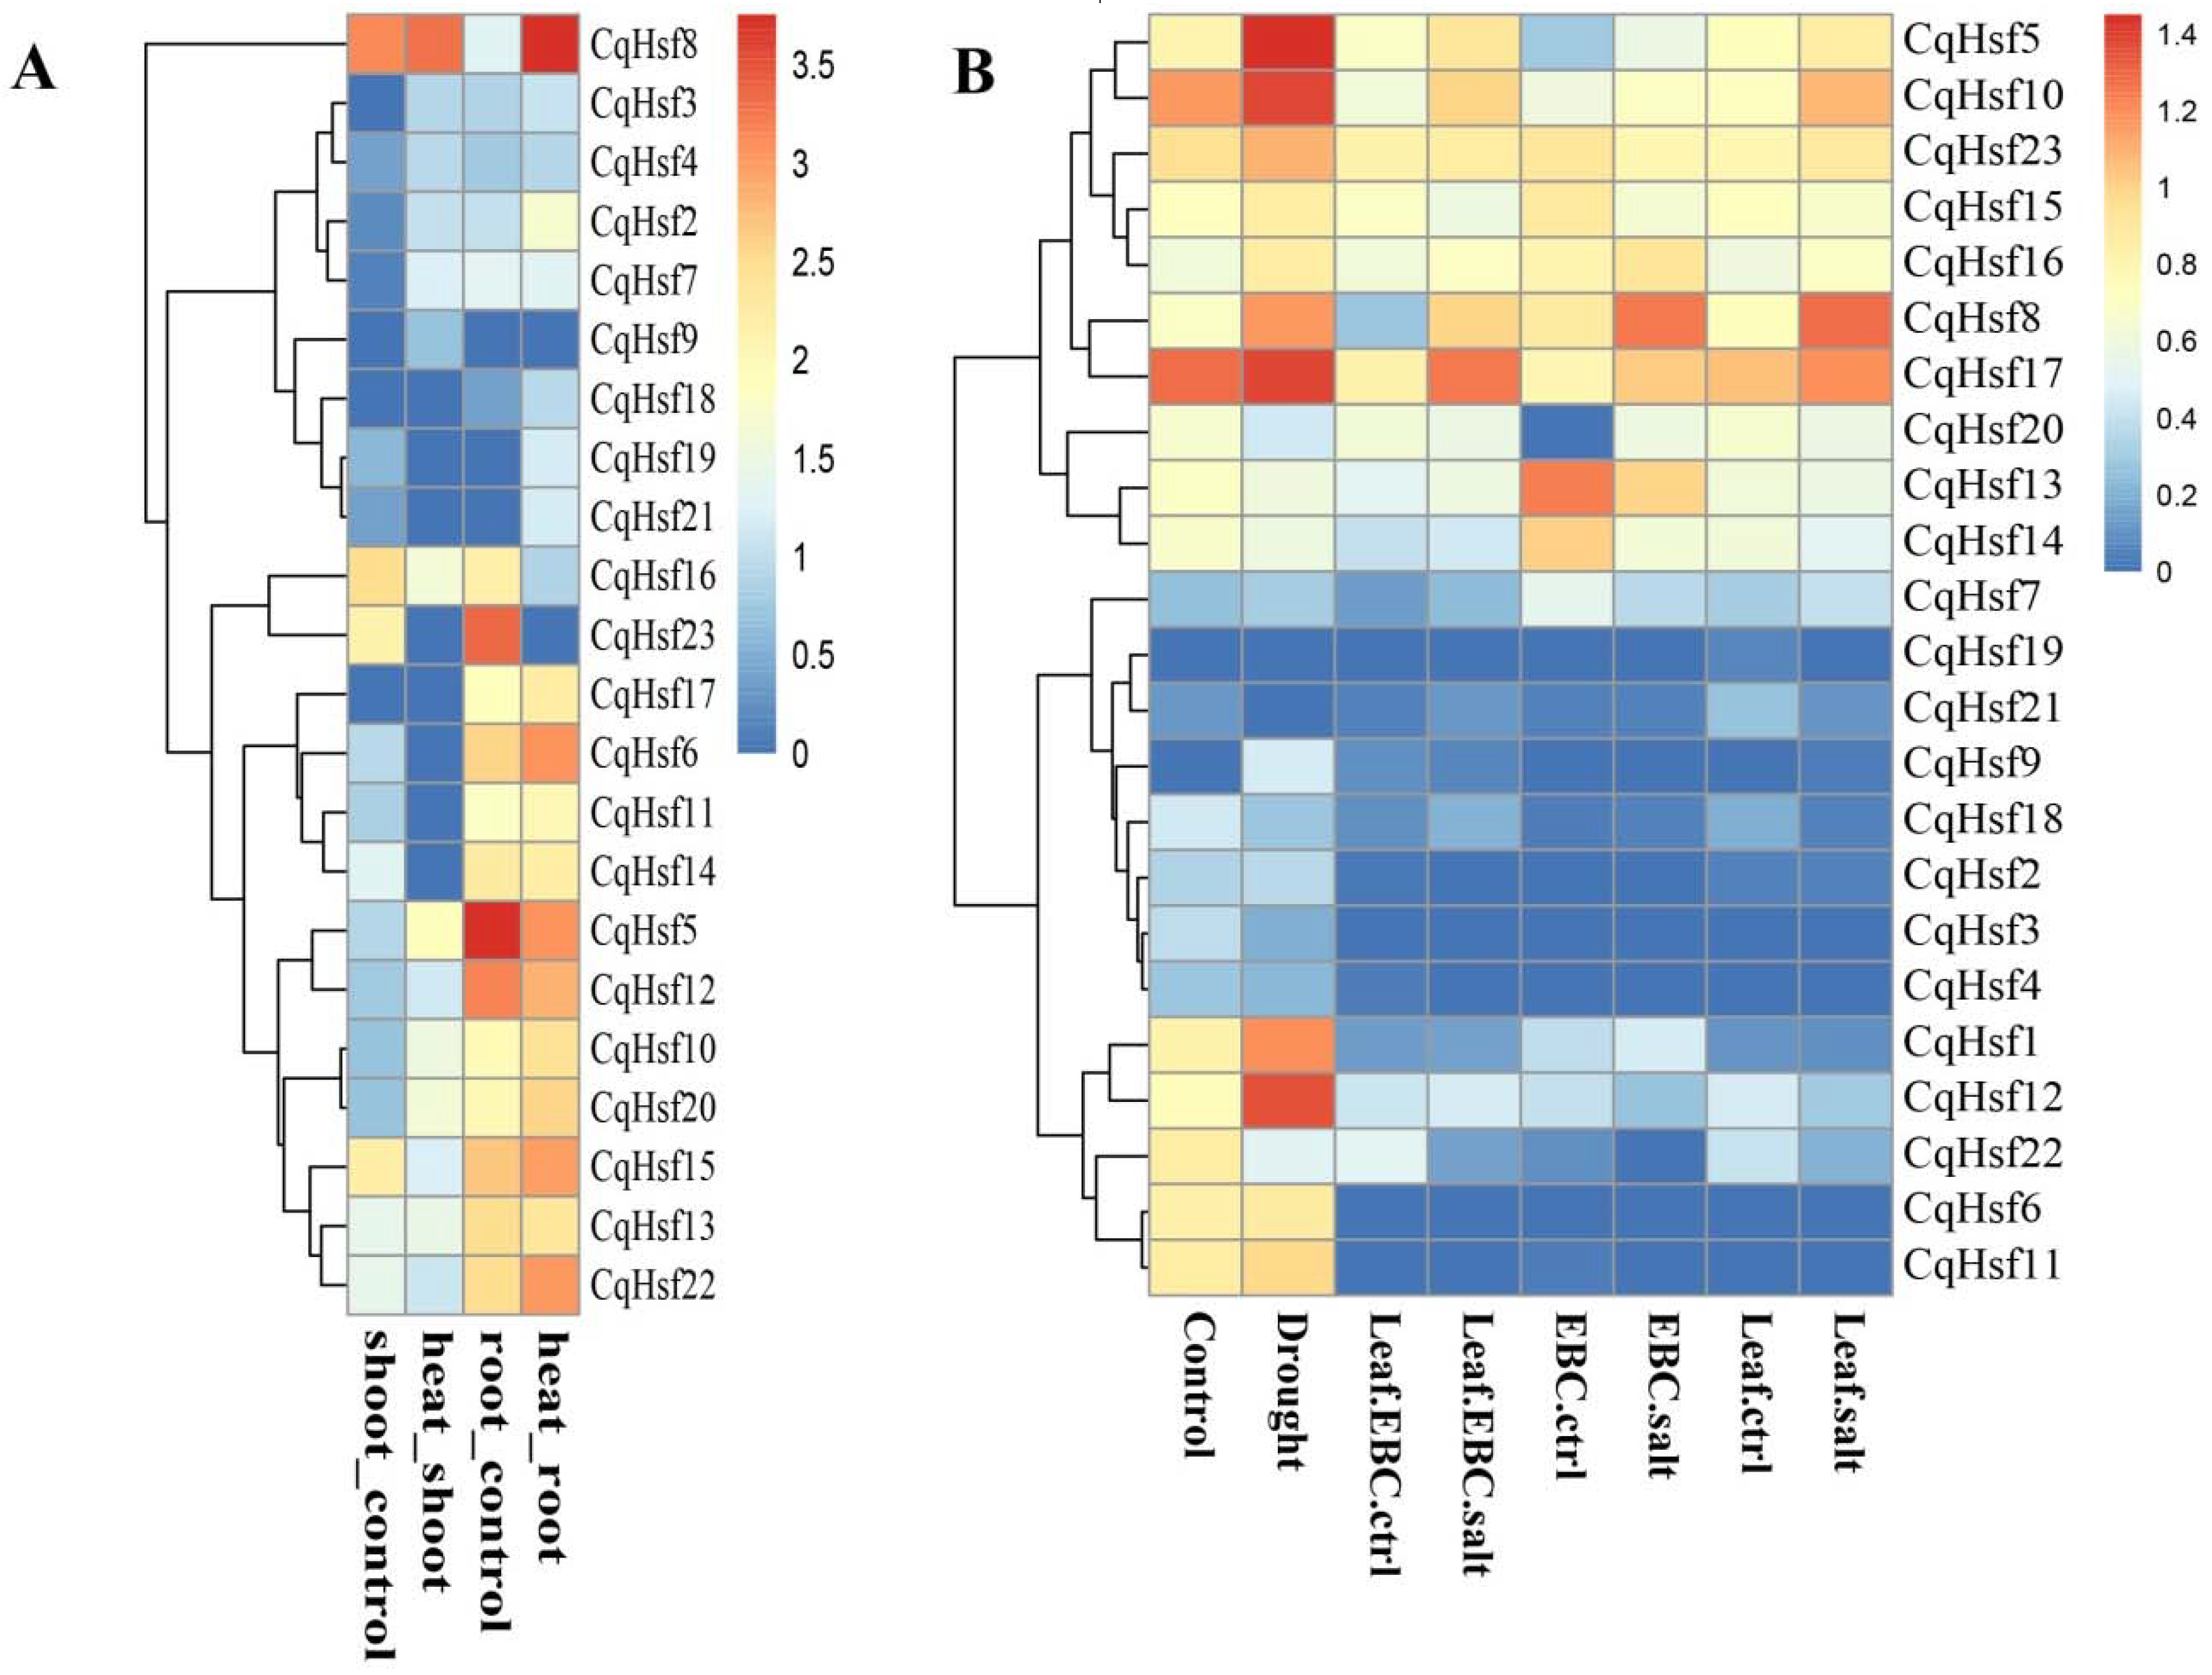
3.4. Expression Patterns of CqHsfs in Different Tissues or Organs

Gene expression patterns are usually closely related to their functions [25]. To gain insight into the temporal and spatial expression patterns of CqHsf genes, RNA-seq data of different organs, including seedling, stem, leaf, inflorescence, and dry seeds were downloaded from the NCBI Sequence Read Archive (SRA) database, and then were used to analyze the expression profiles in tissues. Results found that most of CqHsf genes were expressed in the five tissues (Figure 4). Among them, CqHsf10 and CqHsf17 in group B were found to be highly expressed in seeding, stem, leaf, and inflorescence, while showing relatively low expression in dry seeds. CqHsf13 and CqHsf14 belonging to the A4 subgroup had relatively high expressions in all five organs, which was also reported in other plant species [35]. For example, the AtHsfA1 in arabidopsis, and MdHsfA1a, MdHsfA1d, MdHsfB1a in apple as well as HsfA1 and HsfA8 genes in wheat were found to be constitutive expression in the tested organs [36,37,38]. The high expression of CqHsf genes in most tissues indicates that these heat shock transcription factors might be widely involved in the growth and development processes. At the same time, CqGsf2, CqHsf3, CqHsf4, CqHsf9, and CqHsf19 showed relatively low expressions in almost all of the five tested tissues, indicating they might not be involved in the quinoa organ development. Interestingly, CqHsf19 specifically expressed in dry seeds, indicating that CqHsf19 may have a specific function in seed development and maturation.

3.5. Expression Patterns of CqHsf Genes under Abiotic Stress Conditions

It is well known that the expression levels of Hsf genes are significantly affected by heat and other stresses in plants [16,38]. In this study, we also analyze the expression profiles of CqHsf genes under various stress conditions to identify the stress-responsive candidates. Under heat stress, 22 out of 23 CqHsfs were found to show differential expression (Figure 5A), of which CqGsf2, CqHsf3, CqHsf4, CqGsf9, and CqHsf10 showed upregulated expression, while CqGsf14, CqHsf16, and CqHsf23 had downregulated expression both in roots and leaves. The specific expression patterns of them were also found under heat stress. CqHsf5 was found to be upregulated expression in leaves, while downregulated in roots, and CqHsf8 was upregulated 5.4 times compared to control in roots, while there was no significant variation in leaves. These heat-induced CqHsfs provided the elite candidates for further functional study. Furthermore, the expression patterns of these CqHsfs under drought and salt stresses were also investigated (Figure 5B). Overall, the average expression level of these CqHsfs under drought and salt were significantly lower than that of heat stress, although differential expressions were also identified. CqHsf5 and CqHsf12 in group C were significantly upregulated under drought stress treatment, indicating that heat shock transcription factors in group C played a key role in drought stress. CqHsf8 and CqHsf17 were not only related to drought resistance, but also associated with salt tolerance. Interestingly, the expression of CqHsf7 was upregulated in leaf and leaf with epidermal bladder cells with 100 mM sodium chloride treatment and under drought stress, but was downregulated in epidermal bladder cells of 100-mM sodium chloride treated plants, indicating that CqHsf7 may have a special function to increase the adaptability of plants in response to abiotic stresses. In addition, CqHsf18 and CqHsf21, had similar expression profiles in different abiotic stresses, indicating that they might have analogous physiological functions. However, there are also some CqHsf genes, such as CqHsf4, CqHsf6, and CqHsf19, with little or no altered expression levels under various abiotic stress. The different expression patterns of CqHsf genes indicates that the function divergent has occurred in these CqHsfs. The identified stress-specific members provided excellent candidates for further functional analysis to reveal the function and molecular mechanism of CqHsfs playing in stress response.

3.6. Validation of the Expression of CqHsfs by Semi-Quantitative RT-PCR Analysis

To verify the expression of these identified CqHsfs, four genes showing upregulation in leaves by RNA-seq analysis were randomly selected to detect their expression levels in four time points under 37 °C treatments through semi-quantitative RT-PCR (Figure 6). Results showed all of the four genes were expressed, although different expression patterns were also found. At 0 h time point, all of them did not show any expression. Then, they increased rapidly their expression with heat treatment to the high level, and then gradually reduced the expression, suggesting they were heat-induced genes. CqHsf3 and CqHsf9 showed higher expression level at 6 h, while CqHsf4 and CqHsf10 had higher expression at 12 h. On the whole, the RT-PCR results validated the expression trends of these CqHsfs, which provided an important gene resource for future functional study of Hsfs in quinoa and beyond.

4. Conclusions

By performing a genome-wide search, we identified 23 quinoa Hsf genes in this study. These CqHsfs could be classified into three groups and the same group shared a similar domain organization and gene structure. Interaction network analysis found that 13 CqHsfs participated in regulating 153 other quinoa functional genes to form the complex network pathway about diverse biological processes. Expression profiles of these CqHsfs were further investigated using the RNA-seq data, and the tissue-specific and stress-responsive candidates were identified. Finally, four heat-responsive CqHsfs were selected to validate their expression level through semi RT-PCR analysis. Our study for the first time reported the genomic organization, evolution, and expression of the quinoa heat shock transcription factor family, which not only provides candidates for future functional analysis, but also lays the foundation for revealing the molecular mechanism of Hsfs regulating quinoa development and stress response.

Supplementary Materials

The following are available online at https://www.mdpi.com/2073-4395/8/7/103/s1, Table S1: The accession numbers and samples information of RNA-seq data used in this study, Table S2: The primers were used for semi-quantitative RT-PCR analysis, Table S3: Conserved functional domains of CqHsfs.

Author Contributions

G.T. and H.Z. (Haoshuang Zhan) performed all analysis and prepared the paper. G.X. contributed to data collection and gene family identification. X.C. and H.Z. (Hong Zhang) contributed to data analysis. X.N. conceived the study and revised the manuscript. W.J. provided experimental coordination and reviewed the manuscript. All authors read and approved the final manuscript.

Acknowledgments

This work was mainly supported by the Fundamental Research Funds for the Central Universities of China (Grant No. 2452015003).

Conflicts of Interest

The authors declare no conflict of interest.

References

  1. Wang, W.; Vinocur, B.; Altman, A. Plant responses to drought, salinity and extreme temperatures: Towards genetic engineering for stress tolerance. Planta 2013, 218, 1–14. [Google Scholar] [CrossRef] [PubMed]
  2. Wahid, A.; Gelani, S.; Ashraf, M.; Foolad, M.R. Heat tolerance in plants: An overview. Environ. Exp. Bot. 2007, 61, 199–223. [Google Scholar] [CrossRef]
  3. Lin, Y.X.; Jiang, H.Y.; Chu, Z.X.; Tang, X.L.; Zhu, S.W.; Cheng, B.J. Genome-wide identification, classification and analysis of heat shock transcription factor family in maize. BMC Genom. 2011, 12, 76. [Google Scholar] [CrossRef] [PubMed]
  4. Nover, L.; Bharti, K.; Döring, P.; Mishra, S.K.; Ganguli, A.; Scharf, K.-D. Arabidopsis and the heat stress transcription factor world: How many heat stress transcription factors do we need? Cell Stress Chaperones 2011, 6, 177–189. [Google Scholar] [CrossRef]
  5. Damberger, F.F.; Pelton, J.G.; Harrison, C.J.; Nelson, H.C.M.; Wemmer, D.E. Solution structure of the DNA-binding domain of the heat shock transcription factor determined by multidimensional heteronuclear magnetic resonance spectroscopy. Protein Sci. 1994, 3, 1806–1821. [Google Scholar] [CrossRef] [PubMed] [Green Version]
  6. Harrison, C.J.; Bohm, A.A.; Nelson, H.C. Crystal structure of the DNA binding domain of the heat shock transcription factor. Science 1994, 263, 224–267. [Google Scholar] [CrossRef] [PubMed]
  7. Vuister, G.W.; Kim, S.-J.; Orosz, A.J.; Marquardt, J.; Wu, C.; Bax, A. Solution structure of the DNA-binding domain of Drosophila heat shock transcription factor. Nat. Struct. Biol. 1994, 1, 605–614. [Google Scholar] [CrossRef] [PubMed]
  8. Schultheiss, J.; Kunert, O.; Gase, U.; Scharf, K.D.; Nover, L.; Rüterjans, H. Solution structure of the DNA-binding domain of the tomato heat-stress transcription factor HSF24. Eur. J. Biochem. 1996, 236, 911–921. [Google Scholar] [CrossRef] [PubMed]
  9. Bienz, M.; Pelham, H.R.B. Mechanisms of heat-shock gene activation in higher eukaryotes. Adv. Genet. 1987, 24, 31–72. [Google Scholar] [PubMed]
  10. Pelham, H.R.B. A regulatory upstream promoter element in the Drosophila Hsp70 heat-shock gene. Cell 1982, 30, 517–528. [Google Scholar] [CrossRef]
  11. Peteranderl, R.; Rabenstein, M.; Shin, Y.-K.; Liu, C.W.; Wemmer, D.E.; King, D.S.; Nelson, H.C.M. Biochemical and biophysical characterization of the trimerization domain from the heat shock transcription factor. Biochemistry 1999, 38, 3559–3569. [Google Scholar] [CrossRef] [PubMed]
  12. Lyck, R.; Harmening, U.; Höhfeld, I.; Treuter, E.; Scharf, K.-D.; Nover, L. Intracellular distribution and identification of the nuclear localization signals of two plant heat-stress transcription factors. Planta 1997, 202, 117–125. [Google Scholar] [PubMed]
  13. Heerklotz, D.; Döring, P.; Bonzelius, F.; Winkelhaus, S.; Nover, L. The Balance of nuclear import and export determines the intracellular distribution and function of tomato heat stress transcription factor HsfA2. Mol. Cell. Biol. 2001, 21, 1759–1768. [Google Scholar] [CrossRef] [PubMed]
  14. Kotak, S.; Port, M.; Ganguli, A.; Bicker, F.; Von Koskull-Döring, P. Characterization of C-terminal domains of Arabidopsis heat stress transcription factors (Hsfs) and identification of a new signature combination of plant class A Hsfs with AHA and NES motifs essential for activator function and intracellular localization. Plant J. 2004, 39, 98–112. [Google Scholar] [CrossRef] [PubMed]
  15. Döring, P.; Treuter, E.; Kistner, C.; Lyck, R.; Chen, A.; Nover, L. The role of AHA motifs in the activator function of tomato heat stress transcription factors HsfA1 and HsfA2. Plant J. 2000, 12, 265–279. [Google Scholar]
  16. Scharf, K.D.; Berberich, T.; Ebersberger, I.; Nover, L. The plant heat stress transcription factor (Hsf) family: Structure, function and evolution. Biochim. Biophys. Acta 2012, 1819, 104–119. [Google Scholar] [CrossRef] [PubMed]
  17. Guo, M.; Liu, J.H.; Ma, X.; Luo, D.X.; Gong, Z.H.; Lu, M.H. The Plant Heat Stress Transcription Factors (HSFs): Structure, Regulation, and Function in Response to Abiotic Stresses. Front. Plant Sci. 2016, 7, 114. [Google Scholar] [CrossRef] [PubMed]
  18. Song, X.; Liu, G.; Duan, W.; Liu, T.; Huang, Z.; Ren, J.; Li, Y.; Hou, X. Genome-wide identification, classification and expression analysis of the heat shock transcription factor family in Chinese cabbage. Mol. Genet. Genom. 2014, 289, 541–551. [Google Scholar] [CrossRef] [PubMed]
  19. Li, P.S.; Yu, T.F.; He, G.H.; Chen, M.; Zhou, Y.B.; Chai, S.C.; Xu, Z.S.; Ma, Y.Z. Genome-wide analysis of the Hsf family in soybean and functional identification of GmHsf-34 involvement in drought and heat stresses. BMC Genom. 2014, 15, 1009. [Google Scholar] [CrossRef] [PubMed]
  20. Guo, J.; Wu, J.; Ji, Q.; Wang, C.; Luo, L.; Yuan, Y.; Wang, Y.; Wang, J. Genome-wide analysis of heat shock transcription factor families in rice and Arabidopsis. J. Genet. Genom. 2008, 35, 105–118. [Google Scholar] [CrossRef]
  21. Xue, G.P.; Sadat, S.; Drenth, J.; McIntyre, C.L. The heat shock factor family from Triticum aestivum in response to heat and other major abiotic stresses and their role in regulation of heat shock protein genes. J. Exp. Bot. 2014, 65, 539–557. [Google Scholar] [CrossRef] [PubMed]
  22. Delatorre-Herrera, J. Current use of Quinoa in Chile. Food Rev. Int. 2003, 19, 155–165. [Google Scholar] [CrossRef]
  23. Bhargava, A.; Shukla, S.; Ohri, D. Chenopodium quinoa—An Indian perspective. Ind. Crops Prod. 2006, 23, 73–87. [Google Scholar] [CrossRef]
  24. Liu, J.X.; Wang, R.M.; Liu, W.J.; Zhang, H.L.; Guo, Y.D.; Wen, R.Y. Genome-Wide Characterization of Heat-Shock Protein 70s from Chenopodium quinoa and Expression Analyses of Cqhsp70s in Response to Drought Stress. Genes 2018, 9, 35. [Google Scholar] [CrossRef] [PubMed]
  25. Wang, M.; Yue, H.; Feng, K.; Deng, P.; Song, W.; Nie, X. Genome-wide identification, phylogeny and expressional profiles of mitogen activated protein kinase kinase kinase (MAPKKK) gene family in bread wheat (Triticum aestivum L.). BMC Genom. 2016, 17, 668. [Google Scholar] [CrossRef] [PubMed]
  26. Kersey, P.J.; Allen, J.E.; Armean, I.; Boddu, S.; Bolt, B.J.; Carvalho-Silva, D.; Christensen, M.; Davis, P.; Falin, L.J.; Grabmueller, C.; et al. Ensembl Genomes 2016: More genomes, more complexity. Nucleic Acids Res. 2015, 44, D574–D580. [Google Scholar] [CrossRef] [PubMed]
  27. Finn, R.D.; Mistry, J.; Schuster-Böckler, B.; Griffiths-Jones, S.; Hollich, V.; Lassmann, T.; Moxon, S.; Marshall, M.; Khanna, A.; Durbin, R.; et al. PFAM: Clans, web tools and services. Nucleic Acids Res. 2006, 34, D247–D251. [Google Scholar] [CrossRef] [PubMed]
  28. Wheeler, T.J.; Eddy, S.R. NHMMER: DNA homology search with profile HMMs. Bioinformatics 2013, 29, 2487–2489. [Google Scholar] [CrossRef] [PubMed]
  29. Larkin, M.; Blackshields, G.; Brown, N.; Chenna, R.; McGettigan, P.; McWilliam, H.; Valentin, F.; Wallace, I.M.; Wilm, A.; Lopez, R.; et al. Clustal W and Clustal X version 2.0. Bioinformatics 2007, 23, 2947–2948. [Google Scholar] [CrossRef] [PubMed] [Green Version]
  30. Tamura, K.; Stecher, G.; Peterson, D.; Filipski, A.; Kumar, S. MEGA6: Molecular evolutionary genetics analysis version 6.0. Mol. Boil. Evol. 2013, 30, 2725–2729. [Google Scholar] [CrossRef] [PubMed]
  31. Bailey, T.L.; Boden, M.; Buske, F.A.; Frith, M.; Grant, C.E.; Clementi, L.; Ren, J.; Li, W.W.; Noble, W.S. MEME SUITE: Tools for motif discovery and searching. Nucleic Acids Res. 2009, 37, W202–W208. [Google Scholar] [CrossRef] [PubMed]
  32. Hu, B.; Jin, J.; Guo, A.Y.; Zhang, H.; Luo, J.; Gao, Ge. GSDS 2.0: An upgraded gene feature visualization server. Bioinformatics 2015, 31, 1296–1297. [Google Scholar] [CrossRef] [PubMed]
  33. Pertea, M.; Kim, D.; Pertea, G.M.; Leek, J.T.; Salzberg, S.L. Transcript-level expression analysis of RNA-seq experiments with HISAT, StringTie and Ballgown. Nat. Protoc. 2016, 11, 1650–1667. [Google Scholar] [CrossRef] [PubMed]
  34. Chen, L.; Hu, W.; Tan, S.; Wang, M.; Ma, Z.; Zhou, S.; Deng, X.; Zhang, Y.; Huang, C.; Yang, G.; et al. Genome-wide identification and analysis of MAPK and MAPKK gene families in Brachypodium distachyon. PLoS ONE 2012, 7, e46744. [Google Scholar] [CrossRef] [PubMed]
  35. Higashi, Y.; Ohama, N.; Ishikawa, T.; Katori, T.; Shimura, A.; Kusakabe, K.; Yamaguchi-Shinozaki, K.; Ishida, J.; Tanaka, M.; Seki, M.; et al. HsfA1d, a protein identified via FOX hunting using Thellungiella salsuginea cDNAs improves heat tolerance by regulating heat-stress-responsive gene expression. Mol. Plant 2013, 6, 411–422. [Google Scholar] [CrossRef] [PubMed]
  36. Busch, W.; Wunderlich, M.; Schöffl, F. Identification of novel heat shock factor-dependent genes and biochemical pathways in Arabidopsis thaliana. Plant J. 2005, 41, 1–14. [Google Scholar] [CrossRef] [PubMed]
  37. Giorno, F.; Guerriero, G.; Baric, S.; Mariani, C. Heat shock transcriptional factors in Malus domestica: Identification, classification and expression analysis. BMC Genom. 2012, 13, 639. [Google Scholar] [CrossRef] [PubMed]
  38. Murshid, A.; Prince, T.L.; Lang, B.; Calderwood, S.K. Role of Heat Shock Factors in Stress-Induced Transcription. Methods Mol. Biol. 2018, 1709, 23–34. [Google Scholar] [PubMed]
Figure 1. Phylogenetic relationship of HSf proteins in quinoa with eight other species.
Agronomy 08 00103 g001
Figure 2. Multiple alignment, phylogenetic tree, conserved motifs, and gene structure of 23 CqHsf proteins. (A) Multiple alignment to identify the conserved functional domain DBD of CqHsf genes. (B) Phylogenetic tree, conserved motifs, and gene structure of CqHSf genes.
Agronomy 08 00103 g002
Figure 3. Interaction network of Hsf genes in quinoa.
Agronomy 08 00103 g003
Figure 4. Expression patterns of CqHsf genes in five different tissues. Red bars represent high expression levels and blue bars represent low expression levels.
Agronomy 08 00103 g004
Figure 5. Expression patterns of CqHsf genes under heat stress (A) as well as under drought and salt stresses (B). Red bars represent high expression levels and blue bars represent low expression levels.
Agronomy 08 00103 g005
Figure 6. RT-PCR analysis of four CqHsf genes under heat stress. Actin was used as an inner reference.
Agronomy 08 00103 g006
Table 1. Characteristics of heat shock transcription factors (Hsfs) in quinoa (Chenopodium quinoa Willd.).
GeneGene IDAmino Acid Length (aa)PIMw (Kda)
CqHsf1LOC1106830523805.4943.14
CqHsf2LOC1106854073645.0841.86
CqHsf3LOC1106863573678.1541.00
CqHsf4LOC1106887323708.4341.32
CqHsf5LOC1106910343195.9036.75
CqHsf6LOC1106915172528.7029.08
CqHsf7LOC1106930285005.1455.45
CqHsf8LOC1106970833265.5436.46
CqHsf9LOC1107009892647.2230.59
CqHsf10LOC1107024863375.0035.97
CqHsf11LOC1107072992518.4928.95
CqHsf12LOC1107077983236.3637.18
CqHsf13LOC1107116085476.3060.68
CqHsf14LOC1107147954855.8153.67
CqHsf15LOC1107161294125.2647.49
CqHsf16LOC1107173755015.0255.58
CqHsf17LOC1107194843414.9336.06
CqHsf18LOC1107289753835.7543.47
CqHsf19LOC1107293845244.8857.97
CqHsf20LOC1107301445154.7457.13
CqHsf21LOC1107344453845.6643.57
CqHsf22LOC1107363132977.1234.70
CqHsf23LOC1107364494075.3046.84

