Article

Quantification of Soluble Metabolites and Compound-Specific δ13C in Response to Water Availability and Developmental Stages in Field Grown Chickpea (Cicer arietinum L.)

School of Life, Earth and Environmental Sciences, Faculty of Science, The University of Sydney, Sydney 2571, Australia
*
Author to whom correspondence should be addressed.
Agronomy 2018, 8(7), 115; https://doi.org/10.3390/agronomy8070115
Submission received: 27 March 2018 / Revised: 12 June 2018 / Accepted: 26 June 2018 / Published: 5 July 2018
(This article belongs to the Special Issue Photosynthetic Carbon Metabolism to Enhance Crop Productivity)

Abstract

:
Developing biomarkers and bio-indicators that will better indicate stress tolerance is crucial for plant breeding to increase crop resilience and productivity. However, complex interactions between water availability, light intensity, and temperature fluctuations make it difficult to develop standardised properties to monitor performance under field conditions. Sugar alcohols have been shown to function as stress metabolites, demonstrating considerable promise for use as bio-indicators of stress tolerance. This experiment monitored the accumulation of metabolites, including that of the sugar alcohol D-pinitol, in 3 chickpea genotypes grown under field conditions during reproductive stages of development. Further, compound specific carbon isotope abundance (δ13C) of these compounds was quantified to investigate the influence on predictions of water use efficiency. It was found that the magnitude of water deficit did not instigate significant responses in metabolite abundance, however, concentrations of D-pinitol increased significantly over reproductive stages, indicating the accumulation of this sugar alcohol may be under significant developmental control. Significant differences in the δ13C of D-pinitol compared to other metabolites indicate this compound imparts a substantial effect over concentration-weighted predictions of water use efficiency obtained from the soluble fraction of leaves, especially as its proportion in the soluble fraction increases with plant development.

1. Introduction

The characterisation of biomarkers and bio-indicators that reflect the physiological health status of plants and their productivity is a major focus for agricultural development (i.e., breeding tolerant genotypes). Renewed focus on plant chemistry recognises the variation and complexity of plant physio-chemical responses to the dynamic environment, an aspect emphasised under field conditions. Despite this, few chemical biomarkers exist for the functional characterisation of plant stress responses. Notable examples are that of polyols as indicators of abiotic stress [1] and volatile compounds as indicators of plant disease [2].
The partitioning of carbon among compound classes has recently received renewed attention as an indicator of plant growth and productivity [1]. These findings build upon a large volume of work amassed over recent decades investigating individual chemical entities—often termed ‘stress metabolites’ in response to single stress elicitors [3]. Alternatively, the emerging discipline of ‘metabolomics’ offers unique insight into the response of the whole plant chemical network, yielding a more comprehensive understanding of its response to changing conditions [4,5,6]. However, such investigations remain costly and are often conducted under controlled conditions [7]. Few investigations adopt the strategic approach of focusing on subsets of plant metabolism that reflect important branch-points in the biochemical network.
Evidence suggests that sugar alcohols impart an array of osmolytic and osmo-protective functions to mitigate the effects of stressful conditions [8,9]. Therefore, the allocation of carbon to the synthesis of sugar alcohols is commonly termed an accumulation of stress metabolites. Despite these functions, very few papers [10] have sought to characterise the accumulation of this compound class under field conditions. The elicitation of sugar alcohol biosynthesis across a range of taxa has been demonstrated under controlled conditions, most commonly as a result of the combined effects of water, heat, or light stress, [11]. The dynamics of this elicitation under field conditions is limited to correlative relationships with environmental gradients [10], such as mean annual rainfall, with little regard for concomitant physiological responses or changes in plant chemistry attributable to developmental processes.
The dynamic of plant water use is a crucial characteristic that supports both plant productivity and survival. The characterisation of water use efficiency (WUE) is a common bio-indicator for both crop management and plant improvement programs. The use of carbon isotopes to predict WUE is an established approach [12,13] that is now transferring to industrial applications [14]. Improving the relationship between stochastic collection of gas exchange parameters and time integrated WUE modelled from isotope fractionation models has been achieved via a range of considerations, such as assimilation weighting gas exchange measures [15] and a broader consideration of fractionation events both pre- and post-carboxylation [15,16,17]. It is well-established that post carboxylation, biochemical processes of fractionation and partitioning lead to the unequal distribution of carbon isotopes throughout the biochemical network [18]. Predicting WUE on the basis of carbon isotope composition (expressed as δ13C) is therefore susceptible to divergence with actual WUE attributable to post-photosynthetic fractionation and the uneven distribution of isotopes among compound classes. It has been previously shown that the δ13C of sugar alcohols can differ substantially from more commonly abundant metabolites (such as sucrose and glucose) in Phaseolus vulgaris [19,20]. It is not clear if these patterns are ubiquitous among legumes and whether the scope and magnitude of these patterns exhibit a significant influence over predictions of WUE.
Here, a set of commercially available chickpea (Cicer arietinum L.) genotypes were used to characterise the accumulation of carbohydrates and sugar alcohols in leaf tissues in field under two levels of water availability and at three different developmental stages. Changes in concentrations of carbohydrates and sugar alcohols as well as their carbon isotope composition at the compound specific level was determined in order to quantify their subsequent influence over predictions of WUE. Specifically, the following objectives were addressed: (1) to observe changes in carbon allocation to different compounds at the leaf level under field conditions; and (2) determine how these changes differ with different chickpea genotype, irrigation treatment, and developmental stage. It was hypothesized that the δ13C of D-pinitol will differ from the δ13C of other metabolites sampled from the soluble leaf fraction, that the δ13C of D-pinitol will increase in response to lower water availability—similar to the other metabolites from the soluble fraction—and that the magnitude of changes in concentration will influence predictions of WUE.

2. Materials and Methods

2.1. Experimental Design

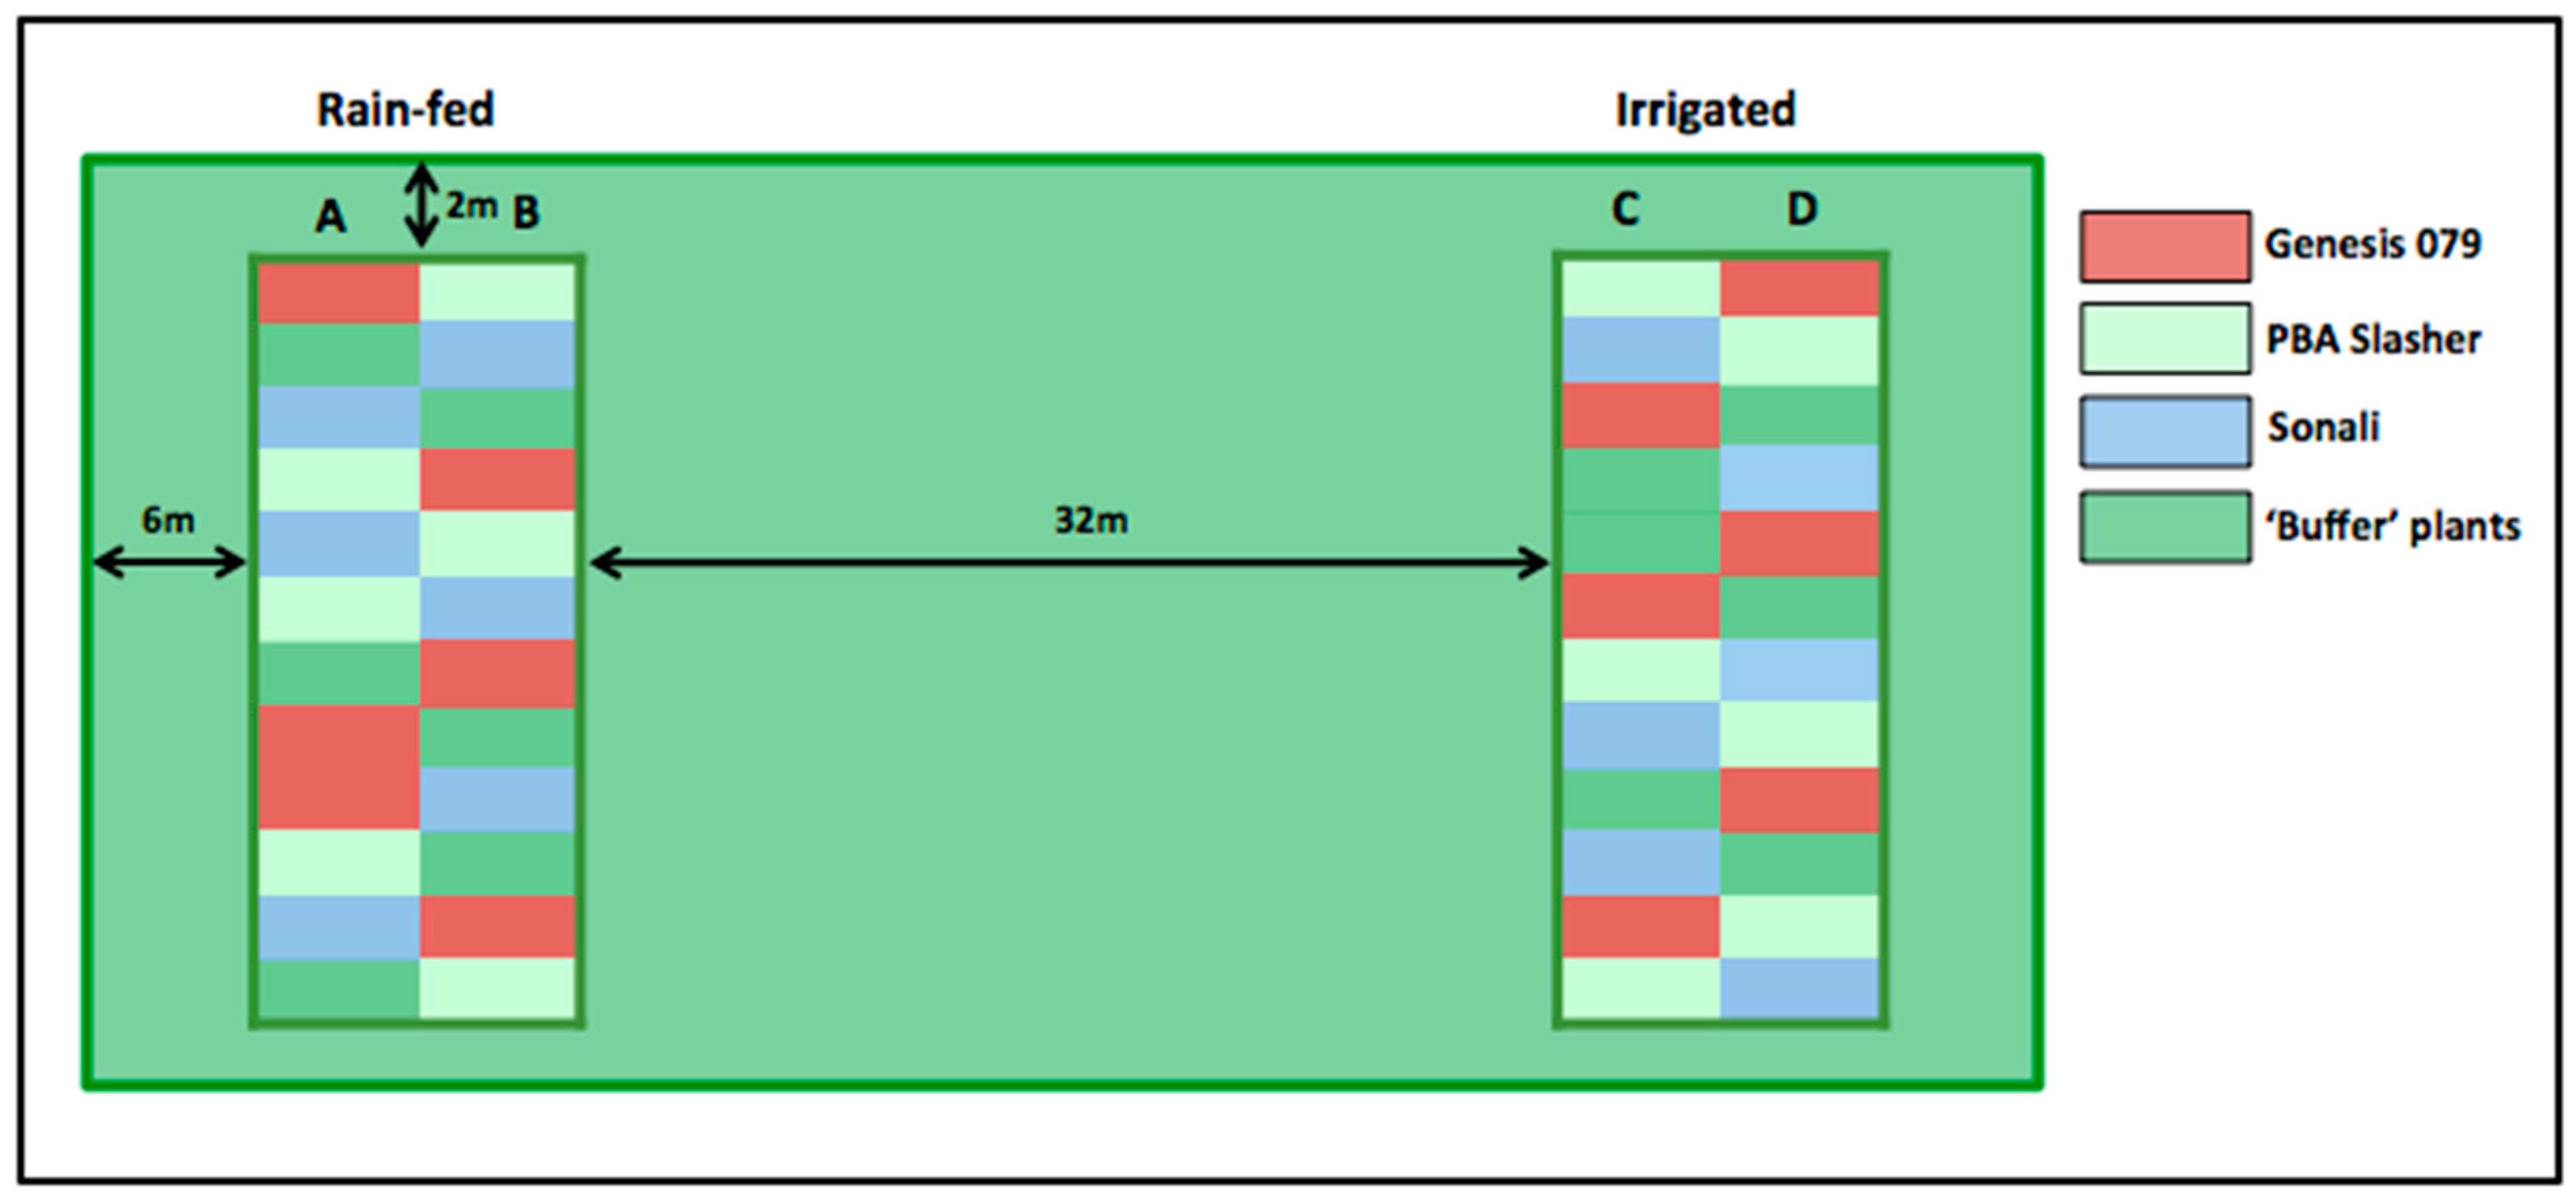
Three chickpea genotypes Genesis 079, PBA Slasher, and Sonali were grown in the field at the I.A. Watson Wheat Research Centre in Narrabri, New South Wales, Australia (30°16′27.0″ S 149°48′33.5″ E) on Black Vertosol in 2015 (11 June to 11 November). All three chickpea genotypes had similar phenology and reached 50% flowering within 15 days and first pod development with one day difference between genotypes.
Each genotype was grown on 6 × 2 m plots replicated six times in a randomized block design within two treatments (rain-fed and irrigated). Buffer chickpea plots were planted between treatments as well as around the outer perimeter of the trial (Figure 1). Total monthly precipitation recorded at the I.A. Watson Wheat Research Centre over the course of the field trial was as follows: 41.16 mm in from 11–30 June, 33.88 mm for the month of July, 42.56 mm for the month of August, 22.12 mm for the month of September, 17.64 mm for the month of October, and 82.6 mm from 1–11 November. Irrigation occurred on 25 September 2015 and 15 October 2015 with 36 mm and 26 mm applied respectively. The herbicides Terbyne 750 wg (1 kg ha−1) and Balance 750 wg (100 g ha−1) were applied on 13 June 2015. The fungicides Unite 27 (0.5 L ha−1) and Ridomil (2.5 kg ha−1) were applied on 21 August 2015 and 22 August 2015 respectively and the insecticide Krate Zion (0.036 L ha−1) was applied on 4 October 2015.
Plants were sampled systematically throughout reproductive stages of development. Three campaign style measurements, each of two days duration, were made and coincided with major developmental stages in reproduction: (1) flowering, (2) pod development, and (3) pod fill. Each stage was defined as:
  • Flowering: All four genotypes contain flowers. Flowers are in full bloom, but with no visible signs of developing pods (sampling took place 90 and 91 days after planting)
  • Pod Development: All genotypes still contain flowers, but most blooms have been replaced with developing pods (sampling took place 102 and 103 days after planting)
  • Pod Fill: All genotypes have pods that have become larger and more round due to seed growth and filling (sampling took place 118 and 119 days after planting)

2.2. Physiological Measurements

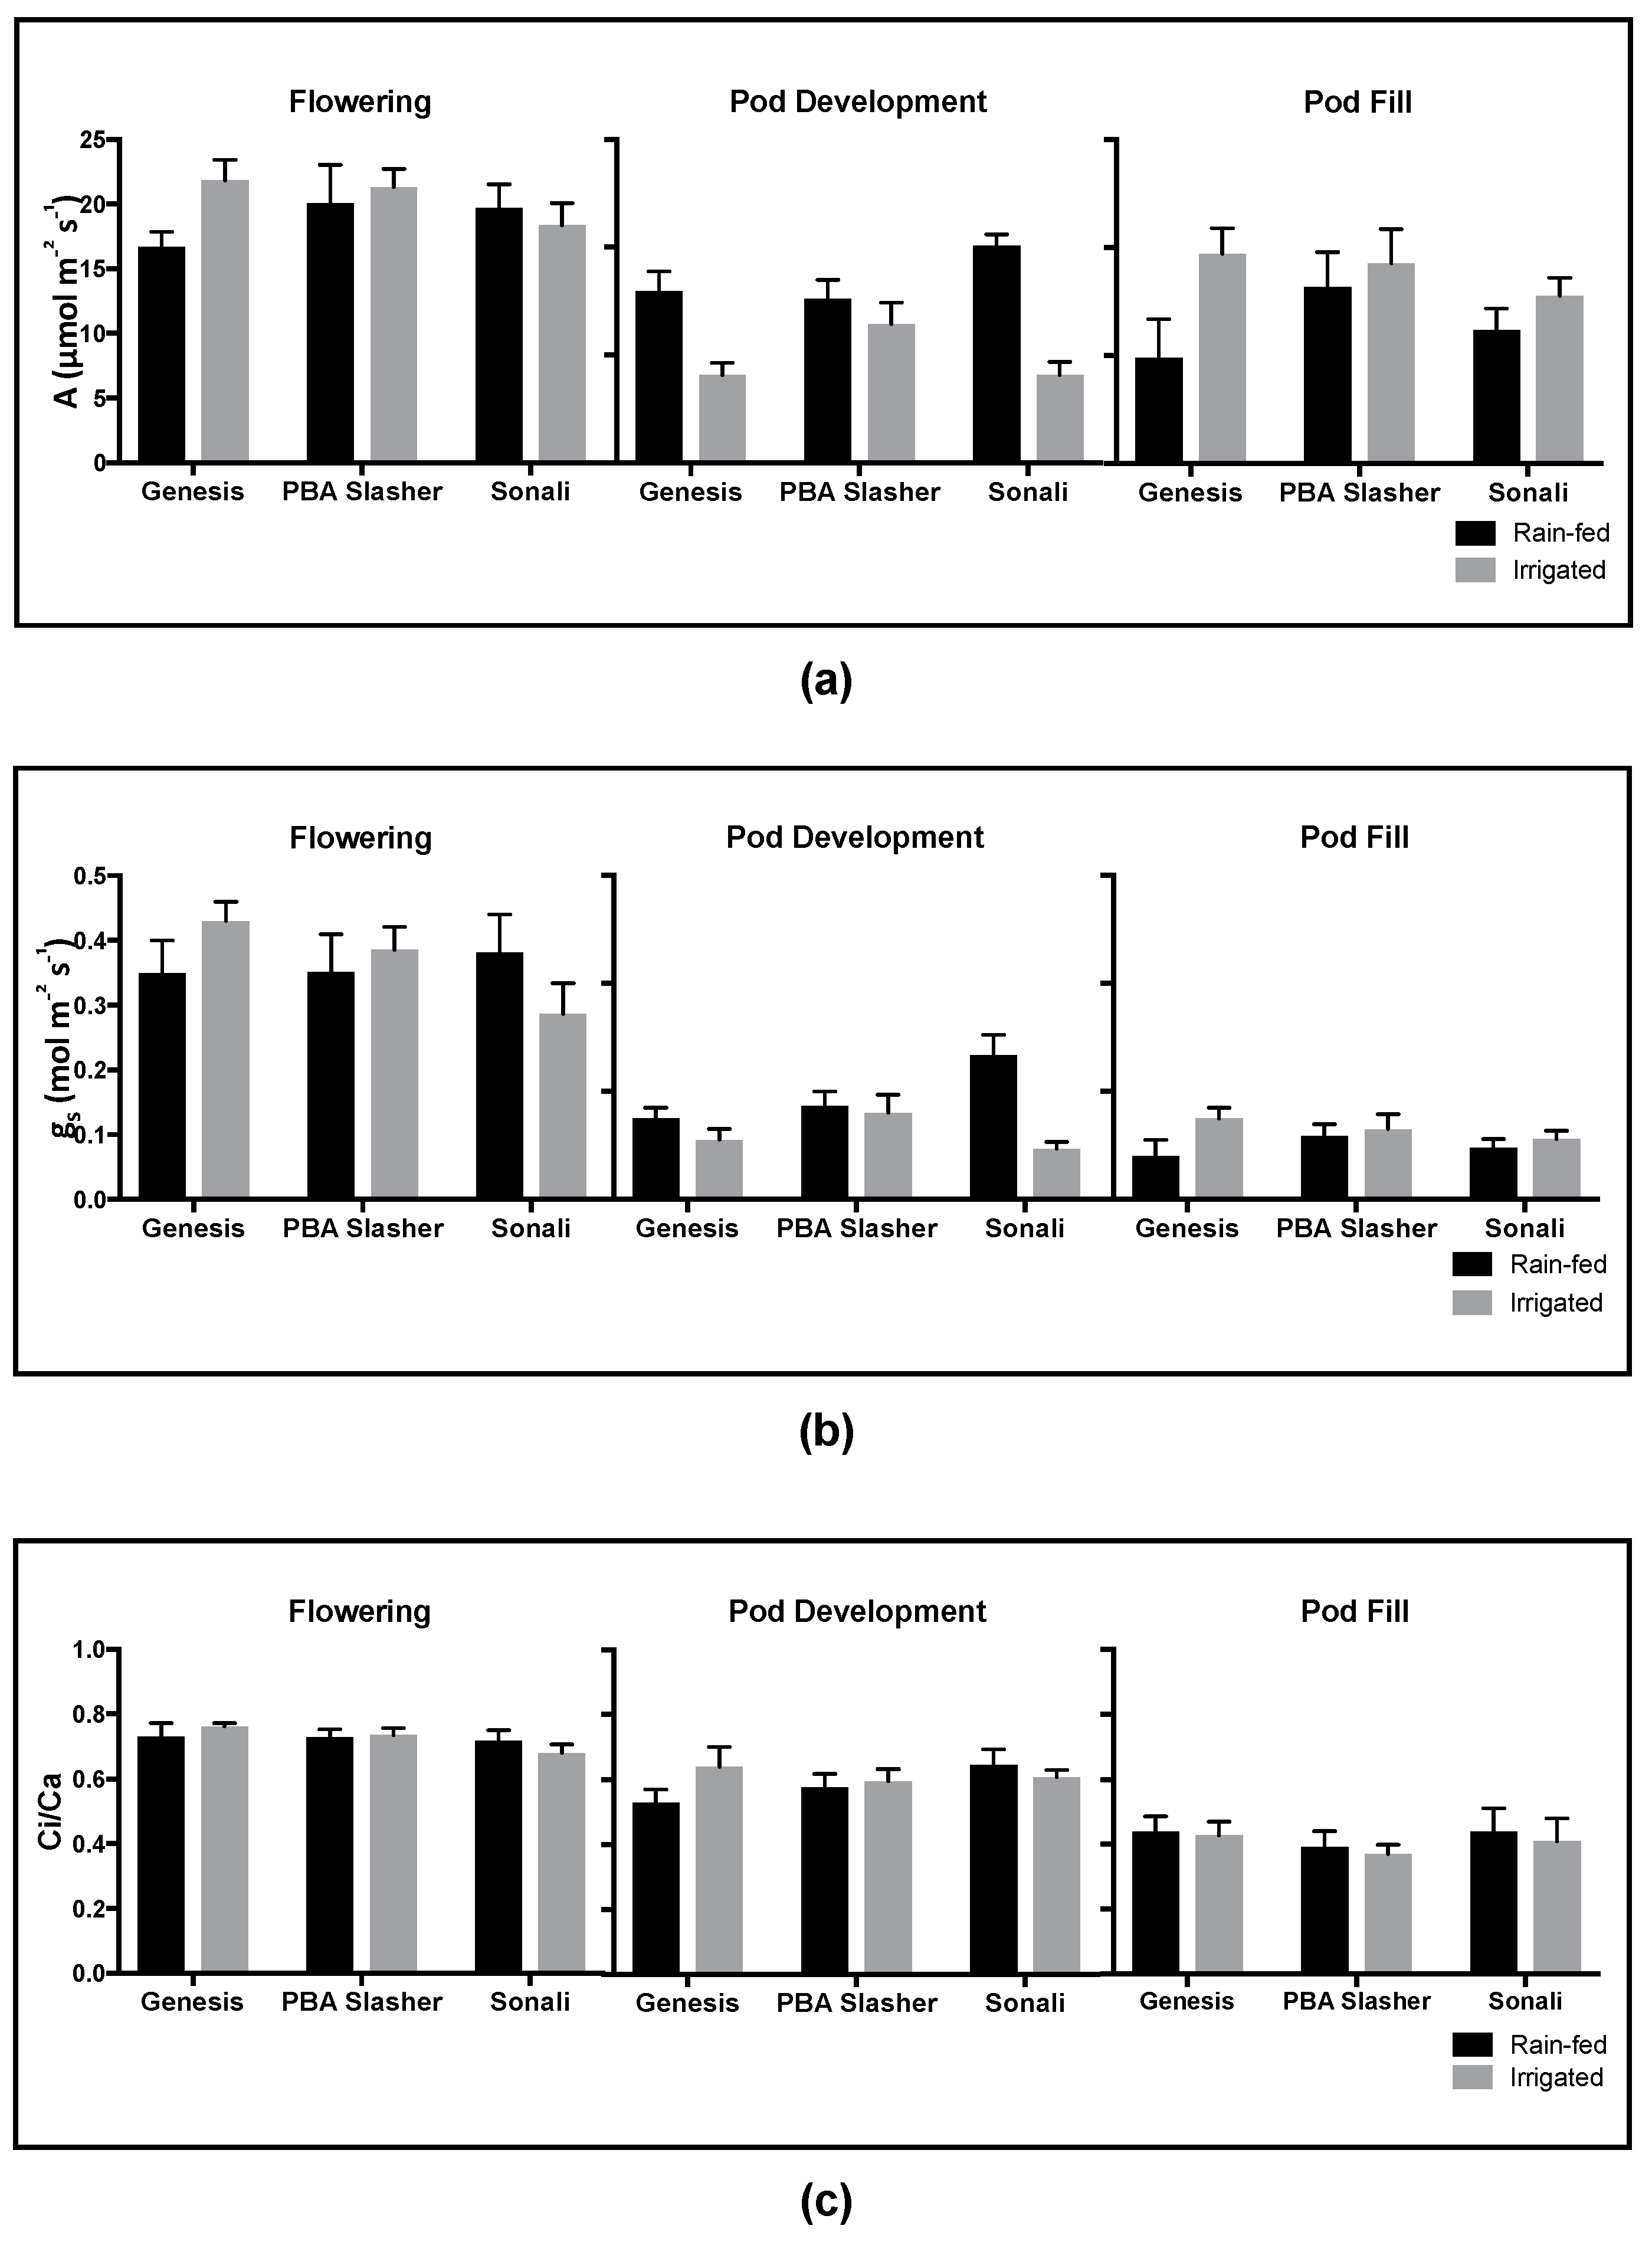
Leaf gas exchange of the first fully developed leaf was determined using the WALZ GFS-3000 portable infra-red gas analyzer (Walz Heinz GmbH, Effeltrich, Germany), commencing at 08:30. The measurement included net photosynthetic rate (A), stomatal conductance to H2O (gs) and the ratio of intercellular to atmospheric CO2 concentration (ci/ca). Conditions within the gas exchange chamber were set to track ambient PAR and temperature. Average daily parameters such as temperature and relative humidity for each sampling campaign are depicted in Table 1. All six replicate plots per treatment were measured within two days (three replicates each day).
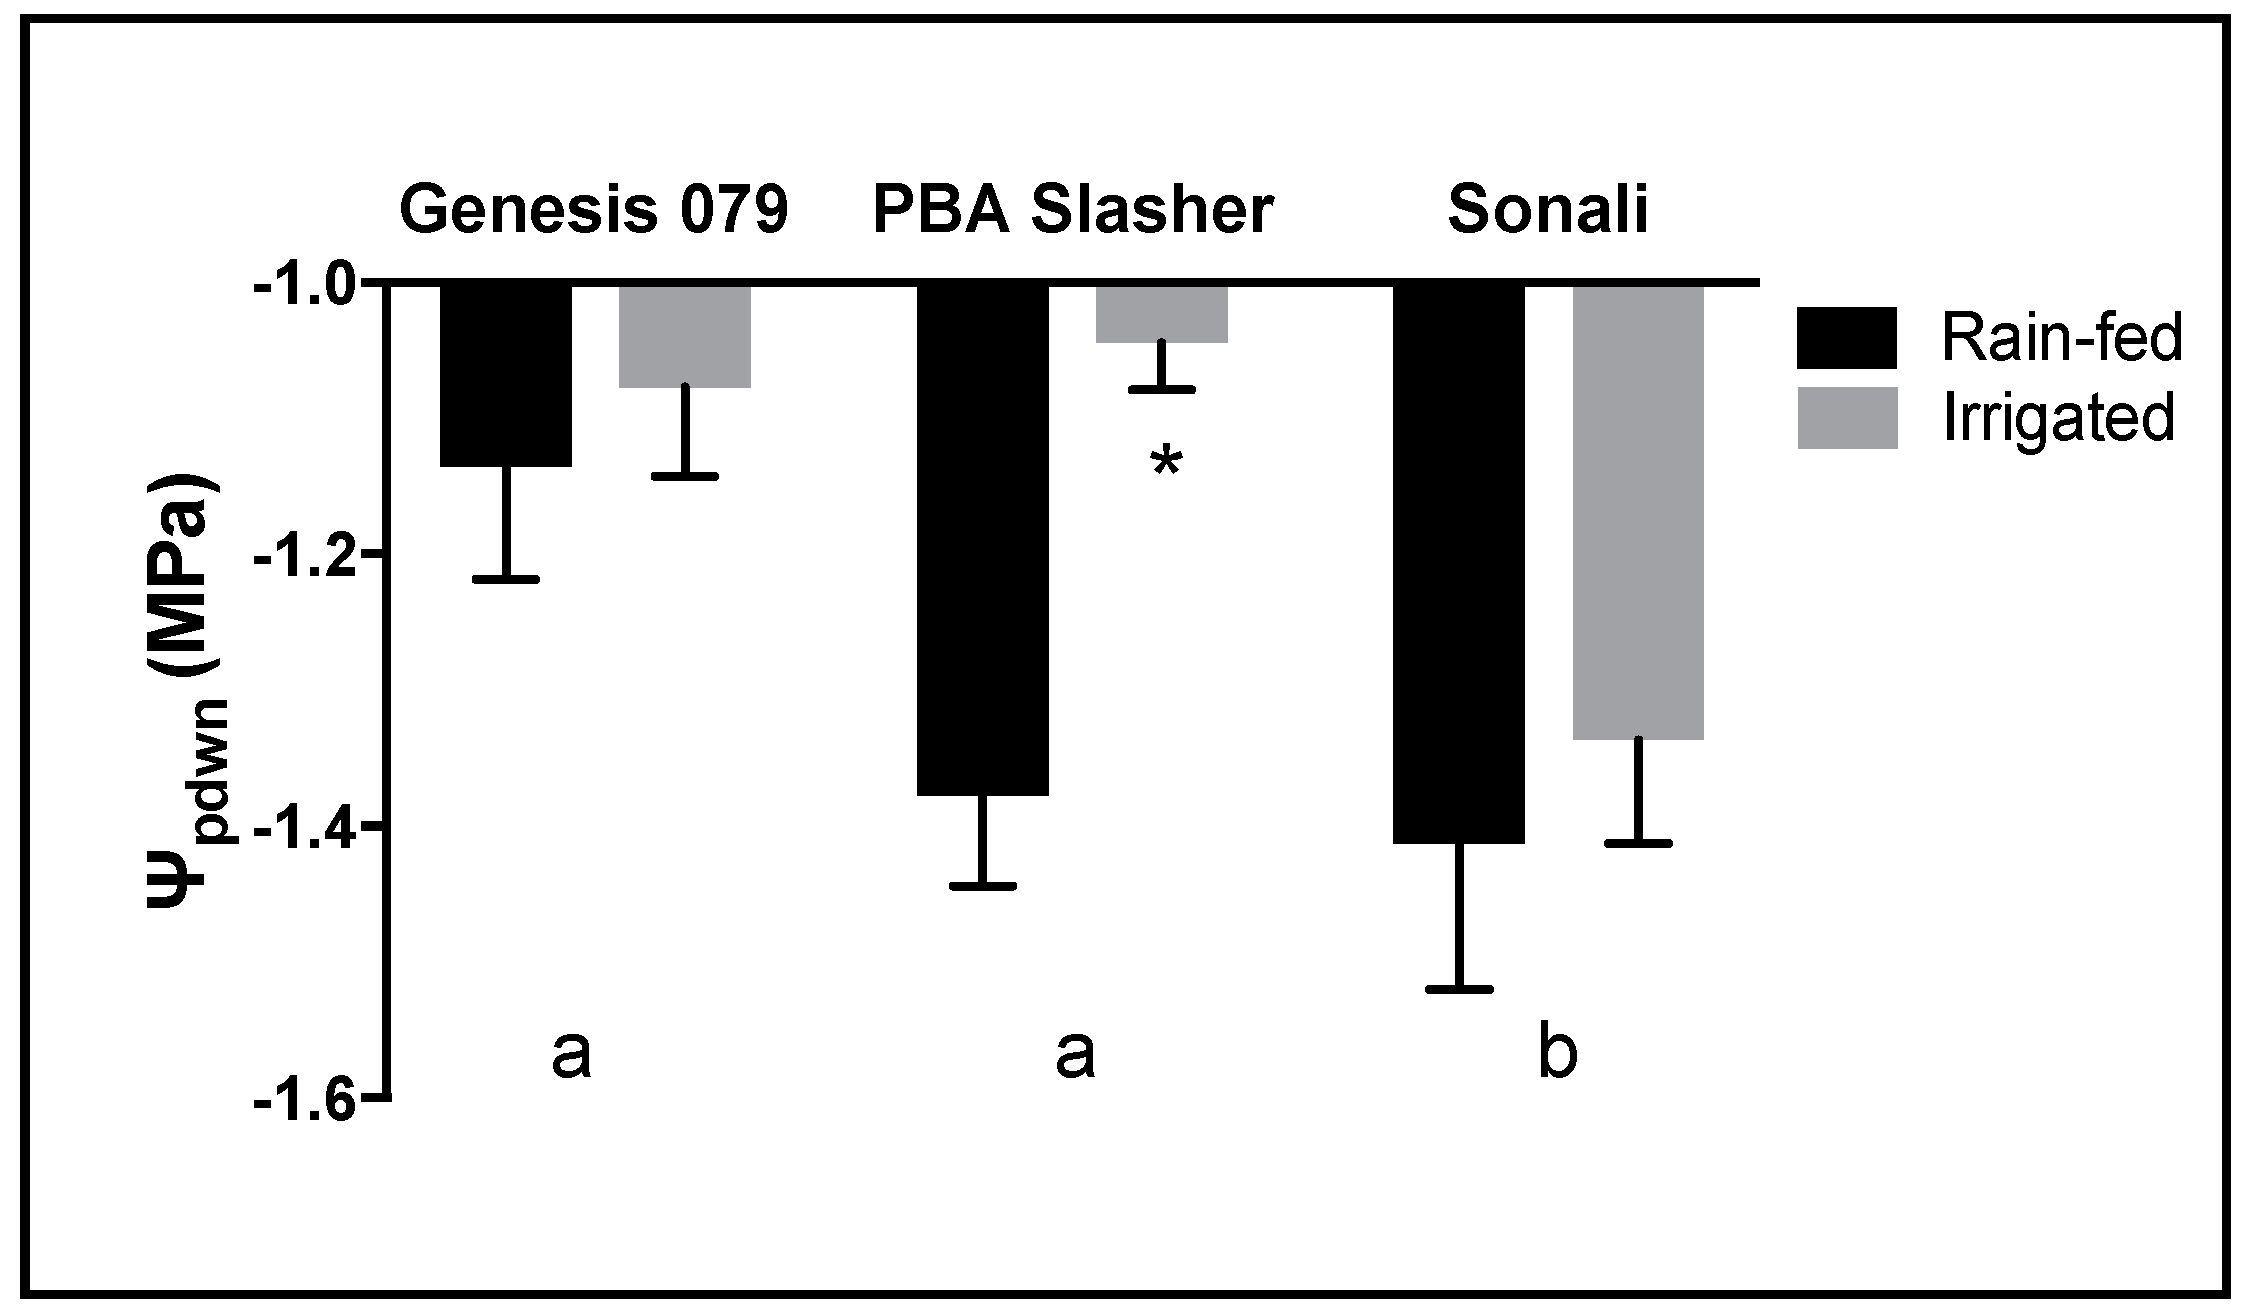
Predawn leaf water potentials were measured at pod fill (Model 3000F01, Soilmoisture Equipment Corp, Santa Barbara, CT, USA) from 04:00 to 06:00. Leaves adjacent to those used for gas exchange measurements were collected for metabolomic analysis at midday between the hours of 12:30 and 14:00 and immediately stored in a portable freezer at −10 °C, awaiting sample microwave treatment according to [21]. Samples were then dried in an oven at 70 °C overnight and stored until analysis took place.

2.3. Analysis of Metabolite Concentrations

Dried leaf samples were ground and hot water extractions were performed according to [22]. In order to analyse non-polar analytes using GC-QQQ, samples were derivatized according to [23]. The separation and quantification of target metabolites was completed using an Agilent 6890A gas chromatograph with QQQ 7000 mass selective detector in scan mode using 50–500 AMU (70 eV) (Agilent Technologies, Santa Clara, CA, USA). Quantification was achieved using MassHunterTM software (Agilent Technologies, Santa Clara, CA, USA) according to the protocol detailed in [23].

2.4. Compound Specific Isotope Analysis

Compound specific isotope analysis was completed according to [24] and took place at the Terrestrial Ecosystem Research laboratory at the University of Vienna in Austria. Dried and weighed leaf samples were transported to the University of Vienna where hot water extractions were first performed according to [22] and then passed over ion exchange resins in order to remove ionic components. Metabolite standards with δ13C values ranging from −27‰ to −10‰ and referenced as pure chemicals by EA/IRMS (EA 1110, CE Instruments, Milan, Italy coupled to a Finnigan MAT Delta Plus IRMS, Thermo Fisher Scientific, Waltham, MA, USA) were prepared at different concentrations and analysed alongside samples. To correct the offset that occurred to the δ13C of samples, the following multiple regression equation [24] had to be applied
δ13Coffline = a × peak area + b × δ13Conline + c
δ13Coffline and δ13Conline represent the δ13C values of the standards measured by EA/IRMS and HPLC/IRMS respectively. δ13C of every sample were corrected by plugging a, b, and c (calculated from standards), peak area and δ13Conline into the equation.

2.5. Modelling Carbon Isotope Discimination and Water Use Efficiency

Photosynthetic carbon isotope discrimination (Δ) for individual metabolites was calculated using the equation
Δ13Cmetabolite = (δ13Cair − δ13Cmetabolite)/(1 + δ13Cmetabolite)
The δ13Cmetabolite represents measured carbon isotope composition of metabolites from leaf samples and δ13Cair represents the carbon isotope composition of atmospheric CO2 (−8‰). Modelled intrinsic water use efficiency was calculated according to [12] originally formulated by [25]
  W U E = c a 1.6 ( b Δ b a )
where a is fractionation caused by gaseous diffusion through the stomata (4.4‰), and b’ is the effective fractionation caused by carboxylating enzymes RuBisCO and PEP carboxylase (approximately 27‰). The factor 1.6 originates from the ratio of the diffusion rate of H2O to CO2. Weighted water use efficiency, or modelled intrinsic water use efficiency incorporating all metabolite concentrations and indicating water use efficiency for the total soluble fraction of the leaf samples collected was also calculated.

2.6. Statistical Analysis

A restricted maximum likelihood (REML) analysis was run on GenStat 15th Edition (VSN International, Hemel Hempstead, UK) to determine if a significant temporal, treatment and genotypic effect on leaf water potential, metabolite concentration, δ13C, and water use efficiency. A least significant difference (LSD) test was then done to determine similar groups and see where significant temporal, treatment, and genotypic differences had occurred. A linear mixed effect model was used for statistical analysis of gas exchange, including the irrigation treatment and genotypes as fixed effects and the day of measurement and repeated readings per leaf as random effects using the nlme package in R (version 3.4.3). To check for differences between days of measurement of gas exchange, the irrigation treatment and genotype were defined as random effects of the linear mixed effects model. A significance level of 0.05 was set for all statistical tests.

3. Results

3.1. Physiological Responses

A trend of higher (less negative) pre-dawn leaf water potential was detected for irrigated compared to rain-fed samples and was observed for all genotypes at pod fill. However, this difference was only significant for the genotype PBA Slasher (Figure 2). Genesis 079 had the highest (least negative) overall predawn leaf water potential of all genotypes and Sonali had the lowest (most negative).
Overall, net photosynthetic rates varied between 37.0 and 1.7 (µmol m−2 s−1) over the three developmental stages, although different patterns between genotype and treatment were seen for each stage (Figure 3a). No significant differences between genotype and treatment were observed for chickpea samples at the flowering and pod fill stage (Table 2). For pod development, net photosynthetic rates were significantly higher for rain-fed plants (p-value < 0.001; Table 2). The difference between the treatment was most prominent for Sonali and Genesis 079, while PBA Slasher showed little variation in photosynthetic rate between treatments (Figure 3a).
Overall, stomatal conductance decreased over the course of the three developmental stages, (Figure 3b). Mean stomatal conductance over repeated readings per leaf ranged from 0.02 to 0.67 mol m−2 s−1. Similar to photosynthesis measurements recorded during the pod development stage, stomatal conductance of rain-fed samples was significantly higher compared to irrigated samples (p-value = 0.02; Table 2). The difference between treatment was most prominent for Sonali, while PBA Slasher, and Genesis 079 showed little variation in stomatal conductance between genotypes.
The ratio of intercellular CO2 to atmospheric CO2 (ci/ca) decreased over the course of the three reproductive stages sampled (Figure 3c). Average ci/ca over all genotypes and treatments at flowering was 0.72, while the average decreased to 0.40 at pod fill. Overall, no significant differences in ci/ca between genotype or treatment were observed during any of the developmental stages (Table 2).
Gas exchange measurements were completed over two consecutive days. Thus, the measurements reflect day to day variation in environmental conditions as the conditions in the gas exchange chamber were adjusted to the outside conditions (Table 1). For the pod fill sampling stage, differences in daily conditions had a significant effect on A, gs and ci/ca (p-value 0.002, 0.007 and 0.048, respectively). Values for A and gs were higher for day 1 of measurement, while ci/ca was significantly lower on day 1 compared to day 2 of gas exchange measurements. In contrast, during flowering, ci/ca was significantly higher on the first day of gas exchange measurements (p-value 0.003), while no difference between days of measurement was observed for A and gs.

3.2. Metabolite Concentrations

Metabolite screening of major compounds contained in the soluble extract of chickpea leaves showed that the dominant soluble metabolites were that of sucrose, glucose, myo-inositol, and D-pinitol. Significant differences in soluble metabolite concentrations were observed on a temporal basis, while no significant differences were observed between rain-fed and irrigated chickpea samples or between genotypes (Figure 4). For glucose (Figure 4a), concentrations in all genotypes were highest at the flowering stage, ranging from 38.81 to 46.78 mg g1 dry weight. Concentrations at pod development were significantly lower compared to flowering for all genotypes. Overall, Sonali had the significantly highest (p < 0.05) concentration of glucose over the course of the three sampling trips compared to Genesis 079 and PBA Slasher.
Significant changes (p < 0.05) occurred in myo-inositol accumulation in leaf samples during reproductive stages (Figure 4b). For all genotypes, myo-inositol concentrations were highest at the flowering stage and decreased, in all lines, with each subsequent stage. All genotypes showed significant decreases in myo-inositol between the flowering phase and pod fill.
Like glucose, sucrose concentrations also decreased from flowering to pod development (Figure 4c). This was followed by significant increases (p < 0.05) in sucrose concentration between pod development and pod fill for all three genotypes. Thus, all three genotypes had their highest sucrose accumulations in the pod fill stage.
D-pinitol concentrations in the soluble fraction of chickpea leaves increased significantly with plant age for all genotypes (Figure 4d). Lowest concentrations were measured during the flowering stage, ranging from 15.80 to 19.70 mg g1 dry weight. D-pinitol concentration then increased over the next two stages until concentrations of 73.37 to 78.12 mg g1 dry weight had been reached at pod fill.
Strong positive correlations were observed between D-pinitol concentration and the concentrations of other metabolites over the course of reproductive stages of development (Figure 5). myo-Inositol concentration was positively correlated to D-pinitol with R2 values of 0.639 (p < 0.0001) and 0.621 (p < 0.0001) for flowering and pod development stage respectively, but with an R2 of only 0.053 for pod fill (Figure 5a). Correlations between sucrose and D-pinitol were also positive, but generally weaker compared to myo-inositol with R2 values between 0.3755 and 0.3041 (p < 0.0001) between sucrose and D-pinitol for all three reproductive stages (Figure 5b). For glucose, correlations to D-pinitol weakened over the course of the three developmental stages and were only significantly correlated (p < 0.0001) for flowering and pod development (Figure 5c).
Converting the concentrations of the measured metabolites to proportions of total soluble compounds helps to illustrate trade-offs between different chemical pools (Figure 6). The proportion of sucrose decreased in Genesis 079 and Sonali falling from 0.64 and 0.62 at flowering to 0.55 and 0.56 at pod fill, respectively. All three genotypes saw at least a 0.10 decrease in the proportion of glucose, which fell from 0.23, 0.25, and 0.23 to 0.10, 0.08 and 0.12 in Genesis, Slasher, and Sonali respectively. Proportions of myo-inositol also fell from 0.05 to 0.02 in all genotypes. Unlike the other metabolites, the proportion of D-pinitol increased consistently over the three sampling trips. Proportions tripled or nearly tripled in all lines, ranging from 0.07 to 0.09 at flowering to 0.25 to 0.28 at pod fill.

3.3. Compound Specific Carbon Isotope Abundance at Pod Fill

No significant differences between genotypes were found in the relative abundance of 12C/13C isotopes in metabolites at pod fill. The Δ13C of all genotypes was therefore combined in order to illustrate trends on a compound specific basis (Figure 7). The Δ13C of glucose decreased from measuring day 1 to day 2, but not significantly (Figure 7a) for all genotypes. Temporal changes for all genotypes in the Δ13C between measuring days were also observed in sucrose with significantly lower Δ13C on day 2 of sampling (Figure 7b). For fructose, the Δ13C of rain-fed samples decreased significantly while the Δ13C of irrigated sampled increased significantly from measuring day 1 to measuring day 2 (Figure 7c). This trend was also seen for D-pinitol, although changes Δ13C between measuring days were not significant (Figure 7d).
Overall, D-pinitol had the significantly highest Δ13C values (p < 0.05) ranging from 22.87 to 24.2, which indicates the lowest δ13C value compared to the other metabolites tested. The other metabolites measured had Δ13C value ranges of 11.85 to 8.94, 12.85 to 11.93, and 9.27 to 5.93 for glucose, sucrose, and fructose respectively.
Calculated predictions of water use efficiency averaged over all genotypes on the basis of isotope abundance of individual metabolite pools ranged from 142.8 in sucrose to 214.8 in fructose (Figure 8). When compared to values for D-pinitol, which did not exceed 42.28, water use efficiency values for the other metabolites was roughly five-fold greater. Weighting water use efficiency for the four metabolites on the basis of the relative contributions to the overall pool gave a range of 113.34 to 130.45.

4. Discussion

The accumulation of soluble metabolites in plant tissues has been observed across many genera in response to stressful conditions. Many of these metabolites belong to a set of compound classes commonly referred to as stress metabolites [3,8]. Here, we have not observed an accumulation of sugars, myo-inositol, or D-pinitol in response to the applied irrigation treatment under field conditions. This indicates that the applied irrigation treatment introduced a very mild drought treatment and that variation in these characteristics under field conditions is lower than that suggested by previous glasshouse based experiments [see for example 1]. This study identified D-pinitol accumulation in chickpea to have implications for the use of soluble metabolite δ13C values in the prediction of WUE. This trial also lays a strong foundation for future studies to further investigate the use of D-pinitol as an indicator of stress tolerance.

4.1. Physiological Responses

Stress responses within the plant system are complex and highly variable, responding to a range of adverse environmental conditions with changes to physiology, metabolism, and gene expression. One of the earliest strategies employed by plants is through changes in physiology, particularly that of changes in stomatal aperture (i.e., closure). Stomatal closure is the first line of defence against dehydration in response to a range of environmental conditions [26]. At no time point was the expected stomatal closure for plants on the rain-fed plots observed. Instead, gs responded to day to day and diurnal variation in field conditions (i.e., heat, light intensity).
Physiological measurements may therefore not be as accurate or stable when screening plants in natural conditions. For the present study, this day to day variation was observed in physiological measurements collected during pod development. Significant differences in gas exchange values between sampling days were observed for A and gs and were likely caused by daily variations in temperature or relative humidity and do not accurately represent the overall plant performance. For this reason, it is critical to take a more integrative approach (such as the using carbon isotope abundances) when assessing plant health and performance in field in order to gain a more accurate understanding of plant health status.
Small and largely non-significant changes in gas exchange (A, gs, ci/ca) and Ψpdwn between treatments likely reflect the subtlety of the water deficit treatment produced in this study. Nevertheless, the irrigation treatment increased yield significantly compared to the rain-fed (data not shown). As a result of field conditions such as larger soil volumes, good water holding capacity of the Black Vertosol, conservative soil water use, and (perhaps) lateral flow of water may have contributed to reducing the severity of the water deficit exhibited in this study. Nevertheless, this phenomenon is a consequence of realistic field conditions and serves as a suitable context for the biochemical patterns observed. In addition, specifically for gas exchange parameters, the lack of significant differences in rates of A, gs, and ci/ca may have been due to adaptive characteristics (such as modification of water potential [27]) to the slow onset of water deficit experienced as a consequence of working under field conditions. Biochemical patterns that were observed are therefore informative of what is likely to be experienced in broader, field based screening efforts.

4.2. Biochemical Responses

Sampling of metabolites under field conditions enables the measurement of plant processes in a realistic cropping context. Both magnitude and variability of light, temperature, humidity, and soil quality can influence biochemical processes in both the short and long term [28]. The interpretation of the data must therefore consider the cascade of processes resulting from a higher level of complexity in growth conditions.
Sugar alcohols have been shown to follow taxonomical patterns [29,30] and accumulate in response to environmental stress [9,11,31,32,33], making them excellent candidates for use in breeding programs and assessing plant health in field [1]. Despite substantial evidence documenting sugar alcohol accumulation under field conditions is limited to only a handful of studies [
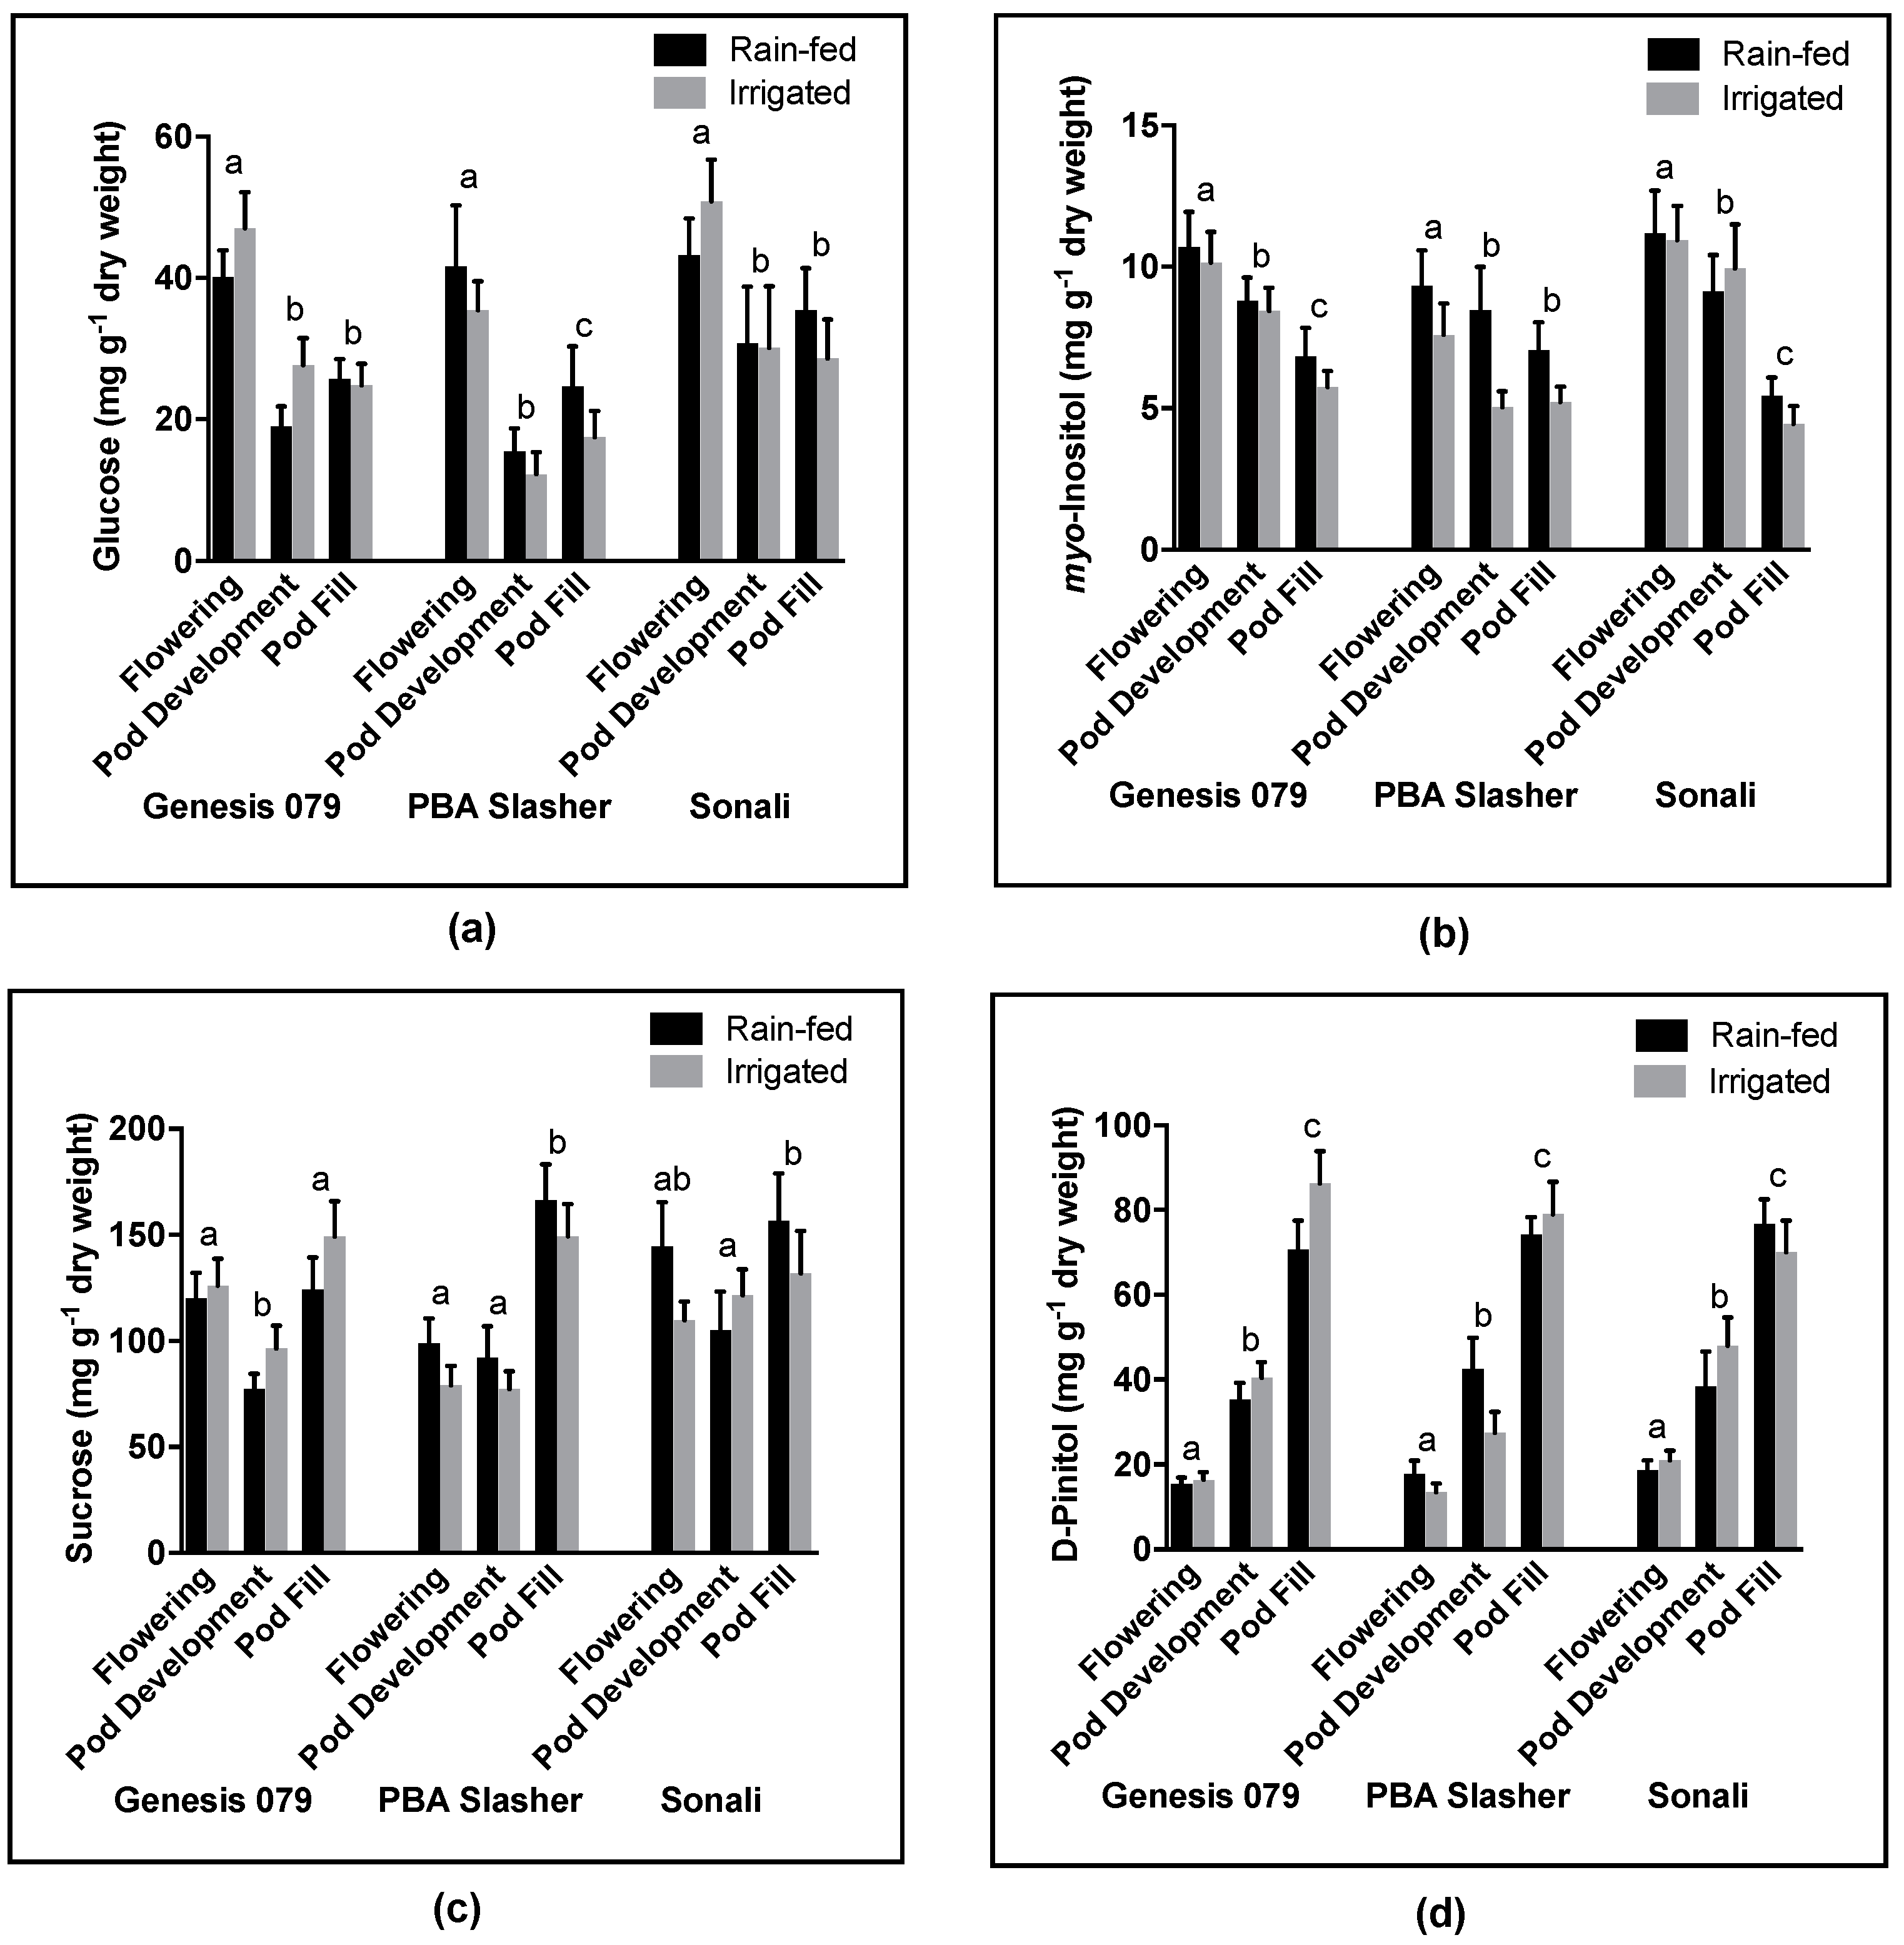
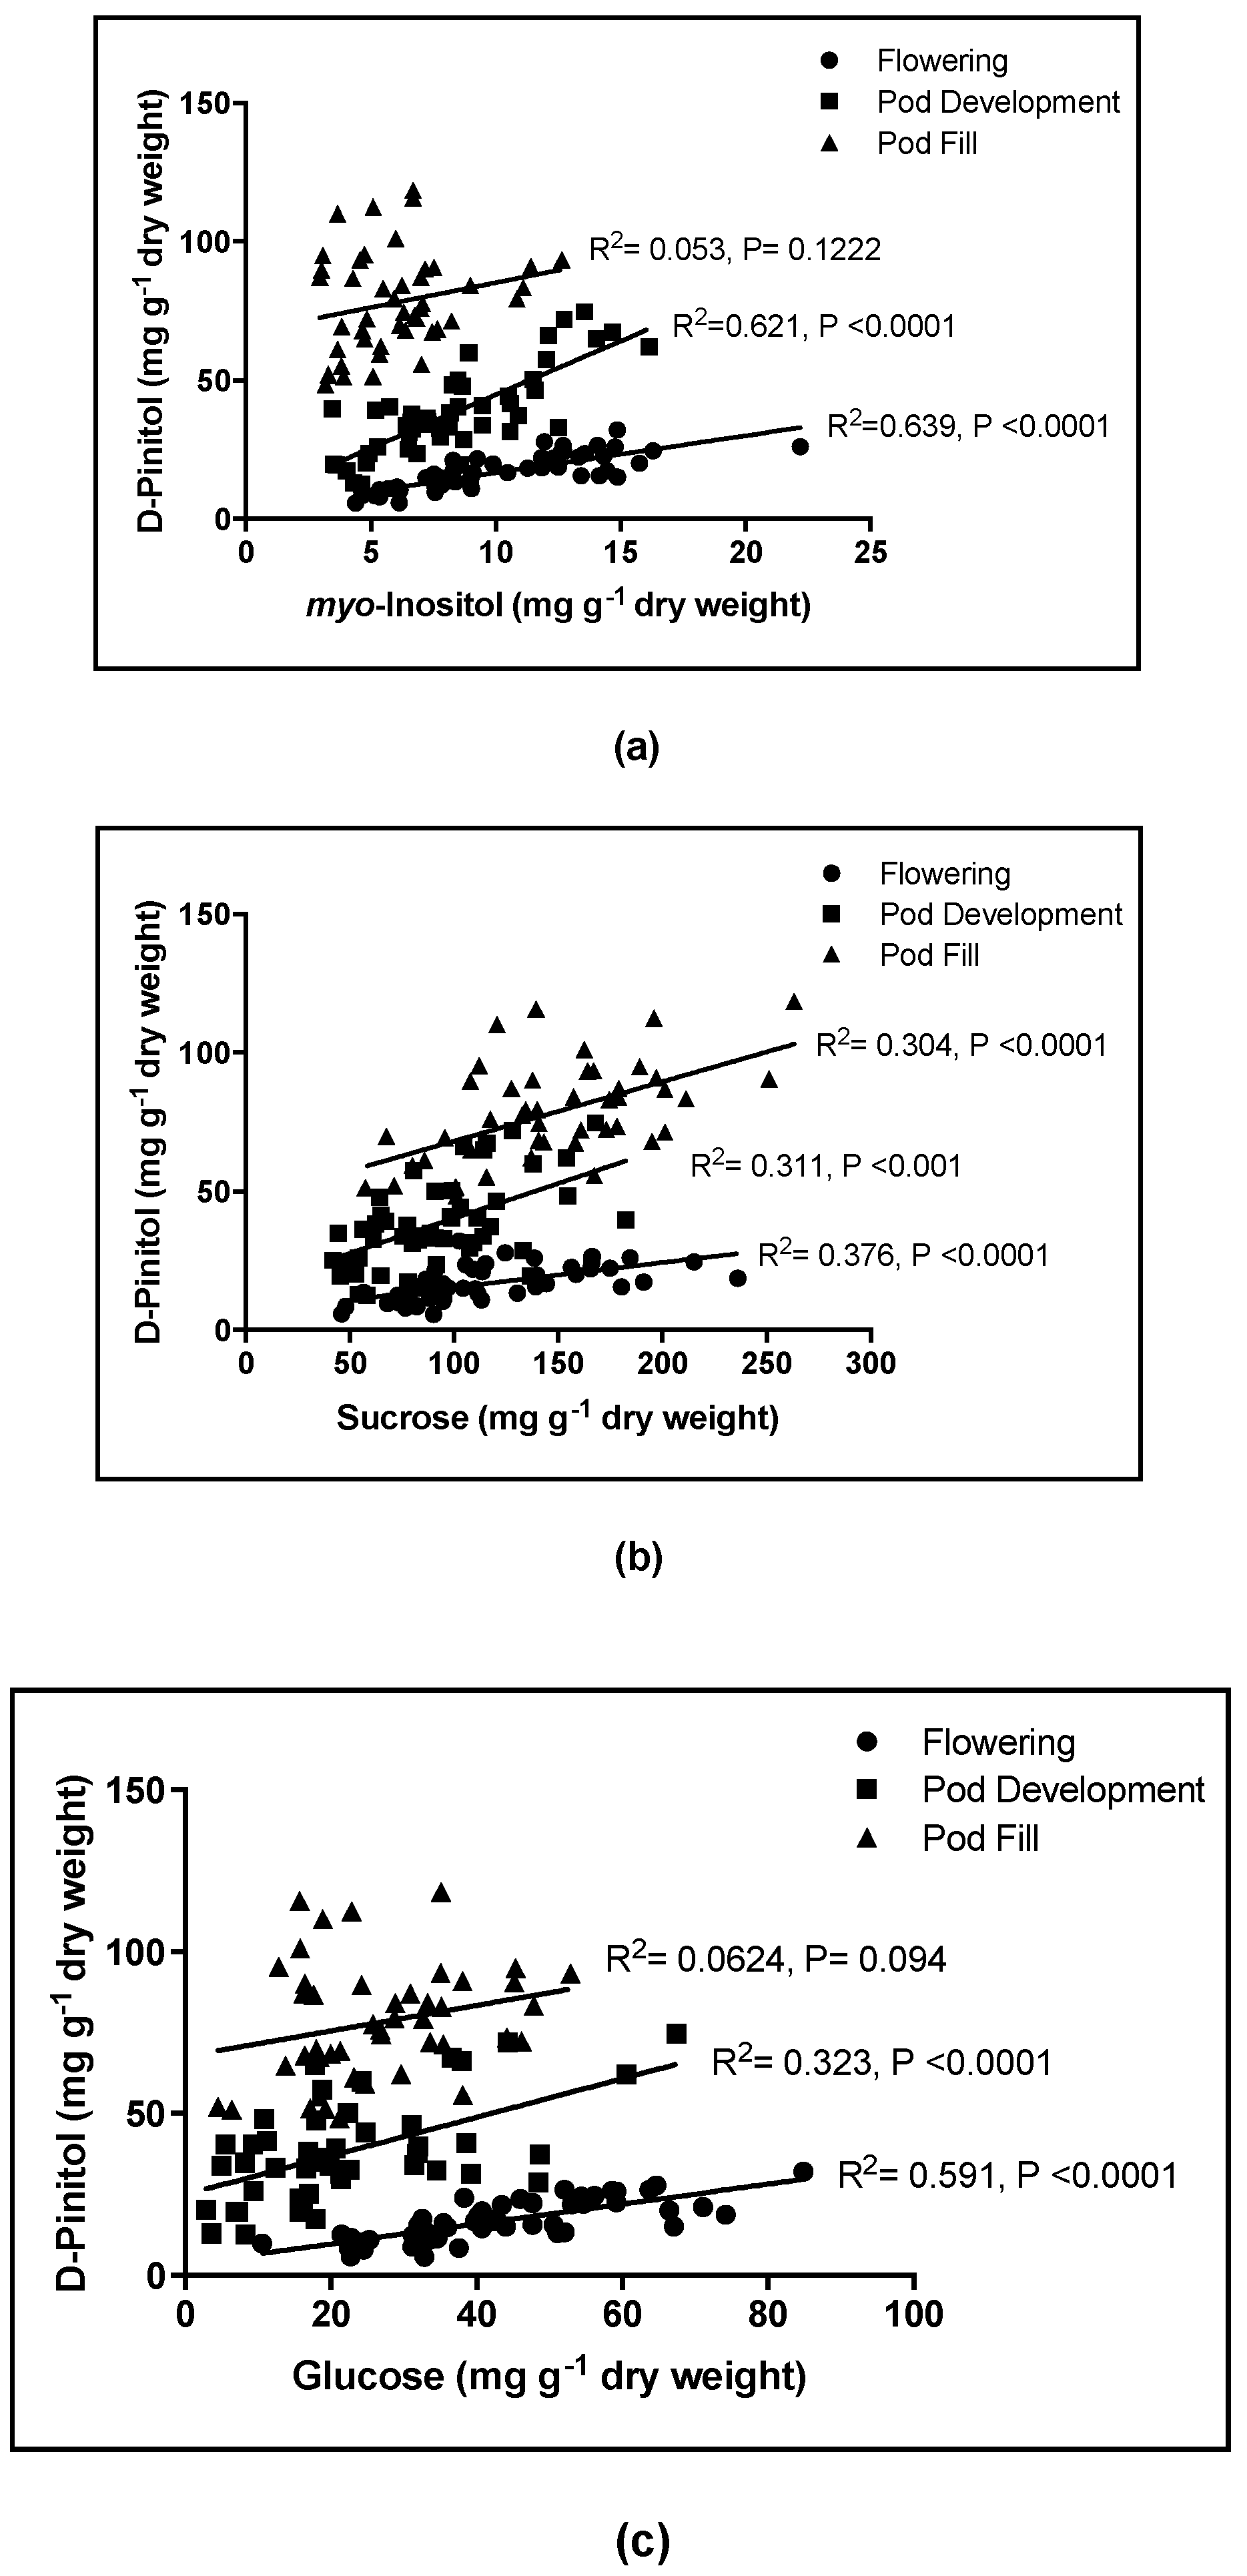
10]. In this field study, D-pinitol and myo-inositol concentrations showed consistent changes in concentrations over the three development stages with D-pinitol increasing and myo-inositol (one of D-pinitol’s precursors) decreasing upon each subsequent sampling trip (Figure 4). This suggests that the accumulation of D-pinitol is strongly influenced by developmental processes (such as desiccation during seed maturity). Interestingly, despite this observed inverse relationship in the accumulation patterns of myo-inositol and D-pinitol, concentrations were positively correlated on a plant by plant basis (Figure 5a), suggesting plants that produce higher concentrations of myo-inositol will accumulate higher concentrations of D-pinitol. However, this relation became weaker with plant development, possibly due to metabolites being allocated from the leaf and into the developing pod. Further studies should aim to elucidate the mechanisms responsible for these observed patterns in metabolite accumulation, focusing on the influence of plant development as well as water availability.
In a rare example of field based investigation of sugar alcohol accumulation, Streeter et al. [10] examined the D-pinitol accumulation among soybean lines planted across China, noting three-fold changes in concentration between genotypes growing in areas of high rainfall and areas of low rainfall. In the present study, no difference in D-pinitol levels was observed between soil moisture treatments, suggesting that under mild water stress other field conditions (i.e., sunlight, wind conditions, temperature) might have a stronger influence on D-pinitol levels. D-Pinitol accumulation showed distinct patterns across time, with relatively little variation among lines. This suggests that the accumulation of D-pinitol is developmentally and environmentally regulated, although a greater variety of lines must be sampled to elucidate how strongly accumulation is determined on a genetic basis.
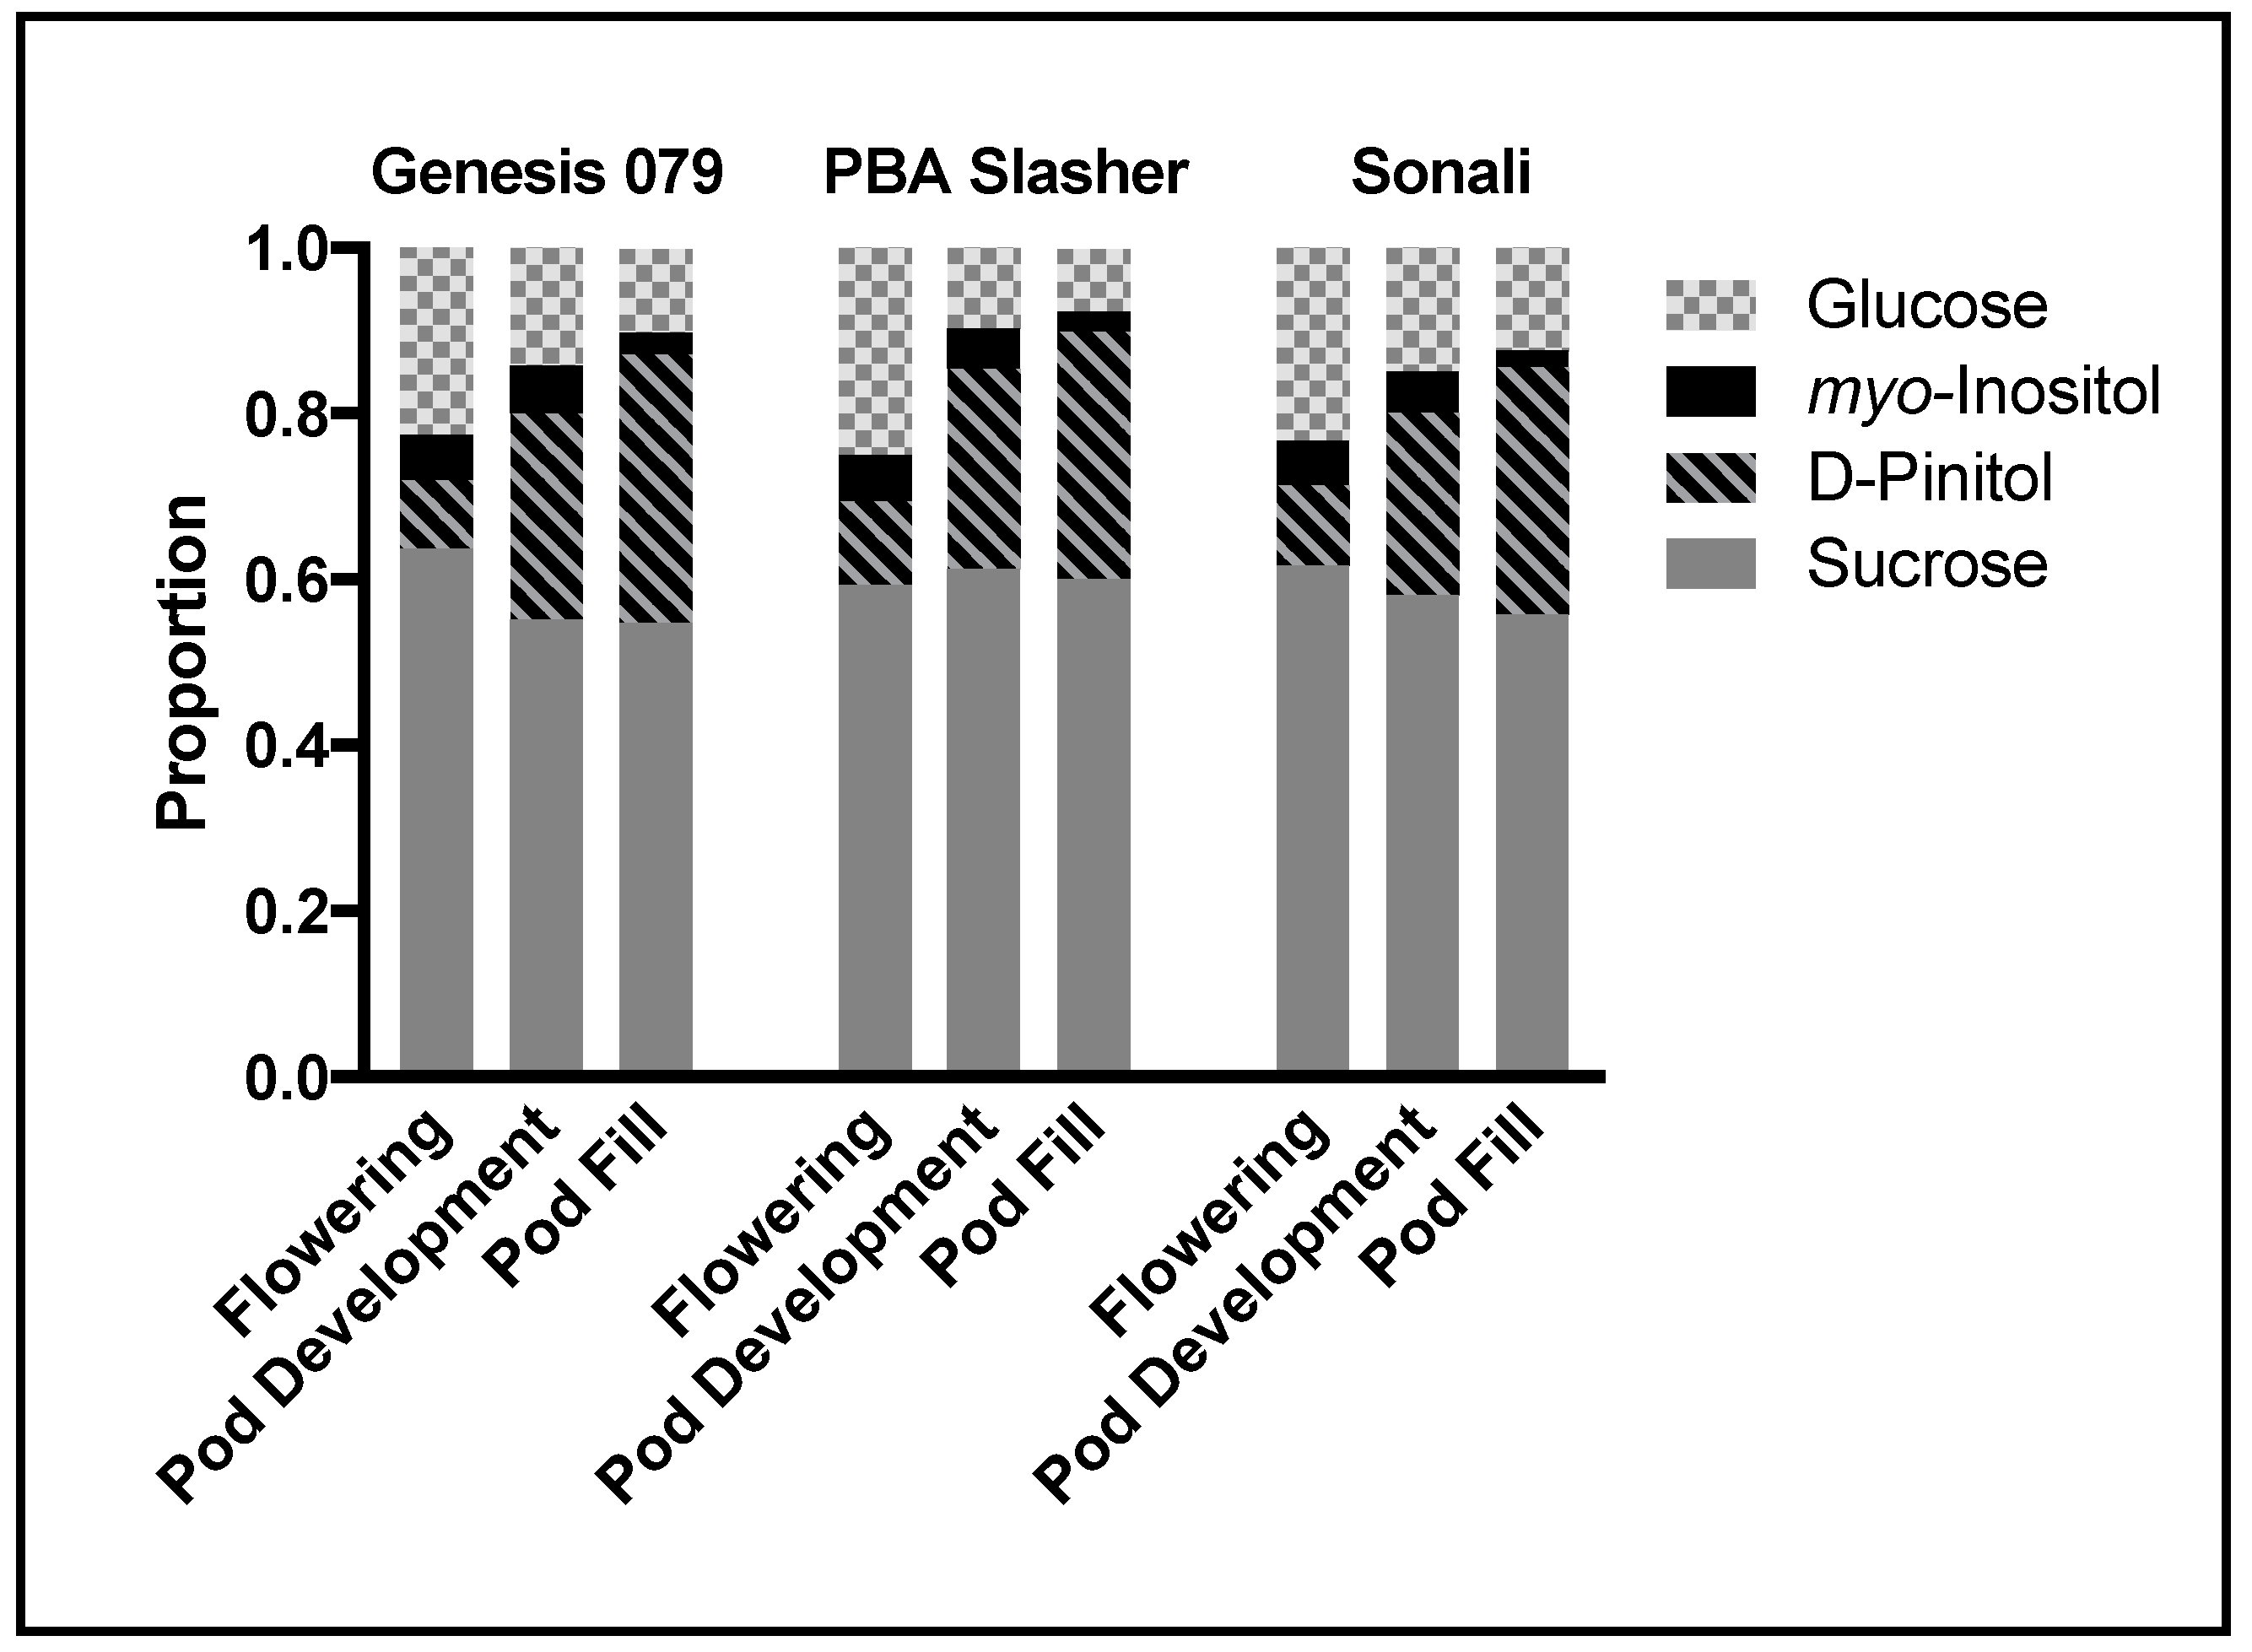
In the present study, D-pinitol was found to constitute a major component of the plant soluble fraction that was measured, being second only to sucrose at the pod fill stage (Figure 6). Allocating carbon to the D-pinitol pool and away from metabolites such as starch and sucrose may have influences over plant growth. Substantial evidence now exists for the role(s) of sugar alcohols as stress metabolites, attributable to their their physiochemical properties as stress metabolites [3]. The accumulation of sugar alcohols may also acts as a carbon sink that is removed from ‘primary metabolism, thereby mitigating the effects of sugar-mediated repression of photosynthetic reactions under stress conditions [1]. By shuttling carbon into the polyol pool, plants are able to remove carbon from the carbohydrate pool, diminishing unwanted feedbacks on primary photosynthesis [34]. Avoiding down regulation of photosynthesis is thought to be an important strategy used by plants to tolerate resource availability and influence rates of primary metabolism upstream [35]. Our study suggests that limited variation among genotypes may impede breeding efforts to improve the stress tolerance of chickpea lines attributable to D-pinitol accumulation, although scanning a wider range of genotypes under field conditions is necessary.

4.3. Implications for Predicting WUE Based on Compound Specific Isotope Analysis

Stable carbon isotope abundance is an established proxy for predicting WUE within the plant system [25]. The carbon isotope composition of plant tissues is influenced by a well-studied set of fractionation events governing the diffusion and incorporation of carbon into primary photosynthates [12]. Less studied are the processes of post-carboxylation fractionation [36]. Changes in the ratio of intercellular to ambient CO2 concentrations are reflected in ∆13C due to the strong impact of diffusional fractionation into the stomatal cavity. Thus, environmental conditions, especially soil water availability, have a strong impact on ∆13C, which can be used to monitor temporal and spatial trends in carbon–water relations [12]. As there was no irrigation treatment effect on ci/ca, it is expected that the carbon isotope abundance in the measured metabolites was not influenced by the irrigation treatment either. Post-carboxylation processes imparting fractionation of carbon isotopes (often termed heterotrophic fractionation) give rise to variation in ∆13C among plant organs and compounds within metabolite networks [37]. As these processes are less understood, heterotrophic fractionation is considered problematic in predicting WUE based on isotope ratios obtained from carbon pools that are considered ‘remote’ to the primary photosynthetic reactions.
In addition to challenges in predicting WUE due to heterotrophic fractionation, the temporal integration of WUE by isotope abundance is reliant on the source tissue. Sampling for ∆13C is often constrained to aboveground plant tissue, particularly to leaves. Bulk leaf carbon isotope composition [25] provides a time integrated measure for the growing period of the leaf material. In contrast, when only the carbon isotope composition of total soluble compounds [38] is analysed, the integrated signal reflects a shorter time frame over which the pool of carbon was fixed into plant tissues.
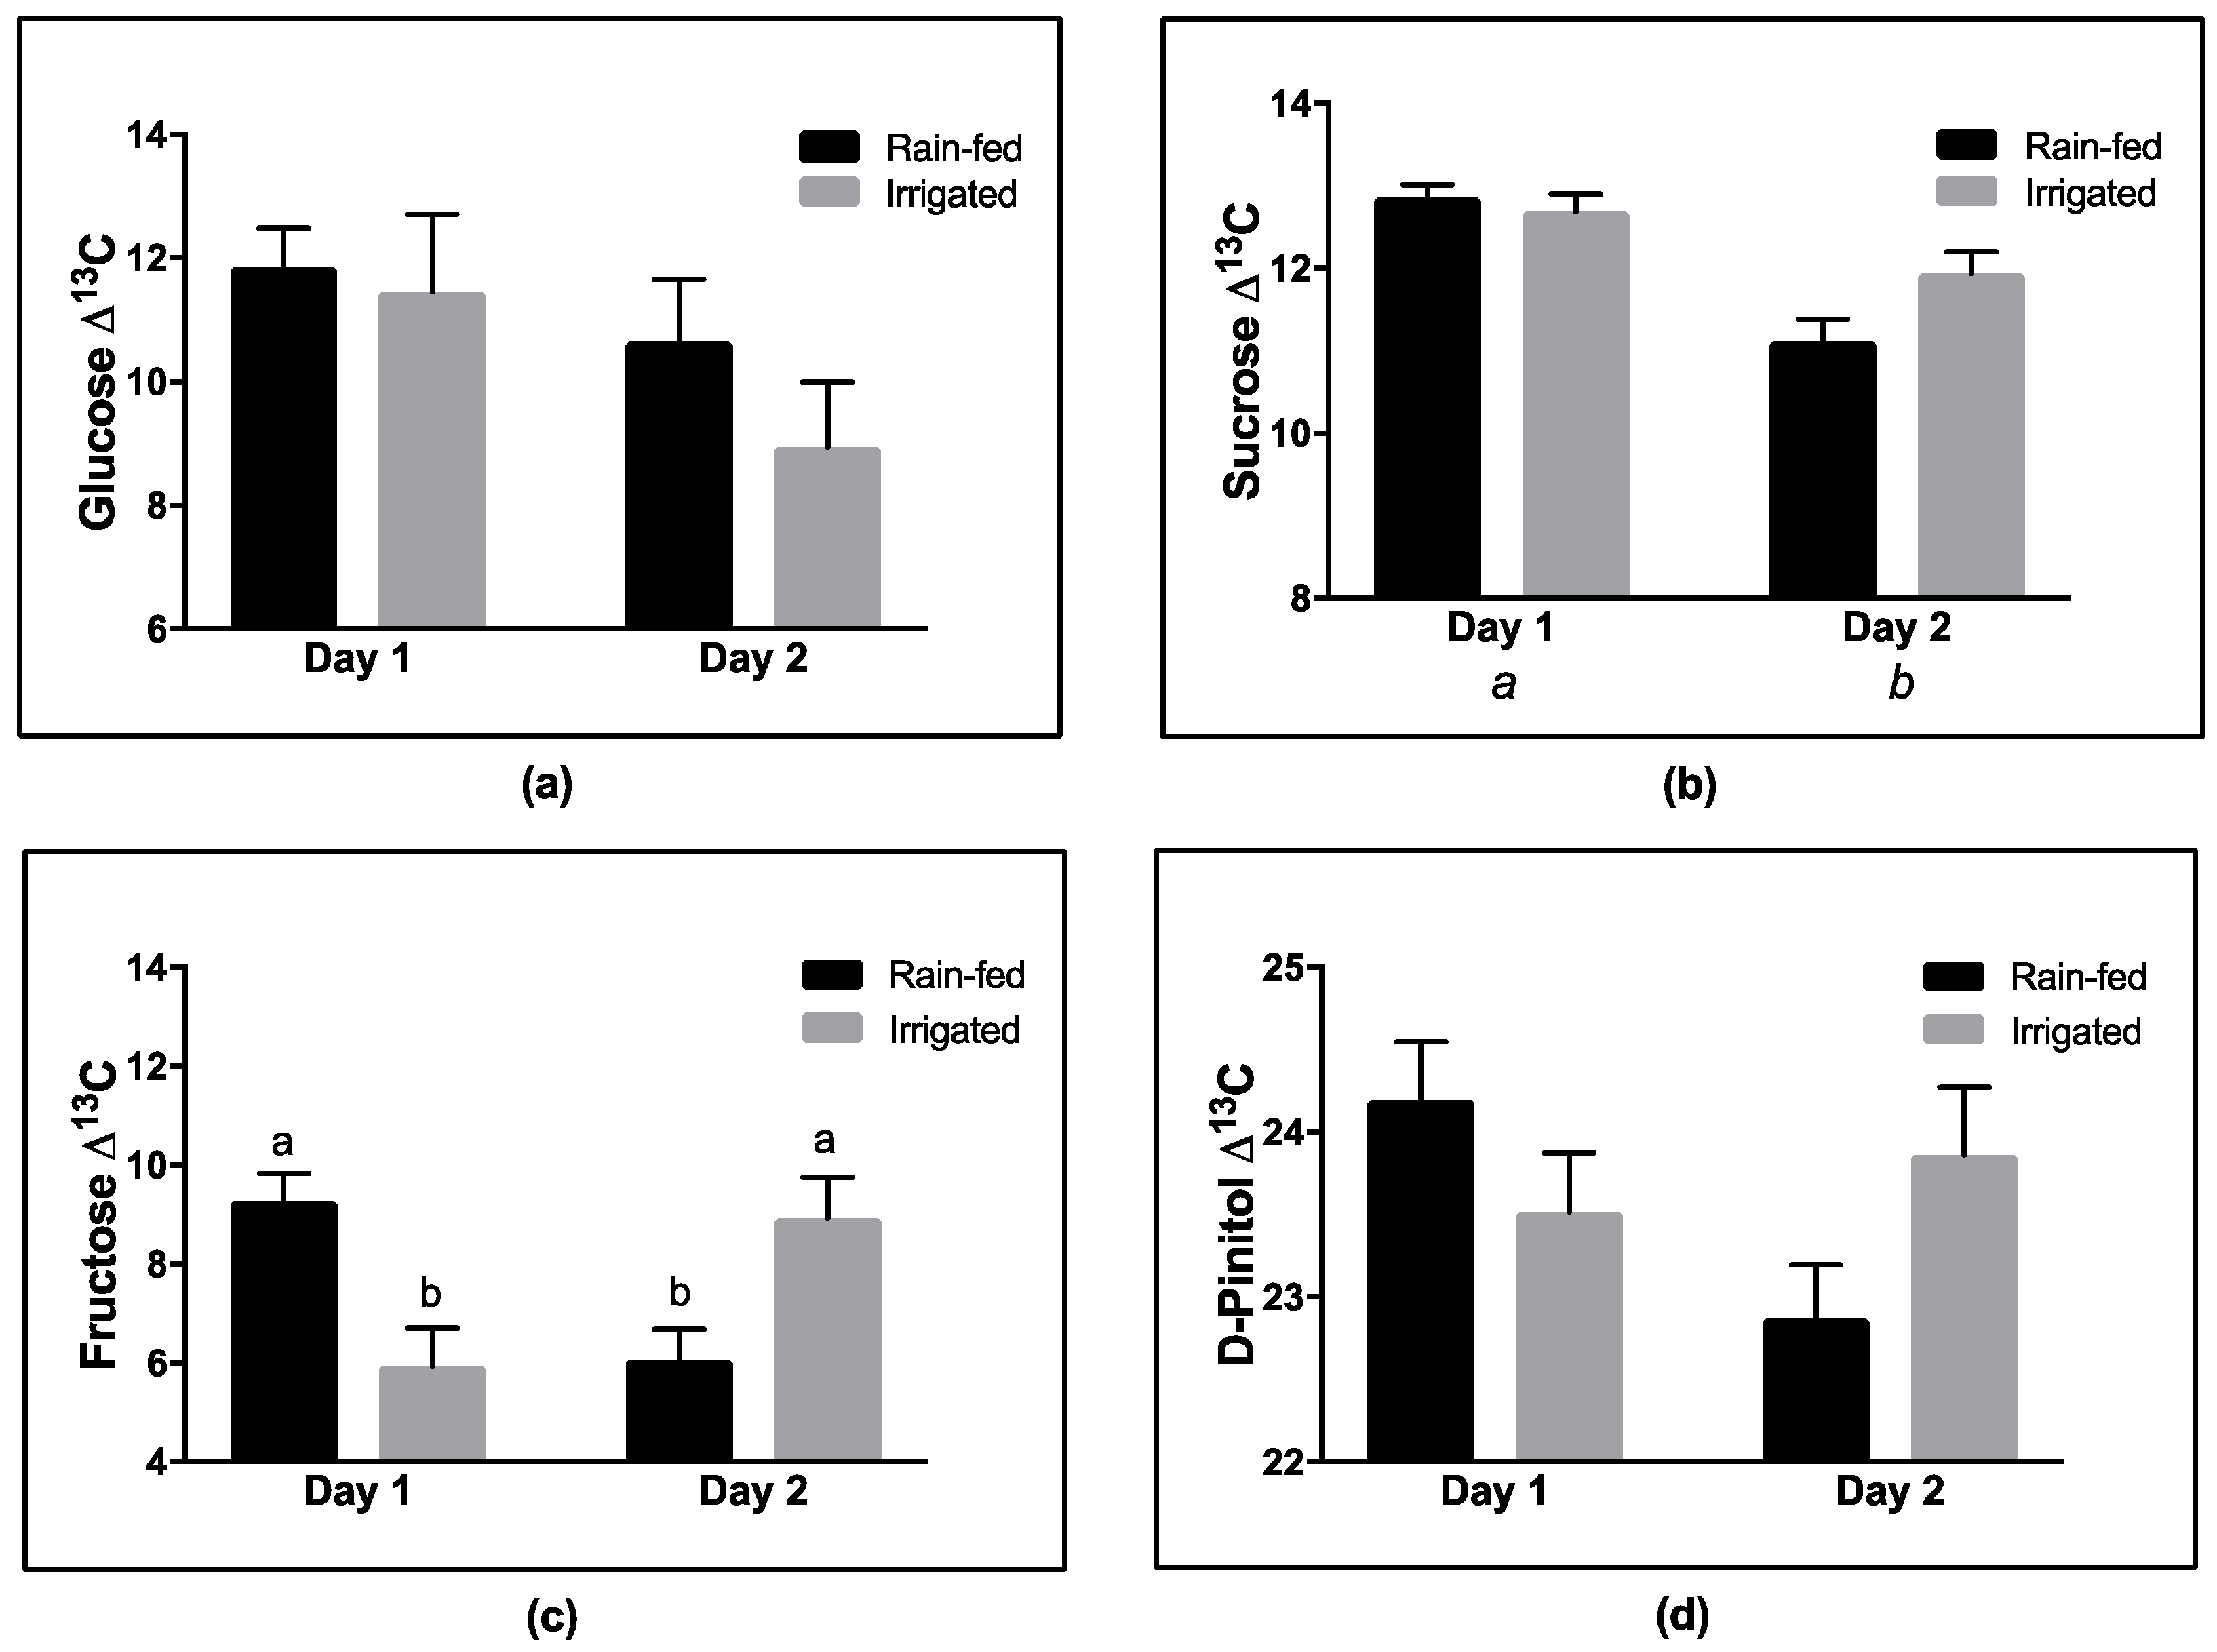
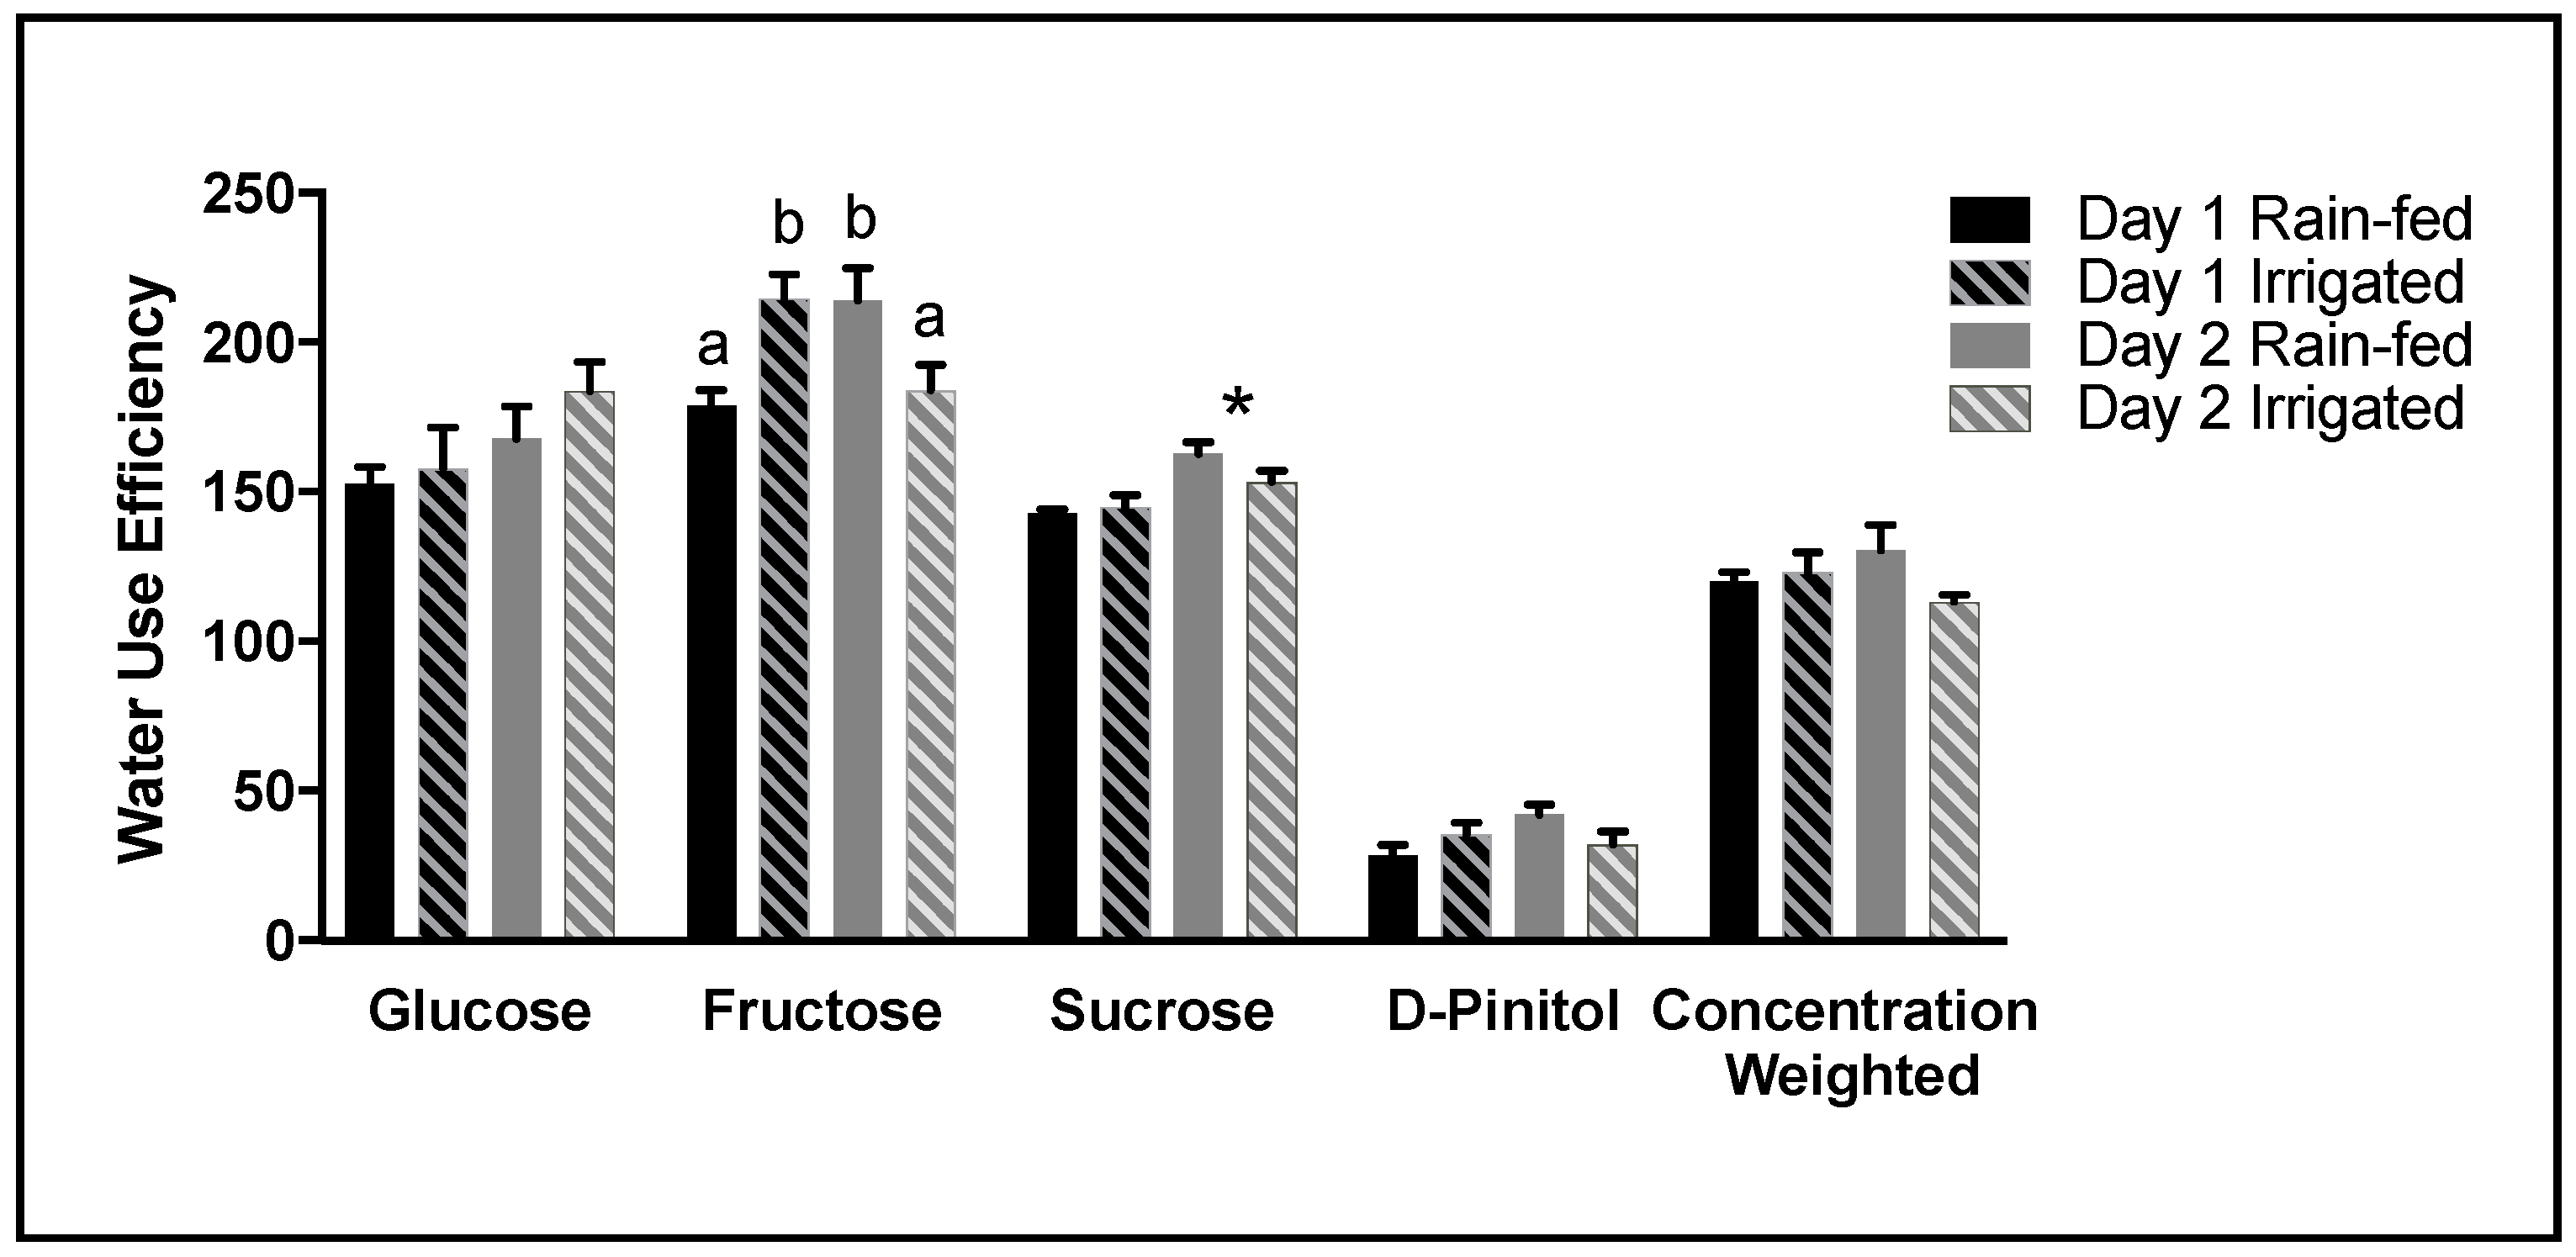
If substantial heterotrophic fractionation occurs during biosynthesis of a particular compound, such as D-pinitol (Figure 7), such changes have the potential to influence the predicted WUE (Figure 8) based upon the soluble fraction of the leaf. Our data illustrates this to be the case. This is especially important when the proportion of D-pinitol in the soluble fraction is high. Hence, the accumulation of D-pinitol with plant development as observed in this study increasingly impacts on the concentration weighted WUE, reducing the value of WUE obtained by predictions based on ∆13C. This observation has major implications when comparing WUE at different developmental stages, as the change in predicted WUE might arise from a developmental change in chemical composition, rather than reflecting the influence of environmental conditions.

5. Conclusions

The present study sought to evaluate the use of candidate biomarkers for growth and productivity located in the soluble chemistry component of chickpea leaves. One significant aspect of the present study is that it was conducted under realistic field conditions. While controlled environment experiments are useful for closely monitoring shifts in carbon allocation within the plant system, they do not account for a plant’s response to the environment as a whole. Several aspects of growth under field conditions differ from that of controlled conditions, each of which may have an impact on the accumulation and allocation of carbon to different pools in plant tissues.
Here we have identified a major shift in the accumulation of soluble metabolites in leaves under field conditions that also carry a significantly different carbon isotopic composition to that of more commonly measured primary metabolites. The magnitude of both changes in compound concentration and δ13C significantly influences predictions of WUE based on soluble leaf carbon. Importantly, the accumulation of D-pinitol appears to be under developmental control. Future studies should aim to elucidate the influence of environmental stress (such as water availability) on D-pinitol under field conditions.

Author Contributions

K.D. conceived and designed the study, completed the fieldwork and chemical analysis and wrote the manuscript. C.H.B. provided input into the design of the experiment, completion of the field work and composition of the manuscript. A.M. conceived and designed the experiment, provided chemical methods and wrote the manuscript.

Funding

This work was supported by an Australian Research Council Industrial Transformation Hub (KD, AM) and and Australian Research Council Future Fellowship (AM).

Conflicts of Interest

The authors declare no conflict of interest.

References

  1. Merchant, A.; Richter, A.A. Polyols as biomarkers and bioindicators for 21st century plant breeding. Funct. Plant Biol. 2011, 38, 934–940. [Google Scholar] [CrossRef] [Green Version]
  2. Sankaran, S.; Mishra, A.; Ehsani, R.; Davis, C. A review of advanced techniques for detecting plant diseases. Comput. Electron. Agric. 2010, 72, 1–13. [Google Scholar] [CrossRef]
  3. Hare, P.D.; Cress, W.A.; Van Staden, J. Dissecting the roles of osmolyte accumulation during stress. Plant Cell Environ. 1998, 21, 535–553. [Google Scholar] [CrossRef] [Green Version]
  4. Weckwerth, W. Metabolomics in systems biology. Annu. Rev. Plant Biol. 2003, 54, 669–689. [Google Scholar] [CrossRef] [PubMed]
  5. Fiehn, O. High throughput metabolite profiling for functional genomics. Plant Cell Physiol. 2004, 45, S7. [Google Scholar]
  6. Fiehn, O. Combining genomics, metabolome analysis, and biochemical modelling to understand metabolic networks. Comp. Funct. Genom. 2001, 2, 155–168. [Google Scholar] [CrossRef] [PubMed]
  7. Sweetlove, L.J.; Fell, D.; Fernie, A.R. Getting to grips with the plant metabolic network. Biochem. J. 2008, 409, 27–41. [Google Scholar] [CrossRef] [PubMed]
  8. Bohnert, H.J.; Shen, B. Transformation and compatible solutes. Sci. Hortic. 1999, 78, 237–260. [Google Scholar] [CrossRef]
  9. Loescher, W.H. Physiology and metabolism of sugar alcohols in higher-plants. Physiol. Plant. 1987, 70, 553–557. [Google Scholar] [CrossRef]
  10. Streeter, J.G.; Lohnes, D.G.; Fioritto, R.J. Patterns of pinitol accumulation in soybean plants and relationships to drought tolerance. Plant Cell Environ. 2001, 24, 429–438. [Google Scholar] [CrossRef] [Green Version]
  11. Loescher, W.; Everard, J.D. Regulation of sugar alcohol biosynthesis. In Storage Carbohydrates in Vascular Plants; Kluwer Academic: Dordrecht, The Netherlands, 2000; pp. 275–299. [Google Scholar]
  12. Seibt, U.; Rajabi, A.; Griffiths, H.; Berry, J.A. Carbon isotopes and water use efficiency: Sense and sensitivity. Oecologia 2008, 155, 441–454. [Google Scholar] [CrossRef] [PubMed]
  13. Blessing, C.H.; Mariette, A.; Kaloki, P.; Bramley, H. Profligate and conservative: Water use strategies in grain legumes. J. Exp. Bot. 2018, 69, 349–369. [Google Scholar] [CrossRef] [PubMed]
  14. Song, D.L.; Conrad, M.E.; Sorenson, K.S.; Alvarez-Cohen, L. Stable carbon isotope fractionation during enhanced in situ bioremediation of trichloroethene. Environ. Sci. Technol. 2002, 36, 2262–2268. [Google Scholar] [CrossRef] [PubMed]
  15. Cernusak, L.A.; Tcherkez, G.; Keitel, C.; Cornwell, W.K.; Santiago, L.S.; Knohl, A.; Barbour, M.M.; Williams, D.G.; Reich, P.B.; Ellsworth, D.S.; et al. Why are non-photosynthetic tissues generally 13C enriched compared with leaves in C3 plants? Review and synthesis of current hypotheses. Funct. Plant Biol. 2009, 36, 199–213. [Google Scholar] [CrossRef]
  16. Bowling, D.R.; Pataki, D.E.; Randerson, J.T. Carbon isotopes in terrestrial ecosystem pools and CO2 fluxes. New Phytol. 2008, 178, 24–40. [Google Scholar] [CrossRef] [PubMed]
  17. Barbour, M.M.; Warren, C.R.; Farquhar, G.D.; Forrester, G.; Brown, H. Variability in mesophyll conductance between barley genotypes, and effects on transpiration efficiency and carbon isotope discrimination. Plant Cell Environ. 2010, 33, 1176–1185. [Google Scholar] [CrossRef] [PubMed]
  18. Tcherkez, G.; Farquhar, G.; Badeck, F.; Ghashghaie, J. Theoretical considerations about carbon isotope distribution in glucose of C-3 plants. Funct. Plant Biol. 2004, 31, 857–877. [Google Scholar] [CrossRef]
  19. Smith, M.; Wild, B.; Richter, A.; Simonin, K.; Merchant, A. Carbon Isotope Composition of Carbohydrates and Polyols in Leaf and Phloem Sap of Phaseolus vulgaris L. Influences Predictions of Plant Water Use Efficiency. Plant Cell Physiol. 2016, 57, 1756–1766. [Google Scholar] [CrossRef] [PubMed]
  20. Lockhart, E.; Wild, B.; Richter, A.; Simonin, K.; Merchant, A. Stress-induced changes in carbon allocation among metabolite pools influence isotope-based predictions of water use efficiency in Phaseolus vulgaris. Funct. Plant Biol. 2016, 43, 1149–1158. [Google Scholar] [CrossRef]
  21. Popp, M.; Lied, W.; Meyer, A.J.; Richter, A.; Schiller, P.; Schwitte, H. Sample preservation for determination of organic compounds: Microwave vs freeze drying. J. Exp. Bot. 1996, 47, 1469–1473. [Google Scholar] [CrossRef]
  22. Merchant, A.; Peuke, A.D.; Keitel, C.; Macfarlane, C.; Warren, C.; Adams, M.A. Phloem sap and leaf δ13C, carbohydrates and amino acid concentrations in Eucalyptus globulus change systematically according to flooding and water deficit treatment. J. Exp. Bot. 2010, 61, 1785–1793. [Google Scholar] [CrossRef] [PubMed]
  23. Merchant, A.; Adams, M.A.; Richter, A.; Popp, M. Targeted metabolite profiling provides a functional link among eucalypt taxonomy, physiology and evolution. Phytochemistry 2006, 67, 402–408. [Google Scholar] [CrossRef] [PubMed]
  24. Wild, B.; Wanek, W.; Postl, W.; Richter, A. Contribution of carbon fixed by Rubisco and PEPC to phloem export in the Crassulacean acid metabolism plant Kalanchoe daigremontiana. J. Exp. Bot. 2010, 61, 1375–1383. [Google Scholar] [CrossRef] [PubMed]
  25. Farquhar, G.D.; Richards, R.A. Isotopic composition of plant carbon correlates with water use efficiency of wheat genotypes. Aust. J. Plant Physiol. 1984, 11, 539–552. [Google Scholar] [CrossRef]
  26. Reynolds-Henne, C.E.; Langenegger, A.; Mani, J.; Schenk, N.; Zumsteg, A.; Feller, U. Interactions between temperature, drought and stomatal opening in legumes. Environ. Exp. Bot. 2010, 68, 37–43. [Google Scholar] [CrossRef] [Green Version]
  27. Farooq, M.; Wahid, A.; Kobayashi, N.; Fujita, D.; Basra, S.M.A. Plant drought stress: Effects, mechanisms and management. Agron. Sustain. Dev. 2009, 29, 185–212. [Google Scholar] [CrossRef]
  28. Poorter, H.; Nagel, O. The role of biomass allocation in the growth response of plants to different levels of light, CO2, nutrients and water: A quantitative review. Aust. J. Plant Physiol. 2000, 27, 595–607. [Google Scholar] [CrossRef]
  29. Bieleski, R.L.; Briggs, B.G. Taxonomic patterns in the distribution of polyols within the Proteaceae. Aust. J. Bot. 2005, 53, 205–217. [Google Scholar] [CrossRef]
  30. Merchant, A.; Ladiges, P.Y.; Adams, M.A. Quercitol links the physiology, taxonomy and evolution of 279 eucalypt species. Glob. Ecol. Biogeogr. 2007, 16, 810–819. [Google Scholar] [CrossRef]
  31. Wanek, W.; Richter, A. Biosynthesis and accumulation of D-ononitol in Vigna umbellata in response to drought stress. Physiol. Plant. 1997, 101, 416–424. [Google Scholar] [CrossRef]
  32. Keller, F.; Ludlow, M.M. Carbohydrate-metabolism in drought-stressed leaves of pigeonpea (Cajanus cajan). J. Exp. Bot. 1993, 44, 1351–1359. [Google Scholar] [CrossRef]
  33. Aranjuelo, I.; Molero, G.; Erice, G.; Avice, J.C.; Nogues, S. Plant physiology and proteomics reveals the leaf response to drought in alfalfa (Medicago sativa L.). J. Exp. Bot. 2011, 62, 111–123. [Google Scholar] [CrossRef] [PubMed]
  34. Stitt, M.; Lunn, J.; Usadel, B. Arabidopsis and primary photosynthetic metabolism—More than the icing on the cake. Plant J. 2010, 61, 1067–1091. [Google Scholar] [CrossRef] [PubMed]
  35. Paul, M.J.; Driscoll, S.P. Sugar repression of photosynthesis: The role of carbohydrates in signalling nitrogen deficiency through source:sink imbalance. Plant Cell Environ. 1997, 20, 110–116. [Google Scholar] [CrossRef]
  36. Bruggemann, N.; Gessler, A.; Kayler, Z.; Keel, S.G.; Badeck, F.; Barthel, M.; Boeckx, P.; Buchmann, N.; Brugnoli, E.; Esperschutz, J.; et al. Carbon allocation and carbon isotope fluxes in the plant-soil-atmosphere continuum: A review. Biogeosciences 2011, 8, 3457–3489. [Google Scholar] [CrossRef] [Green Version]
  37. Hobbie, E.A.; Werner, R.A. Intramolecular, compound-specific, and bulk carbon isotope patterns in C-3 and C-4 plants: A review and synthesis. New Phytol. 2004, 161, 371–385. [Google Scholar] [CrossRef]
  38. Jaggi, M.; Saurer, M.; Fuhrer, J.; Siegwolf, R. The relationship between the stable carbon isotope composition of needle bulk material, starch, and tree rings in picea abies. Oecologia 2002, 131, 325–332. [Google Scholar] [CrossRef] [PubMed]
Figure 1. Narrabri chickpea field trial conceptual design. Genotypes were arranged in a randomised block design surrounded by at least 2 m of ‘buffer’ plants. The trial was located at the I.A. Watson Wheat Research Centre in Narrabri, New South Wales (30°16′27.0″ S 149°48′33.5″ E).
Agronomy 08 00115 g001
Figure 2. Pre-dawn leaf water potentials of chickpea plants grown under rain-fed and irrigated field conditions at the I.A. Watson Wheat Research Centre, Narrabri, NSW, Australia. Predawn leaf water potential (Ψpdwn) was measured at the pod fill stage of development (9 and 10 October). Columns represent average Ψpdwn with associated standard errors from the mean (n = 6) for rain-fed (black columns) and irrigated (grey columns) samples. Letters indicate significant differences (p < 0.05) between genotypes using LSD post hoc (REML) testing. Asterisks (*) indicate significant differences (p < 0.05) between rain-fed and irrigated samples using LSD post hoc (REML) testing.
Agronomy 08 00115 g002
Figure 3. Net photosynthetic rates (A) (a), stomatal conductance to H2O (gs) (b) and ratio of intercellular CO2 concentration and atmospheric CO2 concentration (ci/ca) (c) of three chickpea lines during three reproductive stages of development under field conditions (n = 6). Black columns denote rain-fed samples and grey columns denote irrigated samples. Three replicates per treatment and genotype were measured on two consecutive days of measurement.
Agronomy 08 00115 g003
Figure 4. Average (n = 6) metabolite concentration (mg g1 leaf dry weight) of glucose (a), myo-inositol (b), sucrose (c) and D-pinitol (d) in three chickpea genotypes sampled at three reproductive phases. Leaf samples were collected at 2:00 p.m. the day of gas exchange measurements. Letters denote significant differences (p < 0.05) between developmental phases using LSD post hoc testing within genotypes. No significant differences were observed between rain-fed and corresponding irrigated samples.
Agronomy 08 00115 g004
Figure 5. Correlations between D-pinitol and myo-inositol (a), sucrose (b), and glucose (c) in mg g1 dry weight at three developmental stages of chickpeas. Leaf samples were collected between 12:30 and 14:00 on the same day that gas exchange measurements were taken.
Agronomy 08 00115 g005
Figure 6. Average metabolite proportions for three chickpea genotypes sampled over three reproductive phases. Leaf samples were collected between 12:30 and 2:00 p.m. on the day of gas exchange measurements.
Agronomy 08 00115 g006
Figure 7. Average compound specific carbon isotope discrimination (Δ13C) of all three genotypes at pod fill for glucose (a), sucrose (b), fructose (c), and D-pinitol (d). Columns denote the average Δ13C of three plants and error bars represent the standard error from the mean (n = 3). Letters denote significant differences (p < 0.05) using LSD post hoc texting.
Agronomy 08 00115 g007
Figure 8. Intrinsic water use efficiency at pod fill calculated from Δ13C on a compound specific basis for glucose, fructose, sucrose, D-pinitol, and water use efficiency weighted according to metabolite concentrations in the soluble fraction. Columns denote the average water use efficiency of three plants and error bars represent the standard error from the mean (n = 3). Letters denote significant differences (p < 0.05) using LSD post hoc texting. Asterisks (*) denote significant differences (p < 0.05) between sampling days.
Agronomy 08 00115 g008
Table 1. Average daily parameters for sampling days.
Developmental StageSampling DayAverage Temperature (°C)Average Relative Humidity (%)Average PAR (μmol m−2 s−1)
FloweringDay 1 16.355.41420.2
Day 217.757.61460.2
Pod DevelopmentDay 1 20.956.31359.0
Day 219.847.31674.2
Pod FillDay 1 29.124.01331.3
Day 223.441.31577.6
Table 2. p values of linear mixed model testing the effect of genotype, treatment and their interaction on photosynthesis (A), stomatal conductance (gs) and intercellular CO2 concentration and atmospheric CO2 concentration (ci/ca) all developmental stages. Significant values (p values < 0.05) are in bold.
FloweringPod DevelopmentPod Fill
A (µmol m−2 s−1)gs (mol m−2 s−1)ci/caA (µmol m−2 s−1)gs (mol m−2 s−1)ci/caA (µmol m−2 s−1)gs (mol m−2 s−1)ci/ca
Genotype0.640.550.280.760.730.700.640.720.66
Treatment0.520.730.39<0.00010.020.510.350.400.73
Interaction0.350.510.660.190.610.550.580.610.85

