Sensitivity of Winter-Active Lucerne (Medicago sativa L.) to Different Grazing Regimes
by
 , and
, and
Vivianne F. Burnett
1,*, 
Jeff R. Hirth
2,
Kym L. Butler
3,
Meredith L. Mitchell
1,
Steve G. Clark
3 and
Zhongnan Nie
3 1
Agriculture Victoria Research, Department of Economic Development, Jobs, Transport and Resources, 124 Chiltern Valley Road, Rutherglen, VIC 3685, Australia
2
Jeff Hirth Editorial and Agronomic Services, 182 Anzac Road, Springhurst, VIC 3682, Australia
3
Agriculture Victoria Research, Department of Economic Development, Jobs, Transport and Resources, 915 Mount Napier Road, Hamilton, VIC 3300, Australia
*
Author to whom correspondence should be addressed.
Agronomy 2018, 8(7), 124; https://doi.org/10.3390/agronomy8070124
Submission received: 6 June 2018
/
Revised: 3 July 2018
/
Accepted: 16 July 2018
/
Published: 19 July 2018
(This article belongs to the Special Issue Genetics and Management of Perennial Forage Crops)
Abstract
:Lucerne (alfalfa; Medicago sativa L.) is the key forage for grazing in dryland temperate regions around the world. While rotational grazing of lucerne is recommended, in southern Australia the intervals between grazing events are often chosen in an opportunistic manner, to meet livestock production targets and utilise excessive spring and summer growth. To assess whether the persistence of lucerne is sensitive to variations in rotational grazing management practice, we report on an experiment with four sheep grazing treatments that was conducted for 2.5 years, including three summers, in southern New South Wales. The grazing management treatments were a crash-grazing control, frequent grazing, feed-based rotational grazing and time-based rotational grazing, replicated four times. The number of grazing events, percentage of time under grazing, lucerne top dry matter (DM) at the beginning and end of grazing periods and plant density were measured. The results relating to number of grazing events, percentage of time grazing and DM removed during grazing indicated that four grazing practices had been achieved. The treatments all had significant periods of rest for at least 73% of time and were empirically different in their approach but resulted in similar grazing pressures, in terms of overall pasture removed during grazing. Nevertheless, there was little difference in lucerne densities between grazing treatments over the life of the experiment. We conclude that there is flexibility in the rotational management of grazed lucerne provided adequate rest periods are part of the management program.
1. Introduction
Lucerne (alfalfa) (Medicago sativa L.) is the most important forage legume in temperate regions of the world and is grown on about 35 M·ha globally [1,2,3]. It has a worldwide reputation as the “queen of forages” for its high nutritive value, productivity and adaptation to a range of environments [3,4]. Lucerne is used either as a grazeable forage, harvested for hay and silage or manufactured into pellets and cubes [5]. In Australia, lucerne is grown as a high-quality forage crop for hay production, as well as for direct grazing [6,7,8,9]. On farms in southern Australia, with integrated livestock and cropping enterprises, lucerne is grown in phased rotation with annual crops where 2 to 4 years of lucerne are typically followed by 3 to 4 years of annual crops [8,10].
Irrespective of the farming system, lucerne requires a recovery period after defoliation to allow taproot reserves to be replenished [11,12,13,14,15], and rotational management of lucerne is typically recommended [11,12,13]. Nevertheless, the reality of stocking lucerne on mixed farms is that the grazing events are primarily opportunistic because hay production and livestock production targets often over-ride recommended stocking practices [16]. Additionally, rainfall that occurs in summer outside the usual growing season of May until October, as well as crop and pasture residues, can disrupt strict rotational stocking practices [16]. Thus, knowledge about the outcomes of perturbing strict rotational grazing of lucerne is important for farm management.
In a phased system where crops will be grown after 3 to 4 years of lucerne, having a persistent stand of lucerne may present a hindrance to the cropping program with investment required to remove the lucerne. Alternatively, maintaining a persistent and productive stand of lucerne between the cropping phases is important for livestock productivity. Thus, knowledge about persistence of lucerne, under various conditions, is important for farm management.
Despite the importance of these issues, the sensitivity of lucerne, in terms of plant persistence, to different grazing management practices on mixed farms with substantial resting periods for at least about 75% of time, is unknown. This paper reports on investigations into the effect of different defoliation regimes, implemented through grazing, on the persistence of winter-active lucerne. It was hypothesised that plant persistence would be negatively affected by grazing regimes that, despite having similar grazing pressure and substantial resting periods, deviated from the accepted grazing management practice of short stocking periods of days or weeks, not months, followed by long recovery periods of about 7 weeks [11].
2. Materials and Methods
Some information on the study, including weaner sheep production during summer and autumn, has previously been presented in a short paper [17]. However, methodological detail has not previously been published.
2.1. Site Details
The experiment was conducted at Buraja, New South Wales, Australia (35°49′28.6″ S; 146°17′40.5″ E, 137 m elevation) from November 1999 until January 2002. The protocol and procedures employed were reviewed to assure that ethical animal practices were used and were approved (No. 99002) by the Animal Ethics and Experimentation Committee, North East Region, of the Department of Primary Industries (now Department of Economic Development, Jobs, Transport and Resources). The site was located on a red chromosol soil [18] and the average annual rainfall was 525 mm [19]. The lucerne (cv. Aquarius, winter dormancy 8, winter active) was sown, after being inoculated and lime-coated, at 6 kg·ha−1 with 20 kg phosphorus ha−1, in October 1998.
2.2. Experiment Design and Treatments
The experiment was a randomised complete block (RCB) consisting of four grazing treatments that were replicated four times with the experimental unit being a 0.8 ha plot. The treatments were designed for developing optimum lucerne grazing practices as part of a farming system, implemented by mixed-farming producers in southern Australia as articulated by the farmer consultative committee associated with the experiment. The treatments comprised crash grazing (CG) that mimics hay cutting, frequent grazing (FG), feed-based rotational grazing (FR) and time-based rotational grazing (TR) that approximates the accepted grazing management practice for lucerne management. The experimental period commenced on 1 November 1999 and concluded on 15 January 2002 and lasted for 806 days. For the statistical analyses in this paper, the 806 days were broken into two activity periods:
- (a)
- The three summer periods of 1 November 1999 to 23 February 2000, 3 November 2000 to 14 March 2001 and 25 October 2001 to 15 January 2002. Over these periods, weaner lambs were assigned to any of the three treatment plots—TR, FR and FG, and were rotationally grazed. The rotationally grazed period totalled 327 days of the experimental period.
- (b)
- All the remaining periods not specified in (a) that represented the two autumn to late-spring periods of 2000 and 2001 are labelled ‘non-summer’ periods. Over these periods, treatment plots were grazed by stock classes comprising wethers or ewes and lambs, not weaner lambs. These two winter-spring grazing periods totalled 479 days.
2.3. Grazing Management
2.3.1. Crash Grazing
Producers in the region may opportunistically cut lucerne for hay when the dry matter (DM) reaches 1000 kg·ha−1. Thus, the CG treatment was intended to approximate mechanical harvesting of the lucerne. However, it was impractical to directly harvest the lucerne because neutron probe access tubes for soil moisture measurement had been installed within in the plots. Thus, when the four 0.8 ha plots assigned to the CG treatment reached approximately 1000 kg·ha−1 in lucerne DM, the pasture was rapidly defoliated through grazing by a large number of sheep (average of 118; range 30–320) comprised of wethers, ewes or lambs, over a period of 3 days. The treatments were imposed from November 1999 until January 2002. The CG treatment was grazed nine times over the duration of the experiment (Figure 1).
2.3.2. Frequent Grazing
When lucerne DM yields in the FG treatment reached approximately 1000 kg·ha−1 by visual assessment, the lucerne was grazed until DM yields reached approximately 500 kg·ha−1 by visual assessment. This criterion was selected as the minimum DM before damage to the lucerne crowns from grazing and trampling would have occurred, typically when lucerne is grazed below 2 cm in height [7]. Actual DM was confirmed by either calibrated visual assessment on quadrats, or by cutting quadrats (see later).
2.3.3. Feed Rotation and Time Rotation
There were four 0.8 ha plots for both the FR and TR treatments. Each of these plots consisted of three adjacent sub-plots of equal size (0.27 ha), separately fenced and with water supplied. When weaner cross-bred lambs were grazing the FR plots over the three defined summer periods, the animals were moved sequentially around the three 0.27 ha sub-plots. They were moved whenever either the current sub-plot had been grazed down to approximately 500 kg·DM·ha−1 or the next sub-plot in the sequence had reached approximately 2000 kg·DM·ha−1. Whenever the DM in the next sub-plot had not yet reached 2000 kg·ha−1, the lambs were grazed on lucerne off the experimental area. In this treatment, six weaner crossbred lambs that were being targeted to produce export quality lamb carcasses of 25 kg at a live weight of 49 kg, were used whenever a particular sub-plot was grazed.
The TR treatment sub-plots were rotationally grazed in a sequential manner by six weaner cross-bred lambs in a fixed time rotation averaging 17–18 days on each sub-plot and 35 days off each sub-plot.
During March to June 2000, the FR and TR treatments were grazed in sequential rotations (2 to 4 weeks on each sub-plot) by varying numbers of wethers. The wethers were moved onto a new sub-plot whenever its lucerne growth had reached approximately 1000 kg·DM·ha−1, visually assessed, and removed when it was grazed down to approximately 500 kg·DM·ha−1 (visually assessed). At other times, both the FR and TR treatment plots were opportunistically and simultaneously grazed with wether sheep to keep lucerne DM yields below or around 1000 kg·ha−1 and, thus, to prevent lucerne from flowering and to minimise leaf fall.
2.4. Measurements
2.4.1. Grazing Measurements
Grazing events were defined as periods of time when an area of a plot was stocked. In plots without sub-plots (CG and FG), these were periods when the whole plot was grazed. In plots with sub-plots (TR and FR), grazing events were defined separately on each sub-plot. If a rest period between two grazing events was less than a week the two grazing events plus the short break between them were considered to be in the same grazing event. These short breaks occurred for logistical reasons related to the management of animals.
In the CG and FG treatments, a plot value for the average number of grazing events on each area was simply the number of grazing events on that plot. In the TR and FR treatments, the number of grazing events on each area was calculated separately for each sub-plot and an average plot value calculated by averaging over the three sub-plots. Thus, a rotation over the three sub-plots increased the average number of grazing events by one unit and a combined grazing where all three sub-plots were grazed simultaneously also increased the average number of grazing events by one unit.
The length of a grazing event was calculated as the difference in the number of days between the start day and end day of each event.
2.4.2. Dry Matter Assessment during Grazing
Lucerne DM was assessed for each plot, whole plots for CG and FG and sub-plots for TR and FR, by either cutting quadrats which comprised 43% of assessments, or by calibrated visual estimation which comprised 57% of assessments, using 30 quadrats of 0.25 m × 0.25 m per area at the beginning and end of most grazing events. Calibrated visual assessment used the comparative yield method (Type 3) [20]. With the visually estimated areas, DM was assessed, on a scale of one to five in each of the 30 quadrats in an area. Dry matter was calibrated using 10 quadrats which covered the range of pasture masses at the site. Calibration quadrats were then cut and the herbage dried at 100 °C for 24 h to calculate DM available. For the assessments carried out entirely by cutting, the cut material was pooled on an area basis, before drying at 100 °C for 24 h to calculate DM for an area. Dry matter assessments were not available for the start, end or both the start and end of about one in every 15 grazing events.
On most occasions, DM was assessed on the start or end day of the grazing event, but on some occasions the assessment was made on a nearby day, for example, the day after. On occasions when there was a combined grazing of the three sub-plots in each plot of the TR and FR treatments, a single DM assessment was taken for the whole plot. In these cases, the DM value for the sub-plot area was deemed to be the whole plot value.
Dry matter at the start of grazing, DM at the end of grazing and DM removed, which was the difference between the start and end of grazing of each area, were calculated using those grazing events with DM assessments at the start, end or both start and end of the grazing period, respectively. Total DM removed during grazing events for each area, plots in CG and FG, and sub-plots in TR and FR, were calculated from the average removed of all grazing events with appropriate DM assessments, and then multiplied by the number of grazing events in that area.
2.4.3. Density
Lucerne density was assessed by counting plants in 30 quadrats (each 0.25 m−2) per area for plots in CG and FG and sub-plots in TR and FR, during autumn and spring over 2 years. Plants were not in a dense sward and were easily identified. In the summer of 2002, a final lucerne density count was undertaken comprising 10 quadrats (0.25 m−2) in each area.
3. Results
3.1. Rainfall
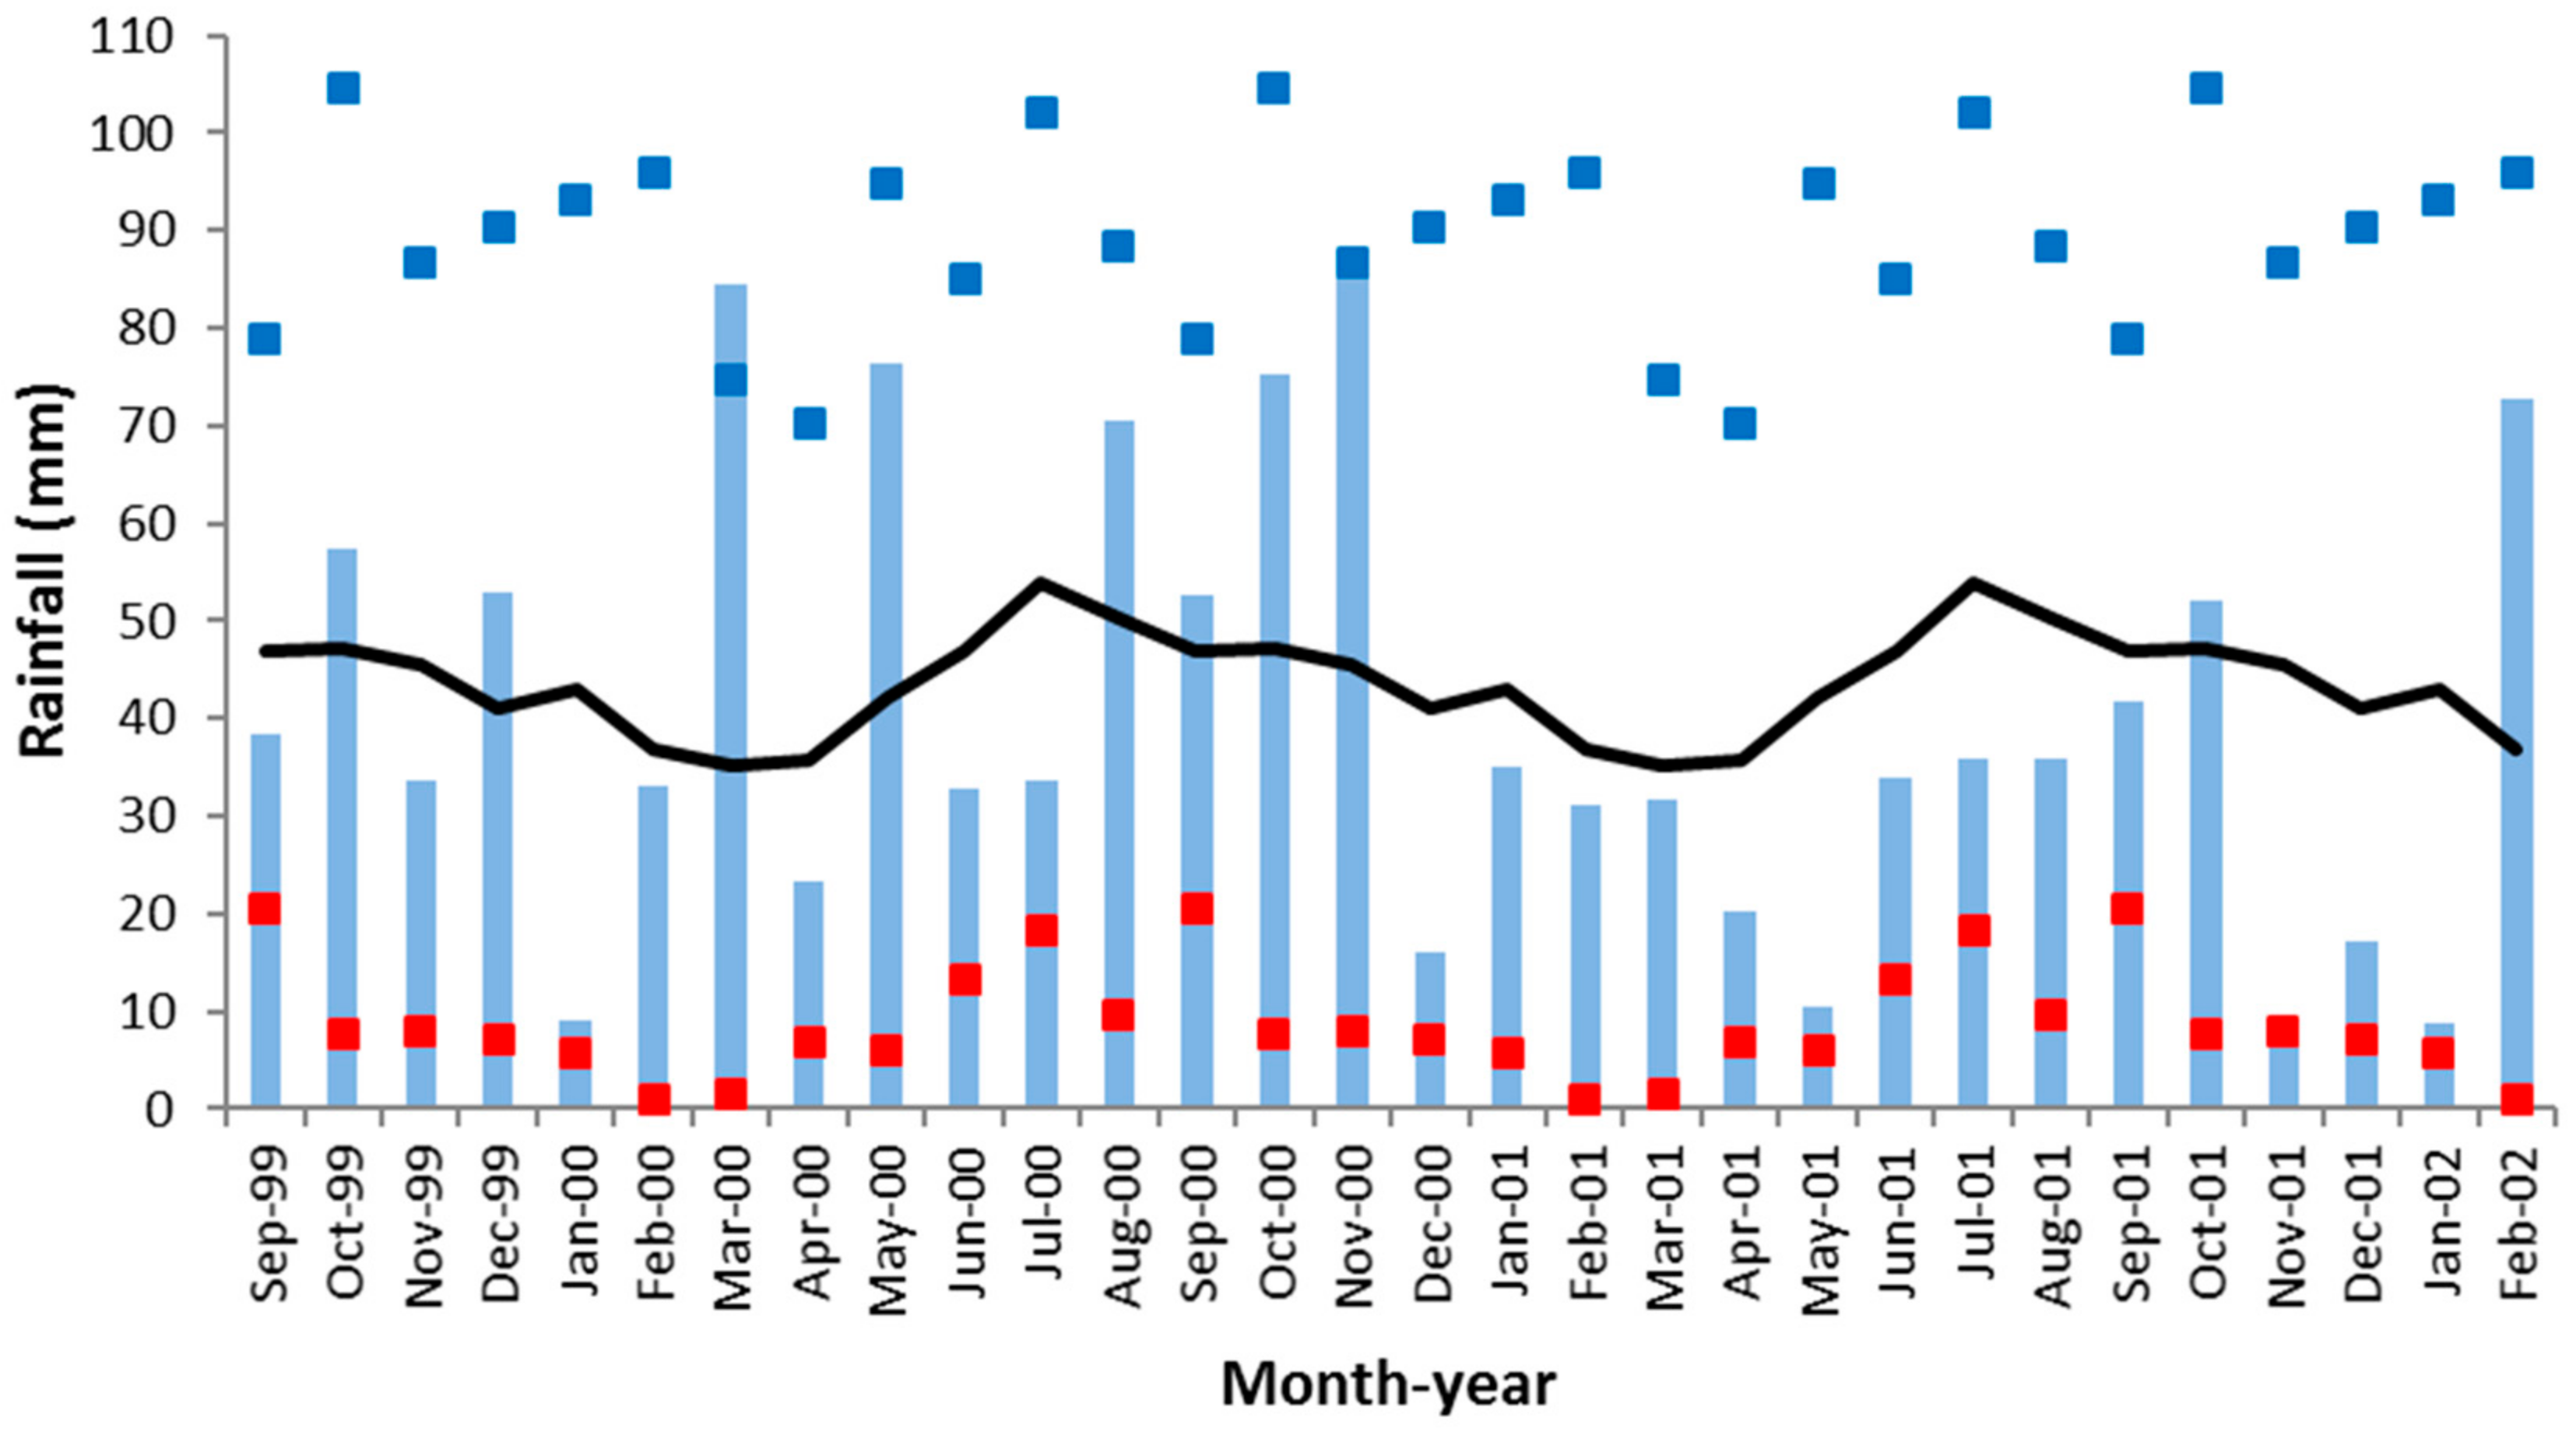
Throughout year one of the experiment, the monthly rainfall trend fluctuated around the long-term average, with a dry January (decile three) and wetter than average March (decile ten) and May (decile nine) (Figure 2). From August to November 2000, monthly rainfall was substantially greater (deciles seven–nine) than the long-term average. The period from December 2000 through to September 2001 was drier (deciles four–six) than average.
3.2. Grazing and Treatment
As the experiment was conducted on a sheep producer’s property there was a fixed number of animals available for implementation of the treatments throughout the experiment. While this number was sufficient for most of the experimental period, it was not possible to obtain more animals when lucerne growth was more than expected. It was also not possible to mechanically reduce the DM excess as each plot area had instrumentation installed. Thus, this report is a comparison of contrasting grazing management practices, each with substantial resting periods, rather than an evaluation of specific grazing management regimes. This and the next sub-section describe the differences in grazing management that actually occurred, including differences in DM removed during grazing and DM remaining after grazing.
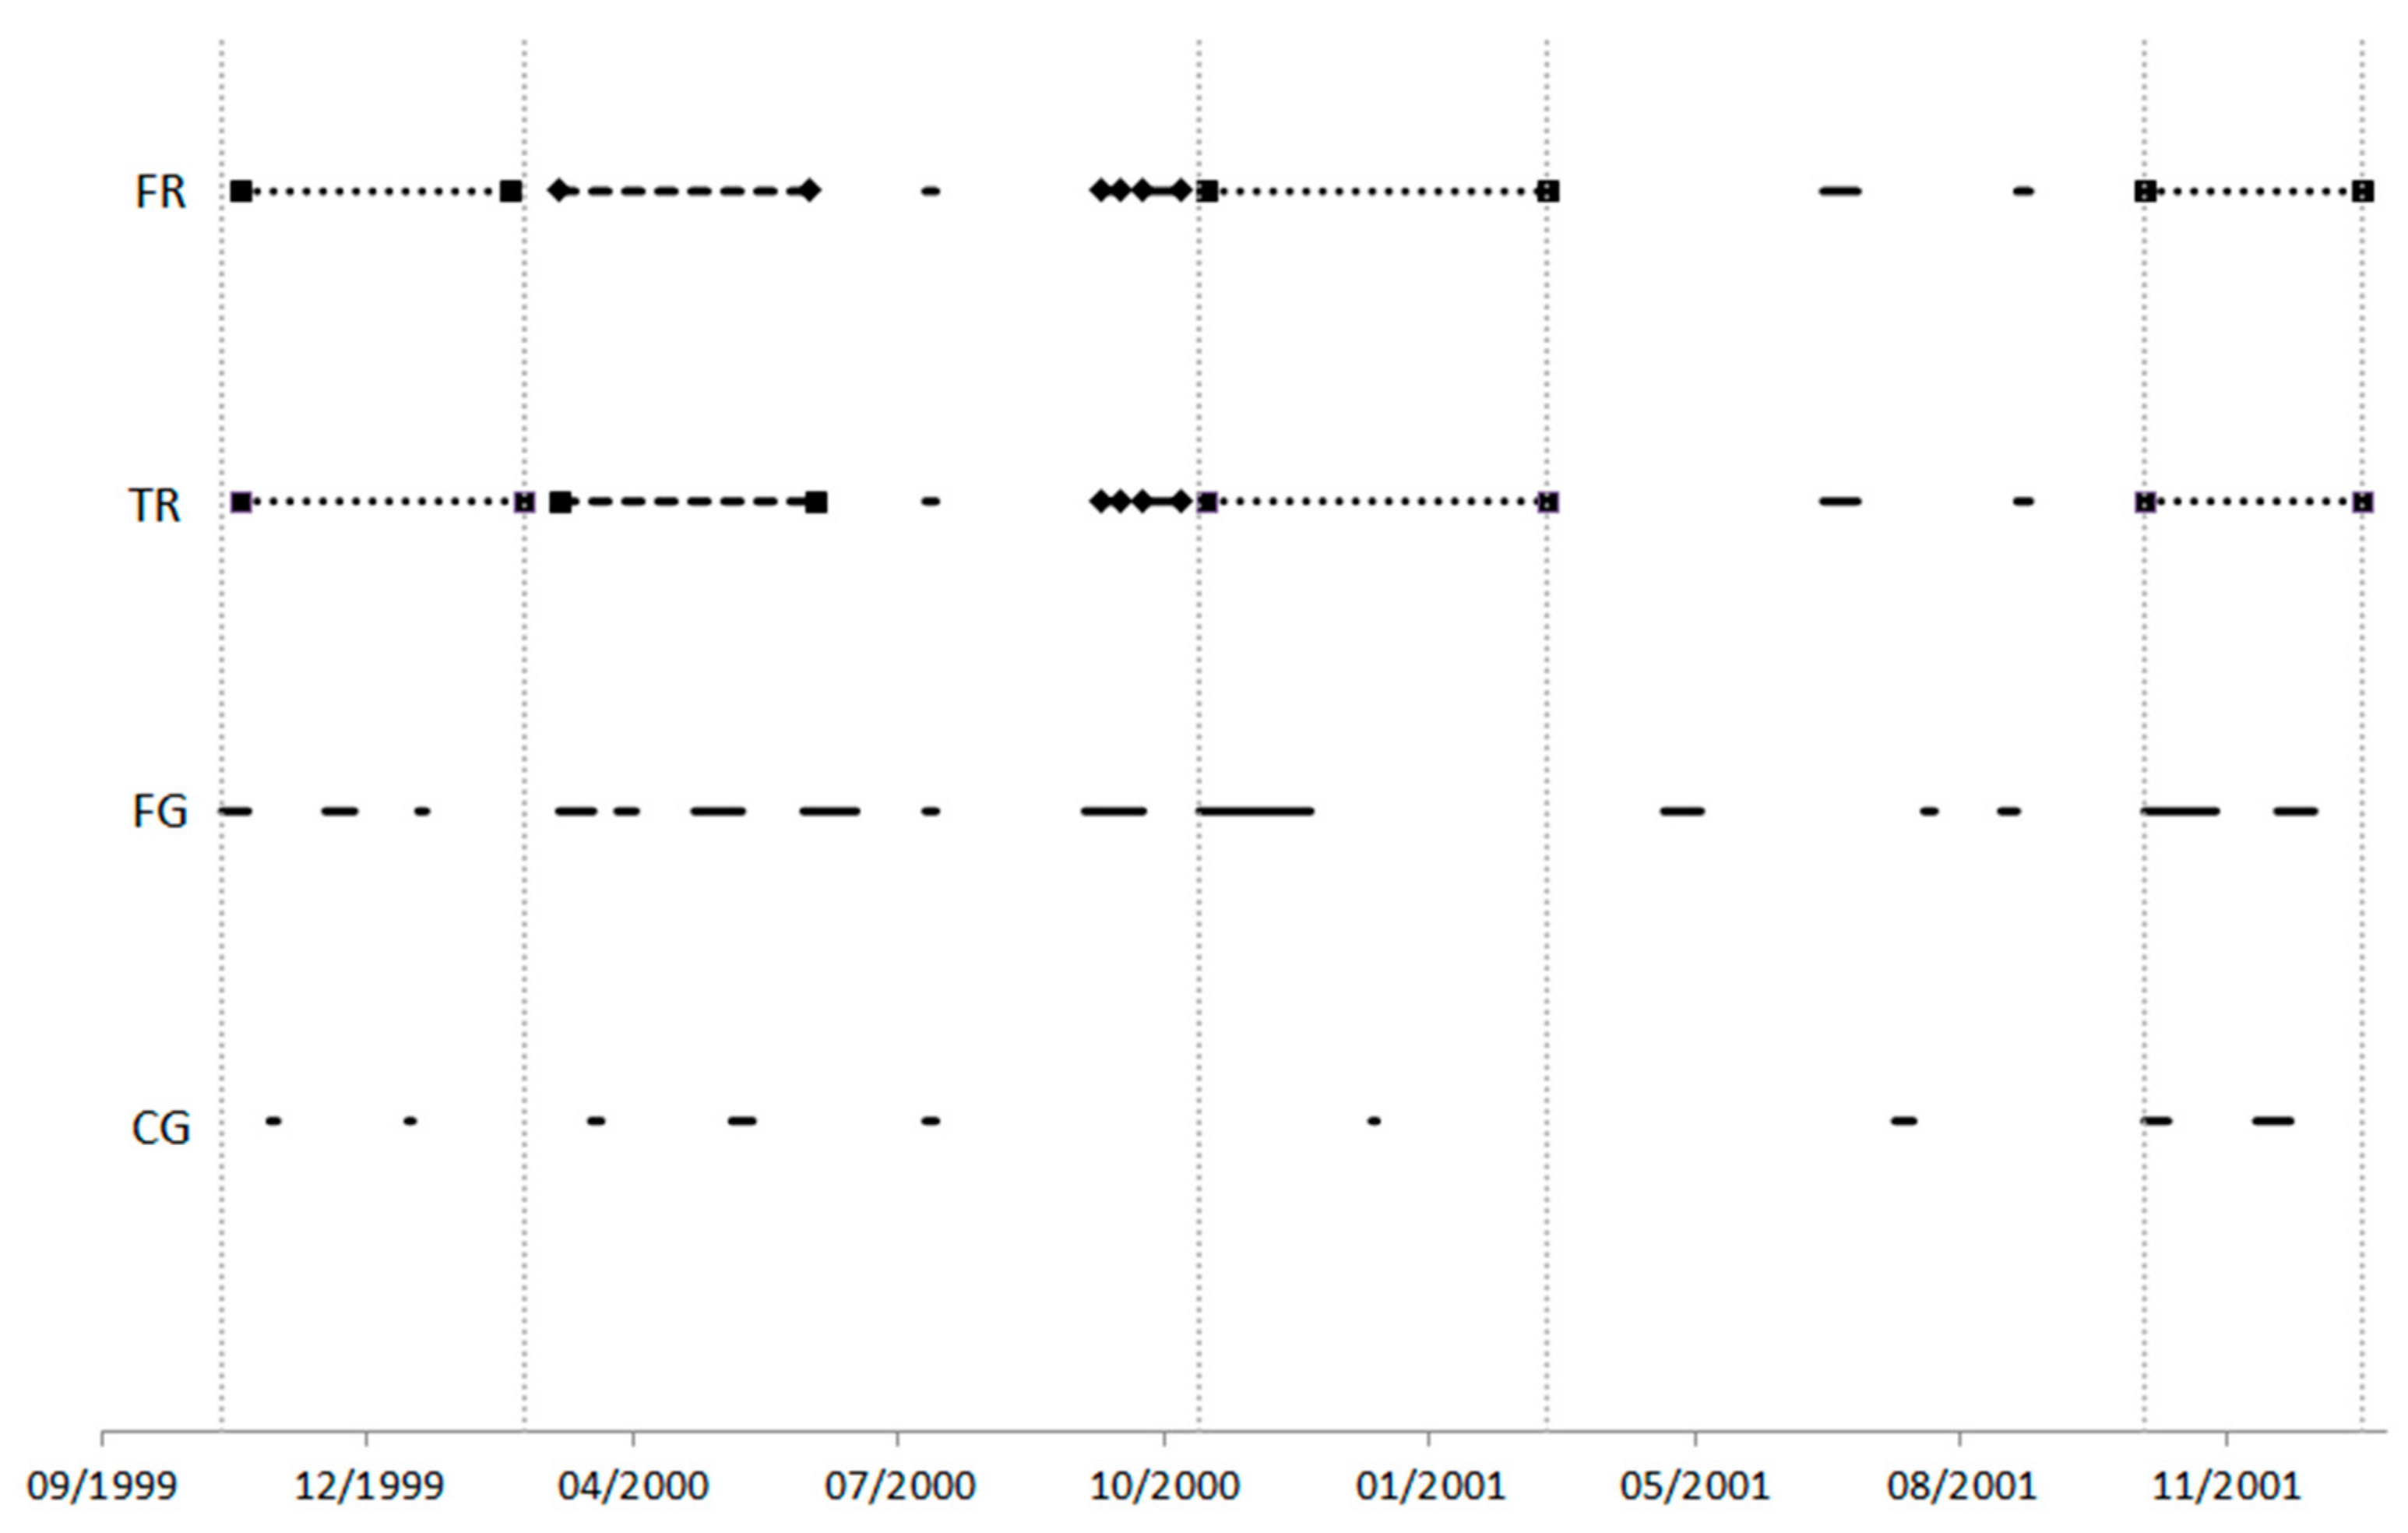
For the last 12 months of the study, there were fewer animals available for the CG treatment. On average over this period, grazing events were 9 days longer compared with the first 15 months of the experiment (Figure 1). In the FG plots, a long 42-day period of grazing, which included 4 days of rest corresponding to weaning, was required in November and December 2000 to counteract the large amount of lucerne growth associated with above-average rainfall in spring 2000. Also, during November and December 2000, up to 41 more lambs than the seven being rotated in a sub-plot were used in the FR and TR sub-plots.
The extra animals in the TR treatment during November and December 2000 gave rise to a continuous grazing period of one sub-plot of 30 days, although 5 days were ungrazed due to two separate gaps between changes of lambs in the sub-plot. This compares with the usual rotation on a sub-plot of 17–18 days. For the feed-based rotation (FR), the variation in the length of time lambs spent on each sub-plot was much greater. While the mean time was 17 days, the actual times varied from a minimum of 7 days to a maximum of 34 days, with a lower quartile of 12 days and an upper quartile of 22 days.
Overall, the total number of grazing events and the percentage of time sheep occupied the treatment plots were: FG (15 events, 27%), TR and FR (12 events and 22%) and CG (9 events, 6%) (Table 1). However, these patterns differ between when lambs were summer-grazing the lucerne and the other periods when other classes of sheep were grazing the lucerne. In particular, the differences between FG and the two rotational treatments (TR and FR) were primarily reflected in non-summer grazing periods.
3.3. Total Dry Matter on Offer and Dry Matter Disappearance during Grazing Events
Differences between treatments in total observed DM removed during grazing events can be considered as an indicator of differences in grazing intensity among treatments with regard to the pasture. Despite large apparent differences in the implementation of the grazing management regimes, the total observed DM removed during grazing events was not different for the four grazing treatments (Table 2). The CG treatment had greater DM removed overall, but this was associated with much shorter total grazing time of 5.8% compared with 21.9–26.5% for other treatments (Table 1), and thus there was less possibility for growth to bias the apparent removal.
Despite the similarity between treatments in total observed DM removed during grazing events, the more detailed DM data indicate that the “how and why” of this removal differed substantially between the four grazing management treatments. The observed DM removed was relatively more concentrated in the summer-grazing periods with weaner lambs in the FG and CG treatments (~60% of total usage), compared with the TR and FR treatments (~50% of total usage) (Table 2). The DM on offer at the end of grazing periods was much less in CG (250 kg·ha−1) than in the other grazing treatments (500–700 kg·ha−1) (Table 2). During the weaner lamb summer-grazing period, there were differences in DM at the end of grazing events for the three other treatments (FG ~ 500 kg·ha−1, FR ~ 650 kg·ha−1, TR ~ 800 kg·ha−1), although these differences did not occur in the non-summer periods (Table 2).
3.4. Lucerne Density
There were no differences in lucerne plant densities between any of the grazing management treatments, except in May 2001, when the crash-grazed treatment had fewer lucerne plants m−2 than the other three treatments (Table 3).
4. Discussion
It was hypothesised that plant persistence would be decreased by grazing regimes that deviated from the accepted grazing management practice of short stocking periods of days or weeks, followed by long recovery periods of about 7 weeks, most closely demonstrated by the time rotation treatment. Four treatments comprising grazing management practices that included substantial periods of rest from grazing for approximately 75% of the total time were tested. The crash grazing treatment differed from the time rotation by having short, intensive grazing less frequently than the time rotation. The frequent grazing treatment differed from the time rotation by having more frequent grazing when DM had reached 1000 kg·ha−1. The feed rotation differed from the time rotation through focusing on the lamb live weight growth targets whilst still managing the lucerne sward.
These differences in practice also resulted in systematic differences between regimes in the amount of DM at the beginning and end of each grazing. In particular, during the weaner summer-grazing periods, the CG, FG and FR had respectively, ~65%, ~35% and ~20% less DM than TR at the end of grazing. Thus, there were substantial differences between the four regimes in the extent of defoliation during the time of year when available water is likely to be more limiting, because of lower rainfall and higher evaporation. Thus, although the four treatments differed greatly in strategy, total time of grazing, number of grazing events, amounts of lucerne pasture present at beginning and end of grazing events, as well as the DM removed for each grazing event and the relative seasonality of each of these components, the density of the lucerne sward remained mostly stable.
Over the 27 months of the experiment, which included three summers, the number of lucerne plants only declined by about 13% from 24 to 21 plants m−2. Factors that affect lucerne persistence include the interaction between soil moisture and grazing, the timing of grazing in relation to lucerne physiology and the grazing management system used [16]. When the CG treatment is examined closely with the timing of rainfall, the grazing periods occurred at times that placed relatively low pressure on the lucerne plants in terms of soil moisture from sufficient rainfall. Along with the non-grazing periods, this may have contributed to persistence of this treatment. The FR and TR treatments, and by default the FG treatment, were grazed with the objective of preventing flowering and leaf fall, so in effect to keep the lucerne in a vegetative stage, so as to optimise forage quality. The combination of this strategy with sufficient non-grazing time would have contributed to lucerne persistence in these treatments.
Lucerne persistence can also be affected by the specific cultivar used and how it is managed. The cultivar Aquarius is a highly winter-active cultivar designed for high rainfall or irrigation districts, but it has also shown greater-than-average DM yields and persistence in dryland experiments at Yanco NSW [22]. Research conducted in NSW [16] (W.J. McDonald unpublished data) indicated that prolonged periods of heavy grazing by sheep, as well as continuous grazing, can lead to faster declines in the densities of winter-active lucerne cultivars. Implementation of the treatments over the course of the experiment to retain a base level of DM between 500 and 1000 kg·ha−1 would have ensured that this cultivar was not over grazed, and therefore plant numbers only declined marginally.
Previous research has suggested that there are patterns of lucerne decline with continuous decline usually resulting from continuous grazing, and step-like decline resulting from the influence of drought or insect/disease pressure [16]. Whilst the sward remained mostly stable, both a continuous and a step-like decline in plant density over the course of the experiment could be observed. The first summer period resulted in a step-like decline in plant density which then stabilised across all treatments, but by the end of the experiment plant density had declined from the starting density but with no differences between treatments. In phased systems with annual crops, the persistence of lucerne beyond 3 years may not be as important to the farming system as a whole, in comparison with permanent pasture systems, as the lucerne stands are replaced with crops every 3 to 4 years. However, maintaining adequate plant numbers for 3 to 4 years is desirable to achieve optimum quantity and quality forage for livestock. The grazing management treatments utilised in this experiment demonstrated that adequate plant numbers for forage production could be sustained for at least 3 years. This is a positive result for the farming system as it allows flexibility in the grazing management system between cropping phases.
While the length of the rest period is one of the most important factors for the persistence of lucerne [11], the length and intensity of the grazing period can also affect lucerne density and persistence [23,24]. It would appear from the data reported that all treatments had sufficient rest periods for 75% of the total time, which ensured minimal losses of plant density and enhanced persistence. The TR (time rotation) treatment most closely resembled current recommended practice [25,26] for grazing management of lucerne but this treatment did not result in better persistence. The CG treatment was most like the recommended practice in New Zealand for lucerne persistence, where totally destocking lucerne from late December until mid-February to allow root reserves to replenish is recommended [27].
The total observed DM removed during grazing events was similar between the four treatments being close to identical for FR, TR and FG. The total observed removal underestimates the pasture consumed because it does not consider any pasture growth during the grazing event. However, it is still a reasonable indicator for comparing the total amount of pasture removed between treatments, provided the total percentage of time each area grazed is similar. This is the case for FR, TR and FG, which all have between 22% and 27% of total available days grazed. Although not statistically significant (p > 0.1, using a protected least significant difference), the total DM removed was about 15% greater in the CG treatment than the other three treatments. However, when comparing CG with the other three treatments, this needs to be tempered with the much smaller total percentage of time CG was subjected to grazing (6%). This implies less under-estimation of pasture removal in the CG treatment. The overall conclusion is that the defoliation of the lucerne is likely to be quite similar between the four treatments. Thus, there were four treatments, all with significant periods of rest that were empirically different in their approach but resulted in similar grazing pressures, in terms of pasture removed.
5. Conclusions
Previous studies have shown that lucerne, except when grazed at light stocking rates, needs rotational grazing management. This study provides some evidence that substantially different rotational (with <25% of total time grazed) grazing management practices of lucerne pasture, but with similar total grazing pressure with regard to the pasture, can be equally stable in terms of plant density. It can be concluded that there is flexibility in the rotational management of grazed lucerne provided adequate rest periods are part of the management program.
Author Contributions
J.R.H. conceived the research, designed and conducted the field experiment; K.L.B. analysed the data; V.F.B. and K.L.B. wrote the manuscript; K.L.B., V.F.B., J.R.H., M.L.M., S.G.C., Z.N.N. reviewed and edited the manuscript.
Funding
The authors acknowledge funding for this research from the Victorian Department of Economic Development, Jobs, Transport and Resources (DEDJTR), formerly Department of Primary Industries, Agriculture and Food Initiative and the Grains Research and Development Corporation, project number, DAV 399.
Acknowledgments
The authors acknowledge the support of the landholder, Merrick Kingston, on whose farm the research was conducted. Technical assistance with pasture and livestock monitoring and measurement was provided by Ken Wilson, Tim Enshaw and John Dillon. The authors also wish to acknowledge input from scientific and technical staff at DEDJTR Rutherglen and the farmer consultative committee associated with the project.
Conflicts of Interest
The authors declare no conflict of interest.
References
- Bouton, J.H. Breeding lucerne for persistence. Crop Pasture Sci. 2012, 63, 95–106. [Google Scholar] [Green Version]
- Irwin, J.A.G.; Armour, D.J.; Pepper, P.M.; Lowe, K.F. Lucerne biology and genetic improvement: An analysis of past activities and future goals in Australia. Aust. J. Agric. Res. 2001, 52, 699–712. [Google Scholar] [CrossRef]
- Russelle, M. Alfalfa: After an 8000 year journey, the “Queen of Forages” stands poised to enjoy renewed popularity. Am. Sci. 2001, 89, 252–261. [Google Scholar] [CrossRef]
- Radovic, J.; Sokolovic, D.; Markovic, J. Alfalfa—Most important perennial forage legume in animal husbandry. Biotechnol. Anim. Husb. 2009, 25, 465–475. [Google Scholar] [CrossRef]
- Bouton, J.H. Alfalfa. In Proceedings of the XIX International Grassland Congress; Gomide, J.A., Mattos, W.R.S., d’Silva, S.C., Eds.; Brazilian Society of Animal Husbandry: Sao Pedro, Brazil, 2001; pp. 545–547. [Google Scholar]
- Humphries, A.W.; Auricht, G.C.; Hughes, S.J.; Latta, R.A. Exploring lucerne germplasm diversity for Southern Cropping Systems. In Science and Technology: Delivering Results for Agriculture? Proceedings of the 10th Australian Agronomy Conference, Hobart, Australia, 28 January–1 February 2001; Rowe, B., Donaghy, D., Mendham, N., Eds.; The Australian Society of Agronomy Inc.: Hobart, Australia, 2001; Available online: http://www.regional.org.au/au/asa/2001/6/a/humphries1.htm?print=1 (accessed on 17 July 2018).
- Humphries, A.W.; Kobelt, E.T.; Bellotti, W.D.; Auricht, G.C. Tolerance of Australian lucerne (Medicago sativa) to grazing by sheep. Aust. J. Exp. Agric. 2006, 46, 1263–1270. [Google Scholar] [CrossRef]
- Humphries, A.W.; Hughes, S.J. Preliminary evaluation of diverse lucerne (Medicago sativa sspp.) germplasm to identify new material for livestock and cropping based farming systems in Australia. Aust. J. Agric. Res. 2006, 57, 1297–1306. [Google Scholar] [CrossRef]
- Nie, Z.N.; McLean, T.; Clough, A.; Tocker, J.; Christy, B.; Harris, R.; Riffkin, P.; Clark, S.; McCaskill, M. Benefits, challenges and opportunities of integrated crop-livestock systems and their potential application in the high rainfall zone of southern Australia: A Review. Agric. Ecosyst. Environ. 2016, 235, 17–31. [Google Scholar] [CrossRef]
- Nichols, P.G.H.; Revell, C.K.; Humphries, A.W.; Howie, J.H.; Hall, E.J.; Sandral, G.A.; Ghamkhar, K.; Harris, C.A. Temperate pasture legumes in Australia—Their history, current use, and future prospects. Crop Pasture Sci. 2012, 63, 691–725. [Google Scholar] [CrossRef]
- McKinney, G.T. Management of lucerne for sheep grazing on the Southern Tablelands of New South Wales. Aust. J. Exp. Agric. Anim. Husb. 1974, 14, 726–734. [Google Scholar] [CrossRef]
- Bélanger, G.; Kunelius, T.; McKenzie, D.; Papadopoulos, Y.; Thomas, B.; McRae, K.; Fillmore, S.; Christie, B. Fall cutting management affects yield and persistence of alfalfa in Atlantic Canada. Can. J. Plant Sci. 1999, 79, 57–63. [Google Scholar] [CrossRef] [Green Version]
- Leach, G.J. Lucerne survival in south east Queensland in relation to grazing management systems. Aust. J. Exp. Agric. Anim. Husb. 1979, 19, 208–215. [Google Scholar] [CrossRef]
- Teixeira, E.I.; Moot, D.J.; Brown, H.E. Defoliation frequency and season affected radiation use efficiency and dry matter partitioning to roots of lucerne (Medicago sativa L.) crops. Eur. J. Agron. 2008, 28, 103–111. [Google Scholar] [CrossRef]
- Pembleton, K.G.; Cunningham, S.M.; Volenec, J.J. Effects of summer irrigation on seasonal changes in taproot reserves and the expression of winter dormancy/activity in four contrasting lucerne cultivars. Crop Pasture Sci. 2010, 61, 873–884. [Google Scholar] [CrossRef]
- Lodge, G.M. Management practices and other factors contributing to the decline in persistence of grazed lucerne in temperate Australia: A review. Aust. J. Exp. Agric. 1991, 31, 713–724. [Google Scholar] [CrossRef]
- Hirth, J.R.; Wilson, K.F.; Enshaw, T.M. Using dryland lucerne to finish out-of-season prime lambs. Available online: http://www.publish.csiro.au/sa/pdf/SA0401102 (accessed on 17 July 2018).
- Isbell, R.F. The Australian Soil Classification; CSIRO Publishing: Melbourne, Australia, 1996; p. 28. [Google Scholar]
- SILO Patched Point Data, Department of Science, Information Technology and Innovation (DSITI), Queensland Government. Available online: https://silo.longpaddock.qld.gov.au/ (accessed on 17 July 2018).
- Haydock, K.P.; Shaw, N.H. The comparative yield method for estimating dry matter yield of pasture. Aust. J. Exp. Agric. Anim. Husb. 1975, 15, 663–670. [Google Scholar]
- Jeffrey, S.J.; Carter, J.O.; Moodie, K.B.; Beswick, A.R. Using spatial interpolation to construct a comprehensive archive of Australian climate data. Environ. Model. Softw. 2001, 16, 309–330. [Google Scholar] [CrossRef]
- Waterhouse, D.B.; Williams, R.W. Register of Australian Herbage Plant Cultivars, B. Legumes, 8. Lucerne, (a) Medicago sativa L. (lucerne) cv. Aquarius. Aust. J. Exp. Agric. 1993, 33, 257–258. [Google Scholar] [CrossRef]
- Southwood, O.R.; Robards, G.E. Lucerne persistence and the productivity of ewes and lambs grazed at two stocking rates within different management systems. Aust. J. Exp. Agric. Anim. Husb. 1975, 15, 747–752. [Google Scholar] [CrossRef]
- Thompson, J.A.; Sheridan, K.P.; Hamilton, B.A. The effects of rates of stocking with rotational grazing on the productivity of dryland lucerne at Tamworth, New South Wales. Aust. J. Exp. Agric. Anim. Husb. 1976, 16, 845–853. [Google Scholar] [CrossRef]
- Naji, R. Managing Dryland Lucerne—Grower’s Handbook; Department of Primary Industries: Horsham, UK, 2005; pp. 18–19.
- Williams, R. Grazing by Numbers Makes Lucerne Last. Available online: http://grasslandnsw.com.au/news/wp-content/uploads/2011/09/Williams-1996.pdf (accessed on 17 July 2018).
- Moot, D.J.; Smith, M. Practical Lucerne Management Guide. 2011. Available online: http://www.lincoln.ac.nz/PageFiles/23598/Lucerne-management-guide-Col.pdf (accessed on 17 July 2018).
Figure 1.
Grazing regimen of the crash grazing (CG), frequent grazing (FG), time (TR) and feed-based (FR) rotations. Set stocked or simultaneous grazing on each sub-plot of a plot is represented as (———), rotational grazing of weaner lambs is represented as (▪……▪), rotational grazing of other stock (♦———♦) and grazing of some sub-plots in non-rotational manner (♦— — — ♦). The vertical guidelines indicate the start and end of the rotational grazing by weaner lambs. In some cases, due to differences in pasture availability between plots or due to differences in availability of animals, especially for the CG treatment, grazing dates between the four replicate plots in any grazing treatment may have differed by up to 1–2 weeks. In these cases, the plotted start and end dates for grazing are calculated as the median over the four replicate plots.

Figure 2.
Monthly rainfall in mm (blue bars) from September 1999 to February 2002 for the experimental site, with long-term average rainfall 1970–2015 in mm (black line). Rainfall decile nine (blue squares) and rainfall decile one (red squares) indicate range. Rainfall deciles calculated as described in Reference [21].


Table 1.
Grazing characteristics of each area of a plot †.
| Grazing Characteristics | Crash Grazing (CG) | Time Rotation (TR) | Feed Rotation (FR) | Frequent Grazing (FG) | SED |
|---|---|---|---|---|---|
| Average number of grazing episodes on each area | |||||
| Overall (806 days) | 9.0 | 11.9 | 12.5 | 15.0 | 0.08 |
| Weaner summer-grazing periods (327 days) | 5.0 | 6.0 | 6.5 | 6.0 | 0.07 |
| Non-summer grazing periods (479 days) | 4.0 | 5.9 | 6.0 | 9.0 | 0.06 |
| Percentage of days each area is within a grazing episode | |||||
| Overall (% of 806 days) | 5.8 | 22.3 | 21.9 | 26.5 | 0.19 |
| Weaner summer-grazing periods (% of 327 days) | 7.7 | 33.5 | 34.1 | 32.7 | 0.33 |
| Non-summer grazing periods (% of 479 days) | 4.5 | 14.7 | 13.6 | 22.2 | 0.32 |
† In the Time Rotation (TR) and Feed Rotation (FR) treatments each plot value is the average of the three sub-plots in the plot. The standard error of difference (SED) is obtained from a randomised block analysis of variance on plot values, and is used as an indicator of the small differences in grazing outcomes between plots of the same treatment.
Table 2.
Effect of grazing treatments on observed dry matter (DM) usage during grazing events †.
| DM Usage | Crash Grazing (CG) | Time Rotation (TR) | Feed Rotation (FR) | Frequent Grazing (FG) | SED | p Values |
|---|---|---|---|---|---|---|
| Total observed dry matter usage during grazing events (kg ha−1) | ||||||
| Overall | 8000 | 6900 | 6800 | 6900 | 480 | 1.1 × 10⁻¹ |
| Weaner summer-grazing periods | 5100 | 3300 | 3700 | 4400 | 250 | 2.4 × 10⁻⁴ |
| Non-summer grazing periods | 2700 | 3600 | 3100 | 2600 | 310 | 3.6 × 10⁻² |
| Average dry matter on offer at start of each grazing event (kg ha−1) | ||||||
| Overall | 1090 | 1260 | 1180 | 990 | 63 | 1.2 × 10⁻² |
| Weaner summer-grazing periods | 1200 | 1360 | 1290 | 1240 | 73 | 2.0 × 10⁻¹ |
| Non-summer grazing periods | 900 | 1170 | 1080 | 830 | 64 | 1.6 × 10⁻³ |
| Average dry matter on offer at end of each grazing event (kg ha−1) | ||||||
| Overall | 250 | 680 | 600 | 530 | 34 | 2.6 × 10⁻⁶ |
| Weaner summer-grazing periods | 290 | 800 | 650 | 510 | 48 | 1.4 × 10⁻⁵ |
| Non-summer grazing periods | 190 | 560 | 550 | 540 | 26 | 3.7 × 10⁻⁷ |
| Average dry matter usage of each grazing event (kg ha−1) | ||||||
| Overall | 880 | 580 | 600 | 460 | 51 | 1.1 × 10⁻⁴ |
| Weaner summer-grazing periods | 1020 | 570 | 590 | 730 | 47 | 1.7 × 10⁻⁵ |
| Non-summer grazing periods | 670 | 610 | 520 | 290 | 55 | 3.1 × 10⁻⁴ |
† Grazing events are defined for an area of each plot. Thus, in the FR and TR treatments, grazing events are defined separately for each of the three sub-plot areas and then averaged. In the table, the average dry matter usage values do not always correspond exactly to the differences between the DM before and after grazing due to missing before and after grazing DM data. All analyses have nine residual degrees of freedom.
Table 3.
Effect of grazing management regime on lucerne plant density. All analyses have nine residual degrees of freedom.
Table 3.
Effect of grazing management regime on lucerne plant density. All analyses have nine residual degrees of freedom.
| Density (Plants m−2) | Crash Grazing (CG) | Time Rotation (TR) | Feed Rotation (FR) | Frequent Grazing (FG) | SED | p Values |
|---|---|---|---|---|---|---|
| Nov 1999 | 21 | 27 | 23 | 24 | 2.2 | 0.11 |
| Mar 2000 | 19 | 22 | 22 | 22 | 1.5 | 0.16 |
| Nov 2000 | 20 | 20 | 21 | 20 | 1.6 | 0.85 |
| May 2001 | 18 | 23 | 23 | 23 | 1.7 | 0.04 |
| Jan 2002 | 18 | 22 | 21 | 21 | 1.8 | 0.24 |
© 2018 by the authors. Licensee MDPI, Basel, Switzerland. This article is an open access article distributed under the terms and conditions of the Creative Commons Attribution (CC BY) license (http://creativecommons.org/licenses/by/4.0/).
Share and Cite
MDPI and ACS Style
Burnett, V.F.; Hirth, J.R.; Butler, K.L.; Mitchell, M.L.; Clark, S.G.; Nie, Z. Sensitivity of Winter-Active Lucerne (Medicago sativa L.) to Different Grazing Regimes. Agronomy 2018, 8, 124. https://doi.org/10.3390/agronomy8070124
AMA Style
Burnett VF, Hirth JR, Butler KL, Mitchell ML, Clark SG, Nie Z. Sensitivity of Winter-Active Lucerne (Medicago sativa L.) to Different Grazing Regimes. Agronomy. 2018; 8(7):124. https://doi.org/10.3390/agronomy8070124
Chicago/Turabian StyleBurnett, Vivianne F., Jeff R. Hirth, Kym L. Butler, Meredith L. Mitchell, Steve G. Clark, and Zhongnan Nie. 2018. "Sensitivity of Winter-Active Lucerne (Medicago sativa L.) to Different Grazing Regimes" Agronomy 8, no. 7: 124. https://doi.org/10.3390/agronomy8070124
Note that from the first issue of 2016, this journal uses article numbers instead of page numbers. See further details here.