Carbon Footprint Constrained Profit Maximization of Table Grapes Cold Chain


1
College of Engineering, China Agricultural University, Beijing 100083, China
2
Beijing Laboratory of Food Quality and Safety, Beijing 100083, China
3
National Engineering and Technology Research Center for Preservation of Agricultural Products, Tianjin 300384, China
*
Author to whom correspondence should be addressed.
Agronomy 2018, 8(7), 125; https://doi.org/10.3390/agronomy8070125
Submission received: 14 June 2018
/
Revised: 18 July 2018
/
Accepted: 18 July 2018
/
Published: 20 July 2018
Abstract
:Low-carbon production is one of the dominating issues in the sustainable development of the food industry with high energy consumption, especially in the table grapes cold chain. The aim of this paper is to propose a profit maximization strategy of table grapes cold chain by integrating the carbon footprint to improve the low-carbon production and sustainability of the cold chain system. The carbon footprint was evaluated by life cycle assessment (LCA) in entire cold chain system of table grapes, and the economic order quantity (EOQ) model was used to develop the profit maximization model with minimal carbon footprint and to maintain the optimal balance between stock and cost. The profit optimization performance, the sensitivity performance and the influencing factors of the decay rate, the carbon emission price, and the distance and carbon emission coefficient in refrigerated transport were analyzed according to the profit maximization model and the inventory data in actual cold chain investigated. The sensitivity performance analysis illustrated that the selling price had the highest sensitivity, and the carbon emission coefficient in storage had the lowest sensitivity. The comprehensive analysis results indicated that there is an optimal combination point between the economy and environment in actual cold chain, which not only reduced the carbon emission, but also had minimal impact on the profit in cold chain. The enterprises should integrate the carbon footprint cost into the profit maximization once the carbon emission tax is levied. The proposed strategy of the profit maximization with carbon footprint constraint is also suitable for improving profit maximization of other low-carbon supply chain applications.
1. Introduction
Low-carbon production is one of the dominating issues in the sustainable development of the food industry with high energy consumption [1,2,3], especially in the table grapes cold chain. Low-carbon production is a green and sustainable development mode with lower greenhouse gas (GHG) emissions for the cold chain [4,5,6]. The table grapes cold chain is a special system that enables table grapes to always be stored at a prescribed low temperature to reduce the loss of table grapes and ensure their quality and safety [7,8,9]. The major GHG emitted in cold chain systems is carbon dioxide [10,11,12], and the carbon footprint, which is the total amount of carbon dioxide and other greenhouse gases emitted by a product or service throughout the life cycle, provides an easy way for the carbon dioxide emission evaluation [13,14,15].
To achieve the low-carbon development in cold chain system, the carbon tax, which is levied on carbon dioxide emission, has been implemented in many countries such as Norway, Sweden, United Kingdom, Finland and Germany [16,17,18]. The carbon tax also has high possibility to be implemented for the future low-carbon development in China [19,20]. However, the economic cost of the cold chain enterprise would be increased and the profit would be reduced once the carbon tax was implemented. The carbon footprint evaluation is challenging in complex cold chain systems such as for table grapes [8,16]. It is urgent and necessary to integrate carbon footprint into the profit maximization of table grapes cold chain to adapt to the demand of decreasing the carbon footprint and increasing environmental sustainability of the food industry.
Life cycle assessment (LCA), which is an effective evaluation method for assessing the environmental aspects associated with a product or process throughout the entire life cycle, provides a systematic and synthetic means to evaluate the carbon footprint [21,22,23]. LCA applications in food supply chain have been studied. Pattara et al. [24] analyzed the carbon footprint of the wine supply chain via using the LCA. Del et al. [25] evaluated the sustainability and carbon footprint of the tomato products supply chain by adopting the LCA. Singh et al. [26] measured the carbon footprint in the beef supply chain by employing the LCA method. Vagnon et al. [27] carried out LCA to improve the knowledge and understanding of the environmental implications and carbon footprint of sheep milk cheese chain in Sardinia (Italy). Willersinn et al. [28] assessed the environmental impacts and carbon footprint of the potato loss in the entire potato supply chain in Switzerland using the LCA approach. The carbon footprint could be evaluated by adopting the LCA method in the entire table grapes cold chain [29].
Economic order quantity (EOQ), which is a model that maintains the optimal balance between stock and order cost by monitoring the relationship between stock status and order quantity [30], could provide an effective method to evaluate the general profit of perishable food in cold chain according to the variation of the stock status [31]. For example, Bozorgi et al. [32] proposed a new inventory model based on the EOQ to determine the optimal order quantity by considering both cost and emission functions in food cold chain system. Lan et al. [33] analyzed the food cold chain equilibrium based on EOQ collaborative replenishment inventory model with the numeric example to identify the applicability of the model. Bazan et al. [11] presented the inventory model with the EOQ through considering the carbon dioxide emissions from the production phase to transportation in the food cold supply chain with the numerical examples provided. Hariga et al. [34] assessed the optimization of the transportation order amount by integrating EOQ inventory model under carbon tax constraint to determine the optimal lot sizing and shipping quantities. Table grapes are always in continuous decay in the cold chain stock system. The EOQ model could also be applied to evaluate the profit of perishable table grapes in cold chain.
This study contributes to propose the profit maximization strategy of table grapes cold chain by integrating with the carbon footprint to improve the low-carbon production and sustainability of the cold chain system. The aim of the study was to evaluate the carbon footprint by LCA in entire cold chain system of table grapes and to use the EOQ model to develop the profit maximization model with carbon footprint constraint to maintain the optimal balance between the stock and cost. The profit optimization performance, the sensitivity performance and the different influencing factors were analyzed according to the profit maximization model with carbon footprint constraint, and the inventory data in cold chain investigated. The strategy of the profit maximization with carbon footprint constraint allowed identifying an optimal combination point between the economy and environment in table grapes cold chain, and to improve the sustainability of the system.
2. Materials and Methods
This study describes the system boundary definition and functional units, the assumptions, the profit maximization model with carbon footprint constraint, and the inventory analysis of the actual cold chain investigated.
2.1. System Boundary Definition and Functional Units
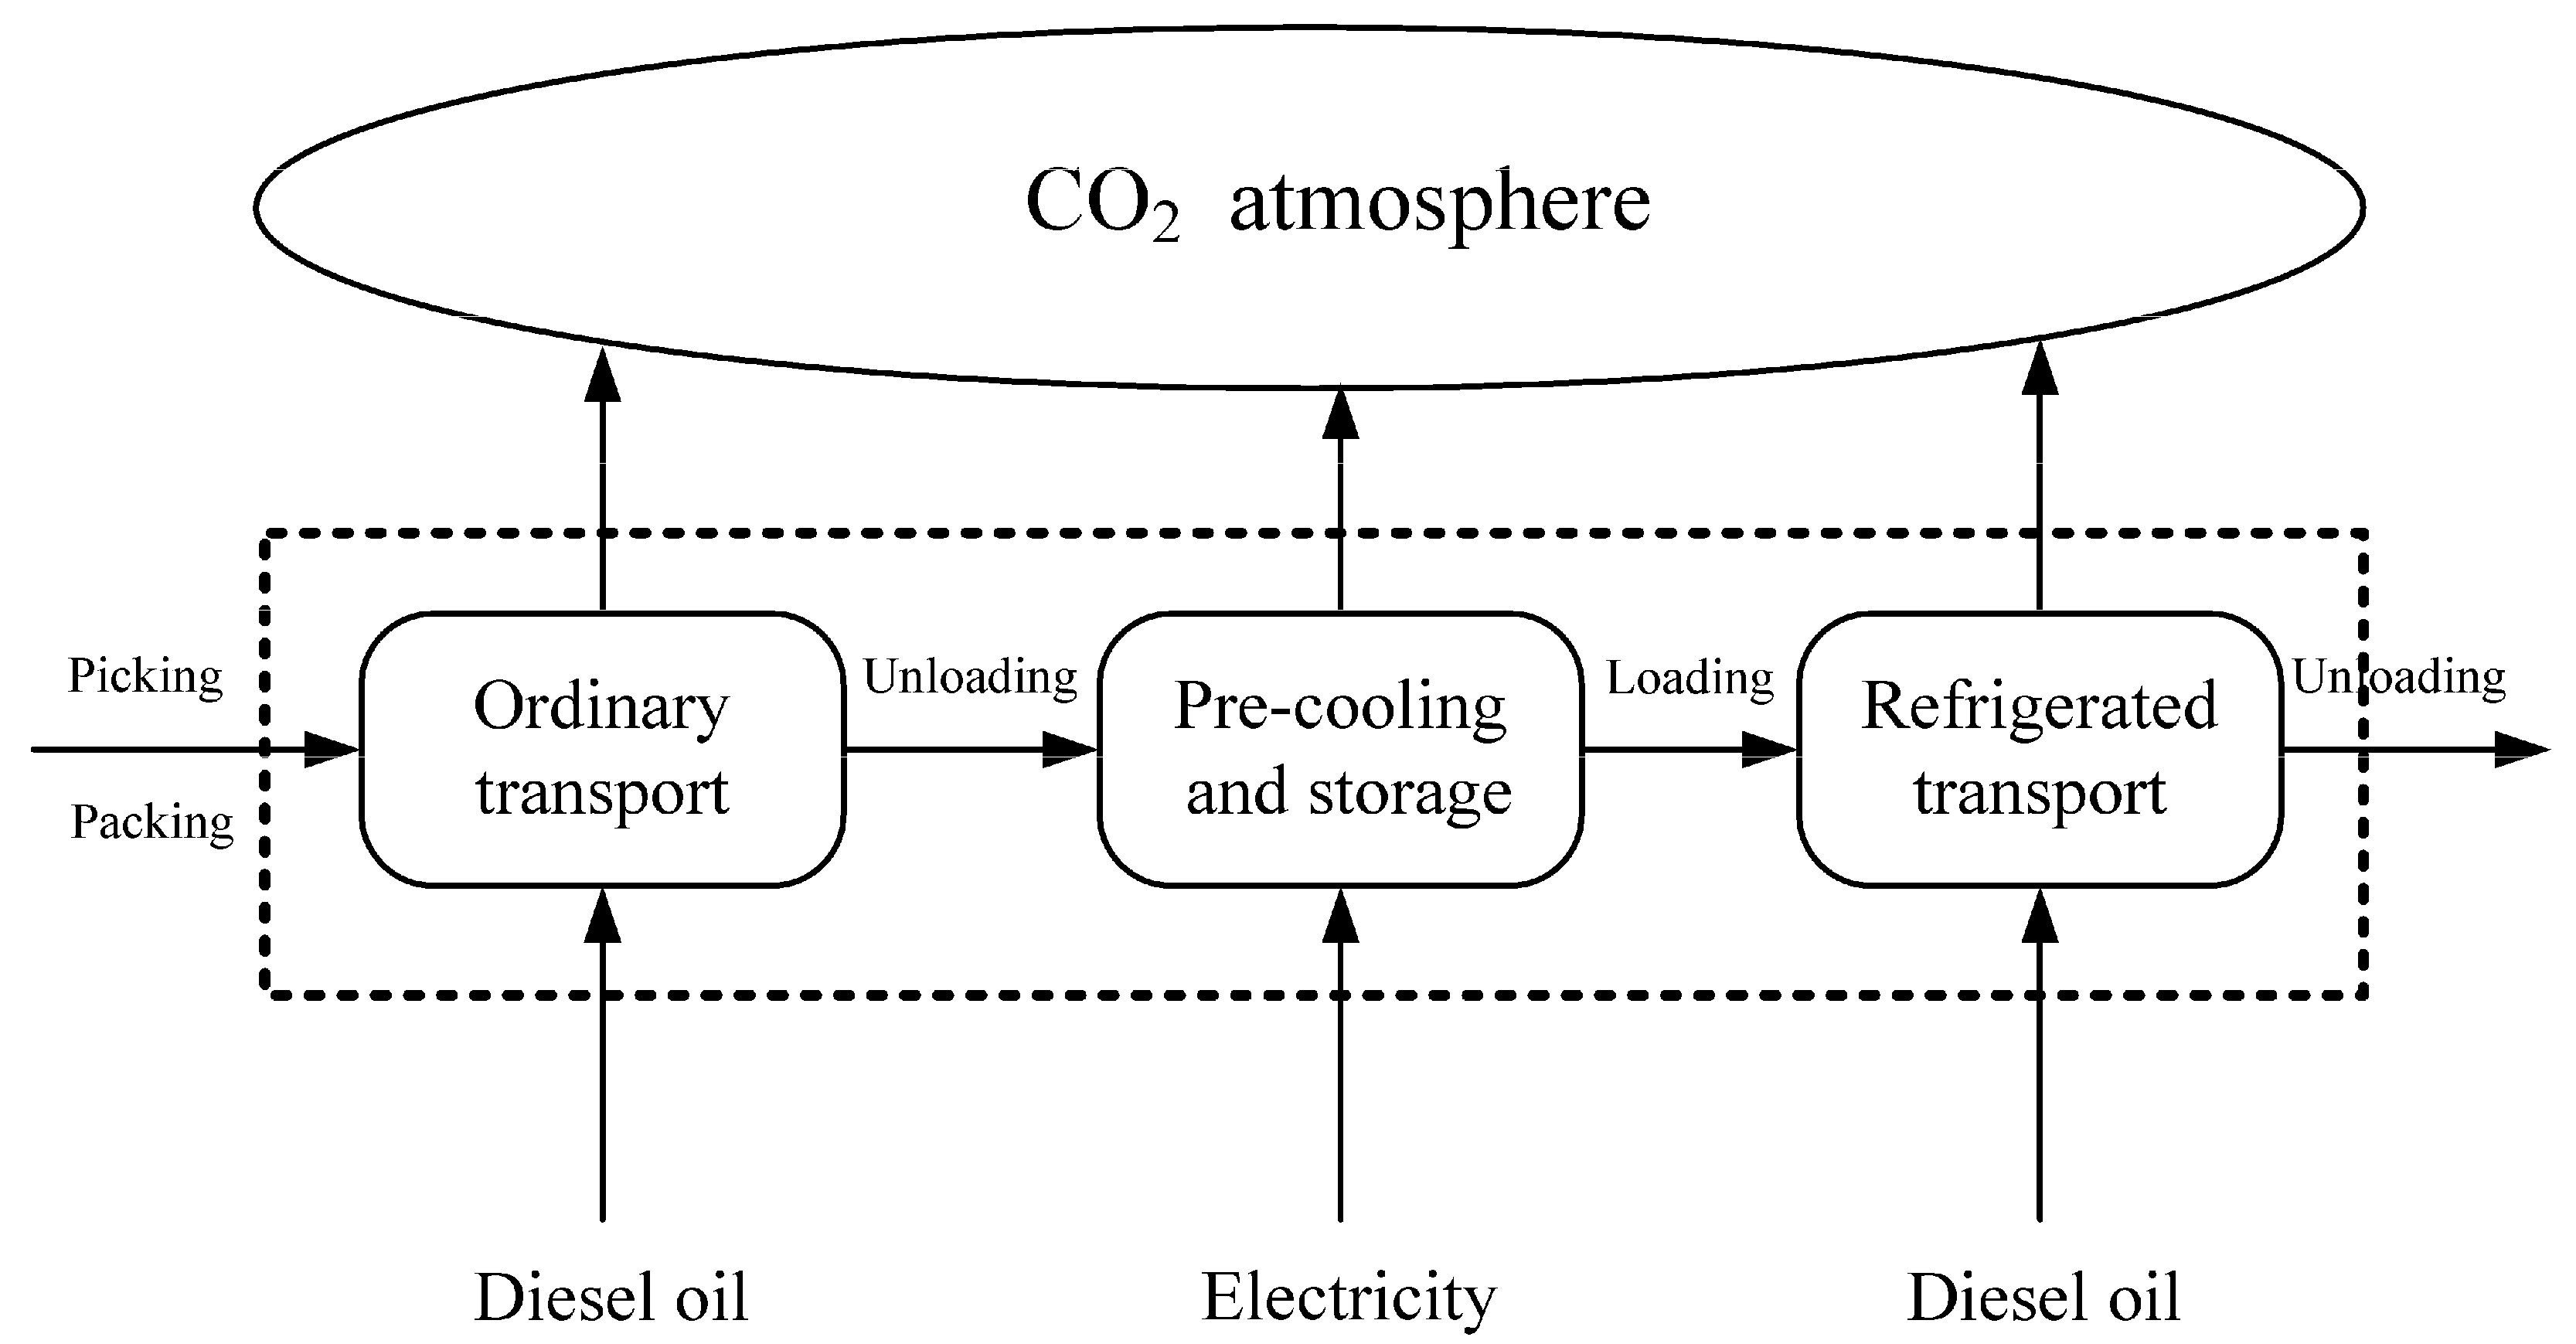
To identify the system boundary by employing the LCA method, the Xingjiang Uygur Autonomous Region in northwest China was chosen as the producing area, and Guangzhou City in south China was chosen as the consumption area. As illustrated in Figure 1, the system of the cold chain is principally made up of the processes of transportation, pre-cooling and storage. The transportation process includes ordinary and refrigerated transports. The planted table grapes were transported for pre-cooling with a small truck and stored at about 0 °C in cold storage after the picking and packing in the vineyard, and then refrigerated transported for retail with a heavy truck.
Carbon dioxide equivalent is selected as the indicator of the total amount of the greenhouse gas discharged from each process in cold chain. The cradle-to-gate method, which does not include the backhaul, is adopted as the system boundary [35], and the planting and retail processes are not included in the carbon footprint evaluation dur to the complexity and stochastic uncertainty of consumers in the retail process. The waste of table grapes is unified disposed in the retail process and the carbon footprint in waste is also excluded.
To unify the units for the carbon footprint evaluation in cold chain, the functional units of the table grapes mass and the carbon dioxide emissions were defined as kg and g/kg in the study.
2.2. Assumptions
The following assumptions were applied to simplify the carbon footprint evaluation and the profit maximization of table grapes:
- The cold chain is stable and the decay rate of the table grapes is constant.
- The transportation in cold chain is operated well.
- The decay of table grapes occurs only in the storage process in cold chain.
- The market demand rate keeps constant.
- The supplements are adequate and no stock-out is allowed.
- The replenishment lead time is constant.
2.3. General Profit Model
The EOQ method is adopted to evaluate the general profit of continuous decay table grapes in cold chain according to the variation of the stock status [31]. The table grapes would be reordered to guarantee the optimal balance between the minimum stock status and the maximum capital flows when the stock reaches the minimum sustainable supply status.
The profit is presented as Equation (1):
The cost is described as Equation (2):
The average stock is defined as Equation (3):
The table grapes are always in continuous decay in the cold chain stock system. The decay amount of the table grapes is related to the stock. The stock is demonstrated as Equations (4) and (5) according to the EOQ model:
According to the Equations (4) and (5), the replenishment amount could be obtained and calculated as Equation (6):
Finally, the profit could be presented as Equation (7) according to the above equations.
2.4. Profit Maximization Model with Carbon Footprint Constraint
The carbon footprint was considered as the cost of table grapes in cold chain to reduce the carbon emissions and improve the low-carbon production and sustainability of the cold chain system. The maximum profit is calculated by solving the first-order derivation and the carbon footprint in the ordinary and refrigerated transports and storage process were evaluated according to the defined system boundary by the LCA.
The profit maximization model with carbon footprint constraint is illustrated as Equations (8) and (9):
The carbon footprint cost of table grapes cold chain is calculated as Equation (10):
The total carbon footprint in the cold chain is defined as Equation (11):
The total carbon emission in the cold chain is illustrated as Equation (12):
The carbon emission of the transportation is calculated as Equations (13)–(15):
The average carbon emission of the storage is demonstrated as Equations (16) and (17):
2.5. Inventory Analysis
Inventory data were analyzed to quantitatively evaluate the carbon footprint and profit in cold chain. However, it is still difficult to acquire the carbon emission data in cold chain due to the current technological level [21]. The inventory is roughly estimated and identified according to the literature and field observation and investigation in actual process.
The inventory energy consumption data in cold chain are illustrated in Table 1. Carbon dioxide in transportation is principally emitted from the diesel oil consumption of truck, and carbon dioxide in storage is mainly emitted from the electricity consumption.
The carbon emission factors in the transportation and storage process are calculated according to the product of the dynamic energy data and carbon emission conversion coefficients of different energy consumption. The inventory carbon emission conversion coefficients are described in Table 2, and the inventory carbon emission factors are demonstrated in Table 3.
3. Results and Discussion
The profit optimization performance, the sensitivity performance and the different influencing factors were analyzed according to the profit maximization model with carbon footprint constraint and the inventory data in actual cold chain investigated. Data analysis and processing were performed using Matlab R2012b (MathWorks Incorporated, Massachusetts Natick, MN, USA) and Microsoft Office Excel 2016 software (Microsoft Corporation, Redmond Washington, RW, USA).
3.1. Profit Optimization Performance Analysis
The general profit, the profit with carbon footprint constraint and the carbon footprint were all calculated according to Equations (1), (8) and (11) with the inventory data. The optimization performance of the maximum general profit, the minimum carbon footprint and the maximum profit with carbon footprint constraint are described in Table 5, and the comparison between the strategies of the carbon footprint minimization and the profit maximization with carbon footprint constraint in different factors, which were compared with the strategy of the general profit maximization, are demonstrated in Figure 2.
As demonstrated in Table 5 and Figure 2, the replenishment cycle and replenishment amount in the strategy of carbon footprint minimization, about 5.29 days and 1037.1 kg, respectively, were all increased compared with the strategy of the general profit maximization. The increase range of the replenishment cycle and replenishment amount were about 297.74% and 693.13%, respectively. The carbon footprint, the general profit and the profit with carbon footprint constraint, about 187.4, −125.55 and −131.45, respectively, were all reduced. The reduction range of the carbon footprint, the general profit and the profit with carbon footprint constraint were about 49.75%, 154.49% and 160.21%, respectively. The actual table grapes cold chain was loss-making because of the negative profit in the strategy of the carbon footprint minimization.
The replenishment cycle and replenishment amount in the strategy of the profit maximization with carbon footprint constraint, about 1.39 day and 137.97 kg, respectively, were slightly increased compared with the strategy of the general profit maximization. The increase range of the replenishment cycle and replenishment amount were about 4.51% and 5.51%, respectively. The carbon footprint and the general profit, about 360.31 g and 230.2 CNY, respectively, were also slightly reduced. The reduction range of the carbon footprint and the general profit were about 3.39% and 0.1%, respectively. However, the profit with carbon footprint constraint, about 218.67 CNY, was increased by 0.08%.
Carbon footprint minimization is the best strategy for the environment, but it adds heavy economic burden, even negative profits, for the enterprises at the same time. It is unrealistic to consider the carbon footprint minimization only in some cases. The strategy of the profit maximization with carbon footprint constraint is more reasonable than that only considering the carbon footprint minimization, and also more comprehensive than that of general profit.
The strategy of the profit maximization with carbon footprint constraint not only reduced the carbon emission, but also had less impact on the profit in cold chain. The strategy of the profit maximization with carbon footprint constraint have made an optimal combination point between the economy and environment in actual cold chain, and improved the sustainability of the cold chain. The enterprises should integrate the carbon footprint cost into the profit maximization once the carbon emission tax is levied.
3.2. Sensitivity Performance Analysis
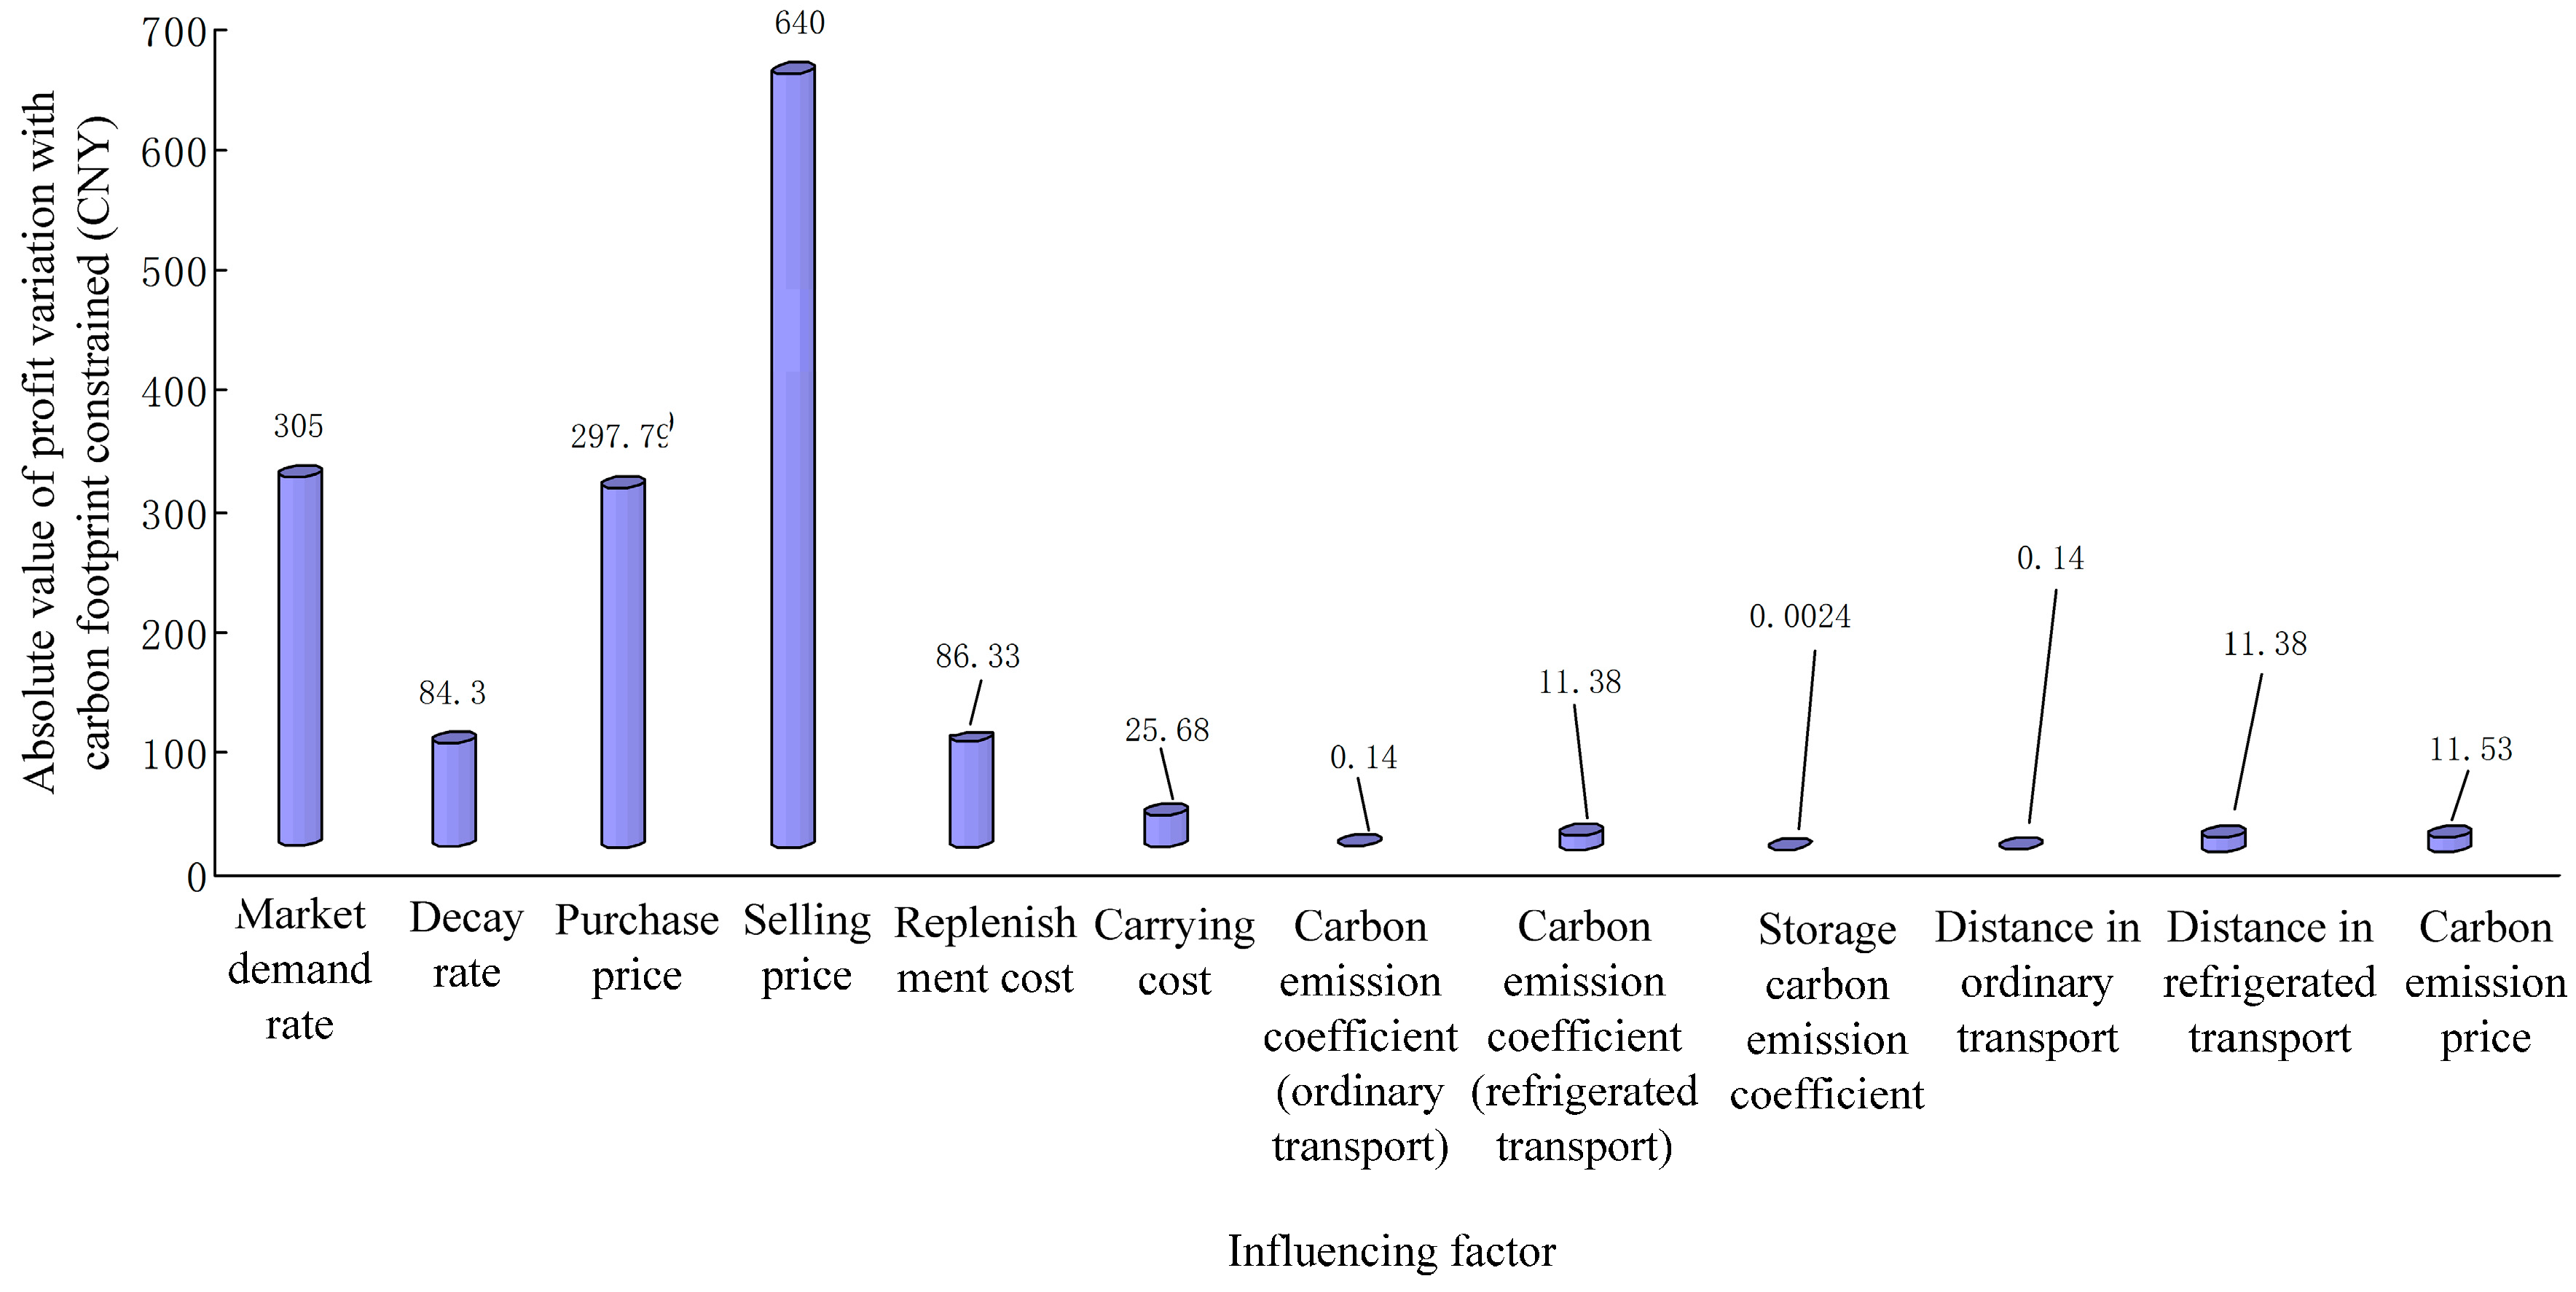
The absolute value of profit variation in different influencing factors was adopted to analyze the sensitivity performance of the profit maximization model with carbon footprint constraint in cold chain. The absolute value of profit variation is defined as Equation (18).
The variation rate of the influencing factor was about 1 and the other influencing factors were constant. The sensitivity is higher if the absolute value is also higher. According to the EOQ model applied in this study, the calculated absolute value of profit variation with carbon footprint constraint in different influencing factors are illustrated in Figure 3.
According to Figure 3, the influencing factor of the selling price, whose absolute value of profit variation were about 640 CNY (China Yuan), had the highest sensitivity, and the influencing factors of the market demand rate and the purchase price, whose absolute value of profit variation were about 305 CNY and 297.79 CNY, respectively, had relatively high sensitivity. The carbon emission coefficient in storage, whose absolute value of profit variation was about 0.0024 CNY, had the least sensitivity, and the carbon emission coefficient and the distance in ordinary transport, whose absolute value of profit variation were all about 0.14 CNY, had relatively low sensitivity. The influencing factors of the carbon emission coefficient in storage, and the carbon emission coefficient and the distance in ordinary transport were ignored because of their low sensitivity.
However, the influencing factors, which include the market demand rate, the purchase price, the selling price, the replenishment cost and the carrying cost, were principally decided by the market of table grapes, and they were also the influencing factors of the general profit without carbon footprint constraint. The influencing factors, which consist of the decay rate, the carbon emission coefficient and distance in refrigerated transport, were principally decided by the refrigeration process in actual cold chain, and the carbon emission price also had a great influence on the carbon emission cost in cold chain.
To further understand the variation of the profit with carbon footprint constraint in different influencing factors in actual table grapes cold chain, the influencing factors of the decay rate, the carbon emission price, the distance and carbon emission coefficient in refrigerated transport were selected, as discussed in more detail in the following sections.
3.3. Influence Analysis of Decay Rate
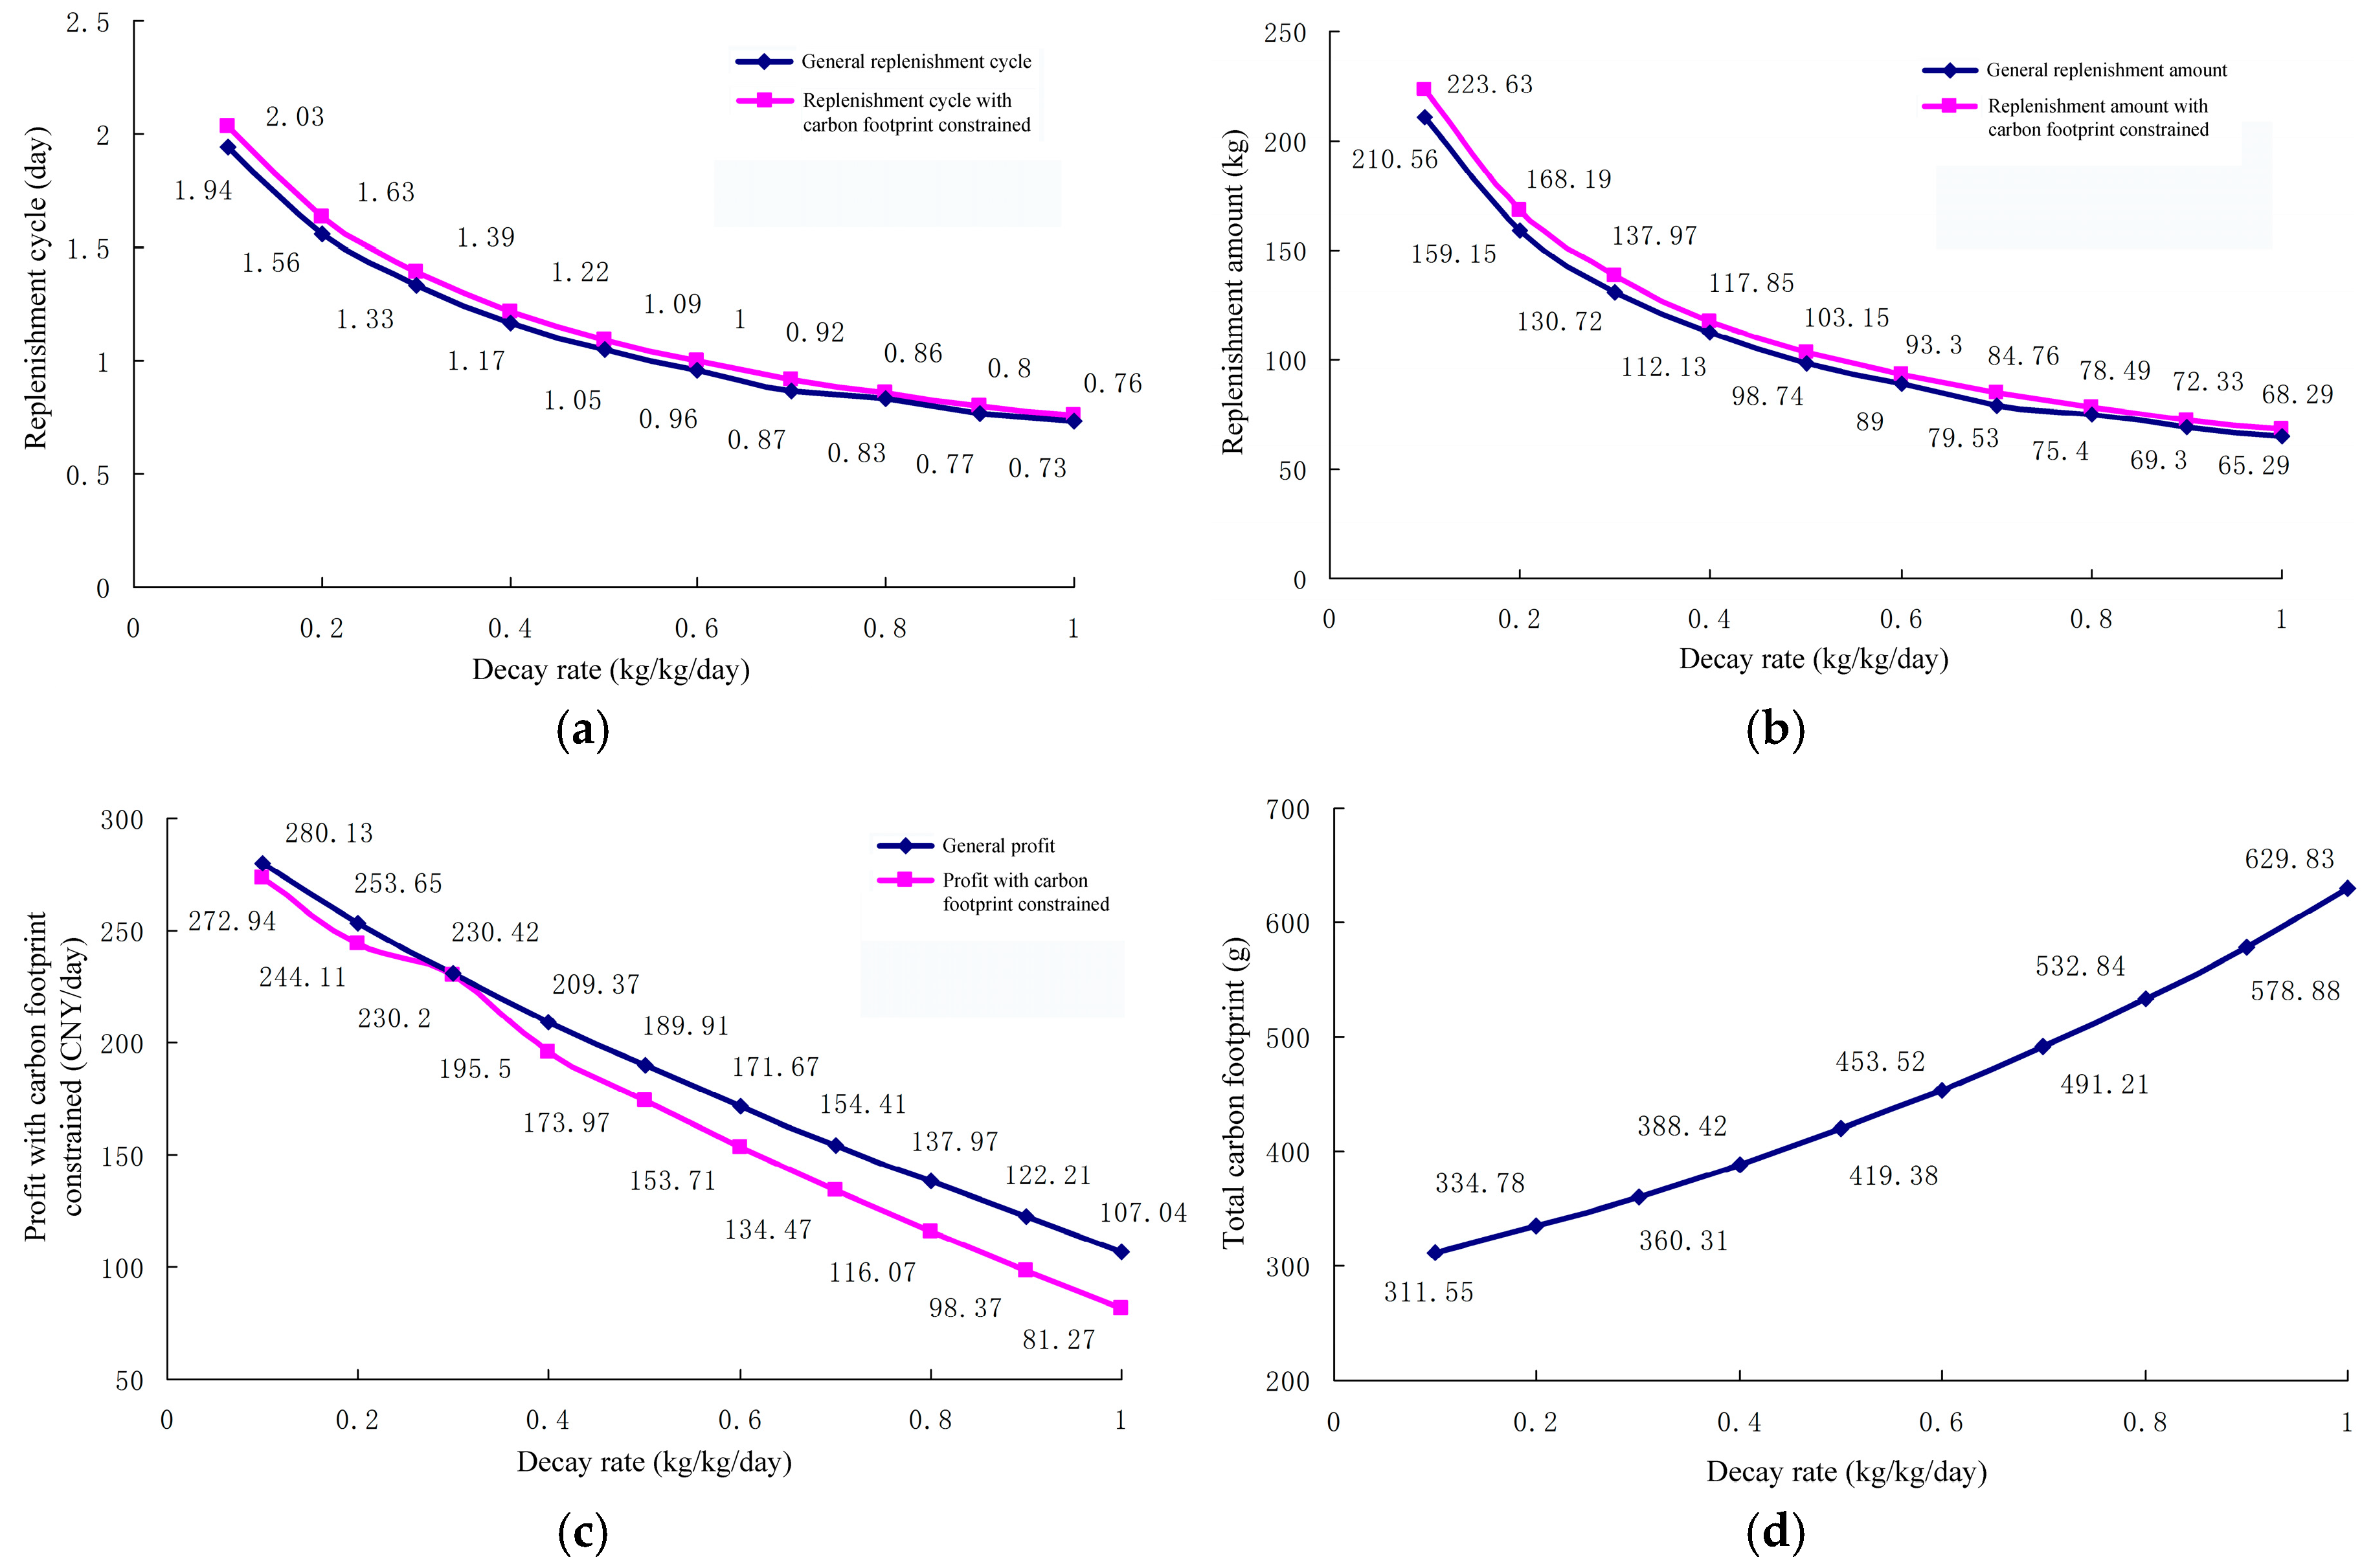
The different values of the influencing factor of decay rate were set with the constant values of the other influencing factors. The influence curves of the replenishment cycle, the replenishment amount, the profit with carbon footprint constraint and the total carbon footprint with the decay rate are presented in Figure 4.
As shown in Figure 4a,b, the replenishment cycle and the replenishment amount all increased along with the decrease of the decay rate, and the replenishment cycle and replenishment amount in general maximization were lower than that in profit maximization with carbon footprint constraint. The high decay rate made the great waste of table grapes. However, the optimal balance between stock and order costs should always be maintained to guarantee the profit maximization when the table grapes decay amount increases.
As demonstrated in Figure 4c,d, the profits with carbon footprint constraint in the strategy of the general maximization and profit maximization with carbon footprint constraint all decreased along with the increase of the decay rate, while the total carbon footprint increased. The profit with carbon footprint constraint in the strategy of general maximization was higher than that in profit maximization with carbon footprint constraint. The reason may be that the great waste of table grapes increased the cost and the decrease of the replenishment cycle increased the carbon emissions in process of the transportation and storage [42].
Reducing the decay rate of table grapes in cold chain is very important to maintain the profit maximization. The advanced refrigeration plants in cold storage and refrigerated transport should be reasonably adopted and the refrigeration environment such as the temperature and relative humidity should also be precisely and accurately monitored and controlled [8]. The profit with carbon footprint constraint in general maximization and profit maximization with carbon footprint constraint were about 44.28 CNY and 48.61 CNY, respectively, when the decay rate of table grapes decreased from 0.4 kg/kg/day to 0.2 kg/kg/day, according to the results.
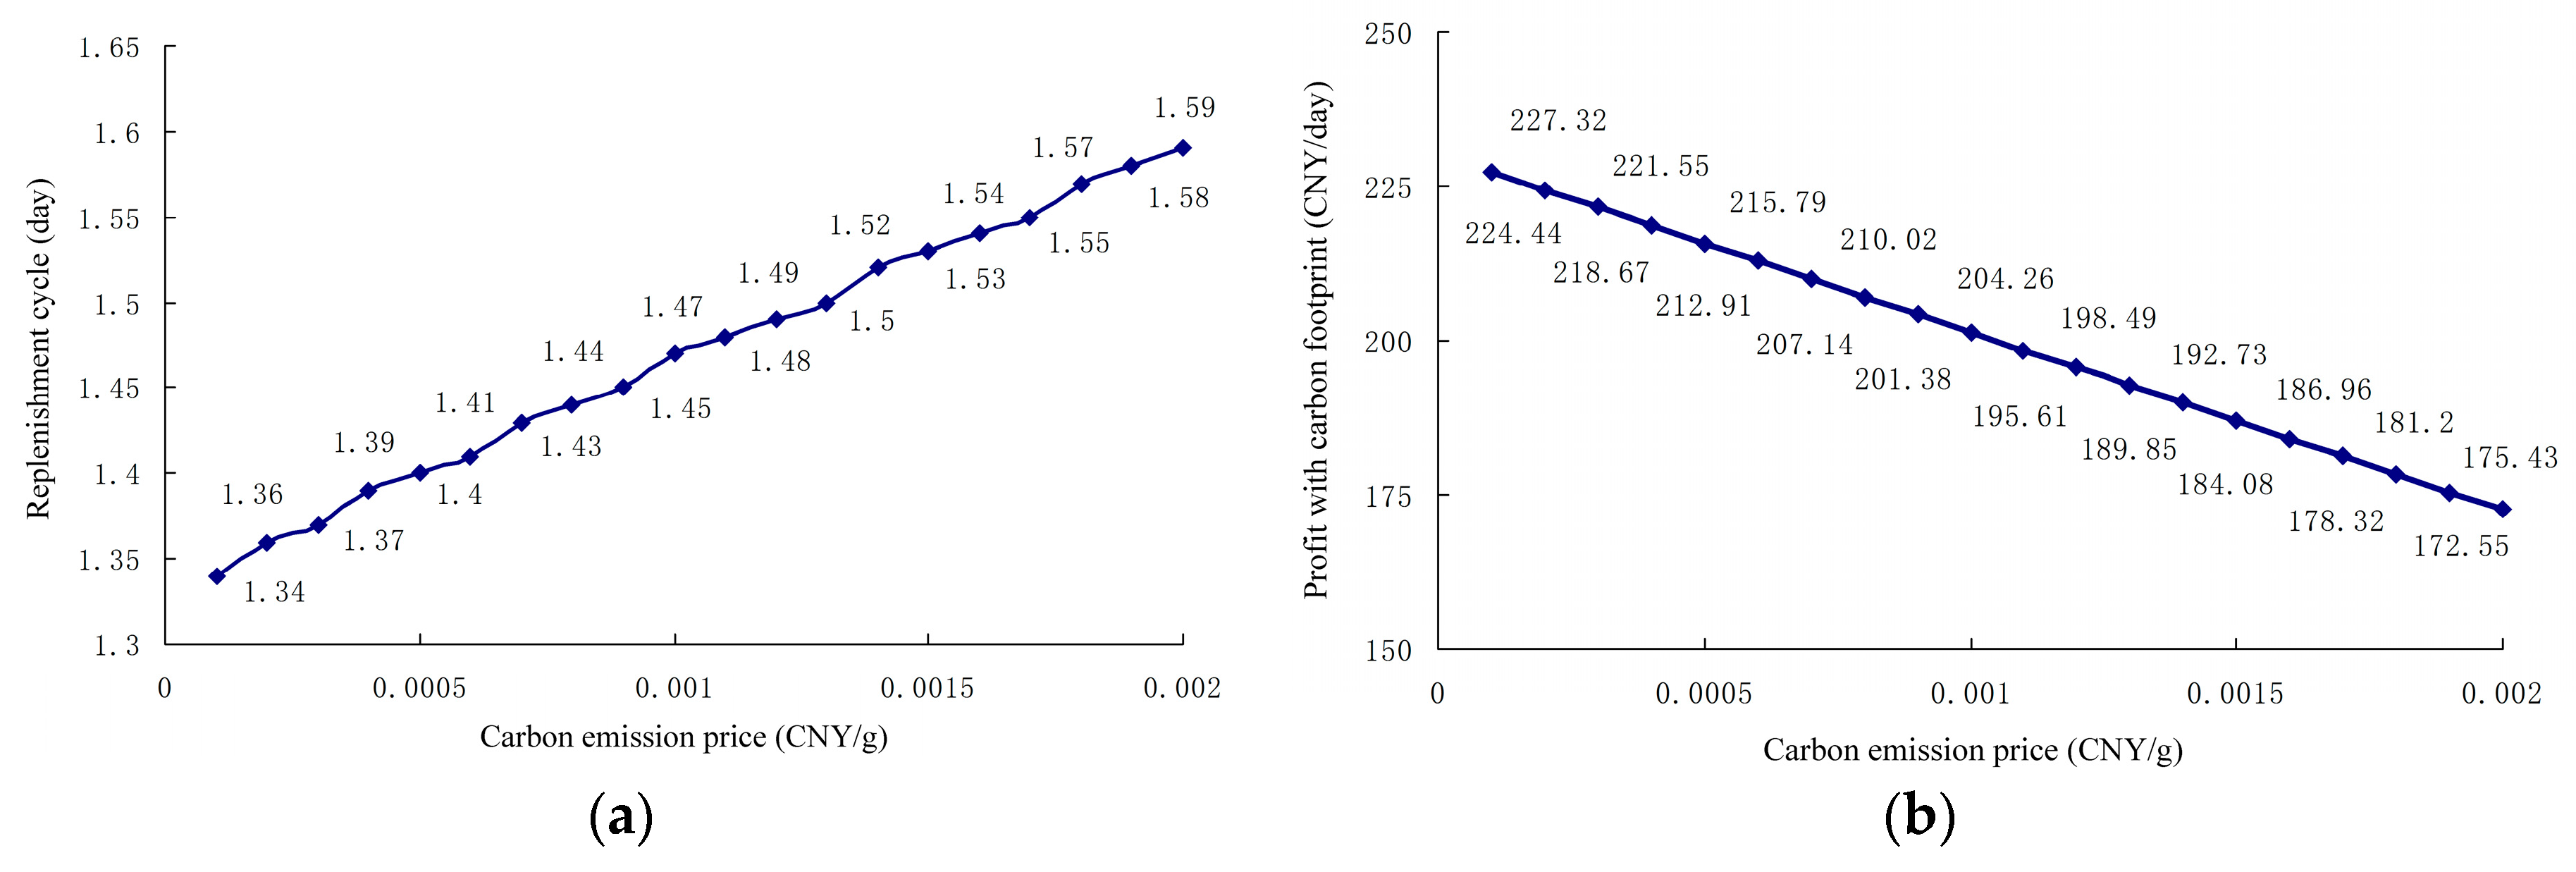
3.4. Influence Analysis of Carbon Emission Price
Different values of the influencing factor of carbon emission price were set with the constant values of the other influencing factors. The influence curves of the replenishment cycle and the profit with carbon footprint constraint with the carbon emission price are presented in Figure 5a,b.
As illustrated in Figure 5, the replenishment cycle increased along with the increase of the carbon emission price, while the profit with carbon footprint constraint almost linearly decreased. The profit with carbon footprint constraint was reduced about 3 CNY when the carbon emission price increased about 0.0001 CNY/g.
The carbon footprint cost also increased with the increase of the carbon emission price. The increased carbon footprint cost would reduce the profit of the table grapes. As an enterprise of table grapes in cold chain, it is urgent and necessary to adopt low-carbon refrigeration technology and plants to reduce the carbon emissions and increase the profit in cold chain.
3.5. Influence Analysis of Distance and Carbon Emission Coefficient in Refrigerated Transport
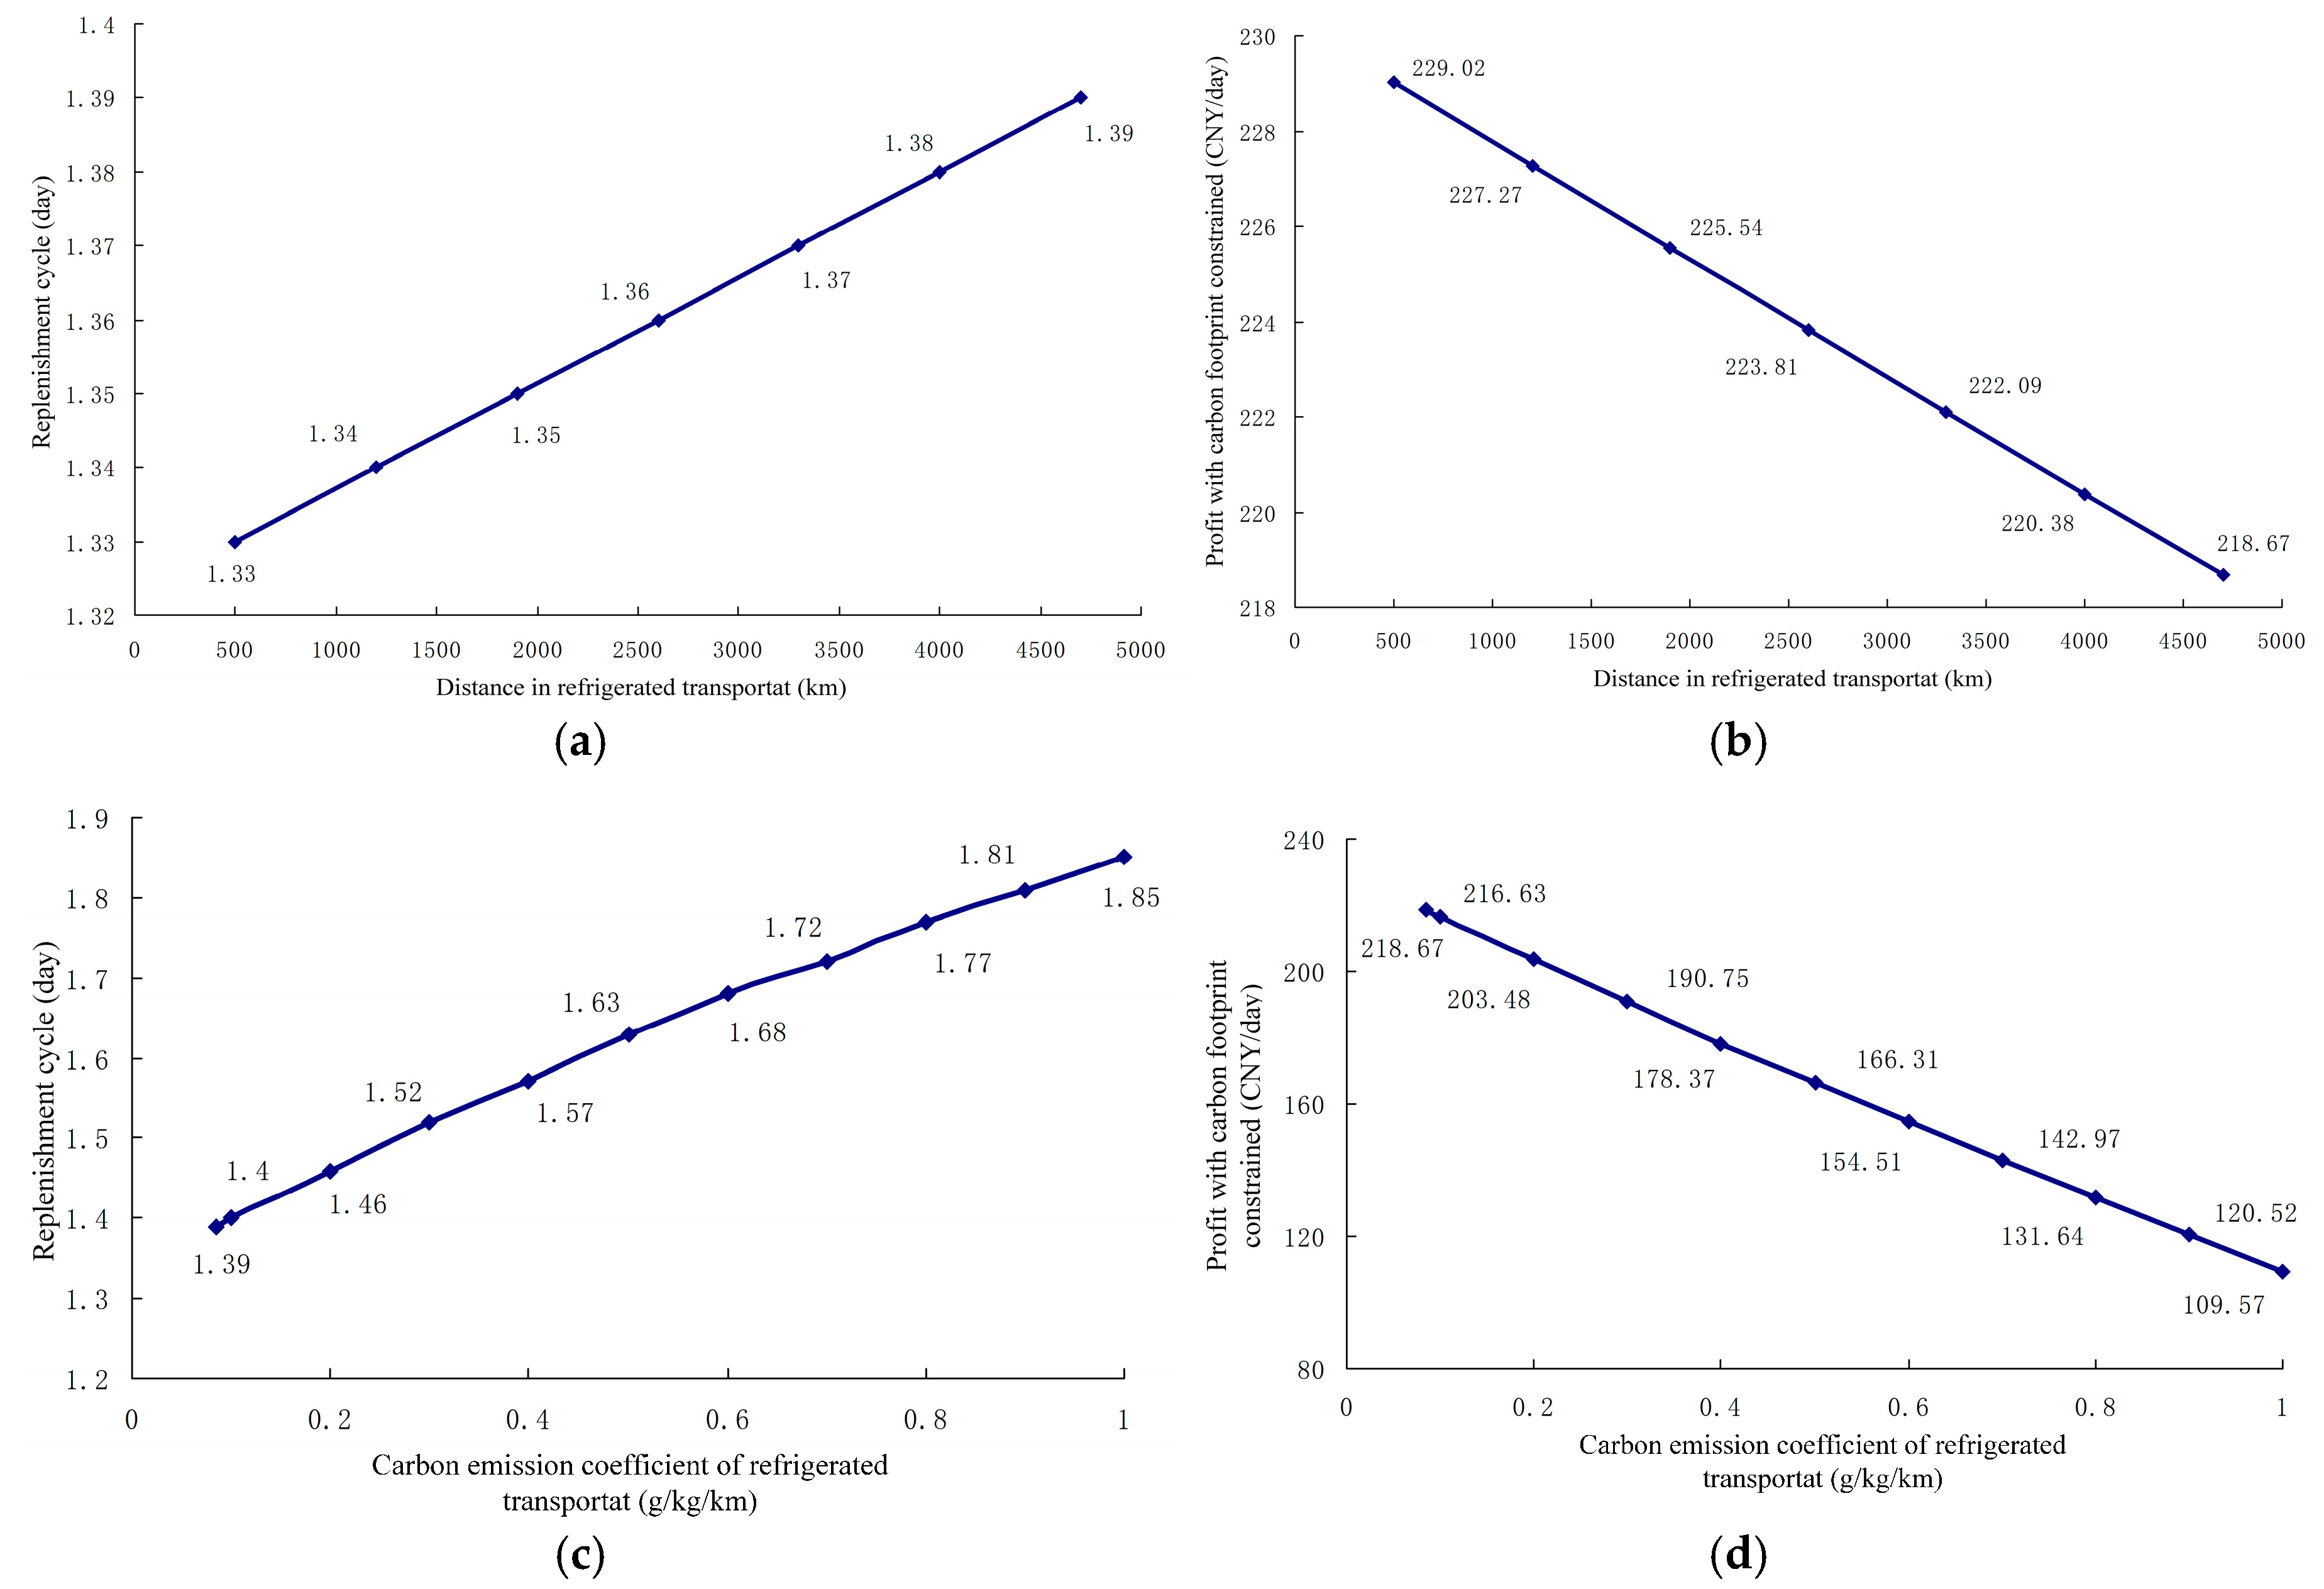
The different values of the influencing factor of distance and carbon emission coefficient in refrigerated transport were set with the constant values of the other influencing factors. The influence curves of the replenishment cycle and the profit with carbon footprint constraint with the distance, and the replenishment cycle and the profit with carbon footprint constraint with carbon emission coefficient in refrigerated transport are illustrated in Figure 6.
As presented in Figure 6a,b, the replenishment cycle almost linearly increased as the distance in refrigerated transport increased, while the profit with carbon footprint constraint linearly decreased. The replenishment cycle increased about 0.01 day and the profit with carbon footprint constraint was reduced by about 2 CNY when the distance in refrigerated transport increased about 500 km. The reason may be that the increased distance also increased the carbon emission in refrigerated transport, and finally increased the carbon footprint cost in refrigerated transport [43].
As shown in Figure 6c,d, the replenishment cycle increased with the carbon emission coefficient increase in refrigerated transport while the profit with carbon footprint constraint linearly decreased. The replenishment cycle was increased from 1.39 days to 1.85 days and the profit with carbon footprint constraint was reduced from 218.67 CNY to 109.57 CNY when the carbon emission coefficient in refrigerated transport increased from 0.1 g/kg/km to 1 g/kg/km. The reason may be that the increased carbon emission coefficient also increased the carbon footprint cost in refrigerated transport [44].
According to Equations (10) and (11), which are the calculation equations of carbon footprint cost and total carbon footprint, the carbon footprint cost were reduced by employing the longer replenishment cycle and larger replenishment amount in table grapes cold chain when the carbon emission coefficient in refrigerated transport was high.
4. Conclusions
The profit optimization performance analysis showed that the strategy of profit maximization with carbon footprint constraint not only reduced the carbon emission, but also had less impact on the profit of the cold chain. The replenishment cycle and replenishment amount were slightly increased by 4.51% and 5.51%, and the carbon footprint and the general profit were slightly reduced by 3.39% and 0.1% compared with the strategy of the general profit maximization.
The sensitivity performance analysis illustrated that the influencing factor of the selling price had the highest sensitivity, and the carbon emission coefficient in storage had the lowest sensitivity. The influencing factors of the distance in ordinary transport and the carbon emission coefficient in storage and ordinary transport was ignored due to their low sensitivity, and the decay rate, the carbon emission price, and the distance and carbon emission coefficient in refrigerated transport were selected and discussed to understand the variation of the profit with carbon footprint constraint in actual cold chain.
In this study, the comprehensive analysis of the profit optimization performance, the sensitivity performance and the influencing factors of the decay rate, the carbon emission price, and the distance and carbon emission coefficient in refrigerated transport in actual cold chain indicated that the proposed strategy of the profit maximization with carbon footprint constraint allowed identifying an optimal combination point between the economy and environment, thus allowing to improve the sustainability of the cold chain. Enterprises should integrate the carbon footprint cost into the profit maximization once the carbon emission tax is levied, and the policy makers should also make a proper carbon emission tax to realize the reasonable profit for the enterprises according to the influence analysis result of the carbon emission price.
The proposed strategy of the profit maximization with carbon footprint constraint is also suitable for other low-carbon supply chain applications. It is also possible to integrate the intelligent sensor monitor technologies with the carbon footprint evaluation methods to monitor the energy consumption and carbon emission in entire cold chain system to improve the low-carbon, green and sustainable cold chain management.
Author Contributions
Conceptualization, X.X. and X.Z.; Methodology, X.X.; Validation, X.X., X.Z. and Z.Z.; Formal Analysis, X.X.; Investigation, W.M.; Resources, W.M.; Data Curation, X.X. and W.M.; Writing-Original Draft Preparation, X.X.; Writing-Review & Editing, X.X.; Visualization, X.X.; Supervision, Z.F. and X.Z.; Project Administration, X.Z.; Funding Acquisition, X.Z.
Funding
This research was supported by the National Key R&D Program of China (2017YFE0111200) from Ministry of Science and Technology, the China Agriculture Research System (CARS-30) from Ministry of Agriculture and Rural Affairs of China, the postdoctoral project funded by China Postdoctoral Science Foundation (2018M630223, 20181T110160) and the opening project from key laboratory of agricultural informatization standardization of Ministry of Agriculture and Rural Affairs (China Agricultural University) (AIS2018-02).
Conflicts of Interest
The authors declare no conflict of interest. The funders had no role in the design of the study; in the collection, analyses, or interpretation of data; in the writing of the manuscript, and in the decision to publish the results.
Nomenclature
| profit of the table grapes (CNY/day) | total carbon emission (g) | ||
| cost of the table grapes (CNY /day) | carbon emission of transportation (g) | ||
| selling price of table grapes (CNY /kg) | carbon emission of storage (g) | ||
| market demand rate (kg/day) | carbon emission coefficient of ordinary transportation (g/kg/km) | ||
| replenishment cost (CNY/time) | carbon emission coefficient of refrigerated transport (g/kg/km) | ||
| replenishment cycle (day) | distance in ordinary transportation (km) | ||
| replenishment amount (kg) | distance in refrigerated transport (km) | ||
| purchase price (CNY /kg) | diesel oil consumption in ordinary transportation (L/km) | ||
| average stock (kg) | diesel oil consumption in refrigerated transport (L/km) | ||
| carrying cost coefficient (CNY/kg/day) | carbon emission conversion coefficient of diesel oil (g/L) | ||
| stock time (day) | carbon emission coefficient of storage (g/kg/day) | ||
| stock at the time of (kg) | electricity consumption (kWh/t/day) | ||
| decay rate of the table grapes (kg/kg/day) | carbon emission conversion coefficient of electricity (g/kWh) | ||
| profit with carbon footprint constraint (CNY/day) | absolute value of profit variation with carbon footprint constraint in influencing factor (CNY) | ||
| carbon footprint cost (CNY/day) | profit with carbon footprint constraint after the variation of influencing factor (CNY) | ||
| carbon emission price (CNY/g) | profit with carbon footprint constraint before the variation of influencing factor (CNY) | ||
| carbon footprint in cold chain (g/kg/day) | CNY | China Yuan |
References
- Hartikainen, H.; Roininen, T.; Katajajuuri, J.-M.; Pulkkinen, H. Finnish consumer perceptions of carbon footprints and carbon labelling of food products. J. Clean. Prod. 2014, 73, 285–293. [Google Scholar] [CrossRef]
- Lin, B.; Lei, X. Carbon emissions reduction in China’s food industry. Energy Policy 2015, 86, 483–492. [Google Scholar] [CrossRef]
- Yoshikawa, N.; Fujiwara, N.; Nagata, J.; Amano, K. Greenhouse gases reduction potential through consumer’s behavioral changes in terms of food-related product selection. Appl. Energy 2016, 162, 1564–1570. [Google Scholar] [CrossRef] [Green Version]
- Guo, H.; Shao, M. Process reengineering of cold chain logistics of agricultural products based on low-carbon economy. Asian Agric. Res. 2012, 4, 59–62. [Google Scholar]
- Chen, G.; Govindan, K.; Golias, M.M. Reducing truck emissions at container terminals in a low carbon economy: Proposal of a queueing-based bi-objective model for optimizing truck arrival pattern. Transp. Res. E Logist. Transp. Rev. 2013, 55, 3–22. [Google Scholar] [CrossRef]
- He, Z.; Chen, P.; Liu, H.; Guo, Z. Performance measurement system and strategies for developing low-carbon logistics: A case study in China. J. Clean. Prod. 2017, 156, 395–405. [Google Scholar] [CrossRef]
- Deng, L.; Wang, R.; Dong, T.; Feng, J.; Mu, W. Assessing the table grape supply chain performance in China -a value chain analysis perspective. Br. Food J. 2016, 118, 1129–1145. [Google Scholar] [CrossRef]
- Xiao, X.; Li, Z.; Matetic, M.; Bakaric, M.B.; Zhang, X. Energy-efficient sensing method for table grapes cold chain management. J. Clean. Prod. 2017, 152, 77–87. [Google Scholar] [CrossRef]
- Wang, X.; He, Q.; Matetic, M.; Jemric, T.; Zhang, X. Development and evaluation on a wireless multi-gas-sensors system for improving traceability and transparency of table grape cold chain. Comput. Electron. Agric. 2017, 135, 195–207. [Google Scholar] [CrossRef]
- James, S.J.; James, C. The food cold-chain and climate change. Food Res. Int. 2010, 43, 1944–1956. [Google Scholar] [CrossRef]
- Bazan, E.; Jaber, M.Y.; Zanoni, S. Supply chain models with greenhouse gases emissions, energy usage and different coordination decisions. Appl. Math. Model. 2015, 39, 5131–5151. [Google Scholar] [CrossRef]
- Gwanpua, S.G.; Verboven, P.; Leducq, D.; Brown, T.; Verlinden, B.E.; Bekele, E.; Aregawi, W.; Evans, J.; Foster, A.; Duret, S.; et al. The FRISBEE tool, a software for optimising the trade-off between food quality, energy use, and global warming impact of cold chains. J. Food Eng. 2015, 148, 2–12. [Google Scholar] [CrossRef]
- Ingrao, C.; Rana, R.; Tricase, C.; Lombardi, M. Application of Carbon Footprint to an agro-biogas supply chain in Southern Italy. Appl. Energy 2015, 149, 75–88. [Google Scholar] [CrossRef]
- Eriksson, M.; Strid, I.; Hansson, P.-A. Carbon footprint of food waste management options in the waste hierarchy-a Swedish Case study. J. Clean. Prod. 2015, 93, 115–125. [Google Scholar] [CrossRef]
- Ahlstrom, J.M.; Pettersson, K.; Wetterlund, E.; Harvey, S. Value chains for integrated production of liquefied bio-SNG at sawmill sites—Techno-economic and carbon footprint evaluation. Appl. Energy 2017, 206, 1590–1608. [Google Scholar] [CrossRef]
- Liu, Y.; Lu, Y. The Economic impact of different carbon tax revenue recycling schemes in China: A model-based scenario analysis. Appl. Energy 2015, 141, 96–105. [Google Scholar] [CrossRef]
- Tian, X.; Dai, H.; Geng, Y.; Huang, Z.; Masui, T.; Fujita, T. The effects of carbon reduction on sectoral competitiveness in China: A. case of Shanghai. Appl. Energy 2017, 197, 270–278. [Google Scholar] [CrossRef]
- Fang, G.; Tian, L.; Fu, M.; Sun, M.; Du, R.; Liu, M. Investigating carbon tax pilot in YRD urban agglomerations-Analysis of a novel ESER system with carbon tax constraints and its application. Appl. Energy 2017, 194, 635–647. [Google Scholar] [CrossRef]
- Dong, H.; Dai, H.; Geng, Y.; Fujita, T.; Liu, Z.; Xie, Y.; Wu, R.; Fujii, M.; Masui, T.; Tang, L. Exploring impact of carbon tax on China’s CO2 reductions and provincial disparities. Renew. Sustain. Energy Rev. 2017, 77, 596–603. [Google Scholar] [CrossRef]
- Zhang, Z.; Zhang, A.; Wang, D.; Li, A.; Song, H. How to improve the performance of carbon tax in China? J. Clean. Prod. 2017, 142, 2060–2072. [Google Scholar] [CrossRef]
- Chau, C.K.; Leung, T.M.; Ng, W.Y. A review on Life Cycle Assessment, Life Cycle Energy Assessment and Life Cycle Carbon Emissions Assessment on buildings. Appl. Energy 2015, 143, 395–413. [Google Scholar] [CrossRef]
- Feng, F.; Song, G.; Shen, L.; Xiao, J. Environmental benefits analysis based on life cycle assessment of rice straw-based synthetic natural gas in China. Energy 2017, 139, 341–349. [Google Scholar] [CrossRef]
- Isabel Noya, L.; Vasilaki, V.; Stojceska, V.; Gonzalez-Garcia, S.; Kleynhans, C.; Tassou, S.; Moreira, M.T.; Katsou, E. An environmental evaluation of food supply chain using life cycle assessment: A case study on gluten free biscuit products. J. Clean. Prod. 2018, 170, 451–461. [Google Scholar] [CrossRef]
- Pattara, C.; Raggi, A.; Cichelli, A. Life Cycle Assessment and Carbon Footprint in the Wine Supply-Chain. Environ. Manag. 2012, 49, 1247–1258. [Google Scholar] [CrossRef] [PubMed]
- Del Borghi, A.; Gallo, M.; Strazza, C.; Del Borghi, M. An evaluation of environmental sustainability in the food industry through Life Cycle Assessment: The case study of tomato products supply chain. J. Clean. Prod. 2014, 78, 121–130. [Google Scholar] [CrossRef]
- Singh, A.; Mishra, N.; Ali, S.I.; Shukla, N.; Shankar, R. Cloud computing technology: Reducing carbon footprint in beef supply chain. Int. J. Prod. Econ. 2015, 164, 462–471. [Google Scholar] [CrossRef] [Green Version]
- Vagnoni, E.; Franca, A.; Porqueddu, C.; Duce, P. Environmental profile of Sardinian sheep milk cheese supply chain: A comparison between two contrasting dairy systems. J. Clean. Prod. 2017, 165, 1078–1089. [Google Scholar] [CrossRef]
- Willersinn, C.; Moebius, S.; Mouron, P.; Lansche, J.; Mack, G. Environmental impacts of food losses along the entire Swiss potato supply chain—Current situation and reduction potentials. J. Clean. Prod. 2017, 140, 860–870. [Google Scholar] [CrossRef]
- Litskas, V.D.; Irakleous, T.; Tzortzakis, N.; Stavrinides, M.C. Determining the carbon footprint of indigenous and introduced grape varieties through Life Cycle Assessment using the island of Cyprus as a case study. J. Clean. Prod. 2017, 156, 418–425. [Google Scholar] [CrossRef]
- Disney, S.M.; Warburton, R.D.H. On the Lambert W function: Economic Order Quantity applications and pedagogical considerations. Int. J. Prod. Econ. 2012, 140, 756–764. [Google Scholar] [CrossRef] [Green Version]
- Bozorgi, A. Multi-product inventory model for cold items with cost and emission consideration. Int. J. Prod. Econ. 2016, 176, 123–142. [Google Scholar] [CrossRef]
- Bozorgi, A.; Pazour, J.; Nazzal, D. A new inventory model for cold items that considers costs and emissions. Int. J. Prod. Econ. 2014, 155, 114–125. [Google Scholar] [CrossRef]
- Lan, H.J.; Zhao, L.; Su, L.; Liu, Z.G. Food Cold Chain Equilibrium Based on Collaborative Replenishment. J. Appl. Res. Technol. 2014, 12, 201–211. [Google Scholar] [CrossRef]
- Hariga, M.; As’ad, R.; Shamayleh, A. Integrated economic and environmental models for a multi stage cold supply chain under carbon tax regulation. J. Clean. Prod. 2017, 166, 1357–1371. [Google Scholar] [CrossRef]
- Adams, P.W.R.; Shirley, J.E.J.; McManus, M.C. Comparative cradle-to-gate life cycle assessment of wood pellet production with torrefaction. Appl. Energy 2015, 138, 367–380. [Google Scholar] [CrossRef] [Green Version]
- Roy, P.; Nei, D.; Okadome, H.; Nakamura, N.; Orikasa, T.; Shiina, T. Life cycle inventory analysis of fresh tomato distribution systems in Japan considering the quality aspect. J. Food Eng. 2008, 86, 225–233. [Google Scholar] [CrossRef]
- Mu, J.; Li, C. Study on Food Cold Chain Multi-objective Robust Optimization Model with Uncertain Market Demand. Logist. Technol. 2015, 34, 57–61, (In Chinese with English abstract). [Google Scholar]
- Chen, X.; Wang, Z. Low-Carbon Scenario Analysis on Urban Transport of a Metropolitan of China in 2020. J. Ind. Eng. Manag. 2012, 5, 344–353. [Google Scholar] [CrossRef]
- Zhou, X.; Zhou, M.; Zhang, M. Contrastive analyses of the influence factors of interprovincial carbon emission induced by industry energy in China. Nat. Hazards 2016, 81, 1405–1433. [Google Scholar] [CrossRef]
- Lee, M. Reducing CO2 emissions in the individual hot water circulation piping system. Energy Build. 2014, 84, 475–482. [Google Scholar] [CrossRef]
- Renner, M. Carbon prices and CCS investment: A comparative study between the European Union and China. Energy Policy 2014, 75, 327–340. [Google Scholar] [CrossRef]
- Romanazzi, G.; Lichter, A.; Gabler, F.M.; Smilanick, J.L. Recent advances on the use of natural and safe alternatives to conventional methods to control postharvest gray mold of table grapes. Postharvest Biol. Technol. 2012, 63, 141–147. [Google Scholar] [CrossRef]
- Tsamos, K.M.; Ge, Y.T.; Santosa, I.; Tassou, S.A.; Bianchi, G.; Mylona, Z. Energy analysis of alternative CO2 refrigeration system configurations for retail food applications in moderate and warm climates. Energy Convers. Manag. 2017, 150, 822–829. [Google Scholar] [CrossRef]
- Cascini, A.; Gamberi, M.; Mora, C.; Rosano, M.; Bortolini, M. Comparative Carbon Footprint Assessment of commercial walk-in refrigeration systems under different use configurations. J. Clean. Prod. 2016, 112, 3998–4011. [Google Scholar] [CrossRef]
Figure 1.
System boundary of table grapes cold chain.

Figure 2.
Comparison between the carbon footprint minimization and the profit maximization with carbon footprint constraint in different factors.
Figure 2.
Comparison between the carbon footprint minimization and the profit maximization with carbon footprint constraint in different factors.

Figure 3.
Absolute value of profit variation with carbon footprint constraint in different influencing factors.
Figure 3.
Absolute value of profit variation with carbon footprint constraint in different influencing factors.

Figure 4.
Influence of the decay rate: (a) the curve of the replenishment cycle; (b) the curve of the replenishment amount; (c) the curve of the profit with carbon footprint constraint; (d) the curve of the total carbon footprint.
Figure 4.
Influence of the decay rate: (a) the curve of the replenishment cycle; (b) the curve of the replenishment amount; (c) the curve of the profit with carbon footprint constraint; (d) the curve of the total carbon footprint.

Figure 5.
Influence of the carbon emission price: (a) the curve of the replenishment cycle; and (b) the curve of the profit with carbon footprint constraint.
Figure 5.
Influence of the carbon emission price: (a) the curve of the replenishment cycle; and (b) the curve of the profit with carbon footprint constraint.

Figure 6.
Influence of the distance and carbon emission coefficient in refrigerated transport: (a) the curve of the replenishment cycle with the distance; (b) the curve of the profit with carbon footprint constraint with the distance; (c) the curve of the replenishment cycle with the carbon emission coefficient; and (d) the curve of the profit with carbon footprint constraint with the carbon emission coefficient.


Table 1.
The energy consumption data in cold chain.
| Process | Activities | Energy Data | Energy Consumption | Data Source |
|---|---|---|---|---|
| Transportation | Ordinary transportation with small truck | 0.1667 L/km | Diesel oil for driving | Roy et al. [36] |
| Refrigerated transport with heavy truck | 0.2857 L/km | Diesel oil for driving | ||
| 0.0250 L/km | Diesel oil for refrigeration | |||
| Storage | Pre-cooling and cold storage | 0.3 kWh/t/day | Electricity | Mu and Li [37] |
Table 2.
The inventory carbon emission conversion coefficients.
| Energy Consumption | Energy Data | Data Source |
|---|---|---|
| Diesel oil | 2730 g/L | Chen and Wang [38]; Zhou et al. [39] |
| Electricity | 620 g/kWh | Lee [40] |
Table 3.
The inventory carbon emission factors.
| Process | Activities | Carbon Emission Factor |
|---|---|---|
| Transportation | Ordinary transportation with small truck | 0.0455 g/kg/km |
| Refrigerated transport with heavy truck | 0.0848 g/kg/km | |
| Storage | Pre-cooling and cold storage | 0.186 g/kg/day |
Table 4.
The model parameters. CNY, China Yuan.
| Parameters | Functions | Parameter Values |
|---|---|---|
| selling price of table grapes (CNY/kg) | 8 | |
| market demand rate (kg/day) | 80 | |
| replenishment cost (CNY/time) | 120 | |
| purchasing price (CNY/kg) | 3 | |
| carrying cost coefficient (CNY/kg/day) | 0.4 | |
| decay rate of the table grapes (kg/kg/day) | 0.3 | |
| carbon emission price (CNY/g) | 0.0004 | |
| distance in ordinary transportation (km) | 5 | |
| distance in refrigerated transport (km) | 4700 |
Table 5.
The optimization performance in different objective functions. CNY, China Yuan.
| Comparison Factors | General Profit Maximization | Carbon Footprint Minimization | Profit Maximization with Carbon Footprint Constraint |
|---|---|---|---|
| Replenishment cycle T (day) | 1.33 | 5.29 | 1.39 |
| Replenishment amount Q (kg) | 130.76 | 1037.1 | 137.97 |
| General profit (CNY) | 230.42 | −125.55 | 230.2 |
| Carbon footprint (g) | 372.96 | 187.4 | 360.31 |
| Profit with carbon footprint Constrained (CNY) | 218.49 | −131.45 | 218.67 |
© 2018 by the authors. Licensee MDPI, Basel, Switzerland. This article is an open access article distributed under the terms and conditions of the Creative Commons Attribution (CC BY) license (http://creativecommons.org/licenses/by/4.0/).
Share and Cite
MDPI and ACS Style
Xiao, X.; Zhu, Z.; Fu, Z.; Mu, W.; Zhang, X. Carbon Footprint Constrained Profit Maximization of Table Grapes Cold Chain. Agronomy 2018, 8, 125. https://doi.org/10.3390/agronomy8070125
AMA Style
Xiao X, Zhu Z, Fu Z, Mu W, Zhang X. Carbon Footprint Constrained Profit Maximization of Table Grapes Cold Chain. Agronomy. 2018; 8(7):125. https://doi.org/10.3390/agronomy8070125
Chicago/Turabian StyleXiao, Xinqing, Zhiqiang Zhu, Zetian Fu, Weisong Mu, and Xiaoshuan Zhang. 2018. "Carbon Footprint Constrained Profit Maximization of Table Grapes Cold Chain" Agronomy 8, no. 7: 125. https://doi.org/10.3390/agronomy8070125
Note that from the first issue of 2016, this journal uses article numbers instead of page numbers. See further details here.