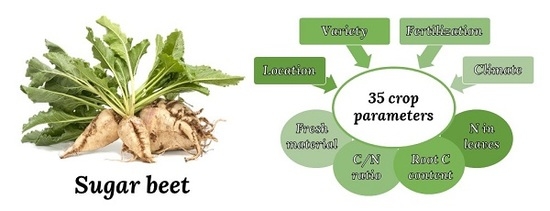
Impact of Climatic Variables on Carbon Content in Sugar Beet Root
by
 , , ,
, , ,
Luis F. Sánchez-Sastre
1 ,
,
Pablo Martín-Ramos
2,* ,
,
Luis M. Navas-Gracia
1,
Salvador Hernández-Navarro
1 and
Jesús Martín-Gil
1 1
Department of Agriculture and Forestry Engineering, Escuela Técnica Superior de Ingenierías Agrarias de Palencia, Universidad de Valladolid, Avenida de Madrid 44, 34004 Palencia, Spain
2
Department of Agricultural and Environmental Sciences, Escuela Politécnica Superior, Instituto de Investigación en Ciencias Ambientales (IUCA), University of Zaragoza, Carretera de Cuarte, s/n, 22071 Huesca, Spain
*
Author to whom correspondence should be addressed.
Agronomy 2018, 8(8), 147; https://doi.org/10.3390/agronomy8080147
Submission received: 30 June 2018
/
Revised: 8 August 2018
/
Accepted: 8 August 2018
/
Published: 14 August 2018
Abstract
:The impacts of climatic variables on the growth and carbon content of spring sown sugar beet (Beta vulgaris L.) in the Castilla y Leon region (Northwestern Spain) were assessed by analyzing 35 beet crop variables at four sites over two cultivation years. ANOVA analysis allowed to discern that the location was the factor that had the highest effect on those variables. Fertilization treatments only had a significant impact on the variables derived from the quantity of fresh material (leaves), while the beet variety choice influenced the amount of nitrogen in leaves and the carbon to nitrogen ratio. It could be inferred that the percentage of root carbon content depended mostly on the location and that a higher percentage of root carbon content led to a higher content of dry matter, with a positive relationship with the sucrose content for the two types of varieties that were tested. Principal Component Analysis distinguished the climatic factors that most influenced each cultivation area in each cultivation year and provided a clear separation of the data in clusters, evidencing the uniqueness of each site.
1. Introduction
The Agriculture, Forestry and Other Land Use (AFOLU) sector is responsible for just under a quarter (~10–12 GtCO2eq·yr−1) of anthropogenic Greenhouse Gas (GHG) emissions, mainly from deforestation and agricultural emissions from livestock, soil, and nutrient management [1]. Therefore, agriculture is a major contributor of GHG emissions to the atmosphere, both directly—throughout farming operations and biochemical processes that take place in agricultural soils—and indirectly—due to fossil fuel use in farm operations or in the production of agrochemicals. Nevertheless, agriculture has the peculiarity of being, not only an emitter, but also an anthropogenic activity with the ability to capture CO2, which has a great potential for climate change mitigation [2].
Crops take up carbon from the atmosphere through the photosynthesis process. Carbon dioxide sequestered by plants is the result of the difference between the CO2 assimilated by photosynthesis and the CO2 emitted during respiration [3], and represents 40–50% of plant biomass dry matter [4]. Consequently, as long as growth rates are high, crops can be deemed as carbon sinks [5]. Nevertheless, the fact that environmental factors (radiation, temperature, precipitation, soil nutrients, and CO2 concentration) continuously change, and the fact that plants respond unequally to different environments should also be taken into account [6].
AFOLU activities have a dual character, serving as CO2 emitters and sinks [1]. For this reason, in the last few years, in the context of the green economy, some initiatives related to AFOLU [7] economical activities prefer to refer to carbon balance instead of to carbon footprint, since the former takes into account, not only the emissions, but also the carbon assimilated by agroforestry systems [8].
The impact of AFOLU activities, estimated by Life Cycle Assessment (LCA) methodologies, is largely dependent on the accuracy and scope of their databases; however, many times, only overall values or approximations are available due to the lack of research. Thus, total carbon content is usually obtained by multiplying those rough estimates (derived from structural material, cellulose, and sugar content) by the biomass, disregarding the influence of environmental conditions associated with the location. That is the case for sugar beet, an important industrial crop in the Castilla y León region (Spain), which is mainly cultivated for the production of sugar. In spite of the fact that there are numerous carbon footprint studies for this crop and its sub-products [9], figures about its carbon content from experimental research are scarce and approximations have been used instead [10].
Sugar beet crops have undergone important changes in the last few decades, resulting from improved varieties [11] and better cultural practices: Earlier sowing, higher planting densities, more efficient use of fertilizers, control of pests and diseases, etc. [12]. The productive capacity of sugar beet stems from its ability to intercept radiation for its photosynthetic process, that is, its ability to attain the highest ground coverage as quickly as possible, and to maintain that cover for the maximum possible amount of time, thus it is able to optimize sunlight capture [13]. It is known that the sugar beet crop canopy reaches its maximum when the maximum radiation of the year is already over, due to the slow formation of leaves in spring [14,15]. Beet fixes CO2 and accumulates sugar [16], and sucrose is used by the plant for metabolism conservation, leaves formation, root tissue formation and, finally, for the accumulation of sugar in the root [17]. From the enzymatic point of view, net accumulation of sucrose in the root occurs during the first growth stages, with an increased activity of the sucrose–synthase enzyme and a greater contribution of sucrose from the leaves to the root. Subsequently, a decrease in the polarization (sugar content) increase rate is observed, until it stops or even becomes negative (onset of sucrose invertase activity) [18].
There is some controversy over whether the growth and accumulation of sugar in sugar beet is limited by external conditions (source-limited), namely climate, fertilization, soil, etc. [19,20,21] or if such limitation is ontogenetic (sink-limited) [22,23,24,25]. Milford et al. [26] stated that temperature is the main factor for sugar beet growth and that the thermal time explains the changes in different stages. Villarías-Moradillo and de Liñán and Vicente [27] explained that the heat summation for seedling emergence in Castilla y Leon (Spain) is 120–130 °C·d (10–12 days). Hull and Webb [28], cited in Reference [25], indicated that the length of the growing season has a strong positive effect on sugar beet yield.
There are studies that support the idea that the potential yield of sugar beet mainly depends on the site (soil, climate and interactions) and year effects (weather conditions during vegetation period), while the influence of agronomy would be lower [15]. In line with this, other groups have attempted to resolve the influence of climatic factors on beet growth, both for spring- and autumn-sowing, in connection to different geographical areas, such as Freckleton et al. [29] and Clover et al. [30] in England, Gordo et al. [31] in Spain (for autumn sowing); Petkeviciene [32] in Lithuania; Hoffmann and Kluge-Severin [25,33] in Germany (spring sowing); and Loel and Hoffmann [34] in Germany (autumn sowing).
Other important factors subject to further study are related to the crop’s water needs, which, in turn, are related to precipitation, temperature, evaporative demand, and soil retention capacity [35], although Tanner and Sinclair [36], cited in Reference [37], stated that beet is an efficient user of water. In addition, Fabeiro et al. [38] reported that sugar beet is a drought-resistant plant that can produce economic yield even with reduced irrigation. A deciding factor for obtaining a good harvest is the irrigation during the sprouting season [39], and the soil available water content at field capacity in an optimum soil in Spain was determined to be 12–15% [27].
Another factor to consider is the role played by nitrogen in the expansion of beet leaves in order to capture light [24,40]. Nitrogen concentration in leaves, the plant organ responsible for CO2 fixation, is considered to be an element that modifies the growth rate of both leaves and root storage in a significant manner [41]. It is known that the nitrogen concentration in leaves increases during the first 70 days and then decreases as the growth cycle advances [17]. There are various studies on the optimal fertilization of beet [40,42], on the interaction of fertilization and irrigation [43] and even on the effects of carbon fertilization on this crop [23,24].
As for the composition of beet root, the factors that may influence it have also been investigated, because it is a critical factor for the industrial quality of the root and, in particular, for the sugar extraction process [11,15,44,45]. The composition of beet root at harvest is 77% water and 23% dry matter, with 70–76% sucrose, 18% marc and 6% other substances, such as betaine [17,46]. Marc is a quality variable and consists of all the components that remain insoluble after hot water extraction (at 80 °C), namely cellulose, hemicellulose, pectin substances, saponins, lipids, lignins, etc. The concentration of marc depends on the site and on the variety [46].
In spite of the wealth of studies on the influence of aforementioned factors, to the best of the authors’ knowledge, there are no studies in which significant differences in the percentage of carbon contained in the biomass of sugar beet in different locations have been demonstrated under field conditions. In fact, studies on global carbon cycle and ecological stoichiometry, such as the recent database survey by Ma et al. [47], consider that the variations of plant carbon content are explained more by life form and plant organ than by climatic factors. This statement was taken as the null hypothesis in the study presented herein.
In view of the research gap identified above, the main goal of this research was to deepen our understanding of the various factors that have an influence on the growth of this crop by trying to answer the following question: Is carbon content at harvest (and, in turn, the total amount of CO2 absorbed by sugar beet) location-dependent or not? To put it in other way, do significant differences occur in the carbon content in the plant as a consequence of different locations, soils and climates? To address this question, we assessed the influence of weather/environmental conditions on the amount of carbon sequestered by the crop at four different locations in the Castilla y León region using ANOVA, as wella as factorial and cluster analysis. The chosen region is particularly representative because it accounts for 90% of the Spanish production of spring-sown sugar beet, with 26,573 ha [48]. Moreover, the north of Spain is the area in the European Union in which the highest yields per hectare are attained, with 33.7% of the farmers producing over 120 tons per hectare [39].
While the empirical values of carbon content presented in this work may lead to enhanced precision in the ecological footprint calculations of the sugar industry, the findings on the influence of climatic factors may also have implications for the research of plant ecological stoichiometry and biogeochemical modeling.
2. Materials and Methods
2.1. Field Trials
Field trials were conducted in farm fields at 3 sites in 2011 (1st cultivation year) and at 4 sites in 2012 (2nd cultivation year), all of them were spring-sown sugar beet cultivation areas in the Castilla y León region, in Northwestern Spain (Figure 1). The cultivation periods, from sowing to harvesting, are specified in Table 1.
Daily weather data during the cultivation period (Table 2) were collected from six nearby automatic weather stations belonging to the SIAR (Agroclimatic Information System for Irrigation) network of the MAPAMA (Ministry of Agriculture, Food and Environment of Spain). All stations were within a 20-km radius of the experiment locations.
The weather data in Table 2, namely temperature (T), precipitation (P), evapotranspiration (ETo) and radiation (R), were used as inputs in order to calculate 12 additional climate variables, which are summarized in Table 3.
According to Kenter, Hoffmann and Märländer [15], there is a positive correlation between the growth of roots and leaves and the average temperature during the first days of growth (0–65 days after sowing (a.s.)). In the final period (from 175 days a.s. onwards), the most significant impact on growth would correspond to solar radiation.
Consequently, taking into consideration that temperature and radiation are critical variables in crop development, six cumulative radiation variables (R1 to R6) and three average temperature variables (T1 to T3) were calculated, taking as a reference the number of days after sowing. Thus, it was possible to distinguish between the accumulated radiation or temperature in the early stages of cultivation (R2, R4, T1, T2), from the end of the first stages until harvest (R3) and in the final stages of vegetative life (R5, R6).
In addition, 18 °C was taken as the ideal average temperature for root growth during the summer months (T3), assuming that a loss of dry matter accumulation occurs if the crop deviates from that optimum temperature [15].
Variables related to thermal time (GDD, growth degree-day) were calculated daily and on an accumulated basis, using a base temperature of 3 °C [26,49]. GDD was strongly related to phenological development and growth stage [50].
Previous works by Milford et al. [51] suggested that ca. 750 °C·d is necessary for beet to form a closed canopy, while Malnou, Jaggard and Sparkes [42] reported that 900 °C·d and 100 kg N·ha−1 were required for the crop to reach 85% canopy. Kenter, Hoffmann and Märländer [15] concluded that leaf dry matter increases linearly, while that of the roots increases in an exponential way, up to 1200 °C·d.
Soil characteristics and fertilization for the locations under study are shown in Table 4. Sowing and harvest dates, fertilization, irrigation and other agronomic practices were decided and carried out by farmers under AIMCRA (Spanish Research Association for Sugar Beet Crop Improvement) recommendations for optimum yield [52]. Therefore, it was assumed that, as plots received the full recommended rate of nutrients and irrigation, the weather conditions were the main factor modifying the plants growth and final yields [41]. Nutrient and water availability were not assumed to be limiting factors for beet growth.
Two commercial sugar beet varieties were sown: One with a high sucrose content and another with a high yield, in comparison to test varieties [39]. The first type was represented by Dulzata Hilleshög-Syngenta (Landskrona, Sweden) in 2011 and by Amalia KWS (Einbeck, Germany) in 2012, while Sandrina KWS (Einbeck, Germany) was chosen as the second type for both years. The average population density was 125,000 plants·ha−1 in all the sites (considering a sowing distance of 13.7 cm and a seedling emergence of 86%), and also for both years. Herbicides were applied following AIMCRA’s recommendations and pesticides were also used when necessary. However, damage by nematodes was still reported in Magaz (site M) in 2011. In 2012, leaves from Laguna de Negrillos (LN-II) plants could not be collected. In 2011, the experimental treatments were conducted at three sites, with two levels of fertilization (N, which is the optimum recommended for each location—specified in Table 4—and 2 × N, which is twice the recommended dose, to corroborate the suitability of the application rates defined by AIMCRA) and for the two aforementioned varieties. In 2012, only the effect of location (four different sites) and the variety (two varieties) were assessed, and the fertilization factor was excluded (in the previous year it was verified that it had no influence on the root carbon content). In 2011, experiments were arranged in a split-plot design, in three randomized blocks of 12 plots, with nitrogen as the main factor and three replications. In 2012, the trials were conducted in a completely randomized block design with two replications (8 plots). In both years, each plot’s surface area was 9.75 m2 and consisted of 3 rows (6.5 × 1.5 m), out of which only the beets of the central row were harvested. A 2-m spacing between subplots was established to avoid possible interference. Entire plants were manually harvested on the same date that farmers began to harvest their fields.
2.2. Analyses
The plants were divided into leaves, crowns (the part of the root system that sticks out of the ground and from which stems arise, which represents 3–10% of the root) [17] and roots at the laboratory, where they were separately washed and weighed to determine fresh matter. Then, each part was cut up and oven-dried at 105 °C until constant weight was reached, so as to determine the dry matter content. After, the oven-dried materials were milled and homogenized, and the powder was passed through an oscillating granulator using a 1 mm sieve.
In order to measure carbon and nitrogen contents, samples were analyzed using a LECO CHN–2000 (LECO Corp., St. Joseph, MI, USA). Along with ethylenediamineteraacetic acid (EDTA) calibration samples, dry matter samples were placed into tin foil wrappers (100 to 150 mg) and loaded into the analyzer, where they were combusted in a resistance furnace (at 950 °C) using pure oxygen. Combustion gas was collected and used for nitrogen determination via a thermal conductivity cell. Carbon was detected using infrared detection. Carbon and nitrogen were measured concurrently with a total analysis time of 4 minutes. The final results are reported as weight percentages.
Thirty-five variables were calculated out of fresh weights (6 variables), dry weights (10 variables), and carbon (10 variables) and nitrogen contents at harvest (9 variables) (see Table 5). Thus, measurements relative to fresh weight and dry weight per organs (leaves, crown and root) and per plant were obtained. From these primary variables, the percentage of dry matter in each of the organs was calculated. The product of these percentages and the concentrations of carbon and nitrogen obtained in a LECO CHN–2000 (LECO Corp., St. Joseph, MI, USA) analyzer resulted in the total amount of these elements in each organ, in the whole plant and per hectare—provided that the number of plants per unit of area was also known. In this way, it was possible to estimate the total absorbed nitrogen or the captured CO2. In addition, the carbon content in root to nitrogen content in leaves ratio (CNR) was also calculated, together with the ratio of root to leaves fresh weights (RTLR) [53]. CO2 uptake was obtained by multiplying dry matter, C content and a C to CO2 conversion factor (ratio between the molecular mass of CO2 and the atomic mass of C: 44/12).
In order to simplify the result interpretations, a selection of these variables, which would be essential to achieve the goals of the research, was conducted, excluding redundant variables and those related to the crown organ.
2.3. Statistics
The statistical analysis of the data was carried out using STATISTICA 8.0 (StatSoft Inc., Palo Alto, CA, USA) for the analysis of variance (ANOVA) and for subsequent tests for homogeneity of variances, normal distribution and independence. Levels of significance were indicated as follows: * (p < 0.05), ** (p < 0.01) and *** (p < 0.001). Tukey’s HSD was chosen as a post-hoc test to compare the significance of pairwise differences between means.
In addition to this, principal component analysis (PCA) and cluster analysis (CA) multivariate techniques were also applied, using IBM SPSS Statistics 21 (IBM Corp., North Castle, NY, USA). PCA was used to determine patterns in the dataset by reducing the observed variables into a smaller number of principal components (artificial variables) that accounted for most of the variance in the observed variables [54]. For all the analyses, orthogonal rotation Varimax was used. Barlett’s sphericity test (p < 0.050) and Kaiser-Meyer-Olkin (KMO) measure of sampling adequacy test (KMO > 0.50) were successfully satisfied [55] for the analyses shown in the results. The new variables (components) obtained accounted for more of the 68% of the accumulated variance in all cases. Among all the different PCAs conducted using different combinations of variables, only those which resulted in two components and which met Barlett’s, KMO and variance criteria were selected. The obtained components were interpreted, taking into account only those variables with loadings larger than 0.5 as an absolute value.
Two-dimensional plots were generated in order to allow a clearer interpretation of the correlation or influence between variables. The distance of a variable from the center (0,0) indicates its influence, which increases for distant positions. The correlation between variables is given by the angle to the center, with an acute angle indicating a positive correlation and an obtuse angle indicating a negative correlation [34].
CA was used to detect natural segregation of data (subsets), since it provides strong evidence for statistically significant differences between samples of a dataset [56]. In this study, CA was carried out by using the Two-Step Cluster Analysis procedure. Datasets were plotted in 3D dispersion graphs in which the axes were the new variables calculated after PCA and the plot color was defined by the cluster membership variable created in the CA analysis procedure.
3. Results
In order to conduct a rigorous analysis of the influence of location, crop variety and type of fertilization, and specific conditions of each cultivation year on the carbon content of sugar beet root and on the other studied variables, an ANOVA analysis was first carried out, followed by PCA so as to determine the environmental factors that most influenced the crop in each area and in each cultivation year.
3.1. Plant Variables at Harvest
The results of the ANOVA analysis for 11 selected harvest variables are summarized in Table 6 and Table 7 for each of the factors under study (location, variety and fertilization) and for the two cultivation years: (i) fresh weight and yield (PWF, yield, LWF and RTLR); (ii) carbon content in root, dry weight and CO2 (RC, RDM, PDM and TCO2) and (iii) nitrogen content in the leaves, total N absorption and carbon to nitrogen ratios (LN, TN and CNR). The factorials Site × Fertilization (1st cultivation year) and Site × Variety (2nd cultivation year) only showed statistical significance when at least some of the factors also showed it separately (Table 6). Site × Variety (1st cultivation year) factorial never showed statistical significance, and Variety × Fertilization (1st cultivation year) only did for RDM (root dry matter content) variable (p < 0.05).
The results for Tukey’s HSD post-hoc test for the location factor are also presented at the end of this section.
3.1.1. Fresh Weight and Yield
Regarding the location factor, the first step was to study the fresh weight and yield (PFW, LFW, yield, RTLR) variables, finding that—in both cultivation years—the results showed highly significant statistical differences between the means of the fresh weight and yield variables in the treatments at different locations, except in 2012 for plant fresh weight (PFW) (see Table 6 and Table 7). PFW presented statistical significance in 2011 due to the fact that Villavieja (VV-I) was the location with the highest root yield (yield = 120.94 t·ha−1), highest leaf weight (LFW = 524.29 g·plant−1) and highest total plant fresh weight (PWF = 1808.29 g·plant−1). In the second year (2012), Villavieja (VV-II) was again the location with the highest yield (yield = 124.38 t·ha−1), but the leaf fresh weight (LFW) was higher in Pampliega (639.52 g·plant−1 vs. 482.26 g·plant−1) and the differences in the total plant fresh weight from one location to the other (PFW = 1789.46 g·plant−1 vs. 1754.70 g·plant−1 for P and V-II, respectively) were small, which accounted for the fact that no statistical significance was obtained.
In 2011, the roots to leaves weight ratio (RTLR) achieved its highest value in Magaz (3.58) in comparison to Laguna de Negrillos (1.68) or Villavieja (1.99). In 2012, the highest RTLR ratio was attained in Vertavillo (2.83), followed by Villavieja (2.23) and Pampliega, with a significantly lower value (1.43).
With regard to the variety factor, in 2011 (Dulzata vs. Sandrina varieties) significant differences in the leaves fresh weight (LFW) and in its ratio with the root fresh weight (RTLR) could be observed, while in 2012 (Amalia vs. Sandrina varieties) the significance was reflected in the yield. This yield was higher for Sandrina variety, both in 2011 (96.98 t·ha−1 vs. 95.14 t·ha−1 for Dulzata) and in 2012 (120.80 t·ha−1 vs. 104.45 t·ha−1 for Amalia). The same applied to fresh weight (PWF) both in 2011 (1428.20 g·kg−1 for Sandrina vs. 1288.21 g·kg−1 for Dulzata) and in 2012 (1806.58 g·kg−1 for Sandrina vs. 1579.32 g·kg−1 for Amalia). There was an exception for RTLR in 2011 at the Magaz site. On the other hand, the populations that showed higher polarization or sugar·ha−1 content were always those in which the Amalia variety was cultivated, as compared to those with Sandrina variety (17.9% vs. 16.28%, respectively, in Vertavillo; 17.73% vs. 16.65% in Villavieja; 17.68% vs. 16.83% in Pampliega; and 18.78% vs. 17.48% in Laguna de Negrillos) [57].
In relation to the fertilization factor, in a similar fashion to the trend observed for the varieties, significant differences were observed in the leaf fresh weight (LFW), in the total plant fresh weight (PFW) and in the RTLR ratio, but not in the yield.
3.1.2. Root Carbon Content, Dry Matter and CO2
The average carbon content in the dry matter of roots was 434.05 g·kg−1 in the first year and 437.46 g/kg in the second cultivation year.
In relation to the location factor effect on the C content in the root (RC), the highest concentrations of C content in the root (RC) were attained in Laguna de Negrillos, both in 2011 and in 2012 (449.65 g·kg−1 and 446.25 g·kg−1, respectively), as also occurred for root dry matter content (RDM = 251.26 g·kg−1 in 2011 and 243.62 g·kg−1 in 2012). These concentrations were higher than those obtained in other populations, such as Magaz in 2011 or Pampliega in 2012.
In 2011, Villavieja was the location with the highest plant dry weight (PDW = 332.77 g) and CO2 uptake (TCO2 = 63.84 CO2·ha−1), calculated as a summation of the products of the amount of dry matter and the carbon content in each of the three parts of the plant. On the other hand, in 2012, the highest PDW and CO2 assimilation occurred in Pampliega (PDW = 352.23 g; TCO2 = 69.42 CO2·ha−1).
With reference to the sugar beet variety factor, and as regards the amount of dry matter (RDM) in 2011, only the interaction of Variety × Fertilization was found to be significant. In 2012, statistical significance was only verified for Amalia variety vs. Sandrina variety (240.13 vs. 227.16, respectively).
In relation to the fertilization factor, no statistical significance was found for any of the variables related to the root carbon content, dry matter content or CO2 (RC, RDM and TCO2).
3.1.3. Nitrogen Content in the Leaves, Total Nitrogen Absorption and Carbon to Nitrogen Ratio
Regarding the location factor and its effect on the nitrogen content in leaves, on the total N absorption and on the CNR ratio (LN, TN and CNR), the locations in which more N absorption took place (i.e., Villavieja-I and Pampliega) led to an increased production in terms of fresh weight. With respect to the N content in leaves (LN), and the lowest concentration was found in Laguna de Negrillos in 2011 (19.61 g/kg) and in Vertavillo in 2012 (19.18 g/kg), accompanied by the highest root carbon content in Laguna of Negrillos in 2011 (449.65 g/kg) and the second highest one in Vertavillo in 2012 (441.00 g/kg).
In connection with the variety factor, no significant differences in the absorption of nitrogen (TN) could be found, although it was higher for the Sandrina variety, both in 2011 (375.95 kg/ha vs. 345.15 kg/ha for Dulzata) and in 2012 (436.64 kg/ha vs. 381.71 kg/ha for Amalia). However, significant differences could be found in the leaf nitrogen concentration (LN), which was higher for the Sandrina variety both in 2011 (2.20 g/plant vs. 2.16 g/plant for Dulzata) and in 2012 (2.14 g/plant vs. 2.00 g/plant for Amalia). The results for CNR ratio showed that it was lower for the Sandrina variety, both in 2011 (19.88 vs. 21.25 for Dulzata) and in 2012 (20.73 vs. 22.01 for Amalia).
Concerning the fertilization factor, as happened for the variety factor, there were significant differences in the concentration of nitrogen in leaves (LN) and in the total amount of absorbed nitrogen (TN).
3.1.4. Tukey’s Test
The values in bold in the ANOVA analysis results (see Table 6 and Table 7) indicated which site contributed the most to the significance of the different variables according to Tukey’s HSD post-hoc test. It was evinced that, in 2011 the significant differences regarding the yield variable were attributable to the high figures obtained in Villavieja. Laguna de Negrillos was the site that contributed most to the significant differences in the RC, LN and CNR variables, while Magaz contributed most to LFW, RTLR and TCO2. In 2012, Tukey’s HDS test, by pairwise comparison of means, attributed the statistical significance in the yield variable to the low value at Laguna de Negrillos. In RC, LN, CNR, RDM and TN, Tukey’s test variables pointed at the differences between Pampliega (P) and Laguna de Negrillos (LN-II) (when data was available) as the source of the statistical significance of the site factor.
3.2. Climatic Variables
The climatic variables derived from the data collected at the weather stations during the cultivation periods in 2011 and 2012 are shown in Table 8. It is worth noting that the length of cultivation period for the three locations in which the experiments were conducted in 2011 was 190 days on average, due to the fact that the planting date was somewhat late (13 April) in the case of Laguna de Negrillos-I (LN-I). This led to differences in some climatic variables, such as the average temperature and radiation: for LN-I during the first 65 days (T1/R4) it was 14.9 °C/1481 MJ·m−2, higher than the 13.5 °C/1153 MJ·m−2 registered in Magaz (M) and the 12.2 °C/1240 MJ·m−2 registered in Villavieja (VV-I). The precipitation in LN-I (182 mm, Table 2) was also slightly higher than in Magaz (100 mm) or in Villavieja (134 mm). On the other hand, the cultivation period (CP) in 2012 for the four sites in which the experiment was repeated (P, LN-II, V and VV-I) was on average 209 days, i.e., slightly longer than in 2011. If the accumulated radiation (R1 to R6) for the different seasons in 2011 and in 2012 is compared, it was almost always higher in 2012, except for Vertavillo (because planting was delayed until late March).
In Section 3.2.1. and Section 3.2.2., the variables subject to PCA for each of the conducted assays are shown together with the generated graphs and their rotated components loadings and commonalities, that is, the percentage of variance explained by the components [34].
As a consistent research criterion, we have resorted to a 3D representation from the principal component analysis, through segregation in clusters. In Figures S1 and S2 it is possible to observe the organization of the initial data, and the aggregates or clusters corresponding to an adequate sample selection of the sites chosen for the study in 2011 and 2012 can be easily identified. For a better understanding of the results, these have been reported separately for each year of study.
3.2.1. First Cultivation Year
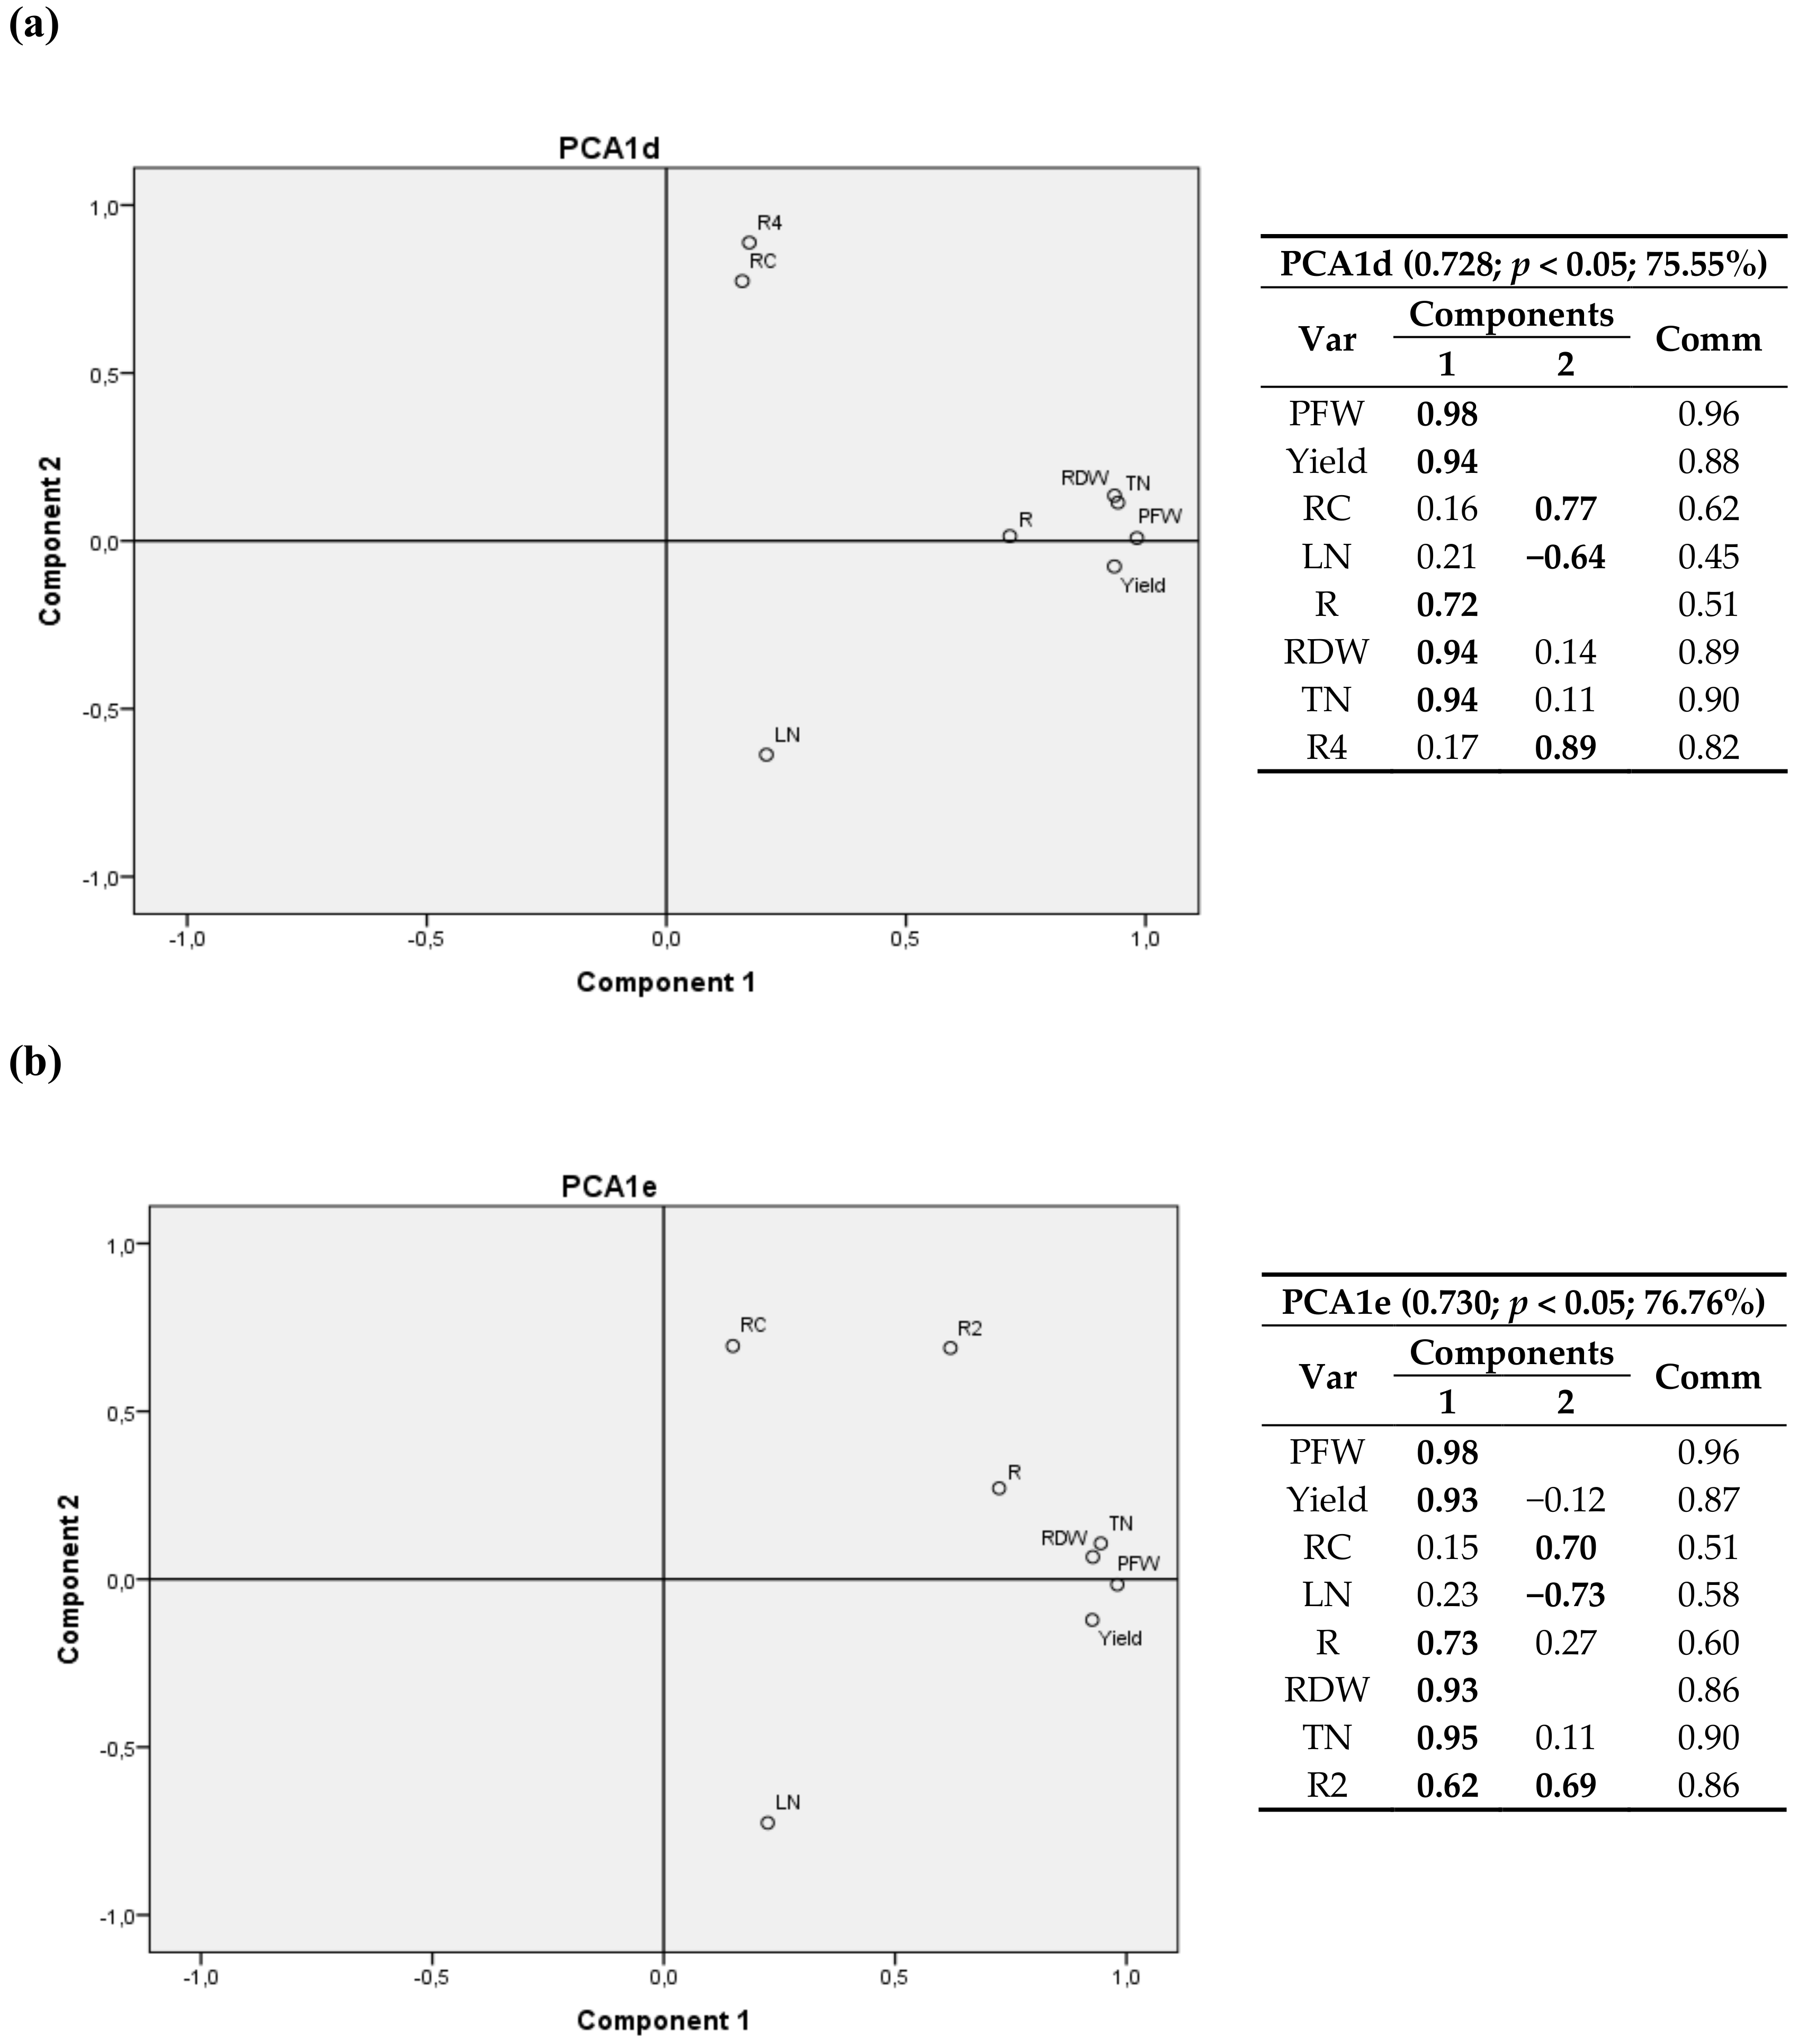
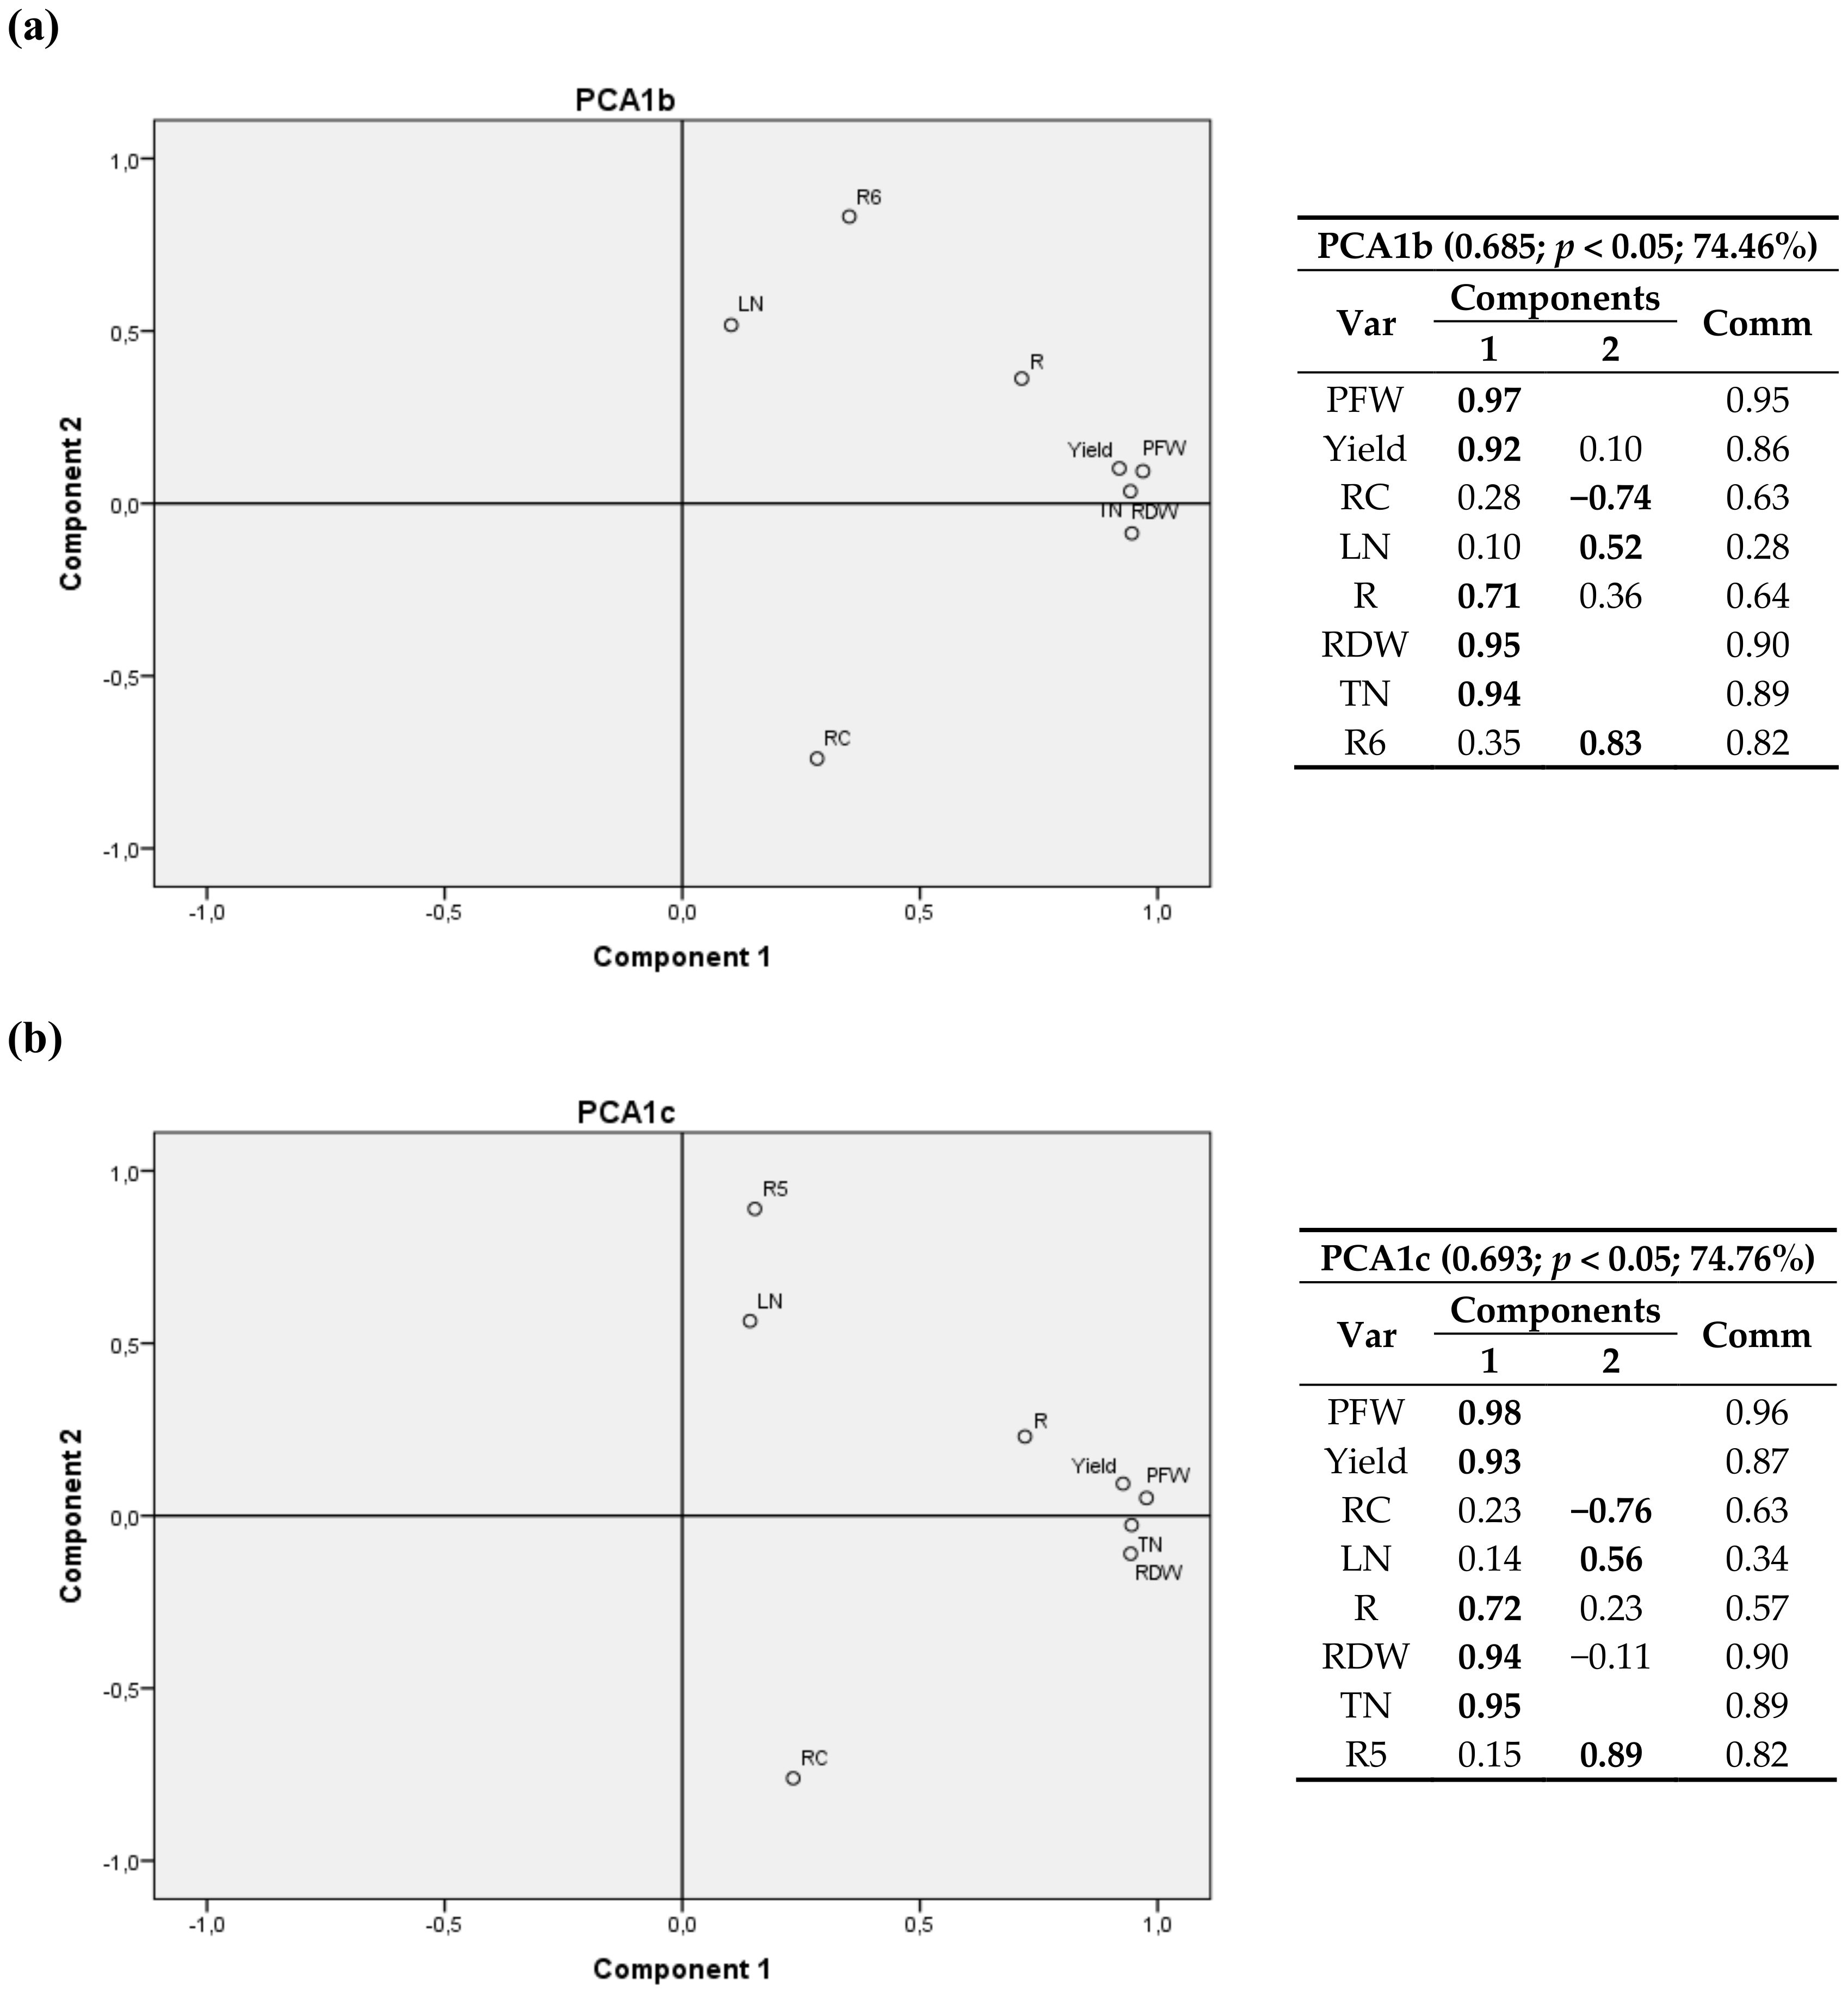
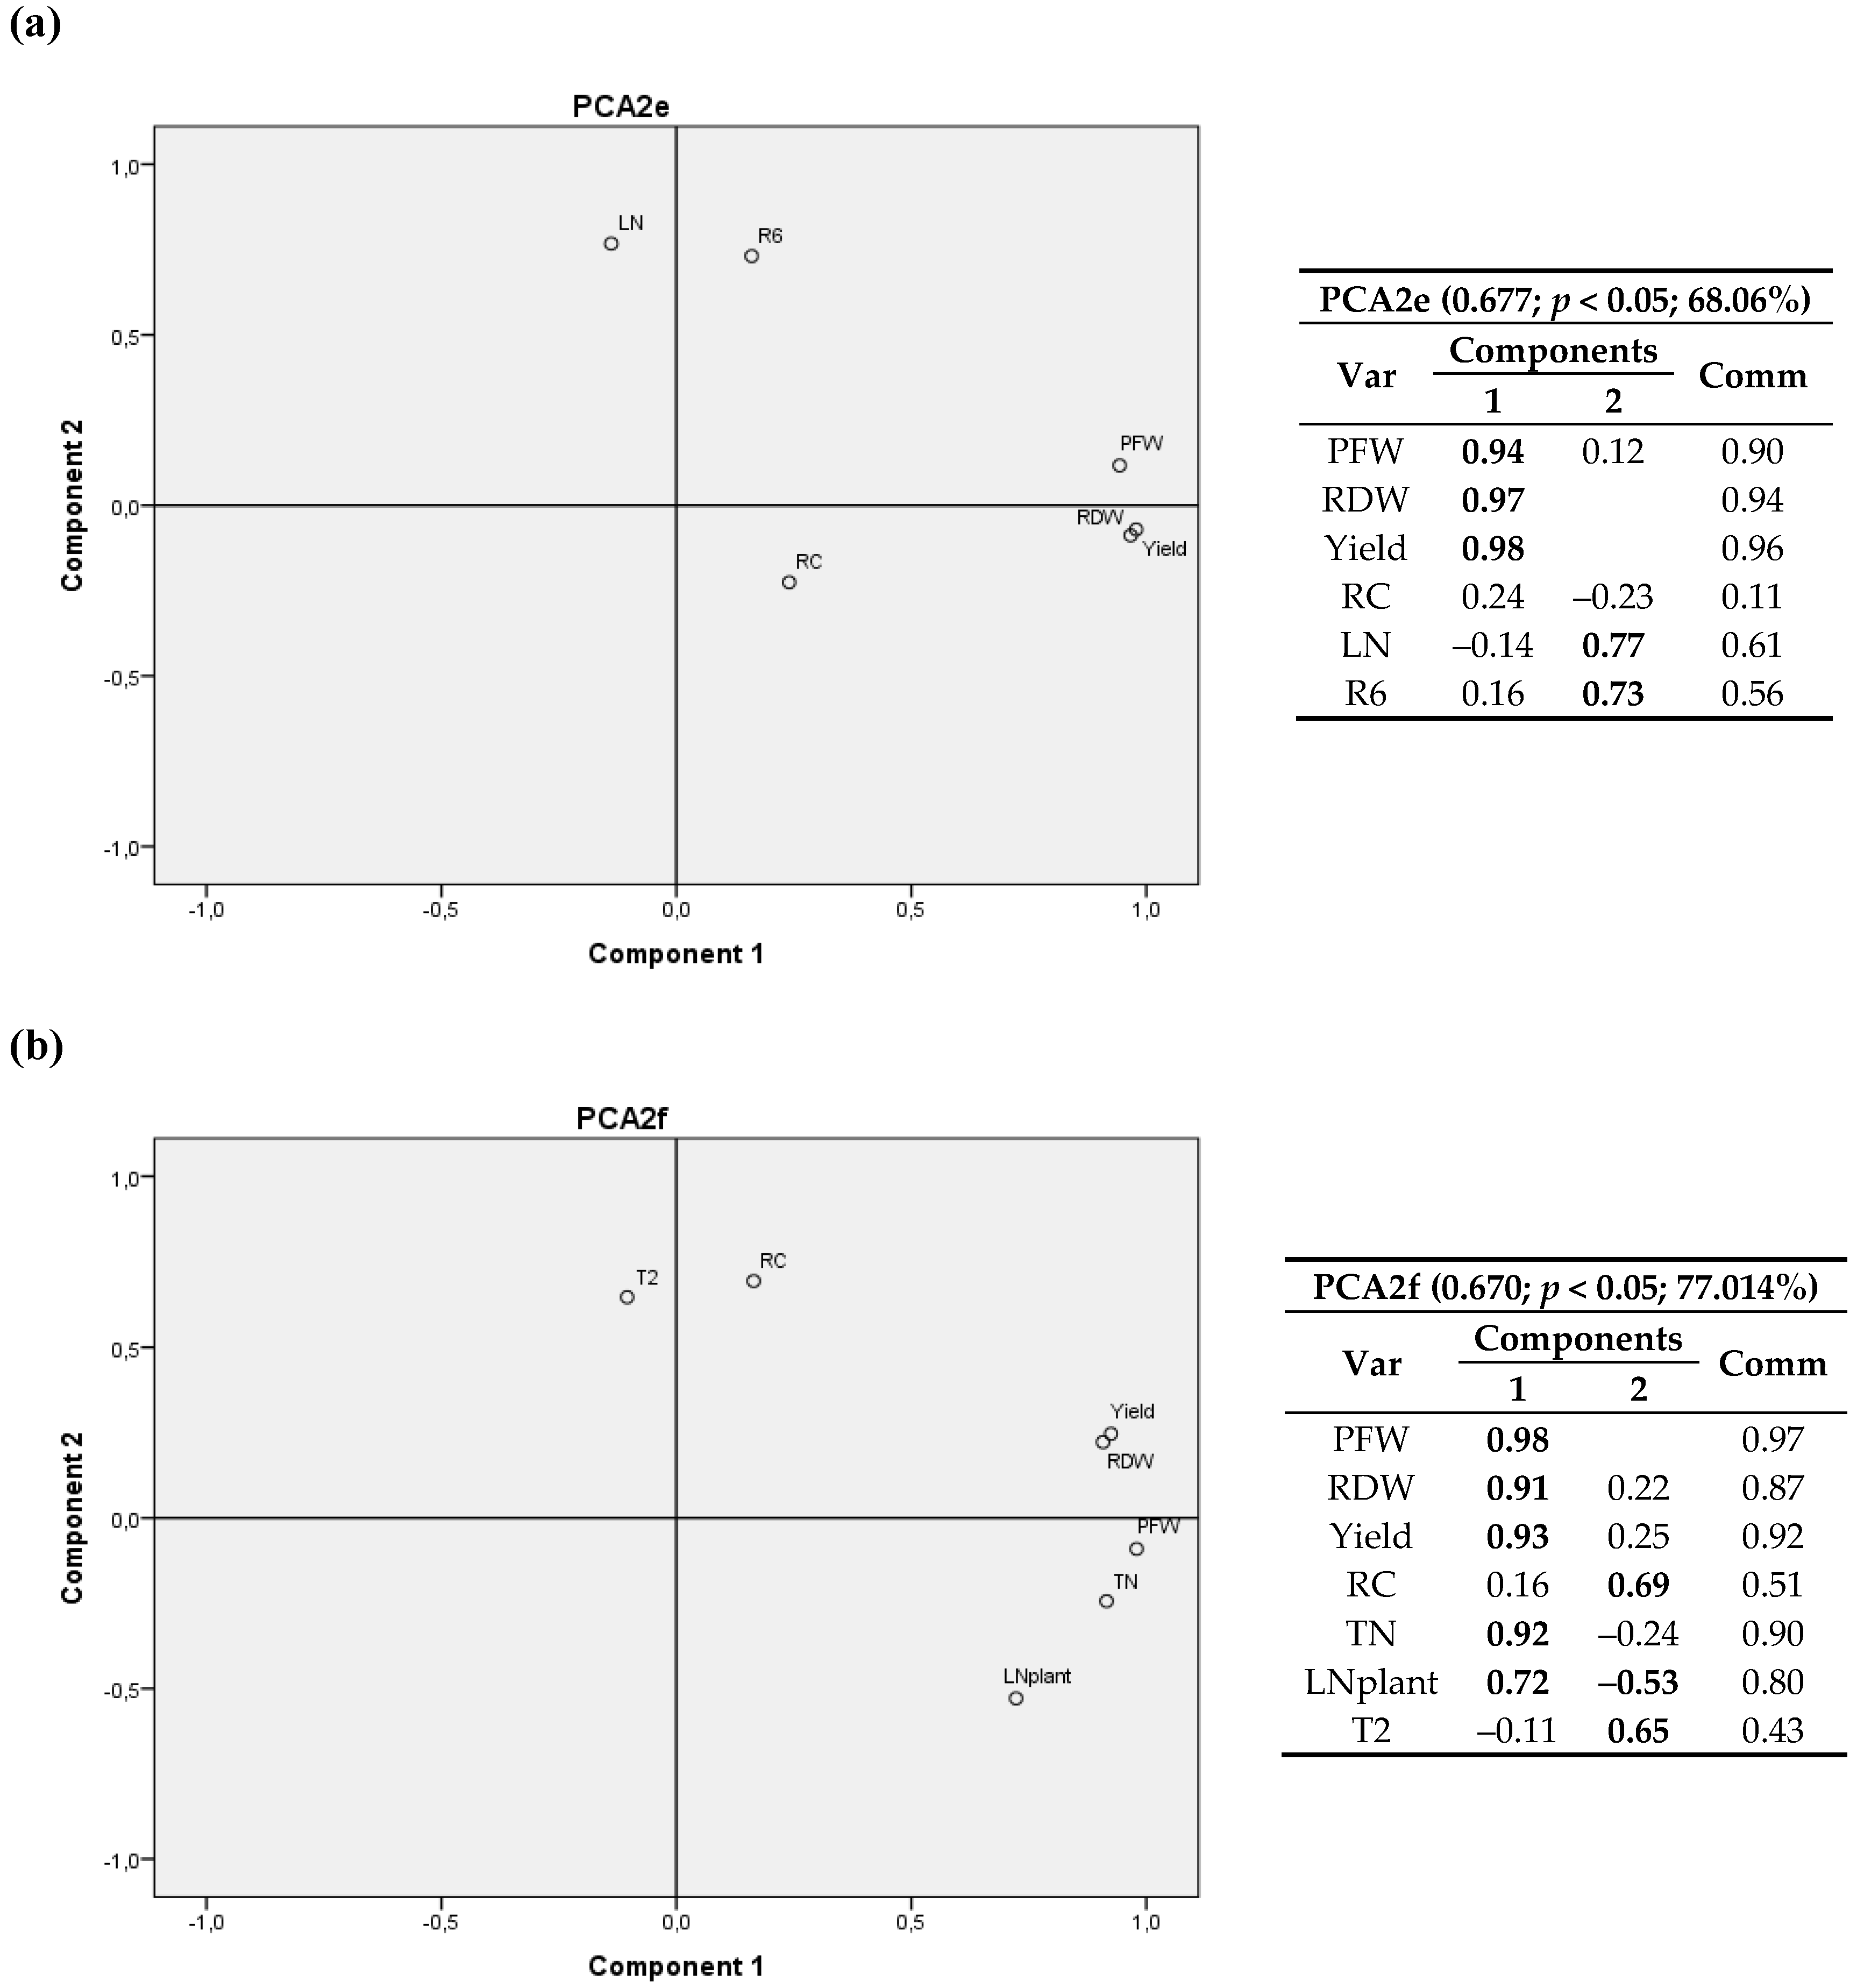
A 3D graph corresponding to first cultivation year is shown in Figure S1. Component 1 is positively correlated with crop growth variables (PFW, Yield, RDW and TN/plant), the second component shows a strong relationship with cumulative radiation climatic variables R and R3, and the third component has the highest correlations for nitrogen content in the leaves (LN)—positive correlation—and for carbon content in roots (RC)—negative correlation.
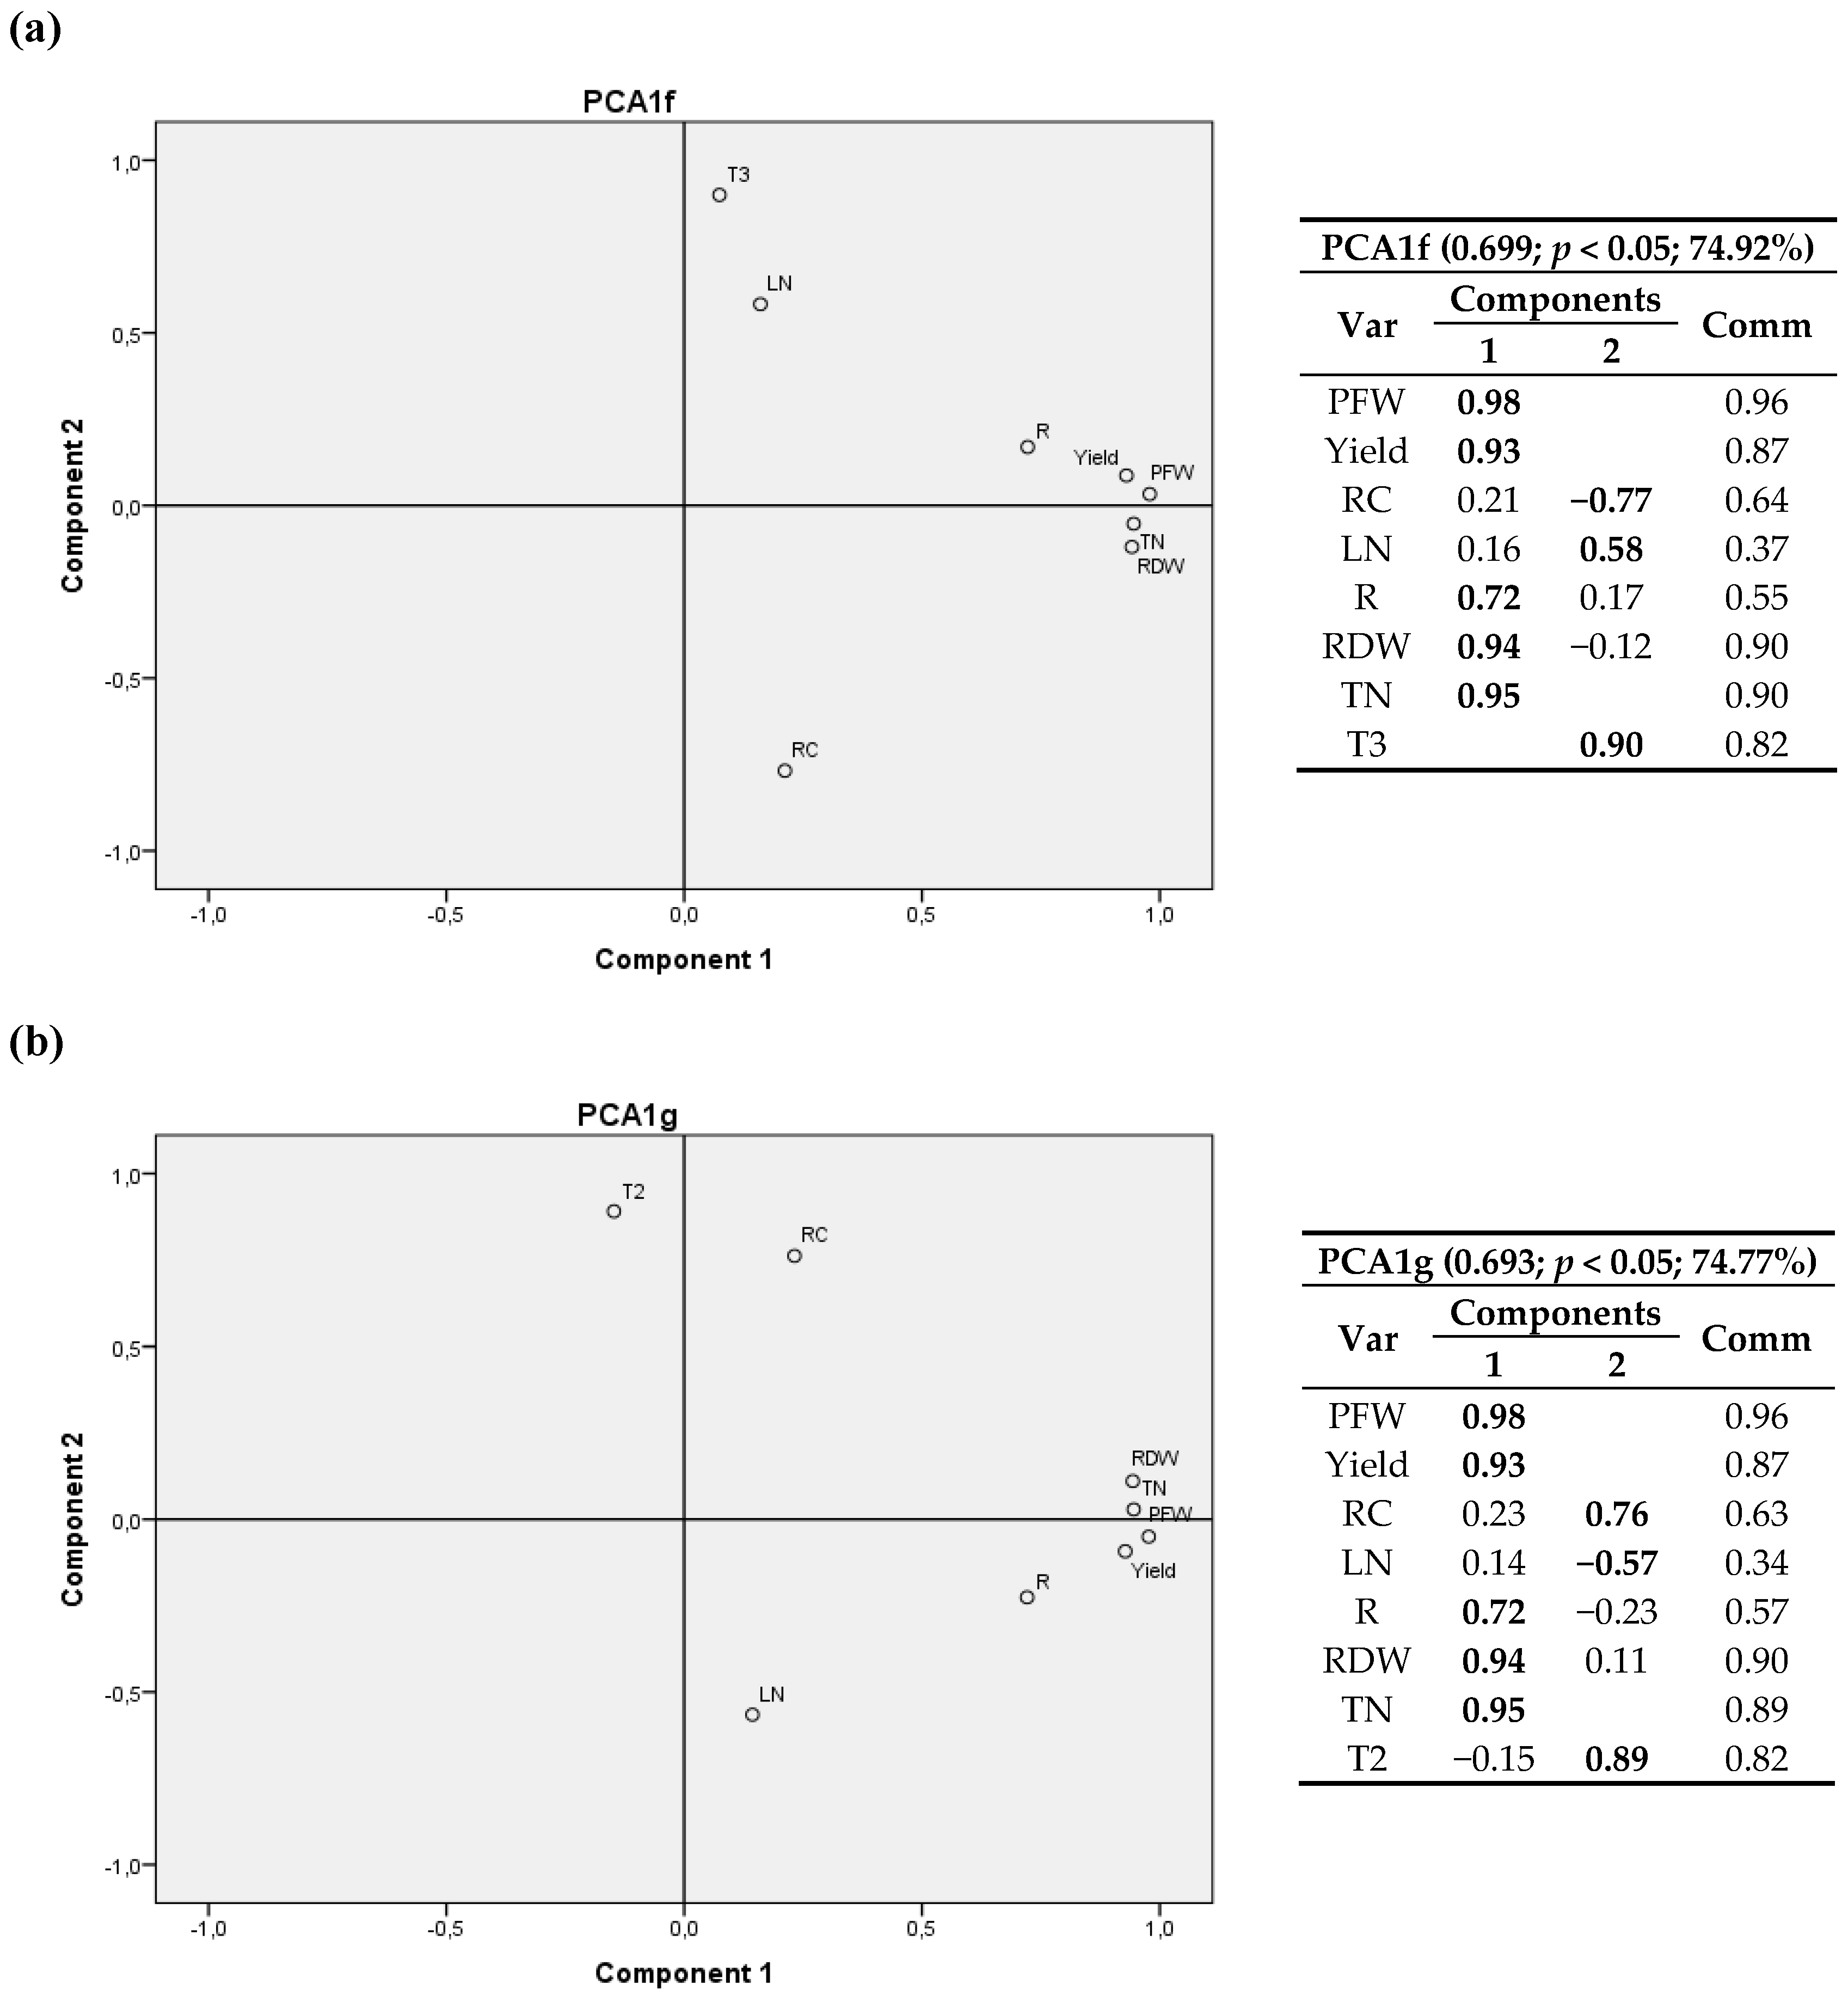
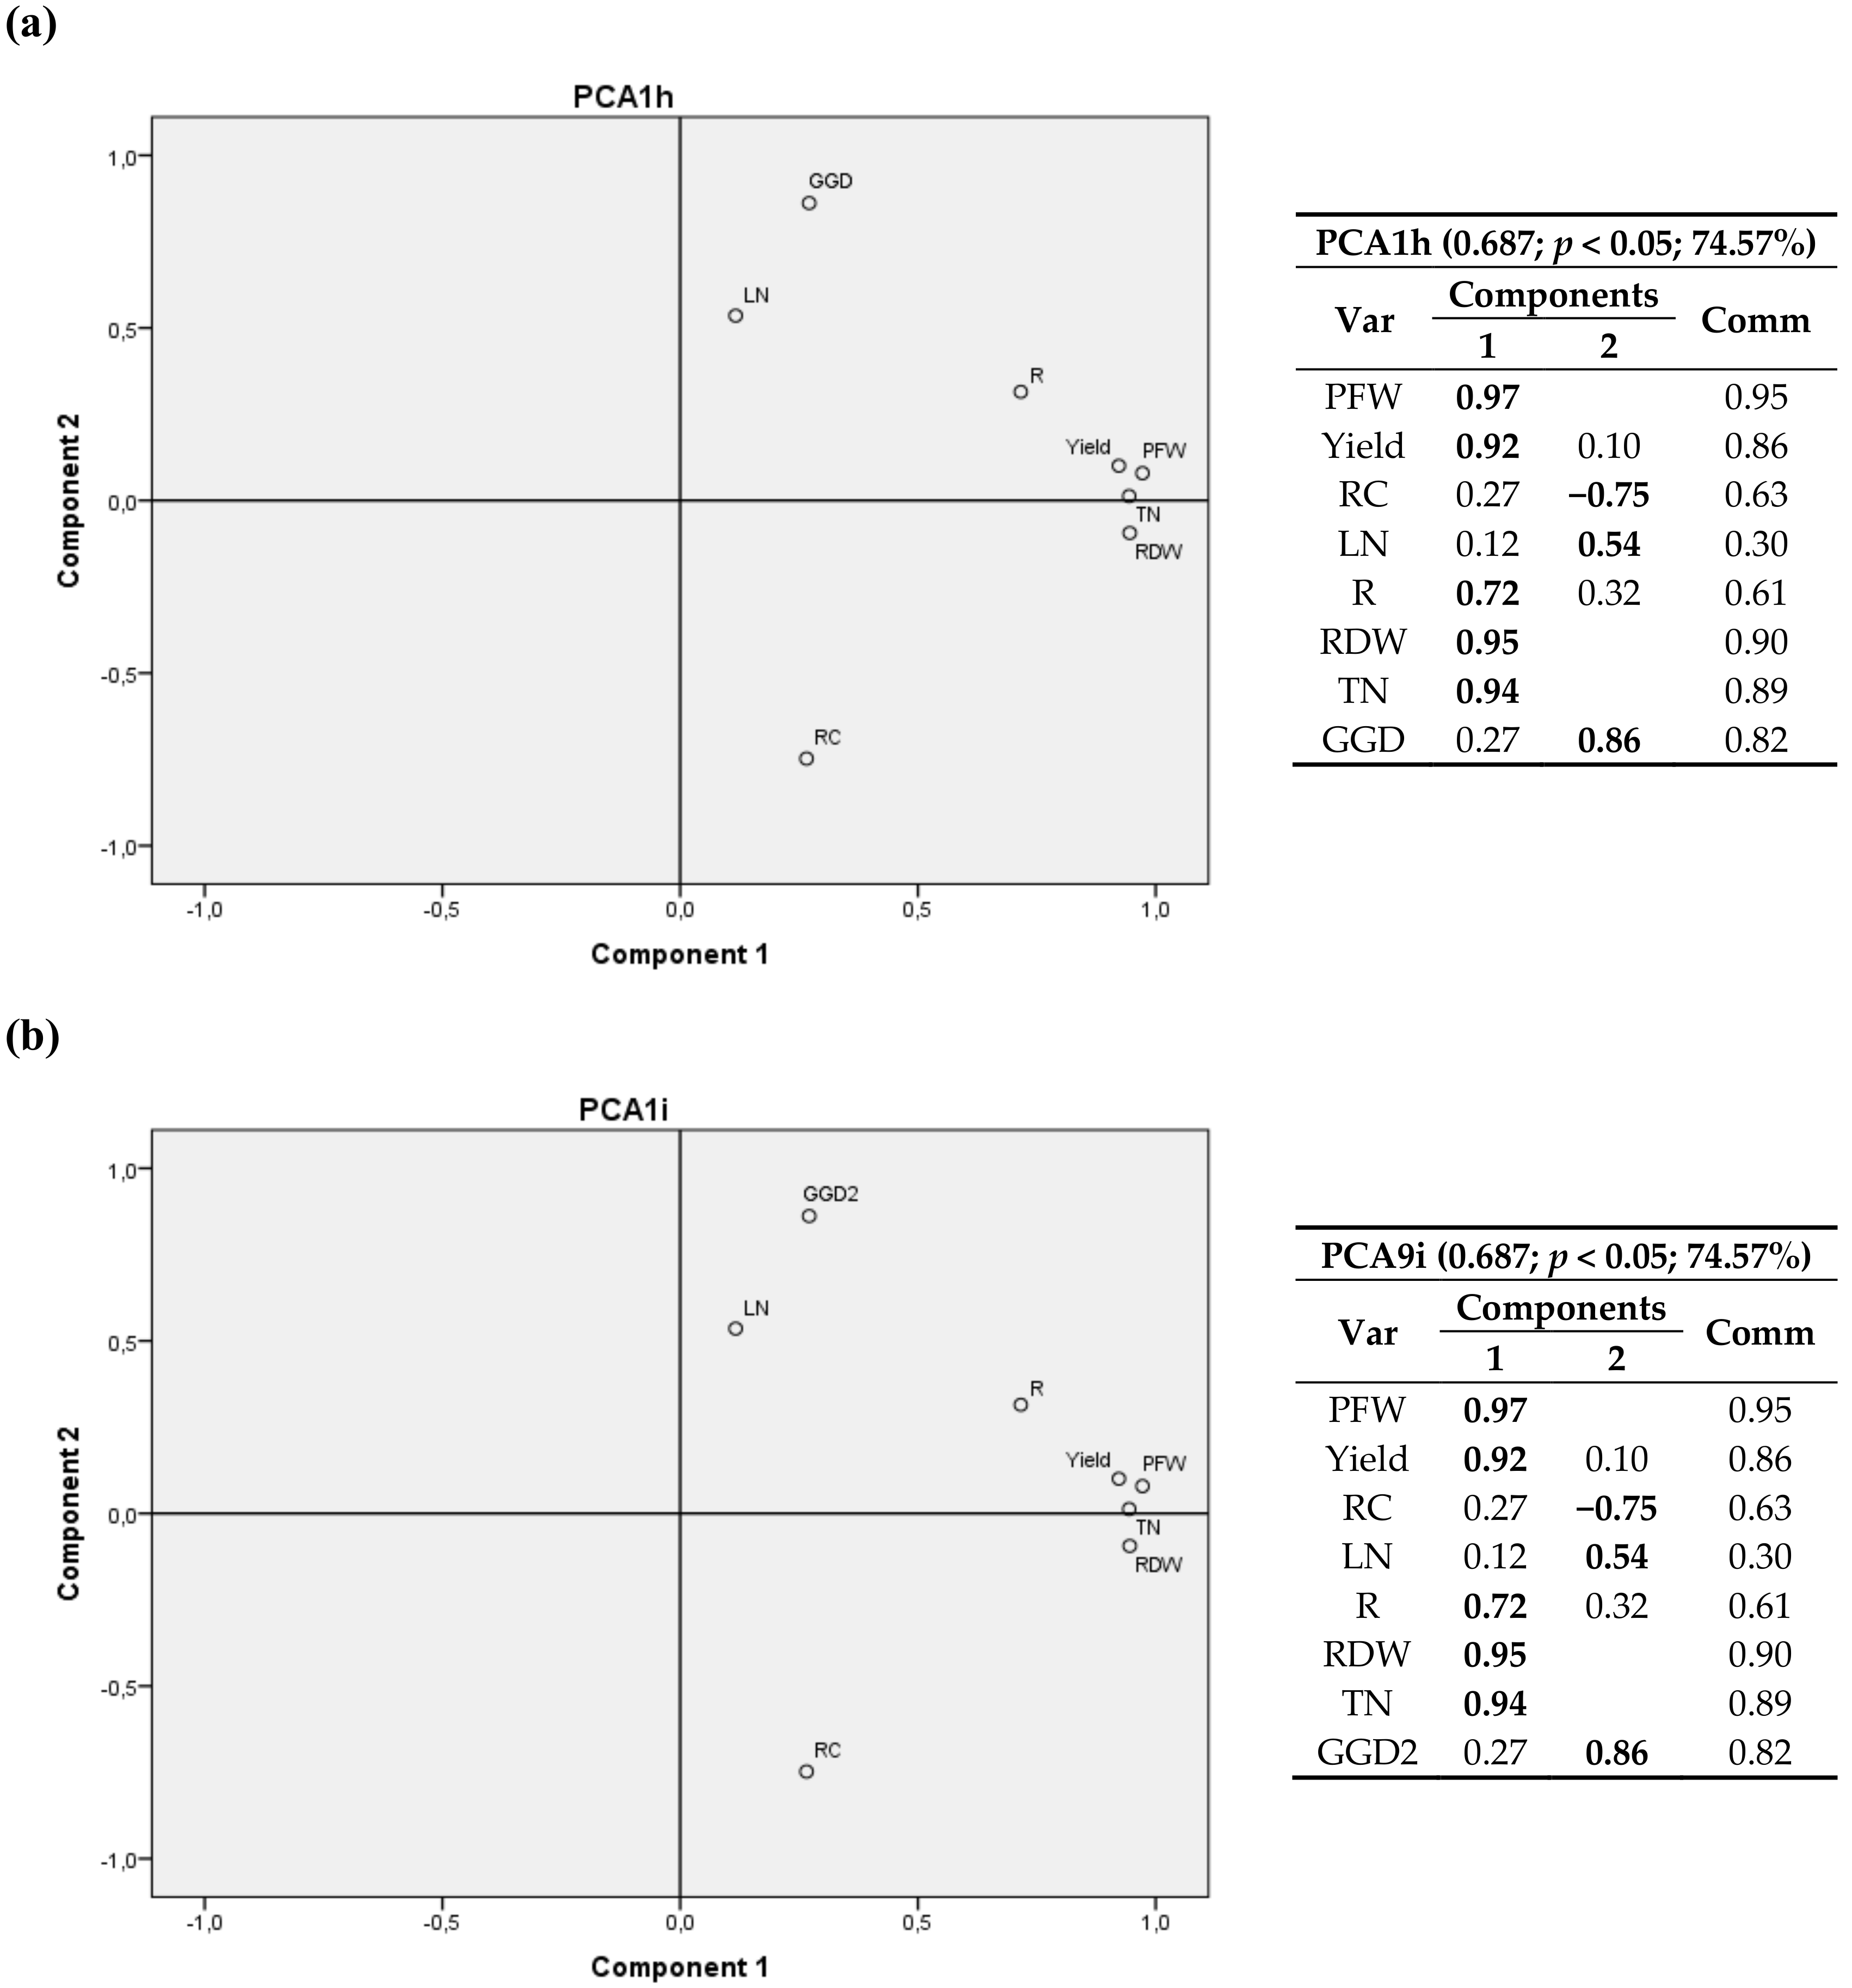
The relationship between components is depicted in eight bivariate plots in rotated space for 2011 (Figure 2, Figure 3, Figure 4 and Figure 5). PFW, yield, RC, LN, R, RDW and TN were fixed and then calculated radiation variables (R2, R4, R5 and R6), temperature variables (T2 and T3) and thermal time (GGD and GGD2) were sequentially tested. For all the analyses, component 1 was correlated with PFW, Yield, R, RDW and TN. Component 2 was correlated with RC, LN and the calculated climate variable chosen in each instance.
RC had a positive correlation with R2, R4 and T2 (same for T1, and a negative correlation with R6, R5, T3, GGD and GGD2.
One may also notice that R2, the accumulated radiation up to 1200 °C·d a.s., had virtually the same weight in the two components, with a positive correlation with RC and crop variables.
GGD and GGD2 variables, i.e., the total thermal time after planting and the accumulated thermal time from 1200 °C·d until harvest, showed a positive relationship with the nitrogen content in leaves and a negative correlation with the carbon content in root.
3.2.2. Second Cultivation Year
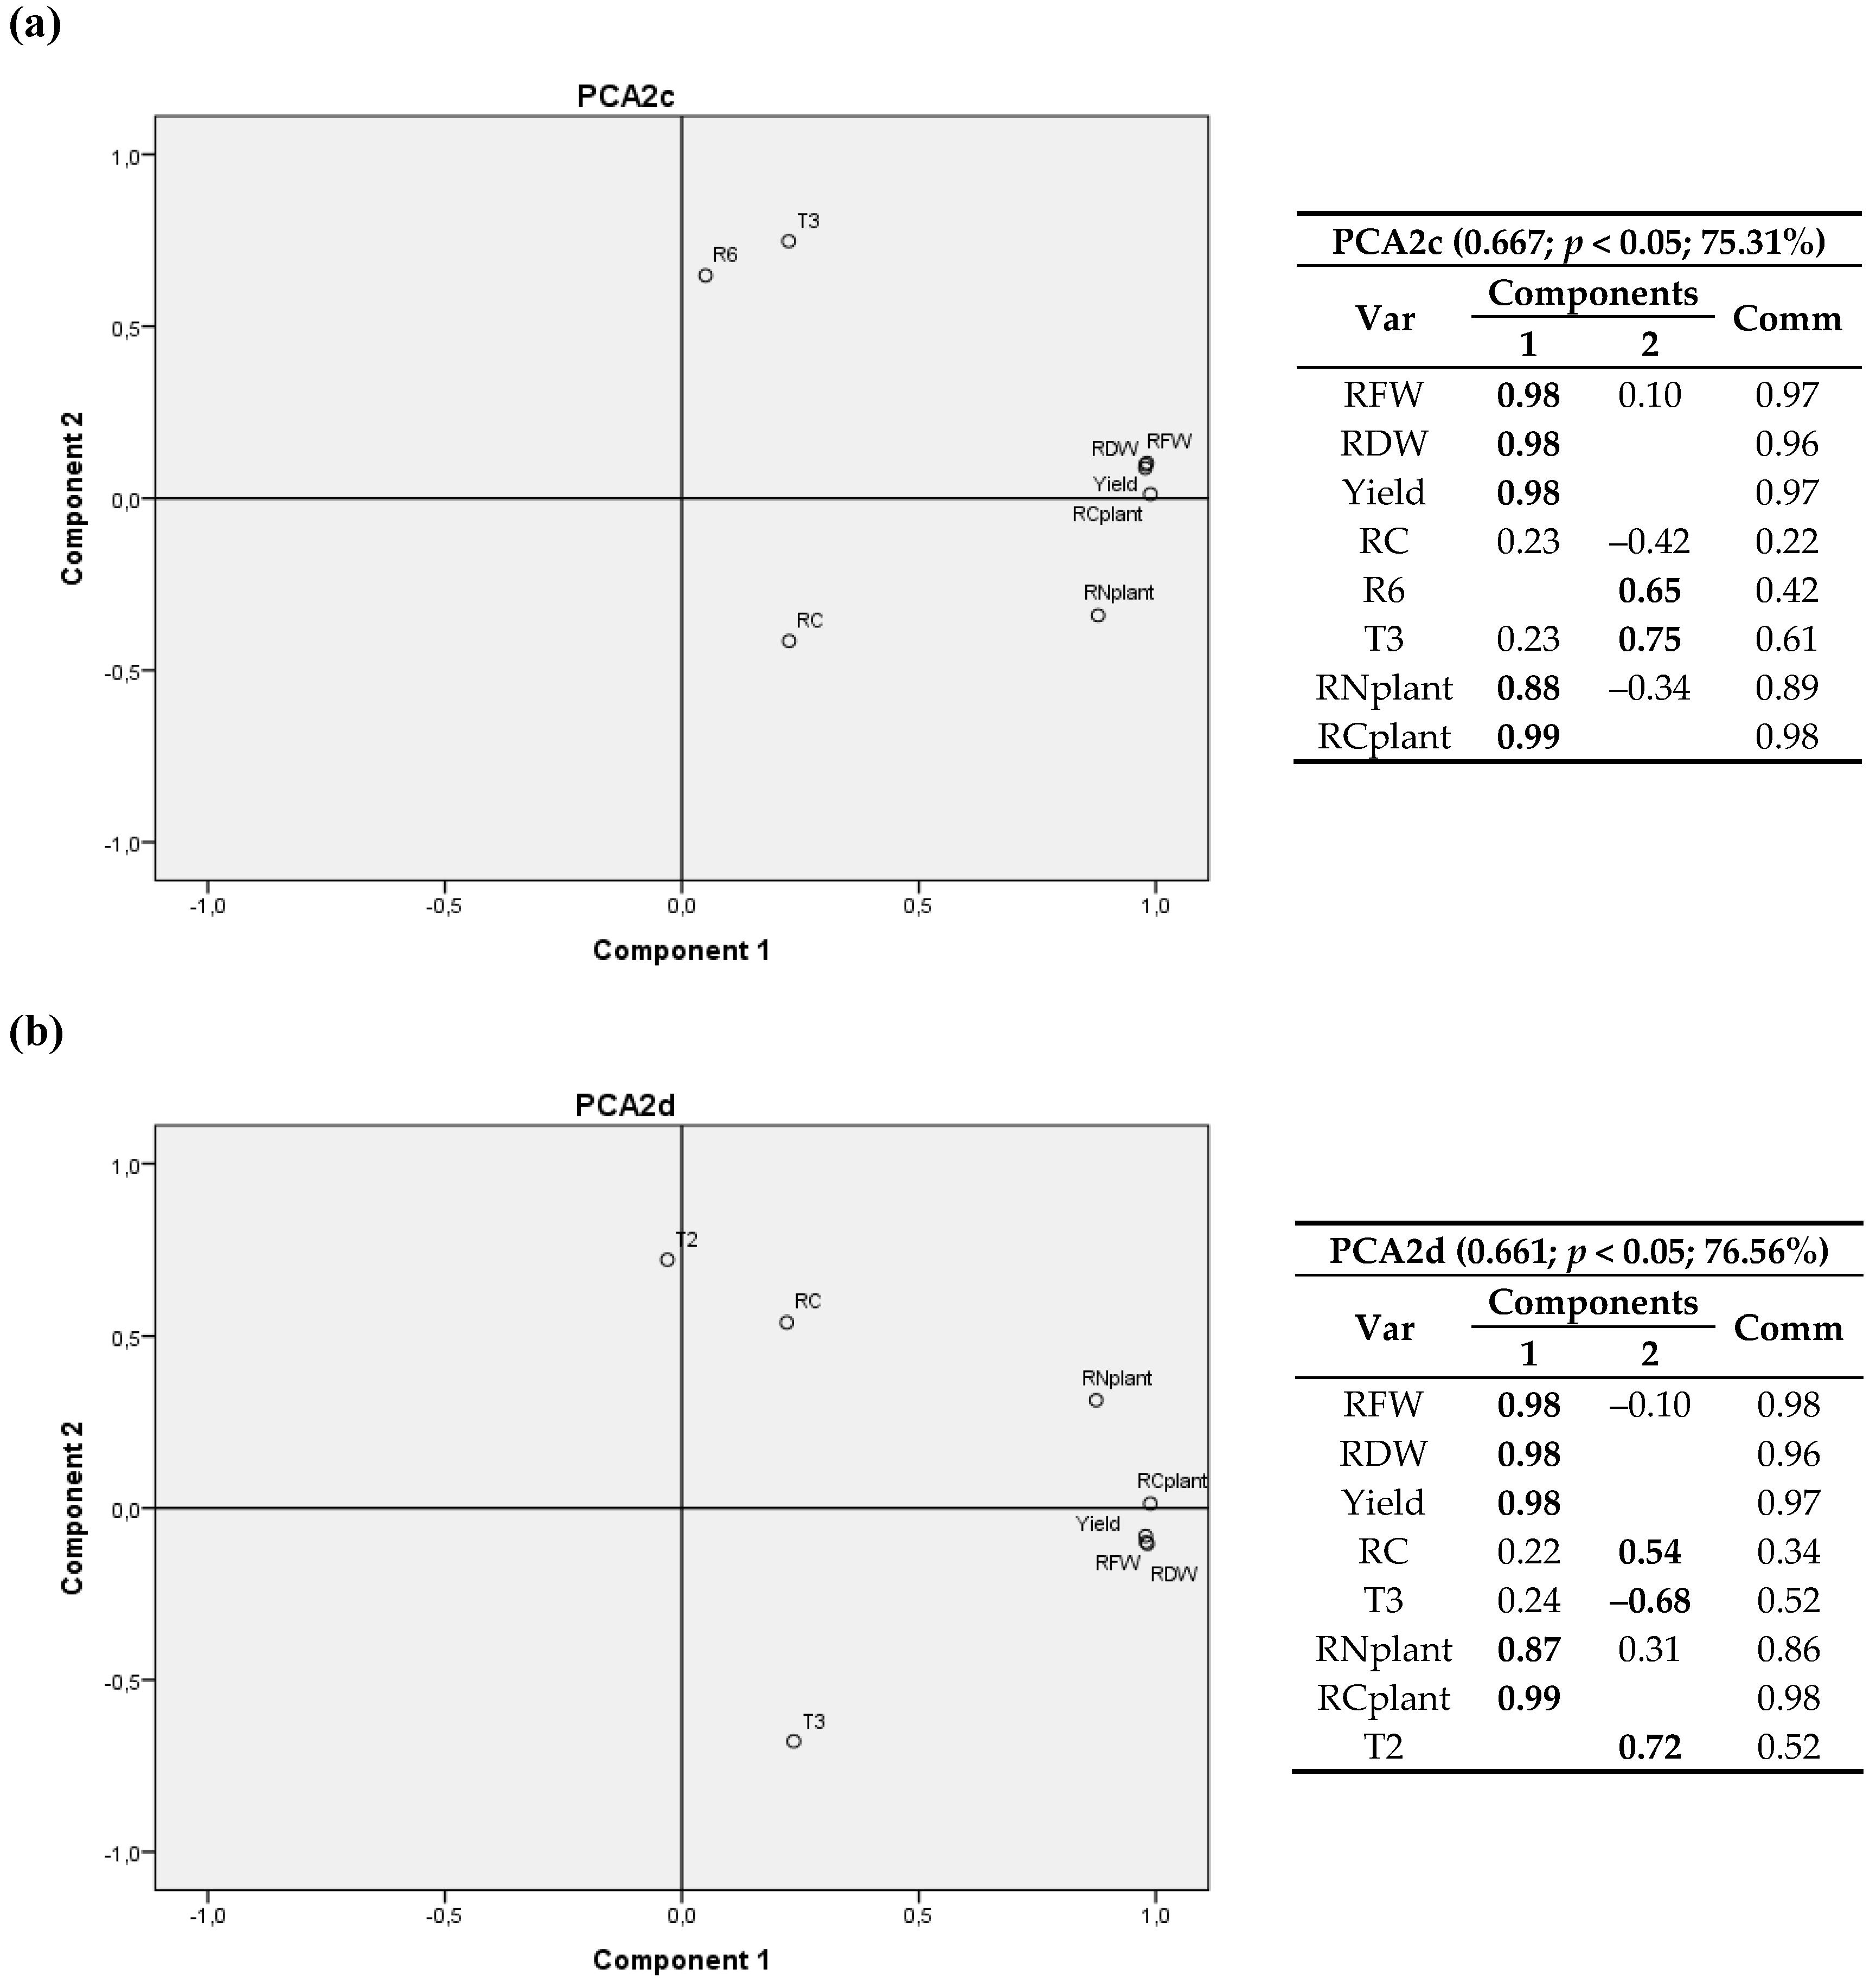
A 3D graph corresponding to the 4 sites is shown in Figure S2a. Since it includes Laguna de Negrillos (LN-II), no variables related to leaves could be used. Conversely, Figure S2b only includes 3 sites (LN-II was excluded), but variables related to leaves were considered.
In Figure S2a, the first component again consisted of variables related to plant growth (RFW, RDW, yield, RN/plant and RC/plant) and the other two components were determined by climatic variables (T3, R1, R6) together with the root carbon content (RC). When only three sites were considered (Figure S2b), the first component consisted of variables related to plant growth (RFW, RDW, yield and TN) the other two components were associated with climatic variables (T3, R6) and the nitrogen content in the leaves (LN).
In comparison to the previous year, it could be observed that, in 2012, the weight of RC and its commonality value in all analyses was lower, so the possible relationships with other variables of the study were attenuated. Again, in Figure S2a a negative relationship between RC and T3 was observed and, when data of the variables related to leaves were excluded in Figure S2b, a positive relationship between LN and T3 also appeared.
When the 2D graphics were analyzed, it was possible to observe a negative relationship of RC with T3 (Figure 6a), which includes the four locations), and a positive relationship with T2 (and with T1) appeared, as it also happened for the 2011 data. In Figure 6b the weight of RC was lower than 50%, but it showed the same trend between RC and T3.
When all variables and only three sites were considered (Figure 7), a significant positive correlation between LN and R6 was again detected, and a positive correlation between RC and T2 (T1) was found again. In this case, LN/plant contributed to the two components, since it is related to both crop variables and nitrogen concentration; the latter is evinced as a negative correlation with T2 (T1) and RC.
In addition, attention should also be paid to the fact that—for emergence data in 2012—a clear relationship between the GDD necessary for the emergence and the thermal gradient (maximum temperature minus minimum temperature from planting to emergence) was detected. In Table 9, one can observe that in sites in which the thermal gradient was larger, the crop needed less GDD to emerge. Nonetheless, other factors, such as subtle differences in soil temperature and humidity, effective planting depth and seedbed conditions, cannot be ruled out.
4. Discussion
4.1. Plant Variables at Harvest
In view of the ANOVA results for the combined effects of the factorials Site × Fertilization, Site × Variety and Variety × Fertilization, which only showed statistical significance when at least one of the factors also showed it separately, or which did not show any statistical significance, a separate analysis for each factor is presented. It should also be clarified that the Site × Year combined effect, which would require a mixed linear model-based analysis, was not studied. Instead, the two campaigns were analyzed in an independent manner, which allowed to assess if an effect or correlation observed in one year was repeated in the next campaign.
4.1.1. Fresh Weight and Yield
Influence of location factor: As mentioned above, significant differences were found between different sites for fresh weight and yield variables. The results obtained in both years for the plots located in Villavieja and Pampliega corresponded to longer cultivation periods and, consequently, to a higher thermal integral or GGD and to a larger cumulative radiation (R) (Table 8). This is in good agreement with other authors, who reported that the length of the growing season has a strong positive effect on sugar beet yield [28,58] (cited in [25]).
In 2011, the value of the roots to leaves weight ratio (RTLR) obtained for Magaz (3.58) can be ascribed to the low weight exhibited by the leaves of the plants in that location due to the presence of nematodes. In 2012, the results showed a positive relationship of RTLR with the carbon content in the root (RC) and with polarization [57], which is in agreement with the findings of Kenter and Hoffmann [53]. This positive relationship between RTLR and RC would also be valid for 2011 results with the optimum N fertilization, provided that Magaz results are excluded.
Influence of variety factor: The variety factor also showed influence on fresh weight and yield variables: Sandrina (high yield variety) achieved higher values for fresh weight variables, such as LFW and RTLR in 2012 (in 2011 it did not for RTLR because of the nematode infection), and for Yield and PWF in both years. In addition to this, the polarization data available for 2012 showed higher sugar content for Amalia (high sucrose content variety) as compared to the Sandrina variety for all the locations.
Influence of fertilization factor: The leaf production growth rate is known to be directly dependent on the nitrogen availability for the crop and, furthermore, a clear relationship between the leaves dry weight and the nitrogen concentration in the plant has been reported [59].
In 2011, it could be observed that the fertilization with higher amounts of nitrogen (2×N) led to higher values for the variables derived from fresh weight, except for the RTLR. This is reasonable, provided that a higher leaves fresh weight decreases the ratio of root to leaves weight. It should be kept in mind that, as the nitrogen content increases, the green leaves biomass and the total biomass increase [24], and, in those situations in which concentrations higher than optimum rates of nitrogen fertilizers were applied, the extra N had little impact on yield [60].
4.1.2. Carbon Content in the Roots, Dry Matter and CO2
Influence of location factor: The effect of the location factor on the C content in the root was noticeable, since it was statistically significant in both cultivation years. The concentrations attained in Laguna de Negrillos—both in 2011 and in 2012—for RC and for the root dry matter content (RDM) were the highest. Therefore, there was a positive relationship between RC and RDM, and there was also a positive relationship between RC and the polarization or sucrose content [53].
In this regard, Hoffmann, Kenter and Bloch [46] suggested that the positive correlation between sucrose concentration and marc could be explained by thicker cell walls, smaller cells and/or more cells, which may influence the proportion of carbon in root tissues. It is also worth noting that a compound with a high carbon content, such as betaine, is related to sucrose storage, so that the higher the concentration of sucrose, the higher concentration of betaine and the higher carbon content [15,45,53].
In 2011, Villavieja was the location in which the highest CO2 capture (TCO2) took place, provided that the higher dry weight of its plants implied that, in spite of its lower RDM and RC percentages as compared to Laguna de Negrillos, the total amount of dry matter accumulated was larger. In 2012, the highest CO2 uptake value was found in Pampliega since, as in the previous case, a higher total dry weight in its plants was obtained, due to the contribution of the larger biomass of their leaves.
Influence of variety factor: Regarding the influence of the sugar beet variety, there were not statistical significances except for the amount of dry matter in 2012, which was higher for the high sucrose content variety, Amalia. Thus, the relation between sucrose content and RDM discussed above appeared again.
In addition, even though it was not statistically significant, TCO2 was higher in the case of Sandrina (high yield variety) in both years. This is in line with what was described for the location factor.
Influence of fertilization factor: No influence of fertilization on the variables related to the root carbon content and dry matter content was found. As in the case of yield, the application of a dose of nitrogen higher than the optimum had no effect on RC and RDM. Nevertheless, it can be observed that TCO2 was higher for 2 × N treatment, in spite of the fact that it was not statistically significant. This, as noted above, could be due to the fact that green leaves biomass increases with nitrogen content, with a subsequent increase in the total biomass.
Therefore, the total amount of fixed CO2 would not only depend on the percentage of dry matter and on the carbon content, but mainly on the total amount of dry matter that the plant forms, which increases with increasing fresh weight. This is why it can be inferred that—in general terms—the higher the fresh weight of the plant is, the higher CO2 capture will be. In the first year, Villavieja was the location in which most CO2 assimilation occurred due to its larger sugar beet harvest, whereas in the second year, the highest LFW and total biomass (PDW) were attained in the town of Pampliega, in spite of the fact that the yield was not the highest.
As it can be expected, PDW tends to be larger in those sites with higher thermal integral and more available nitrogen (VV-I, VV-II, P). In this way, other authors have stated that there is a linear relationship between radiation interception and biomass [59], that the total production of crop dry matter is strongly correlated with the intercepted radiation [61] and that increasing nitrogen increases dry weight [58].
4.1.3. Nitrogen Content in Leaves, Total Nitrogen Absorption and Carbon to Nitrogen Ratio
Influence of location factor: Taking into account the location factor, an inverse relationship of the nitrogen content in the leaves (LN) with RC and—to some extent—with polarization could be observed. This would be in line with the results of Shock et al. [62], who found a negative relationship between nitrate concentration in petioles and polarization (albeit only for one of the two years of their study); with Pocock et al. [63], who reported that late additions or releases of nitrogen from soil organic matter reduced the sucrose content; and with Draycott and Christenson [64] and Malnou, Jaggard and Sparkes [40], who indicated that an amount of nitrogen above the optimum had a negative effect on sugar yield. Gordo-Ingelmo [17] explained that beet reacts to nitrogen fertilization increases with a greater development of the leaves and roots, which can cause excessive consumption of sucrose and an increase of non-sugars. This happens in particular for excessive organic fertilizer additions, in which some of the nitrogen is released belatedly, causing a halt to the maturity of the root. Consequently, the lower polarization and carbon content in root for the assays conducted in Pampliega in the second year, with the highest content of organic matter, would be associated to a delayed release of nitrogen, which would account for the fact that the crops had the highest leaves weight and the highest absorbed nitrogen per hectare.
Influence of variety factor: Regarding the variety factor, significant differences were observed for LN, which was higher for the Sandrina variety, both in 2011 and in 2012. These results are in agreement with those reported by Hoffmann [45], in which a dependence of leaf nitrogen composition with the variety was found. When the CNR ratio between RC and LN was studied, it was evinced that it was lower for the Sandrina variety, both in 2011 and in 2012. Thus, it may be inferred that varieties with higher polarization (sucrose content) also have higher carbon content in the root and higher values of the CNR ratio (Dulzata and Amalia, in this study).
Influence of fertilization factor: It is known that beet has a high affinity for nitrogen and this makes that, for a greater availability of nitrogen, higher absorption occurs [59]. Both LN and the nitrogen absorption (TN) increased with higher N fertilizer concentrations (2 × N vs. N). The CNR coefficient was lower for the 2×N fertilizing program, since at that fertilizer application rate the denominator (LN) was larger. Again, it could be observed that there was an inverse relationship between RC and LN and, for the optimum fertilization program (N), there was a direct relationship between RC and CNR and a positive relationship between RTLR and RC.
4.2. Climatic Variables
4.2.1. First Cultivation Year
In brief, all the plots showed that variables related to the growing process of plants (viz. PFW, Yield, R, RDW and TN) were close together and, hence, very highly correlated. It is also noteworthy that there was an inverse relationship between LN and RC.
The relationships between RC and the radiation and temperature variables showed that the higher the average temperature in the first stage of growth up to 1200 °C·d (T2) and the radiation accumulated in the first 65 days (R4) were, the higher RC was. In addition, it may be observed that the larger the accumulated radiation in the last phase of cultivation was, for example the last 25 days or from day 175 onwards, the lower the carbon concentration was. The same behavior occurred with T3, that is, the greater the deviation from the mean optimum temperature of 18 °C in the stage after 1200 °C·d was, the lower the carbon content in the root was.
The positive relation of the total thermal time after planting (GGD) and the accumulated thermal time from 1200 °C·d till harvest (GGD2) with LN, and its negative relation with RC, may be related to a slight trade-off between production and polarization, in which increased levels of assimilable nitrogen in the soil would increase performance in terms of root weight but would decrease the richness of sugar [17] and would increase the unusable compounds [65].
4.2.2. Second Cultivation Year
Analyzing the 3D graphs a negative relationship between the deviation from optimum temperature (T3) and RC was found, together with a positive relationship between T3 and LN. Therefore, the greater the deviation from T3 in the stage after 1200 °C·d was, the lower carbon in root and the higher the nitrogen content in leaves at harvest were.
The 2D graphics showed again, as in 2011, a negative relationship of RC with T3 and a positive relationship with T2 and with the mean temperature during the first 65 days (T1) when the four locations were considered.
Yet again, when all variables were included (i.e., only three locations were considered), positive correlations between LN and the accumulated radiation after day 175 after sowing (R6) and between RC and T2 (T1) were found. In addition, LN/plant showed a negative correlation with T2 (T1) and RC.
Despite the fact that the low commonality of RC weakened a possible relationship between these variables, the results were consistent with those obtained in the previous cultivation year.
In the two cultivation years there was a positive relationship between RC and T2 (T1), the accumulated radiation until 1200 °C·d a.s. (R2) and the accumulated radiation in the first 65 days a.s. (R4), and a negative relationship with R6 and T3. The former positive relationship between the root carbon content and the average temperature and the accumulated radiation in the first phase of cultivation is in agreement with the results of Hoffmann, Kenter and Bloch [46], who stated that the decisive time in the growing season for quality formation of sugar beet is the early growth stage until June. The later negative relationship between RC and the accumulated radiation in the last stage of cultivation (175 a.s. onwards, R6) would be explained by the fact that a higher radiation dose would promote a maintenance of vegetative development with a greater leaf development [66]. That is, crop growth rate declines in autumn due to decreasing radiation or temperature with leaves senescence [20,59], which causes a movement of assimilates towards the root. In this process, the availability of nitrogen for the plant also has an influence, because its shortage prevents further development of new tissues, with a subsequent increase in leaf senescence, allowing accumulation of assimilates in the root. Therefore, greater radiation and/or availability of nitrogen in the last stage of the cultivation can stop senescence and promote the birth of new leaves, consuming assimilates from the root.
4.3. Practical Implications
Most standards, methodologies or studies related to carbon footprint do not considered that the percentage of carbon contained in the biomass of a plant species can be influenced by environmental conditions. In fact, in regional and global vegetation carbon stock estimations, the most widely employed carbon content in plants is 50%, although a change of 1% from this canonical value can bring up to ∼7 Pg carbon variation in global vegetation carbon stocks [67]. As noted by Ma et al. [47], an increasing number of studies have indicated that carbon content varies significantly among plant organs and life forms, and using aforementioned biomass carbon conversion factor may lead to important biases. In an attempt to reduce the uncertainty in estimation of vegetation carbon stocks, some studies use species-specific organ carbon contents at regional scales, but still disregard biogeographical patterns and climatic factors.
While climatic factors may explain independently less variation of plant carbon contents than other factors, the results presented in this study illustrate that they should not be excluded from the analyses, as in this case the percentage of carbon in the root of the sugar beet was significantly influenced by the location. This is in line with the findings of other authors, who have—for instance—reported that plant carbon content shows significant latitudinal trends induced by climatic factors [47]. Thus, further research on biogeographic patterns of crops carbon content will be of benefit for the elucidation of the stoichiometry and the mechanisms of crops’ response to global change.
5. Conclusions
With a view to determining how sugar beet root carbon content is affected by climatic variables in real field conditions, data was collected over two cultivation years at different locations in Castilla y León region, which accounts for 90% of the Spanish production and which is the area in the European Union in which the highest yields per hectare are attained. Sugar beet growth and root carbon content were found to be significantly influenced by the climatic and edaphological characteristics of each cultivation site and by the specific conditions of each cultivation year.
The location factor—associated with the highest significant differences for the various treatments—had more influence than fertilization or the plant variety. Further, in each area of study, the root carbon content (and consequently the dry matter and sucrose contents) was found to be directly dependent on the average temperature in the first stage of growth up to 1200 °C·d and on the cumulative radiation in the first 65 days, while a higher cumulative radiation during the last stage of cultivation led to a decrease in carbon concentration.
The application of twice the recommended dose of N fertilizer only had an influence on the variables derived from the quantity of fresh matter, in particular for leaves, while the choice of the sugar beet variety led to significant differences in the nitrogen concentration in leaves.
Finally, results on up-taken CO2 (ranging from 31.5 to 69.4 CO2·ha−1) may be useful in the context of green economy to provide a better estimation of the carbon balance and environmental impact associated with the cultivation of this crop by Life Cycle Assessment (LCA) methodologies.
Supplementary Materials
The following are available online at https://www.mdpi.com/2073-4395/8/8/147/s1, Figure S1: 3D plot (left) and summary table (right) of the PCA analysis for the first cultivation year (2011). Figure S2: (Top) 3D plot and summary table of PCA analysis for the second cultivation year (2012) for all the sites, excluding variables related to leaves. (Bottom) 3D plot and summary table of PCA analysis for only three sites (Laguna de Negrillos was excluded) including all variables.
Author Contributions
Conceptualization, L.M.N.-G., S.H.-N. and J.M.-G.; Methodology, J.M.-G.; Validation, L.F.S.-S., J.M.-G. and P.M.-R.; Formal Analysis, L.F.S.-S. and P.M.-R.; Investigation, L.F.S.-S.; Resources, L.M.N.-G., S.H.-N. and J.M.-G.; Writing-Original Draft Preparation, L.F.S.-S. and P.M.-R.; Writing-Review & Editing, P.M.-R.; Visualization, P.M.-R.; Supervision, L.M.N.-G., S.H.-N. and J.M.-G.; Funding Acquisition, L.M.-N. and S.H.-N.
Funding
This research was funded by the European Union LIFE+ Programme, under project “CO2 Operation: Integrated agroforestry practices and nature conservation against climate change” (ref. LIFE11 ENV/ES/000535). L.F.S.S. would like to thank the “Ayudas a la Contratación de Personal Investigador de Reciente Titulación (2009–2013)” scholarship program, co-funded by the Education Department of Junta de Castilla y León regional government and the European Social Fund. P.M.R. gratefully acknowledges the financial support of Santander Universidades through the “Becas Iberoamérica Jóvenes Profesores e Investigadores, España” scholarship program. The APC was funded by IUCA, Universidad de Zaragoza.
Acknowledgments
The authors wish to acknowledge the collaboration of AIMCRA (Asociación de Investigación para la Mejora del Cultivo de la Remolacha Azucarera).
Conflicts of Interest
The authors declare no conflict of interest. The funders had no role in the design of the study; in the collection, analyses, or interpretation of data; in the writing of the manuscript, and in the decision to publish the results.
References
- Smith, P.; Bustamante, M.; Ahammad, H.; Clark, H.; Dong, H.; Elsiddig, E.A.; Haberl, H.; Harper, R.; House, J.; Jafari, M.; et al. Agriculture, forestry and other land use (AFOLU). In Climate Change 2014: Mitigation of Climate Change. Contribution of Working Group III to the Fifth Assessment Report of the Intergovernmental Panel on Climate Change; Edenhofer, O., Pichs-Madruga, R., Sokona, Y., Farahani, E., Kadner, S., Seyboth, K., Adler, A., Baum, I., Brunner, S., Eickemeier, P., et al., Eds.; Cambridge University Press: Cambridge, UK, 2014; pp. 811–922. [Google Scholar]
- Smith, P.; Martino, D.; Cai, Z.; Gwary, D.; Janzen, H.; Kumar, P.; McCarl, B.; Ogle, S.; O’Mara, F.; Rice, C.; et al. Agriculture. In Climate Change 2007, Mitigation of Climate Change WGIII—IPCC Fourth Assessment Report; Intergovernmental Panel on Climate Change: Geneva, Switzerland, 2007; pp. 498–540. [Google Scholar]
- Taiz, L.; Zeiger, E.; Moller, I.M.; Murphy, A. Plant Physiology, 6th ed.; Sinauer Associates Inc.: Sunderland, MA, USA, 2015. [Google Scholar]
- McKendry, P. Energy production from biomass (part 1): Overview of biomass. Bioresour. Technol. 2002, 83, 37–46. [Google Scholar] [CrossRef]
- Carvajal, M.; Mota, C.; Alcaraz-López, C.; Iglesias, M.; Martínez-Ballesta, M.C. Investigación Sobre la Absorción de CO2 por los Cultivos más Representativos; Consejo Superior de Investigaciones Científicas: Murcia, Spain, 2009. [Google Scholar]
- Gardner, F.P.; Pearce, R.B.; Mitchell, R.L. Carbon fixation by crop canopies. In Physiology of Crop Plants; Iowa State University Press: Iowa, IA, USA, 1985; pp. 31–57. [Google Scholar]
- Intergovernmental Panel on Climate Change (IPCC). Climate Change 2014: Synthesis Report. In Fifth Assessment Report of the Intergovernmental Panel on Climate Change; IPCC: Geneva, Switzerland, 2014; p. 151. [Google Scholar]
- Victoria Jumilla, F.; Costa Gómez, I.; Castro Corbalán, T.; García Cárdenas, R.; Romojaro Casado, M.C.; Mesa del Castillo Navarro, M.L.; Motos Alarcón, M.I. La Iniciativa de Ecorresponsabilidad Agricultura Murciana como Sumidero de CO2. Marca LESSCO2; Observatorio Regional de Cambio Climático, Región de Murcia: Murcia, Spain, 2011. [Google Scholar]
- Klenk, I.; Landquist, B.; Ruiz de Imaña, O. The product carbon footprint of EU beet sugar. Summary of key findings. Sugar Ind. J. 2012, 137, 169–177. [Google Scholar]
- Crutzen, P.J.; Mosier, A.R.; Smith, K.A.; Winiwarter, W. N2O release from agro-biofuel production negates global warming reduction by replacing fossil fuels. Atmos. Chem. Phys. 2008, 8, 389–395. [Google Scholar] [CrossRef] [Green Version]
- Jaggard, K.W.; Clark, C.J.A.; Draycott, A.P. The weight and processing quality of components of the storage roots of sugar beet (Beta vulgaris L). J. Sci. Food Agric. 1999, 79, 1389–1398. [Google Scholar] [CrossRef]
- Milford, G.F.J.; Houghton, B.J. An analysis of the variation in crown size in sugar-beet (Beta vulgaris) grown in England. Ann. Appl. Biol. 1999, 134, 225–232. [Google Scholar] [CrossRef]
- Van Heemst, H.D.J. Physiological principles. In Modelling of Agricultural Production: Weather, Soils and Crops; van Keulen, H., Wolf, J., Eds.; Pudoc: Wageningen, The Netherlands, 1986; pp. 13–26. [Google Scholar]
- Scott, R.; Jaggard, K. Crop physiology and agronomy. In The Sugar Beet Crop; Springer: Dordrecht, The Netherlands, 1993; pp. 179–237. [Google Scholar]
- Kenter, C.; Hoffmann, C.M.; Märländer, B. Effects of weather variables on sugar beet yield development (Beta vulgaris L.). Eur. J. Agron. 2006, 24, 62–69. [Google Scholar] [CrossRef]
- Echevarría Ruiz de Vargas, C.; Feria Bourrellier, A.B.; Terencio Jiménez, E. Conceptos generales del metabolismo y del transporte de sacarosa. In Aspectos Fisiológicos de la Remolacha de Siembra Otoñal; Junta de Andalucia, Consejeria de Agricultura y Pesca: Sevilla, Spain, 2005; pp. 11–22. [Google Scholar]
- Gordo-Ingelmo, L.F. Composición Química y Control Agrícola de los no-Azúcares en la Remolacha Azucarera; Caja de Ahorros Municipal de Burgos: Burgos, Spain, 1994; p. 205. [Google Scholar]
- Jiménez, E.T.; García-Mauriño, S.; Morillo-Velarde, R.; Echevarría, C. Actividades enzimáticas de degradación de la sacarosa producción de azúcares reductores en la remolacha de siembra otoñal. In Aspectos Fisiológicos de la Remolacha de Siembra Otoñal; Junta de Andalucia, Consejeria de Agricultura y Pesca: Sevilla, Spain, 2005; pp. 45–69. [Google Scholar]
- Thomas, T.H. Sugar beet. In Crop Yield: Physiology and Processes; Smith, D.L., Hamel, C., Eds.; Springer: Berlin, Germany, 2000; pp. 311–332. [Google Scholar]
- Milford, G.F.J. The growth and development of the storage root of sugar beet. Ann. Appl. Biol. 1973, 75, 427–438. [Google Scholar] [CrossRef]
- Bell, C.I.; Milford, G.F.J.; Leigh, R.A. Sugar beet. In Photoassimilate Distribution in Plants and Crops: Source-Sink Relationships; Zamski, E., Schaffer, A.A., Eds.; Marcel Dekker Inc.: New York, NY, USA, 1996; Volume 48, pp. 691–707. [Google Scholar]
- Demmers-Derks, H.; Mitchell, R.A.C.; Mitchell, V.J.; Lawlor, D.W. Response of sugar beet (Beta vulgaris L.) yield and biochemical composition to elevated CO2 and temperature at two nitrogen applications. Plant Cell Environ. 1998, 21, 829–836. [Google Scholar] [CrossRef]
- Burkart, S.; Manderscheid, R.; Weigel, H.J. Canopy CO2 exchange of sugar beet under different CO2 concentrations and nitrogen supply: Results from a free-air CO2 enrichment study. Plant Biol. 2009, 11, 109–123. [Google Scholar] [CrossRef] [PubMed]
- Manderscheid, R.; Pacholski, A.; Weigel, H.-J. Effect of free air carbon dioxide enrichment combined with two nitrogen levels on growth, yield and yield quality of sugar beet: Evidence for a sink limitation of beet growth under elevated CO2. Eur. J. Agron. 2010, 32, 228–239. [Google Scholar] [CrossRef]
- Hoffmann, C.M.; Kluge-Severin, S. Light absorption and radiation use efficiency of autumn and spring sown sugar beets. Field Crop. Res. 2010, 119, 238–244. [Google Scholar] [CrossRef]
- Milford, G.F.J.; Pocock, T.O.; Riley, J. An analysis of leaf growth in sugar beet. I. Leaf appearance and expansion in relation to temperature under controlled conditions. Ann. Appl. Biol. 1985, 106, 163–172. [Google Scholar] [CrossRef]
- Villarías-Moradillo, J.L.; de Liñán y Vicente, C. La Remolacha Azucarera; Ediciones Agrotécnicas: Madrid, Spain, 1999. [Google Scholar]
- Hull, R.; Webb, D.J. The effect of sowing date and harvesting date on the yield of sugar beet. J. Agric. Sci. 1970, 75, 223. [Google Scholar] [CrossRef]
- Freckleton, R.P.; Watkinson, A.R.; Webb, D.J.; Thomas, T.H. Yield of sugar beet in relation to weather and nutrients. Agric. For. Meteorol. 1999, 93, 39–51. [Google Scholar] [CrossRef]
- Clover, G.R.G.; Jaggard, K.W.; Smith, H.G.; Azam-Ali, S.N. The use of radiation interception and transpiration to predict the yield of healthy, droughted and virus-infected sugar beet. J. Agric. Sci. 2001, 136, 169–178. [Google Scholar] [CrossRef]
- Gordo, L.F.; Morillo-Velarde, R.; Martínez, J.J.; Echevarría Ruiz de Vargas, C.; García-Mauriño, S. Crecimiento y desarrollo de la remolacha azucarera de siembra otoñal. In Aspectos Fisiológicos de la Remolacha de Siembra Otoñal; Junta de Andalucia; Consejeria de Agricultura y Pesca: Sevilla, Spain, 2005; pp. 23–44. [Google Scholar]
- Petkeviciene, B. The effects of climate factors on sugar beet early sowing timing. Agron. Res. 2009, 7, 436–443. [Google Scholar]
- Hoffmann, C.M.; Kluge-Severin, S. Growth analysis of autumn and spring sown sugar beet. Eur. J. Agron. 2011, 34, 1–9. [Google Scholar] [CrossRef]
- Loel, J.; Hoffmann, C.M. Importance of growth stage and weather conditions for the winter hardiness of autumn sown sugar beet. Field Crop. Res. 2014, 162, 70–76. [Google Scholar] [CrossRef]
- Jaggard, K.W.; Dewar, A.M.; Pidgeon, J.D. The relative effects of drought stress and virus yellows on the yield of sugarbeet in the UK, 1980–95. J. Agric. Sci. 1998, 130, 337–343. [Google Scholar] [CrossRef]
- Tanner, C.B.; Sinclair, T.R. Efficient water use in crop production: Research or re-search? In Limitations to Efficient Water Use in Crop Production; Taylor, H.M., Jordan, W.R., Sinclair, T.R., Eds.; American Society of Agronomy: Madison, WI, USA, 1983; pp. 1–27. [Google Scholar]
- Rinaldi, M.; Vonella, A.V. The response of autumn and spring sown sugar beet (Beta vulgaris L.) to irrigation in Southern Italy: Water and radiation use efficiency. Field Crop. Res. 2006, 95, 103–114. [Google Scholar] [CrossRef]
- Fabeiro, C.; Martín de Santa Olalla, F.; López, R.; Domínguez, A. Production and quality of the sugar beet (Beta vulgaris L.) cultivated under controlled deficit irrigation conditions in a semi-arid climate. Agric. Water Manag. 2003, 62, 215–227. [Google Scholar] [CrossRef]
- Asociación de investigación para la mejora del cultivo de la remolacha azucarera (AIMCRA). Plan 2020 para la sostenibilidad de la remolacha azucarera. Rev. AIMCRA 2015, 120, 29–31. [Google Scholar]
- Malnou, C.S.; Jaggard, K.W.; Sparkes, D.L. Nitrogen fertilizer and the efficiency of the sugar beet crop in late summer. Eur. J. Agron. 2008, 28, 47–56. [Google Scholar] [CrossRef]
- Grzebisz, W.; Szczepaniak, W.; Pepliński, K.; Barłóg, P.; Cyna, K. Impact of nitrogen concentration variability in sugar beet plant organs throughout the growing season on dry matter accumulation patterns. J. Elemntol. 2012. [Google Scholar] [CrossRef]
- Malnou, C.S.; Jaggard, K.W.; Sparkes, D.L. A canopy approach to nitrogen fertilizer recommendations for the sugar beet crop. Eur. J. Agron. 2006, 25, 254–263. [Google Scholar] [CrossRef]
- Kiymaz, S.; Ertek, A. Yield and quality of sugar beet (Beta vulgaris L.) at different water and nitrogen levels under the climatic conditions of Kırsehir, Turkey. Agric. Water Manag. 2015, 158, 156–165. [Google Scholar] [CrossRef]
- Giaquinta, R.T. Sucrose translocation and storage in the sugar beet. Plant Phys. 1979, 63, 828–832. [Google Scholar] [CrossRef]
- Hoffmann, C.M. Changes in N composition of sugar beet varieties in response to increasing N supply. J. Agron. Crop Sci. 2005, 191, 138–145. [Google Scholar] [CrossRef]
- Hoffmann, C.M.; Kenter, C.; Bloch, D. Marc concentration of sugar beet (Beta vulgaris L) in relation to sucrose storage. J. Sci. Food Agric. 2005, 85, 459–465. [Google Scholar] [CrossRef]
- Ma, S.; He, F.; Tian, D.; Zou, D.; Yan, Z.; Yang, Y.; Zhou, T.; Huang, K.; Shen, H.; Fang, J. Variations and determinants of carbon content in plants: A global synthesis. Biogeosciences 2018, 15, 693–702. [Google Scholar] [CrossRef]
- Ministerio de Agricultura, Pesca y Alimentación (MAGRAMA). Available online: www.magrama.gov/agricultura/ (accessed on 15 August 2015).
- Boiffin, J.; Durr, C.; Fleury, A.; Marin-Laflèche, A.; Maillet, I. Analysis of the variability of sugar beet (Beta vulgaris L.) growth during the early stages. I. Influence of various conditions on crop establishment. Agronomie 1992, 12, 515–525. [Google Scholar] [CrossRef]
- Derscheid, L.A.; Lytle, W.F. Growing Degree Days (GDD); Cooperative Extension Service, South Dakota State University: Brookings, SD, USA, 1981; p. 4. [Google Scholar]
- Milford, G.F.J.; Pocock, T.O.; Jaggard, K.W.; Biscoe, P.V.; Armstrong, M.J.; Last, P.J.; Goodman, P.J. An analysis of leaf growth in sugar beet. IV. The expansion of the leaf canopy in relation to temperature and nitrogen. Ann. Appl. Biol. 1985, 107, 335–347. [Google Scholar] [CrossRef]
- Asociación de Investigación para la Mejora del Cultivo de la Remolacha Azucarera (AIMCRA). Recomendaciones de Cultivo: Zona Norte. Available online: http://www.aimcra.es/Recomendaciones/RecomendacionesNorte.aspx (accessed on 14 January 2015).
- Kenter, C.; Hoffmann, C.M. Seasonal patterns of sucrose concentration in relation to other quality parameters of sugar beet (Beta vulgaris L.). J. Sci. Food Agric. 2006, 86, 62–70. [Google Scholar] [CrossRef]
- O'Rourke, N.; Psych, R.; Hatcher, L. A Step-by-Step Approach to Using SAS for Factor Analysis and Structural Equation Modeling, 2nd ed.; SAS Institute: Cary, NC, USA, 2013. [Google Scholar]
- Pérez López, C. Técnicas de Análisis Multivariante de Datos: Aplicaciones Con SPSS; Pearson Educación: Madrid, Spain, 2004. [Google Scholar]
- Harrigan, G.G.; Goodacre, R. Metabolic Profiling: Its Role in Biomarker Discovery and Gene Function Analysis; Springer: New York, NY, USA, 2003; p. 335. [Google Scholar]
- Asociación de investigación para la mejora del cultivo de la remolacha azucarera (AIMCRA). Memoria Campaña 2012/2013 Siembra Primavera 2012; AIMCRA: Valladolid, Spain, 2012; p. 124. [Google Scholar]
- Abdel-Motagally, F.M.; Attia, K.K. Response of sugar beet plants to nitrogen and potassium fertilization in sandy calcareous soil. Int. J. Agric. Biol. 2009, 11, 695–700. [Google Scholar]
- Martínez Quesada, J.J.; Morillo Velarde, R.; Aguilera García, Y.; Infante Vázquez, J.M. Growth of sugar beet under limited nitrogen conditions. In Sugar Beet Growth and Growth Modelling. Advances in Sugar Beet Research; Institut International de Recherches Betteravieres: Brussels, Belgium, 2003; Volume 5, pp. 33–45. [Google Scholar]
- Allison, M.F.; Armstrong, M.J.; Jaggard, K.W.; Todd, A.D.; Milford, G.F.J. An analysis of the agronomic, economic and environmental effects of applying N fertilizer to sugarbeet (Beta vulgaris). J. Agric. Sci. 1996, 127, 475. [Google Scholar] [CrossRef]
- Monteith, J.L.; Moss, C.J. Climate and the efficiency of crop production in Britain [and discussion]. Philos. Trans. R. Soc. B Biol. Sci. 1977, 281, 277–294. [Google Scholar] [CrossRef]
- Shock, C.C.; Seddigh, M.; Saunders, L.D.; Stieber, T.D.; Miller, J.G. Sugarbeet nitrogen uptake and performance following heavily fertilized onion. Agron. J. 2000, 92, 10–15. [Google Scholar] [CrossRef]
- Pocock, T.O.; Milford, G.F.J.; Armstrong, M.J. Storage root quality in sugarbeet in relation to nitrogen uptake. J. Agric. Sci. 2009, 115, 355. [Google Scholar] [CrossRef]
- Draycott, A.P.; Christenson, D.R. Nutrients for Sugarbeet Production: Soil-Plant Relationships; CABI Publishing: Wallingford, UK, 2003; p. 242. [Google Scholar]
- Ouda, M.M.S. Effect of nitrogen and sulphur fertilizers levels on sugar beet in newly cultivated sandy soil. Zagazig J. Agric. Res. 2002, 29, 33–50. [Google Scholar]
- Tabourel-Tayot, F.; Gastal, F. MecaNiCAL, a supply–demand model of carbon and nitrogen partitioning applied to defoliated grass: 2. Parameter estimation and model evaluation. Eur. J. Agron. 1998, 9, 243–258. [Google Scholar] [CrossRef]
- Dixon, R.K.; Solomon, A.M.; Brown, S.; Houghton, R.A.; Trexier, M.C.; Wisniewski, J. Carbon Pools and Flux of Global Forest Ecosystems. Science 1994, 263, 185–190. [Google Scholar] [CrossRef] [PubMed]
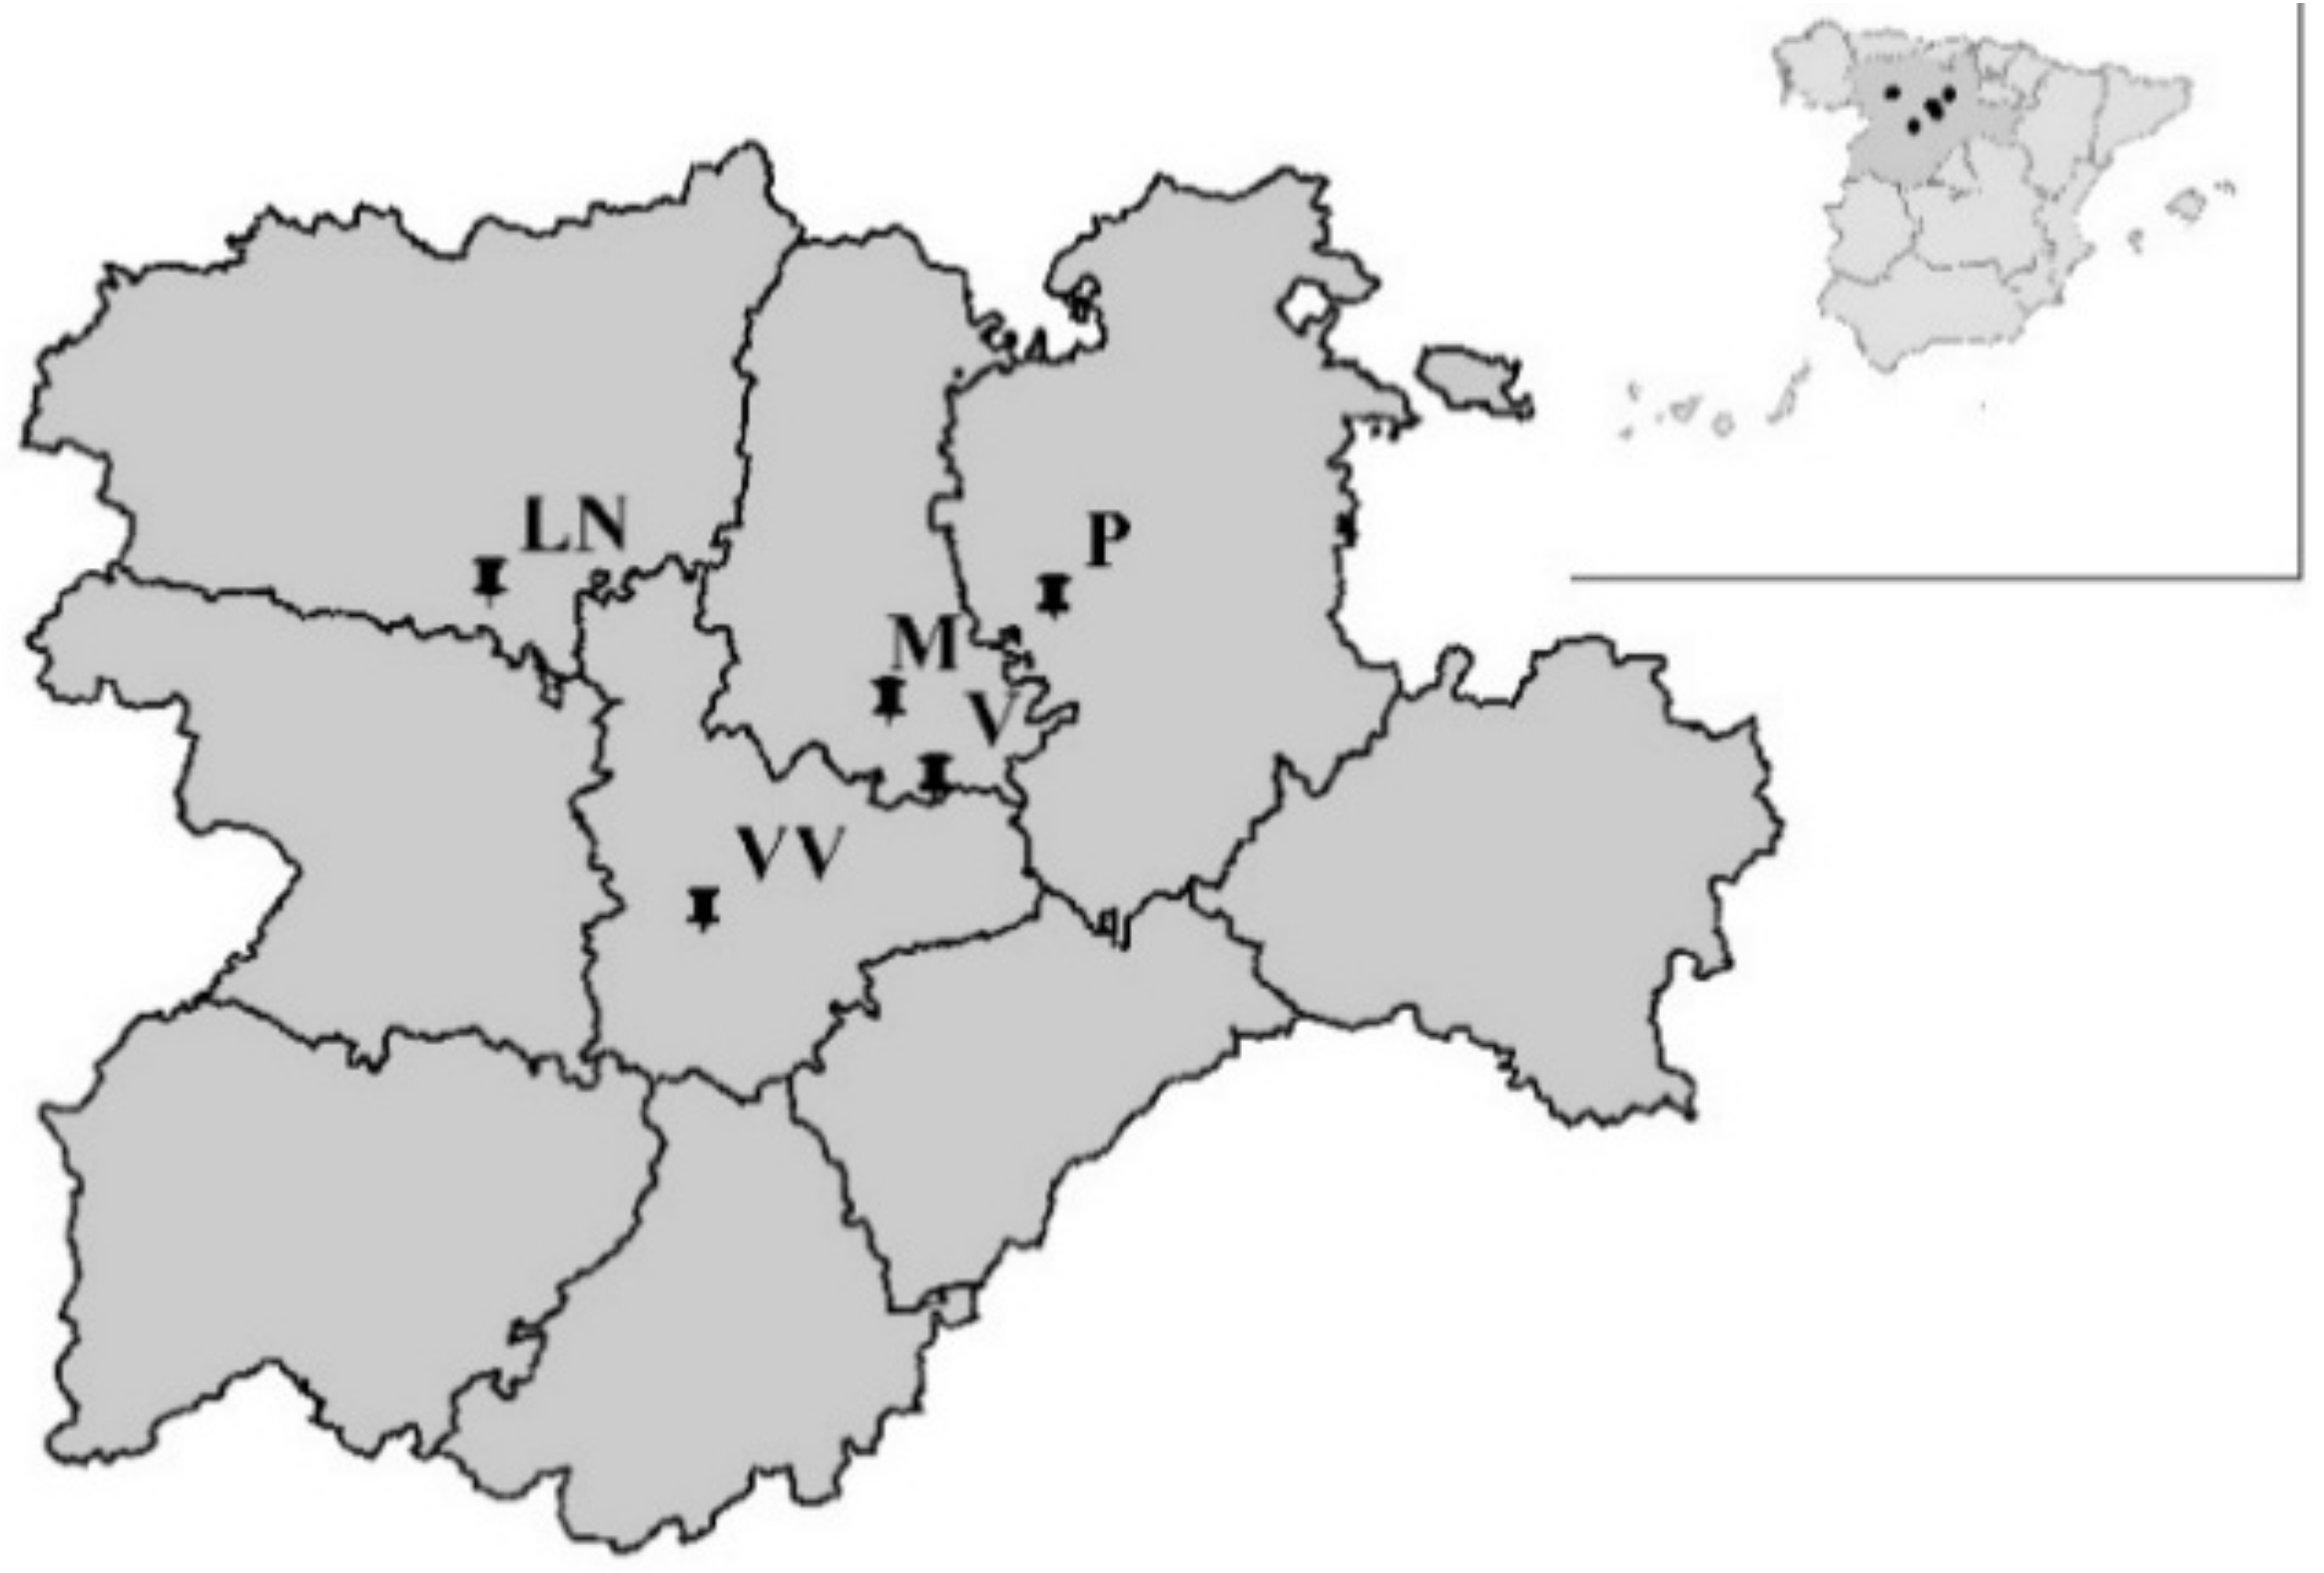
Figure 1.
Overview map of experiment locations. LN: Laguna de Negrillos; M: Magaz de Pisuerga; P: Pampliega; V: Vertavillo; VV: Villavieja.
Figure 1.
Overview map of experiment locations. LN: Laguna de Negrillos; M: Magaz de Pisuerga; P: Pampliega; V: Vertavillo; VV: Villavieja.

Figure 2.
(a,b) Bivariate plots in rotated space for the first cultivation year (2011). Plant fresh weight (PFW), yield, root carbon content (RC), leaves nitrogen content (LN), accumulated radiation after emergence (R), root dry weight (RDW) and total nitrogen absorbed per ha (TN) were fixed and R2 and R4 calculated radiation variables were tested. Var stands for variables and Comm stands for commonalities.

Figure 3.
(a,b) Bivariate plots in rotated space for the first cultivation year (2011). PFW, yield, RC, LN, R, RDW and TN were fixed and R5 and R6 calculated radiation variables were tested. Var stands for variables and Comm stands for commonalities.
Figure 3.
(a,b) Bivariate plots in rotated space for the first cultivation year (2011). PFW, yield, RC, LN, R, RDW and TN were fixed and R5 and R6 calculated radiation variables were tested. Var stands for variables and Comm stands for commonalities.

Figure 4.
(a,b) Bivariate plots in rotated space for the first cultivation year (2011). PFW, yield, RC, LN, R, RDW and TN were fixed and T2 and T3 temperature variables were tested. Var stands for variables and Comm stands for commonalities.
Figure 4.
(a,b) Bivariate plots in rotated space for the first cultivation year (2011). PFW, yield, RC, LN, R, RDW and TN were fixed and T2 and T3 temperature variables were tested. Var stands for variables and Comm stands for commonalities.

Figure 5.
(a,b) Bivariate plots in rotated space for the first cultivation year (2011). PFW, yield, RC, LN, R, RDW and TN were fixed and GGD and GGD2 thermal time variables were tested. Var stands for variables and Comm stands for commonalities.
Figure 5.
(a,b) Bivariate plots in rotated space for the first cultivation year (2011). PFW, yield, RC, LN, R, RDW and TN were fixed and GGD and GGD2 thermal time variables were tested. Var stands for variables and Comm stands for commonalities.

Figure 6.
Bivariate plots in rotated space for the second cultivation year (2012). All locations were considered and variables related to leaves were excluded. RFD, RDW, yield, RC, RNplant, RCplant and T3 were fixed and R6 (a) and T2 (b) variables were tested. Var stands for variables and Comm stands for commonalities.

Figure 7.
Bivariate plots in rotated space for the second cultivation year (2012). All variables were included and Laguna de Negrillos was excluded (only three locations). PFW, RDW, yield and RC were fixed and R6 and LN (a) and T2, TN and LNplant (b) variables were tested. Var stands for variables and Comm stands for commonalities.


Table 1.
Sowing and harvesting dates, and cultivation period for the four sites under study.
| Site | Sowing Date | Harvesting Date | Cultivation Period (d) |
|---|---|---|---|
| M | 23 March 2011 | 29 September 2011 | 190 |
| LN-I | 13 April 2011 | 10 October 2011 | 180 |
| VV-I | 10 March 2011 | 27 September 2011 | 201 |
| P | 16 March 2012 | 8 October 2012 | 206 |
| LN-II | 21 March 2012 | 10 October 2012 | 203 |
| V | 26 March 2012 | 3 October 2012 | 191 |
| VV-II | 5 March 2012 | 17 October 2012 | 226 |
Table 2.
Weather data for 2011 and 2012 supplied by nearby SIAR stations. T: mean temperature (in °C); P: total precipitation (in mm); ETo: total evapotranspiration (in mm); R: total radiation (in MJ·m−2) in the cultivation period. Details on ETo and irrigation doses (both in mm) during the irrigation period (which started on 2 June and on 3 May, in 2011 and in 2012, respectively).
| Site | Year | Coordinates | Meteorological Data (Cultivation Period) | Irrigation Period | ||||||
|---|---|---|---|---|---|---|---|---|---|---|
| Latitude | Longitude | Altitude | T | P | ETo | R | ETo | Dose | ||
| Magaz (M) | 2011 | N 41° 59′ 24′′ | W 04° 24′ 36′′ | 737 | 17.0 | 100 | 792 | 4125 | 531 | 619 |
| Laguna de Negrillos–I (LN-I) | N 42° 13′ 56′′ | W 05° 37′ 37′′ | 782 | 16.8 | 182 | 805 | 4312 | 553 | 637 | |
| Villavieja-I (VV-I) | N 41° 29′ 59′′ | W 05° 03′ 53′′ | 674 | 16.9 | 134 | 872 | 4679 | 623 | 718 | |
| Pampliega (P) | 2012 | N 42° 12′ 26′′ | W 04° 00′ 02′′ | 764 | 15.5 | 178 | 941 | 4662 | 575 | 663 |
| Laguna de Negrillos-II (LN-II) | N 42° 15′ 47′′ | W 05° 07′ 57′′ | 778 | 15.5 | 199 | 898 | 4684 | 550 | 633 | |
| Vertavilo (V) | N 41° 50′ 52′′ | W 04° 19′ 23′′ | 785 | 16.0 | 147 | 798 | 3949 | 593 | 684 | |
| Villavieja-II (VV-II) | N 41° 31′ 39′′ | W 05° 01′ 30′′ | 710 | 15.8 | 100 | 908 | 4853 | 652 | 753 | |
Table 3.
Calculated climatic variables.
| Variable | Description | Units |
|---|---|---|
| R1 | Accumulated radiation a.e. | MJ·m−2 |
| R2 | Accumulated radiation until 1200 °C·d a.s. | MJ·m−2 |
| R3 | Accumulated radiation after 1200 °C·d a.s. | MJ·m−2 |
| R4 | Accumulated radiation in the first 65 days a.s. | MJ·m−2 |
| R5 | Accumulated radiation in the last 25 days | MJ·m−2 |
| R6 | Accumulated radiation after day 175 a.s. | MJ·m−2 |
| T1 | Mean temperature during the first 65 days | °C |
| T2 | Mean temperature during the first 1200 °C·d a.s. | °C |
| T3 | Mean temperature deviation from 18 °C after 1200 °C·d a.s. | °C |
| GDD | Growth degree-day a.s. | °C·d |
| GDD1 | Growth degree-day a.e. | °C·d |
| GDD2 | Growth degree-day from 1200 °C·d | °C·d |
a.e. stands for ‘after emergence’; a.s. stands for ‘after sowing’. Date of crop emergence was defined as the date on which 50% of seedlings had emerged.
Table 4.
Soil analyses and fertilization data in 2011 and 2012 at the different locations. LN: Laguna de Negrillos; M: Magaz de Pisuerga; P: Pampliega; V: Vertavillo; VV: Villavieja.
Table 4.
Soil analyses and fertilization data in 2011 and 2012 at the different locations. LN: Laguna de Negrillos; M: Magaz de Pisuerga; P: Pampliega; V: Vertavillo; VV: Villavieja.
| Site | Soil Analysis | Fertilization | ||||||||||||
|---|---|---|---|---|---|---|---|---|---|---|---|---|---|---|
| Type | Texture | AW (%) | pH | SOM (%) | P (ppm) | K (ppm) | Mg (ppm) | Ca (ppm) | Na (ppm) | CO32− (%) | N (kg ha−1) | P2O5 (kg ha−1) | K2O (kg ha−1) | |
| 2011 | ||||||||||||||
| M | Entisol | Clay-Loam | 12.9 | 8.8 | 1.7 | 20 | 166 | 300 | 4570 | 71 | 24.3 | 140 | 125 | 100 |
| LN-I | Inceptisol | Loam | 11.2 | 6.7 | 1.1 | 25 | 137 | 80 | 950 | 35 | 1.1 | 180 | 75 | 0 |
| VV-I | Entisol | Loam | 11.3 | 8.5 | 1.2 | 19 | 162 | 590 | 2480 | 118 | 4.2 | 180 | 75 | 0 |
| 2012 | ||||||||||||||
| P | Entisol | Silty-Clay | 14.8 | 7.9 | 3.6 | 55 | 410 | 520 | 3710 | 58 | 15 | 110 | 84 | 28 |
| LN-II | Inceptisol | Sandy-Clay-Loam | 12.4 | 7.0 | 0.8 | 15 | 111 | 220 | 1100 | 29 | 0.8 | 183 | 70 | 0 |
| V | Inceptisol | Clay | 17.3 | 8.1 | 2.2 | 23 | 633 | 290 | 5220 | 13 | 25.3 | 155 | 208 | 92 |
| VV-II | Entisol | Sandy-Clay-Loam | 12.6 | 8.5 | 1.0 | 10 | 195 | 320 | 3610 | 35 | 13.9 | 180 | 115 | 0 |
AW: available water (expressed as a percentage of the dry weight); SOM: soil organic matter; P: phosphorus; K: potassium; Mg: magnesium; Ca: calcium; Na: sodium; CO32−: carbonates; N: recommended nitrogen dose. I and II stand for 2011 and 2012, respectively.
Table 5.
Variables obtained from the fresh weights, dry weights, and carbon and nitrogen concentrations in leaves, root crowns and roots.
Table 5.
Variables obtained from the fresh weights, dry weights, and carbon and nitrogen concentrations in leaves, root crowns and roots.
| Fresh Matter | Dry Matter | ||||
| Variable | Description | Units | Variable | Description | Units |
| PFW | Plant fresh weight | g | PDW | Plant dry weight | g |
| RFW | Root fresh weight | g | RDW | Root dry weight | g |
| LFW | Leaves fresh weight | g | LDW | Leaves dry weight | g |
| CFW | Crown fresh weight | g | CDW | Crown dry weight | g |
| RTLR | Root to leaves ratio | - | RDM | Root dry matter content | g·kg−1 |
| Yield | Root fresh weight per ha | t·ha−1 | LDM | Leaves dry matter content | g·kg−1 |
| RBio | Root dry weight per ha | t·ha−1 | |||
| LBio | Leaves dry weight per ha | t·ha−1 | |||
| CBio | Crown dry weight per ha | t·ha−1 | |||
| PBio | Plant dry weight per ha | t·ha−1 | |||
| Carbon | Nitrogen | ||||
| Variable | Description | Units | Variable | Description | Units |
| RC | Root carbon content | g·kg−1 | RN | Root nitrogen content | g·kg−1 |
| LC | Leaves carbon content | g·kg−1 | LN | Leaves nitrogen content | g·kg−1 |
| CC | Crown carbon content | g·kg−1 | CN | Crown nitrogen content | g·kg−1 |
| RC/plant | Root carbon weight per plant | g | RN/plant | Root nitrogen weight per plant | g |
| LC/plant | Leaves carbon weight per plant | g | LN/plant | Leaves nitrogen weight per plant | g |
| CC/plant | Crown carbon weight per plant | g | CN/plant | Crown nitrogen weight per plant | g |
| C/plant | Total carbon per plant | g | TN/plant | Total nitrogen absorbed per plant | g |
| TC | Total carbon per ha | t·ha−1 | TN | Total nitrogen absorbed per ha | kg·ha−1 |
| CO2/plant | CO2 per plant | g | |||
| TCO2 | CO2 per ha | t·ha−1 | CNR | RC/LN | - |
Table 6.
ANOVA analysis for data collected in the first cultivation year (2011). Significance levels are indicated as * (p < 0.05), ** (p < 0.01) and *** (p < 0.001). S × F is the combined effect of Site and Fertilization. Figures highlighted in bold indicate the main contributions to the significance, according to a pairwise comparison between means using Tukey’s HSD post-hoc test. Standard errors are shown in brackets.
| Var | Treatments | Effects | |||||||||
|---|---|---|---|---|---|---|---|---|---|---|---|
| Site | Variety | Fertilization | Site | Variety | Fertilization | S × F | |||||
| M | LN-I | VV-I | Dulzata | Sandrina | N | 2 × N | |||||
| PFW | 888.64 | 1377.69 | 1808.29 | 1288.21 | 1428.20 | 1252.67 | 1463.74 | *** (87.54) | n.s. | * (71.48) | n.s. |
| YIELD | 74.73 | 92.51 | 120.94 | 95.14 | 96.98 | 92.50 | 99.62 | *** (6.72) | n.s. | n.s. | n.s. |
| LFW | 182.24 | 499.19 | 524.29 | 351.69 | 452.12 | 343.41 | 460.40 | *** (25.426) | * (20.76) | *** (20.76) | *** (35.95) |
| RTLR | 3.58 | 1.68 | 1.99 | 2.72 | 2.11 | 2.76 | 2.07 | *** (0.14) | *** (0.121) | *** (0.121) | *** (0.209 |
| RC | 423.24 | 449.65 | 429.26 | 434.26 | 433.84 | 432.98 | 435.12 | *** (4.71) | n.s. | n.s. | n.s. |
| LN | 22.38 | 19.61 | 21.89 | 20.64 | 21.95 | 20.00 | 22.55 | *** (0.39) | ** (0.32) | *** (0.32) | *** (0.56) |
| CNR | 19.09 | 23.74 | 19.73 | 21.25 | 19.88 | 21.92 | 19.21 | *** (0.45) | * (0.367) | *** (0.37) | *** (0.64) |
| PDW | 168.09 | 266.20 | 332.77 | 244.47 | 266.91 | 243.47 | 267.90 | ***(0.47) | n.s | n.s | n.s |
| RDM | 198.70 | 251.26 | 220.35 | 220.05 | 226.81 | 224.99 | 221.87 | *** (3.42) | n.s. | n.s. | n.s. |
| TN | 195.43 | 386.09 | 500.14 | 345.15 | 375.95 | 325.46 | 395.64 | *** (22.92) | n.s. | * (18.71) | * (32.41) |
| TCO2 | 31.53 | 52.53 | 63.84 | 46.65 | 51.09 | 46.35 | 51.40 | *** (3.27) | n.s. | n.s. | n.s. |
PWF, plant fresh weight; Yield, root fresh weight per ha; LFW, leaves fresh weight; RTLR, root to leaves ratio; RC, root carbon content; LN, leaves nitrogen content; CNR, carbon nitrogen ratio; PDW, plant dry weight; RDM, root dry matter content; TN, total nitrogen absorbed per ha; TCO2, CO2 per ha.
Table 7.
ANOVA analysis for data collected in the second cultivation year (2012). Significance levels are indicated as * (p < 0.05), ** (p < 0.01) and *** (p < 0.001). S × V is the combined effect of Site and Variety. Figures highlighted in bold indicate the main contributions to the significance, according to Tukey’s HSD post-hoc test. Standard errors are shown in brackets.
| Var | Treatments | Effects | |||||||
|---|---|---|---|---|---|---|---|---|---|
| Site | Variety | Site | Variety | S × V | |||||
| P | LN-II | V | VV-II | Amalia | Sandrina | ||||
| PFW | 1789.46 | - | 1534.67 | 1754.70 | 1579.32 | 1806.58 | n.s. | n.s. | n.s. |
| YIELD | 110.03 | 96.41 | 119.69 | 124.38 | 104.45 | 120.80 | * (7.47) | * (5.28) | n.s. |
| LFW | 639.52 | - | 367.92 | 482.26 | 465.29 | 527.83 | *** (31.27) | n.s. | *** (44.22) |
| RTLR | 1.43 | - | 2.83 | 2.23 | 2.11 | 2.22 | *** (0.153) | n.s. | *** (0.216) |
| RC | 423.51 | 446.25 | 441.00 | 439.10 | 437.12 | 437.81 | * (5.59) | n.s. | n.s. |
| LN | 22.46 | - | 19.18 | 20.41 | 19.99 | 21.38 | *** (0.47) | * (0.38) | n.s. |
| CNR | 19.02 | - | 23.34 | 21.97 | 22.01 | 20.73 | *** (0.59) | * (0.48) | n.s. |
| PDW | 352.23 | - | 314.98 | 330.01 | 317.14 | 347.14 | n.s. | n.s. | n.s. |
| RDM | 229.43 | 243.62 | 230.39 | 231.13 | 240.13 | 227.16 | * (3.81) | ** (2.69) | * (5.390) |
| TN | 494.02 | - | 370.72 | 362.79 | 381.71 | 436.64 | *** (24.597) | n.s. | n.s. |
| TCO2 | 69.42 | - | 62.37 | 65.98 | 62.85 | 68.99 | n.s. | n.s. | n.s. |
PWF, plant fresh weight; Yield, root fresh weight per ha; LFW, leaves fresh weight; RTLR, root to leaves ratio; RC, root carbon content; LN, leaves nitrogen content; CNR, carbon nitrogen ratio; PDW, plant dry weight; RDM, root dry matter content; TN, total nitrogen absorbed per ha; TCO2, CO2 per ha.
Table 8.
Results of the calculated climatic variables for the 2011 and 2012 cultivation periods. LN: Laguna de Negrillos; M: Magaz de Pisuerga; P: Pampliega; V: Vertavillo; VV: Villavieja.
Table 8.
Results of the calculated climatic variables for the 2011 and 2012 cultivation periods. LN: Laguna de Negrillos; M: Magaz de Pisuerga; P: Pampliega; V: Vertavillo; VV: Villavieja.
| Site | Cultivation Period (CP) and Calculated Meteorological Data | |||||||||||||
|---|---|---|---|---|---|---|---|---|---|---|---|---|---|---|
| Emergence | CP | R1 | R2 | R3 | R4 | R5 | R6 | T1 | T2 | T3 | GDD | GDD1 | GDD2 | |
| d (°C·d) | d | MJ·m−2 | MJ·m−2 | MJ·m−2 | MJ·m−2 | MJ·m−2 | MJ·m−2 | °C | °C | °C | °C·d | °C·d | °C·d | |
| 2011 | ||||||||||||||
| M | - | 190 | - | 1595 | 2530 | 1153 | 506 | 285 | 13.49 | 13.97 | 1.5 | 3249 | - | 2049 |
| LN-I | - | 180 | - | 1853 | 2459 | 1481 | 457 | 84 | 14.85 | 15.7 | −0.3 | 3048 | - | 1848 |
| VV-I | - | 201 | - | 1840 | 2839 | 1240 | 524 | 546 | 12.21 | 13.4 | 1.7 | 3412 | - | 2212 |
| 2012 | ||||||||||||||
| P | 21 (185) | 206 | 4297 | 2118 | 2544 | 1166 | 376 | 500 | 9.6 | 12.1 | 0.7 | 3207 | 3025 | 2007 |
| LN-II | 23 (205) | 203 | 4286 | 2100 | 2584 | 1279 | 363 | 428 | 10.58 | 12.7 | 0.1 | 3160 | 2955 | 1960 |
| V | 25 (210) | 191 | 3557 | 1873 | 2076 | 1183 | 447 | 207 | 10.49 | 12.9 | 1.2 | 2982 | 2772 | 1782 |
| VV-II | 22 (152) | 226 | 4460 | 2082 | 2771 | 1056 | 312 | 835 | 8.38 | 12 | 1.2 | 3593 | 3430 | 2393 |
Date of crop emergence was defined as the date on which 50% of seedlings had emerged.
Table 9.
GDD ( Growth degree-day after sowing) and days in which emergence took place for each of the locations in 2012. Date of crop emergence was defined as the date on which 50% of seedlings had emerged.
Table 9.
GDD ( Growth degree-day after sowing) and days in which emergence took place for each of the locations in 2012. Date of crop emergence was defined as the date on which 50% of seedlings had emerged.
| Site | Days | GDD (°C·d) | Temperature Gradient (Tmax−Tmin) |
|---|---|---|---|
| VV | 22 | 152 | 18.1° |
| P | 21 | 185 | 15.5° |
| LN | 23 | 205 | 14.6° |
| V | 25 | 210 | 14.1° |
VV: Villavieja; P: Pampliega; LN: Laguna de Negrillos; V: Vertavillo.
© 2018 by the authors. Licensee MDPI, Basel, Switzerland. This article is an open access article distributed under the terms and conditions of the Creative Commons Attribution (CC BY) license (http://creativecommons.org/licenses/by/4.0/).
Share and Cite
MDPI and ACS Style
Sánchez-Sastre, L.F.; Martín-Ramos, P.; Navas-Gracia, L.M.; Hernández-Navarro, S.; Martín-Gil, J. Impact of Climatic Variables on Carbon Content in Sugar Beet Root. Agronomy 2018, 8, 147. https://doi.org/10.3390/agronomy8080147
AMA Style
Sánchez-Sastre LF, Martín-Ramos P, Navas-Gracia LM, Hernández-Navarro S, Martín-Gil J. Impact of Climatic Variables on Carbon Content in Sugar Beet Root. Agronomy. 2018; 8(8):147. https://doi.org/10.3390/agronomy8080147
Chicago/Turabian StyleSánchez-Sastre, Luis F., Pablo Martín-Ramos, Luis M. Navas-Gracia, Salvador Hernández-Navarro, and Jesús Martín-Gil. 2018. "Impact of Climatic Variables on Carbon Content in Sugar Beet Root" Agronomy 8, no. 8: 147. https://doi.org/10.3390/agronomy8080147
Note that from the first issue of 2016, this journal uses article numbers instead of page numbers. See further details here.