Maize Canopy Photosynthetic Efficiency, Plant Growth, and Yield Responses to Tillage Depth
by
 ,
,
Jiying Sun
1,* ,
,
Julin Gao
1,*,
Zhigang Wang
1,
Shuping Hu
2,
Fengjie Zhang
1,
Haizhu Bao
1 and
Yafang Fan
1 1
College of Agronomy, Inner Mongolia Agricultural University, No.275, XinJian East Street, Hohhot 010019, China
2
Vocational and Technical College, Inner Mongolia Agricultural University, Baotou 014109, China
*
Authors to whom correspondence should be addressed.
Agronomy 2019, 9(1), 3; https://doi.org/10.3390/agronomy9010003
Submission received: 27 October 2018
/
Revised: 5 December 2018
/
Accepted: 8 December 2018
/
Published: 21 December 2018
(This article belongs to the Special Issue Environmental and Management Factor Contributions to Maize Yield)
Abstract
:Subsoil tillage loosens compacted soil for better plant growth, but promotes water loss, which is a concern in areas that are commonly irrigated. Therefore, our objective was to determine the physiological responses of high yield spring maize (Zea mays L.) to subsoil tillage depth when grown in the Western plain irrigation area of Inner Mongolia, China. Our experiment during 2014 and 2015 used Zhengdan958 (Hybrid of Zheng58 × Chang7-2, produced by Henan academy of agricultural sciences of China, with the characteristics of tight plant type and high yield) and Xianyu335 (Hybrid of PH6WC × PH4CV, produced by Pioneer Corp of USA, with the characteristic of high yield and suitable of machine-harvesting) with three differing subsoil tillage depths (30, 40, or 50 cm) as the trial factor and shallow rotary tillage as a control. The results indicated that subsoil tillage increased shoot dry matter accumulation, leading to a greater shoot/root ratio. Subsoil tillage helped retain a greater leaf area index in each growth stage, increased the leaf area duration, net assimilation rate, and relative growth rate, and effectively delayed the aging of the blade. On average, compared with shallow rotary, the grain yields and water use efficiency increased by 0.7–8.9% and 1.93–18.49% in subsoil tillage treatment, respectively, resulting in the net income being increased by 2.24% to 6.97%. Additionally, the grain yield, water use efficiency, and net income were the highest under the treatment of a subsoil tillage depth of 50 cm. The results provided a theoretical basis for determining the suitable chiseling depth for high-yielding spring corn in the Western irrigation plains of Inner Mongolia.
1. Introduction
Soil is an important carrier of crop growth, and improving soil quality can effectively improve crop yield. Crop yields, in turn, are directly affected by the quality of the ploughing layer. The average effective ploughing layer of the irrigated area in the Inner Mongolia Plain is only 15.1 cm, which is less than China’s average value of 16.5 cm and far shallower than that in North America, which has an average effective plough layer of 35 cm. As maize roots are mainly distributed in the soil layer of 3–35 cm [1], the compacted soil below the plough layer not only restricts the development of plant roots, but also hinders the absorption of mineral nutrients and water for plants, and therefore reduces the production capacity of the plant canopy as well as limits the grain yield [2,3]. Notably, appropriate soil tillage measures have great effects for improving the soil’s physical and chemical properties, farmland soil quality, and maize photosynthesis efficiency.
Canopy structure greatly influences the leaf photosynthetic rate [4]. Many studies have focused on the canopy structure and physiological characteristics of corn in Inner Mongolia and abroad [5,6,7,8]. Leaves are the main organs for photosynthesis, which account for about 95% of the total in maize. Theoretically, yield would be increased by about 1–2% per day if the duration of photosynthetic is extended in maturity [9,10]. The rate of photosynthesis and grain filling in plants are directly affected by the leaf area duration and leaf area index (LAI). The LAI represents the amount of leaf area and is an important quantitative index of canopy structure [11,12,13]. Leaf senescence is dependent on LAI; the higher the LAI, the less senescence of corn leaves. Within a range from 0 to the optimum maximum leaf area index (e.g., the optimum maximum leaf area index for maize is 5–6), the larger the LAI, the greater the solar utilization efficiency [14,15,16], and LAI is closely related to the grain number and weight during the filling stage [17,18]. Early research showed that LAI increased with an increased plant density from the jointing stage to the 12-leaves stage, and peaked at the silking stage, which laid a foundation for the accumulation of dry matter in the later period of flowering [19]. Some studies demonstrated that modern maize varieties had longer growth periods, larger leaf areas, and slower leaf senescence, leading to a significant increase of the dry matter accumulation rate compared to early varieties; thus, dry matter accumulation is closely related to leaf senescence [20]. Dry matter accumulation can be improved by increasing the dry matter production rate and duration, which directly affects the corn yield.
However, linkages between the dynamics depth of subsoil tillage and photosynthetic characteristics in different spring corn on the irrigated area of the Inner Mongolia Plain have not been revealed. Therefore, with a comprehensive database, we aimed to (1) investigate the effects of the subsoil tillage depth on the canopy’s photosynthetic efficiency, plant growth, and yield of maize, and (2) to fully explore the mechanisms behind the observations.
2. Materials and Methods
2.1. Experimental Site
The field experiment was conducted during 2014 to 2015 in Hulutou village and Zhuergedai village, Salaqi Town, Tumd Right County, Baotou, Inner Mongolia, China. The region, located in the Tumochuan plain has a typical continental semi-arid monsoon climate. Specifically, the annual mean temperature and annual mean precipitation are 7.5 °C and 346 mm, respectively, and maximum temperatures occurred in July (average of 22.9 °C). The region experiences 135 frost-free days and an average of 3095 annual sunshine hours. Drought is the main factor that affected the yield in 2015. The precipitation in 2014 and 2015 varied greatly, with 457.4 mm in 2014 and 230.3 mm in 2015 from May to October, while slight fluctuations of the monthly mean temperature were observed with the highest mean temperature of 23.9 °C in July 2014 and 24.6 °C in July 2015, and the lowest mean temperature of 11.2 °C in October 2014 and 9.7 °C in October 2015 (Figure 1).
Soil properties of the experimental sites are shown in Table 1. The preceding crop (spring maize) in the experimental field, which was subjected to conventional shallow rotary tillage for three years, and the maize stalks were shredded and returned to the field after the corn was harvested.
2.2. Experimental Treatments and Design
Subsoil tillage depth (30 cm, 40 cm, and 50 cm, designated CH30, CH40, or CH50, respectively) was the trial factor, and was compared to a control of shallow rotary tillage (SR). In 2014, the tested variety was Xianyu335 with a row distance of 50 cm and a plant density of 82,500 plants per ha. Each subplot was an area of 125 m2, 5 m wide, and 25 m long, with three replications, for a total of 12 plots in a randomized block arrangement. A split-plot design was used for the experiment in 2015, with the subsoil tillage depth (30 cm, 40 cm, 50 cm, and control) as the main factor and varieties (Xianyu335 and Zhengdan958) as the sub-factor. The plant density, row distance, plot size, and the replications were the same with 2014, for a total of 24 plots. All in-crop fertilizer of nitrogen fertilizer, phosphate fertilizer and potash fertilizer was applied at planting (N: 200 kg/ha, P2O5: 105 kg/ha and K2O: 62 kg/ha). Phosphate fertilizer and potash fertilizer were applied as basal fertilizer once before planting and nitrogen fertilizer was applied by 30% (60 kg/ha) at the V6 stage (six leaves with collars visible) and 70% (140 kg/ha) at the V12 stage (12 leaves with collars visible), respectively. Irrigation and other management measures during the whole growth period were similar to local farmer practices. The precipitation and the irrigation rate during the growth stage was recorded.
2.3. Measured Parameters
2.3.1. Leaf Area
Plants were sampled at five growth stages: V6 stage (six leaves with collars visible), V12 stage (12 leaves with collars visible), R1 stage (silking stage), R3 stage (filling stage), and R6 stage (physiological maturity) by three areas in each plot, and in each area, three continuous plants (9 plant per plot) were sampled.
Leaf area was calculated by the leaf length and leaf width at V6, V12, R1, R3, and R6, respectively:
where A1 was the area of expanded leaves and A2 represents the area of unexpanded leaves.
A1 = 0.75 × Leaf Length × Leaf width
A2 = 0.50 × Leaf Length × Leaf width
2.3.2. Accumulation and Transport of Dry Matter
At the V6 stage, V12 stage, R1 stage, R3 stage, and R6 stage, three sample areas per plot were chosen, and three uniform plants per area were selected and divided into four parts: Leaf, stem and sheath, female ear, and grain. At the R1 stage, the corresponding roots were examined in the depth of 0–60 cm. Fresh samples were deactivated at 105 °C for 30 min, and dried at 80 °C to a constant weight in an oven, then dry matter of the leaf, stem and sheath, female ear, and grain were weighed.
2.3.3. Photosynthesis Related Parameters
Gas exchange measurements (photosynthesis rate, transpiration rate, stomatal conductance, and intercellular CO2 concentration) were taken between 9:00 am to 11:00 am at the R3 stage on the ear leaf of three uniform plants from three selected sample areas within each plot using a Li-6400XT Portable Photosynthesis System (Li-Cor Inc., Lincoln, NE, USA). The chamber was adjusted to 25 °C (temperature), 360 μM/mol (CO2), and 800 μM/m2/s (photosynthetic photon-flux density).
2.3.4. Production of Photosynthesis
Leaf water use efficiency (LWUE), leaf area duration (LAD), and net assimilation rate (NAR) were calculated by the following formula:
where LWUE is the water use efficiency at the leaf level, Pn is the photosynthesis ratio of the ear leaf at the R3 stage, and Tr is the transpiration ratio of the ear leaf at the R3 stage.
where L1 and L2 are the leaf area at time t1 and t2, respectively; W1 and W2 are the dry matter weight at time t1 and t2, respectively.
LWUE (μmolCO2/mmolH2O) = Pn/Tr
LAD [(m2·d)/hm2] = [(L1 + L2)/2] × (t2 − t1)
NAR [g/(m2·d)] = [(ln L2 − ln L1) × (W2 − W1)]/[( L2 − L1) × (t2 − t1)]
2.3.5. Stover Biomass and Grain Yield
To evaluate the stover biomass and grain yield of maize, plants were sampled at the R6 stage. Sampling consisted of manually excising plants from each plot at R6 (three sample areas for each plot, each sample area had six continuous plants, 18 plants per plot) to determine the stover biomass. The plants at R6 were partitioned into the grain and stover (including husk) components, the total fresh stover was dried to 0% moisture and then weighed. Corn ears were weighed to obtain the grain and cob weight. The grain was removed manually to analyze the moisture content with a seed moisture meter (PM-8188-A, KETT ELECTRIC LABORATORY, Tokyo, Japan), the cob and the grain were dried and weighed again. Dry stover and dry cob weights were summed to calculate the overall R6 stover biomass. 300 randomly selected kernels were weighed to estimate the average individual kernel weight. The kernel number was estimated by dividing the grain yield by the average individual kernel weight of each plot; the kernel number per corn ear was estimated by dividing the kernel number by the number of the corn ear of each plot. All biomass and grain weight measurements were presented on a 0% moisture concentration basis.
Plant stand counts were tallied to confirm plant populations at the R6 plant growth stage. Additionally, ear stand counts were tallied to confirm the ear number per hm2. The center two rows of each plot were manually harvested to determine the grain yield at physiological maturity, and yield values were presented at 0% moisture concentration too.
2.3.6. Yield Water Use Efficiency (YWUE) and Water Production Efficiency (WPE)
YWUE is defined as the ratio of the grain yield to the water consumed, and it is used to evaluate the plant growth suitability under a water deficit. The WUE was calculated by:
where YWUE is the water use efficiency at the yield level, GY is the grain yield, and ET is the maize water consumed.
YWUE (kg/ha·mm) = GY/ET
WPE is defined as the ratio of biomass yield to the water consumed, and it also is an effective indicator for evaluating the plant growth ability. The WPE was calculated by:
where WPE is the water production efficiency, BY is the biomass yield, and ET is the maize water consumed.
WPE (kg/ha·mm) = BY/ET
Evapotranspiration is the sum of evaporation from the land surface plus transpiration from plants. The evapotranspiration (ET) was calculated by:
where ET is the maize water consumed, P is the precipitation during the growth stage, I is the irrigation rate during the growth stage, and ∆SWS is the balance between the soil pondage in the sowing time and the harvest time.
ET = P + I + ∆SWS
Soil water storage is an important parameter of soil water conservation and field irrigation. The SWS was calculated by:
SWS = Soil depth × Soil volume weight × Soil moisture
At sowing time and harvest time, 0–100 cm depth soils were sampled to measure the soil volume weight and soil moisture from five areas of each plot, using the cutting ring to sample in 0–20 cm, 20–40 cm, 40–60 cm, 60–80 cm, and 80–100 cm soil, with three cutting rings for each soil layer. The fresh weight was weighed, the soil from the cutting ring was excavated, and the soil was put into the oven to dry to 0% moisture. Then it was weighed again, the volume of the cutting ring was measured, and the soil moisture and soil volume weight were calculated.
2.4. Statistical Analysis
Analysis of variance (ANOVA) was used to evaluate treatment effects. Data of the biomass accumulation, leaf area index, ear leaf photosynthetic assimilation, transpiration rate, stomatal conductance and intercellular CO2 concentration, leaf water use efficiency, dynamics of leaf area duration, net assimilation rate, maize yield, yield components, and economic benefit were analyzed with variance analysis of SAS (Statistical Analysis System) [21]. Pearson’s correlation coefficient was used to evaluate the linear association between the grain yield and measured parameters across all treatments and within each rotation, by the correlation analysis procedure of SAS.
3. Results
3.1. Effect of Subsoil Tillage Depth on Dry Matter Accumulation of Maize
With the development of the growth stage, the accumulation of dry matter gradually increased. In 2014, the accumulation of dry matter in the subsoil tillage treatment was significantly higher than that in control during all the growth periods except for the V12 stage. In the V6 stage, V12 stage, R1 stage, R3 stage, and R6 stage, plants in CH50 tillage had higher dry matter accumulation than the control by 78.33%, 16.48%, 13.63%, 56.61%, and 20.79%, respectively; CH40 tillage increased plant growth by 51.46%, 2.56%, 13.11%, 29.76%, and 7.20% compared to the control. Additionally, CH30 was the same as the aforementioned groups, overtopping SR (shallow rotary tillage) by 35.00%, 4.01%, 24.06%, 23.69%, and 8.75% (Table 2). In summary, deeper subsoil tillage led to greater total dry matter than that of the control.
In 2015, the growth performance trend of the accumulation of dry matter was consistent with that of 2014. Deeper subsoil tillage led to higher total dry matter accumulation than that of the control. The accumulation of dry matter in the tillage of subsoil tillage treatment was significantly higher than that in the control for most of the growth periods.
In the V6 stage, V12 stage, R1 stage, R3 stage, and R6 stage, Xianyu335 treated with CH50 tillage had higher dry matter accumulation than the control by 50.58%, 21.98%, 19.91%, 23.70%, and 5.09%, respectively; CH40 tillage increased plant growth by 12.21%, 8.55%, 11.23%, and 10.55% in the V6 stage, V12 stage, R1 stage, and R3 stage compared to the control; however, no significant difference was between the control in the R6 stage. CH30 was the same as the aforementioned groups, overtopping SR by 6.20%, 9.16%, 17.42%, and 3.55% in the V6 stage, V12 stage, R3 stage, and R6 stage, while no significant difference between the control in the R1 stage was observed (Table 2).
Compared with the control, the dry matter accumulation of Zhengdan958 under the treatments of CH50 was improved by 40.99%, 37.37%, 24.77%, 9.95%, and 10.19% in the V6 stage, V12 stage, R1 stage, R3 stage, and R6 stage, respectively; dry matter accumulation of Zhengdan958 under the treatments of CH40 was improved by 56.70%, 16.56%, 18.48%, 5.14%, and 12.97% in the V6 stage, V12 stage, R1 stage, R3 stage, and R6 stage, respectively; dry matter accumulation of Zhengdan958 under the treatments of CH30 was improved by 30.08%, 8.07%, 19.61%, 6.20%, and 10.44% in the V6 stage, V12 stage, R1 stage, R3 stage, and R6 stage, respectively (Table 2).
The results of the two years of experiment showed that subsoil tillage could increase dry matter accumulation and lay a foundation for greater grain fill and, therefore, increase yield. The response of the dry matter accumulation by Xianyu335 to subsoil tillage depth was more sensitive than the response by Zhengdan958 (Table 2).
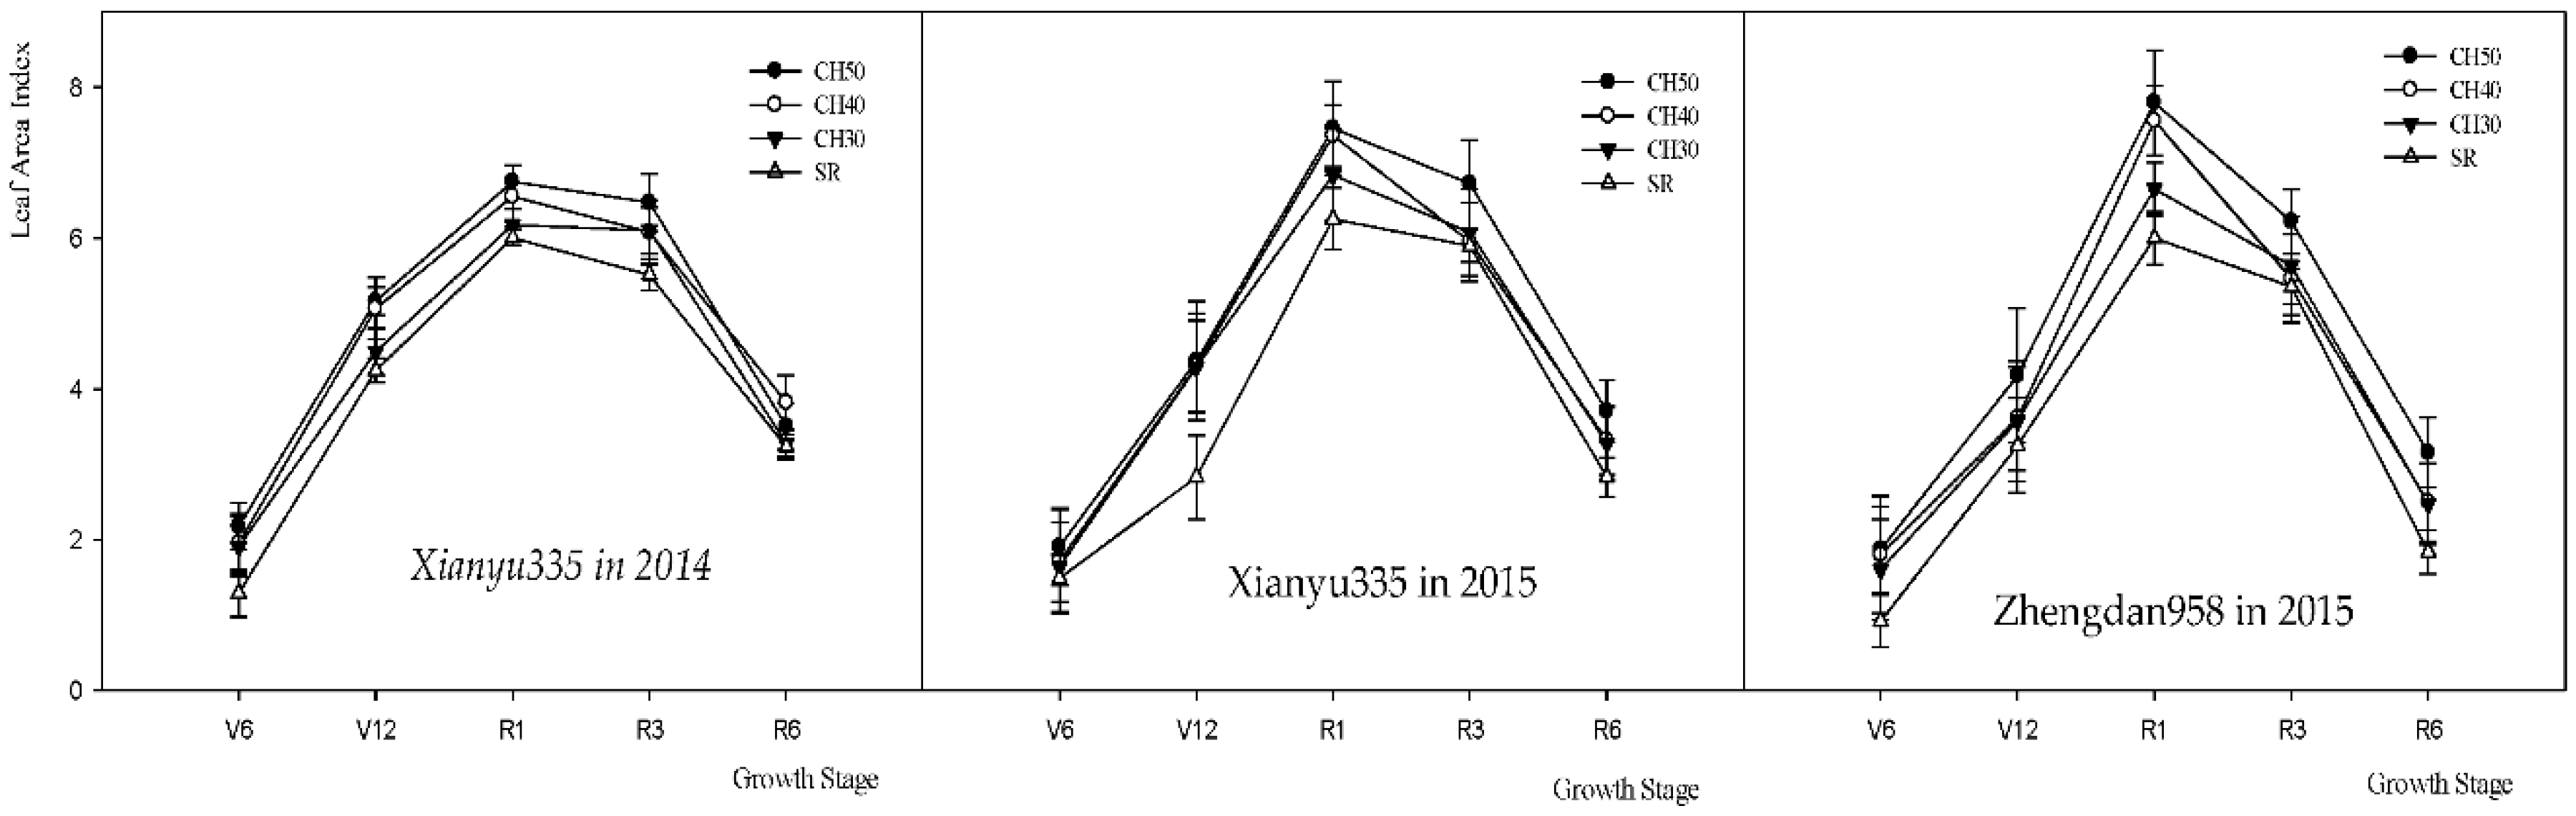
3.2. Effects of Subsoil Tillage Depth on Leaf Area Index of Maize
The size of the green leaf area directly affects the photosynthetic ability of plants and is an important index that determines the yield. Our results indicated that all plants reached maximum LAI at the R1 stage, and gradually showed a decreasing trend after the R1stage (Figure 2).
The results over the two years showed that CH50 led to a greater LAI than the control. The CH40 treatment led to a greater LAI than the control over the whole growth period except in the R3 stage in 2015. The CH30 treatment lead to a greater LAI than the control, except in the V12 stage and R1 stage in 2014. At other growth stages, CH30 treatment led to a greater LAI than the control. The results showed that subsoil tillage depth could lead to maintenance of a relatively high LAI and more prolonged LAI at different stages, which provided the possibility for plants to capture more light for photosynthesis.
The LAI of Zhengdan958 was greater than that of Xianyu335 from the V3 stage to the R1 stage, but less than that of Xianyu335 after the R1 stage, indicating that the leaf senescence of Zhengdan958 was faster than that of Xianyu335 after the R1 stage.
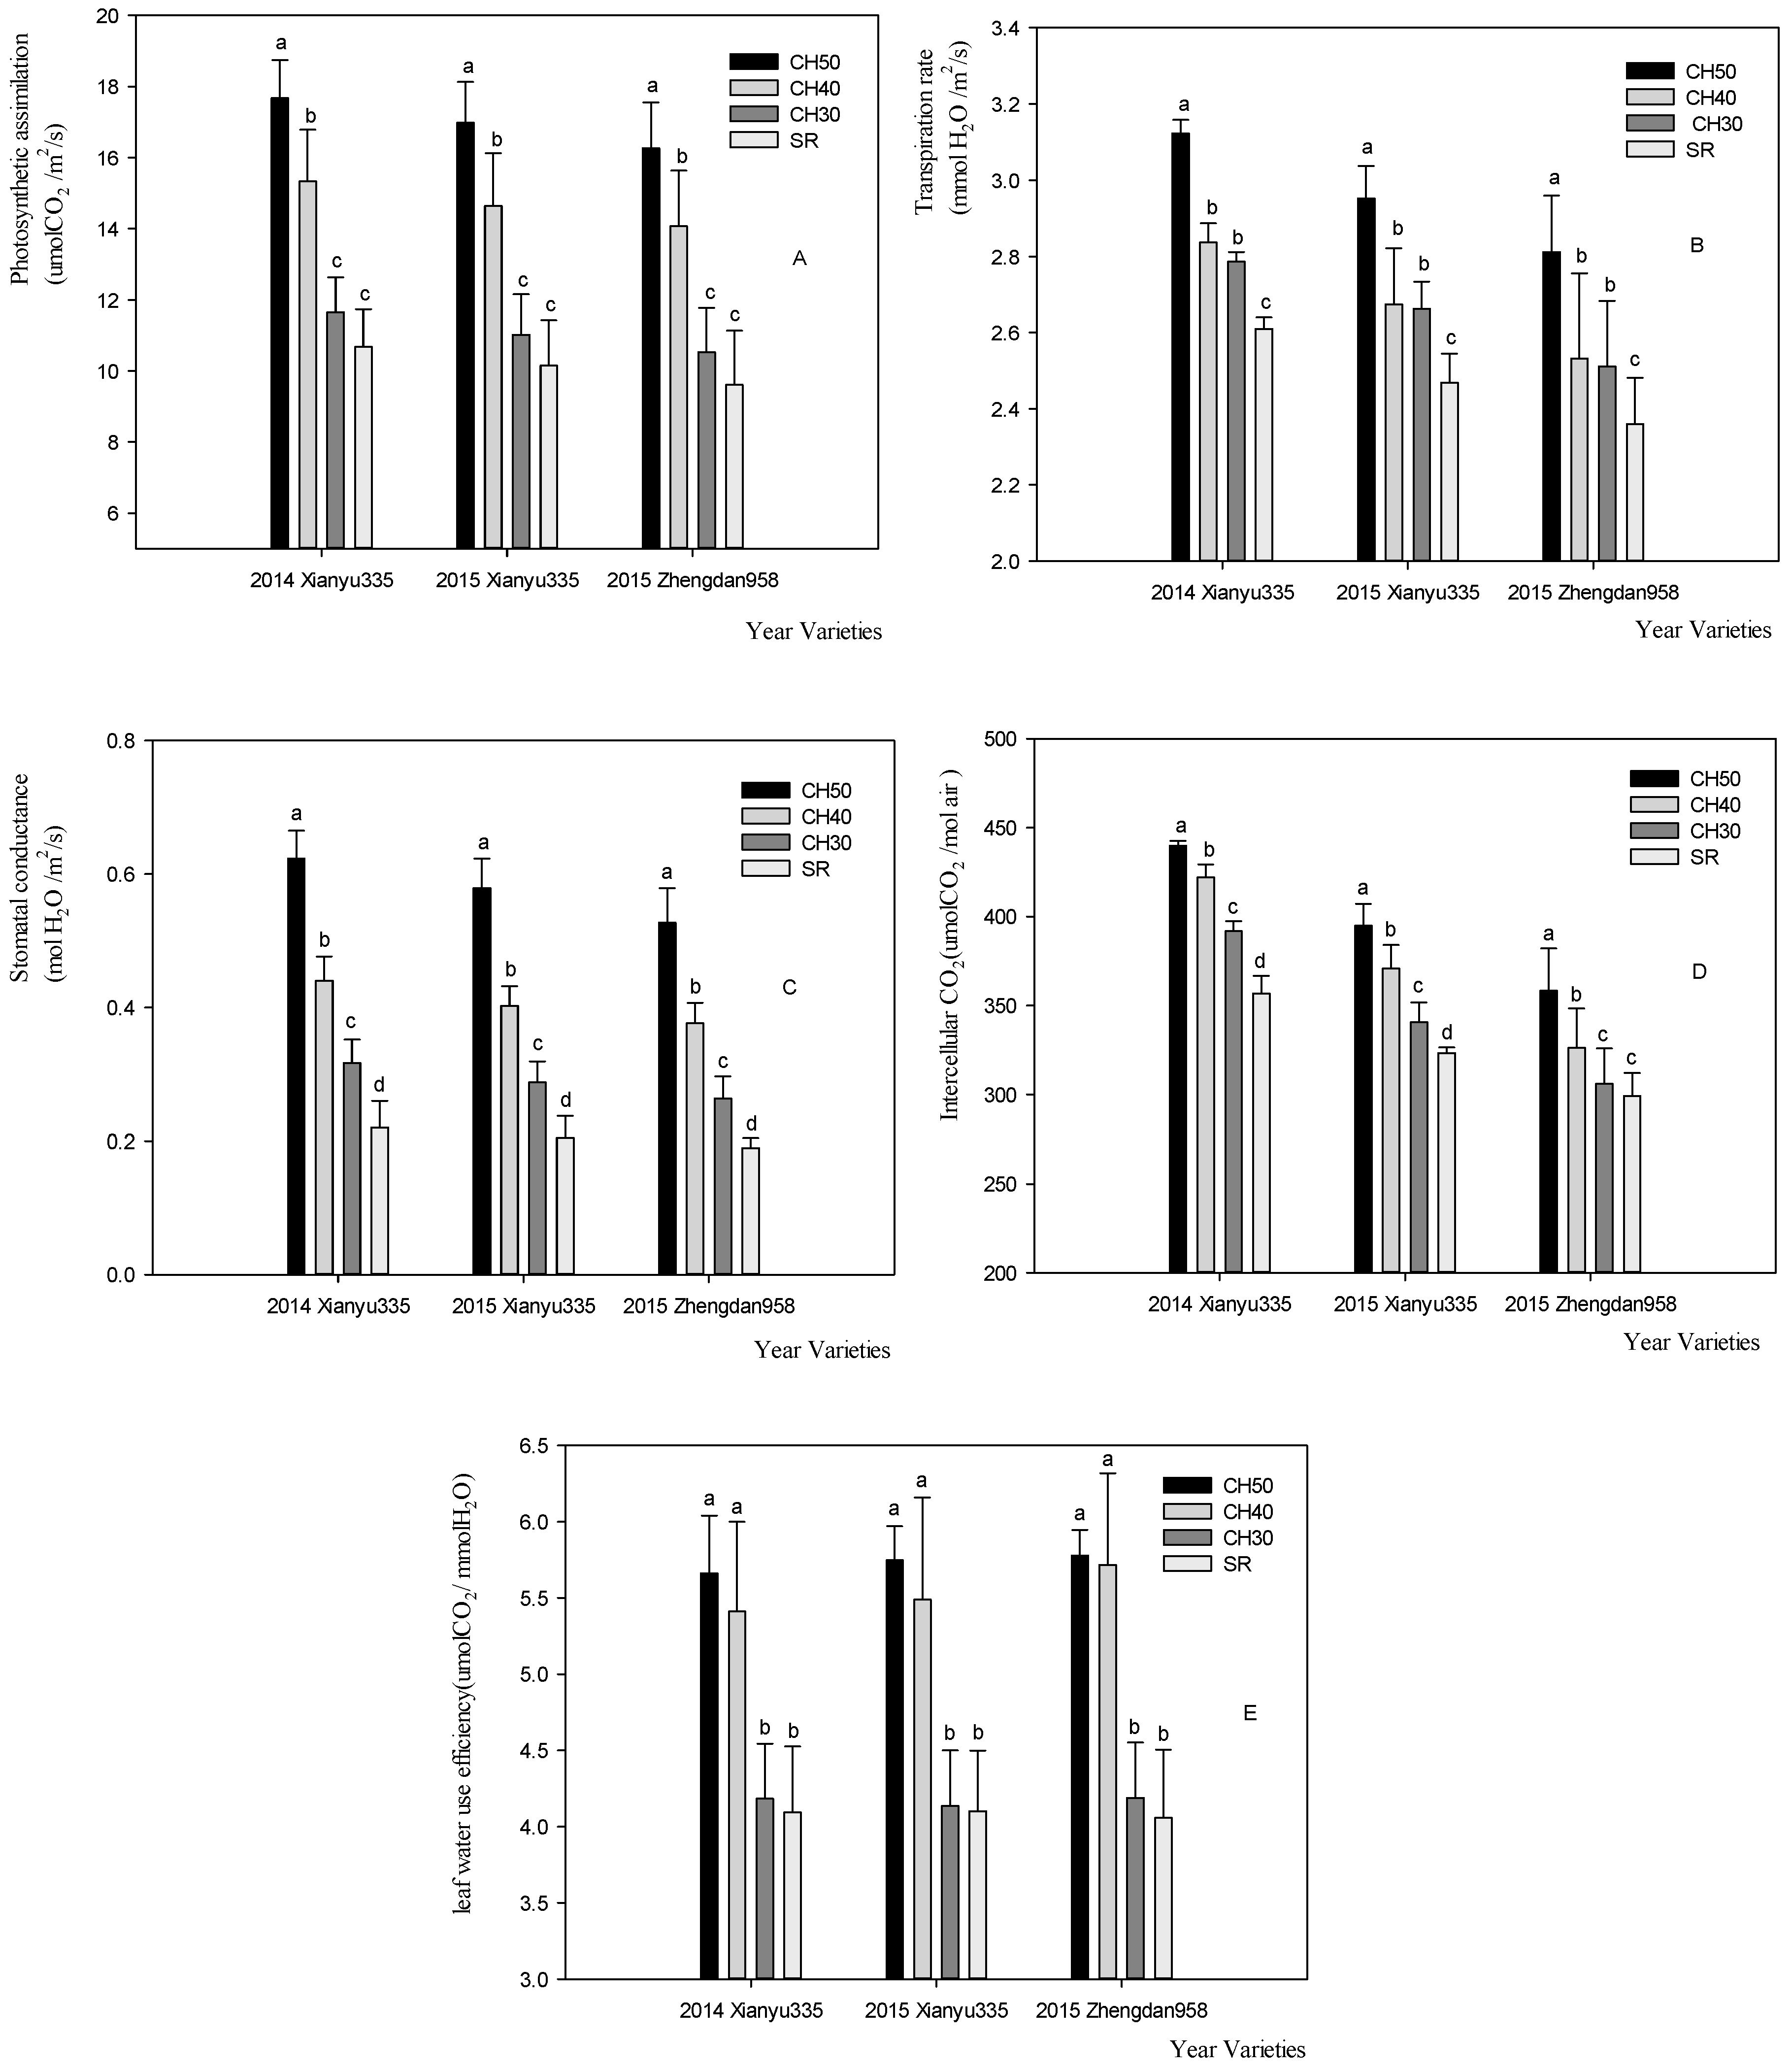
3.3. Photosynthesis Related Parameters of Ear Leaf
Photosynthetic assimilation (Pn), transpiration rate (Tr), stomatal conductance (Gs), intercellular CO2 concentration (Ci), and leaf water use efficiency of the Maize cultivars, Xianyu335 and Zhengdan958, were obviously affected by the subsoil tillage depth in different years (Figure 3A–E).
Pn of the maize ear leaf in different varieties and different years treated by CH50 and CH40 was significantly higher than that of CH30 and the control, and there were no significant differences between CH30 and the control. Pn of the maize ear leaf treated by CH50 and CH40 increased by 61.25–69.20% and 41.46–49.88% more than the control. Tr of the maize ear leaf in different varieties and different years of subsoil tillage was significantly higher than that of the control. Among the treatments, the Tr of the maize ear leaf treated by CH50 was the highest, and there was no significant difference between the treatment of CH40 and CH30. Tr of the maize ear leaf treated by CH50, CH40, and CH30 increased by 19.14–19.67%, 7.29–8.69%, and 6.43–7.87% more than the control. As for stomatal conductance (Gs) and intercellular CO2 concentration (Ci), the subsoil tillage resulted in a significant influence in Gs compared to the control in different varieties and years. Among the four-trial treatment, the Gs increased from the control to the CH30, and then the CH40, and the highest Gs was the CH50. The difference was significant between SR, CH30, CH40, and CH50. Ci of the ear leaf of Xianyu335 in 2014 and 2015, and were significantly different between the subsoil tillage and the control. The Ci of the ear leaf of Zhengdan958 treated by CH50 and CH40 was significantly higher than that of CH30 and the control, and there was no significant difference between CH30 and the control. Leaf water use efficiency treated by CH50 and CH40 was significantly higher than that of CH30 and the control, and there was no significant difference between CH50 and CH40, and no significant difference between CH30 and the control either. Leaf water use efficiency of maize treated by CH50 and CH40 increased by 38.29–42.41% and 32.21–40.87% more than the control.
3.4. Effects of Subsoil Tillage Depth on Dynamics of Leaf Area Duration
Photosynthetic productivity was not only related to LAI, but also related to LAD. The duration of the leaf area reflects the photosynthesis time of maize, so it has great influence on the yield because the grain is primarily composed of starch. Table 3 shows that a significantly higher LAD was observed after silking, in descending order, followed by CH50, CH40, CH30, and the control. LAD in the CH50 treatment was significantly greater than that of CH40 or CH30; and there was a smaller difference of LAD between the CH40 and CH30 treatments. The LAD from the silking stage to the filling stage sustained the best during the growth stage, then it began to decrease, and the decrease from the filling stage to maturity was more pronounced, with no difference between the two varieties in LAD response to the subsoil tillage depth (Table 3).
3.5. Effects of Subsoil Tillage Depth on Net Assimilation Rate
From Table 4, compared with the control, there was a significant difference in NAR between the V6 stage to the V12 stage due to the subsoil tillage depth treatment, and the order of NAR under different tillage depth treatments was as follows: CH50 < CH40 < CH30 < SR, which reflected the rapid recovery of plant growth in this period due to the restriction of early growth.
As for the plant NAR, no significant difference between the treatments from the V12 stage to the R1 stage was observed, which indicated that the vegetative growth of the treatment was stable. Meanwhile, the NAR from the R1 stage to the R3 stage was clearly higher than that in the control. Additionally, the subsoil tillage treatment showed greater advantages than the control. Our results indicated that during the reproductive stages, the NAR in all the subsoil tillage depth treatments increased because of the increase of the filling rate. The performance in the subsoil tillage depth treatment from the R3 stage to the R6 stage was significantly lower than that in the control, which indicated that the subsoil tillage treatment improved the NAR of the maize plant in the stage from R1 to R3, and with enough assimilation of photosynthesis, the NAR of the maize plant treated by the subsoil tillage declined to be lower than that of the control. The two varieties in 2015 had similar responses to NAR for the tillage depth.
3.6. Effects of Subsoil Tillage Depth on Shoot-Root Ratio
Table 5 shows that the dry weight of stem, leaf, female ear, and root in the subsoil tillage increased significantly compared with that in the shallow rotary tillage treatment in 2014. The dry weights of the stem, leaf, female ear, and root of Xianyu335 plants receiving the CH50 and CH40 treatments in 2015, except the CH30 treatment, increased significantly compared to those receiving the shallow rotary tillage treatment.
However, the dry weight of the stem, leaf, female ear, and root of Zhengdan958 were significantly increased with tillage compared to the shallow rotary tillage treatment. The ratio of shoot-root of plants receiving the subsoil tillage depth treatments was greater than that from the shallow rotary tillage treatment, which indicated that the growth of shoot aboveground was more than that of the root system, and therefore resulted in the accumulation of greater shoot aboveground and an increase in yield. The ratio of shoot -root in 2015 was lower than that in 2014, which was due to the drought in 2015. In this condition, the crop growth was under water stress, thus the relative biomass of the root system increased, and the ratio of shoot- root decreased [22].
3.7. Effects of Subsoil Tillage Depth on Maize Yield and Economic Benefit
3.7.1. Effects of Subsoil Tillage Depth on Maize Yield and Its Components
Table 6 shows that there were significant differences in the biomass accumulation and yield due to the tillage depth. In 2014, the subsoil tillage of CH50, CH40, and CH30 increased yields more than that of the control (SR) by 6.9%, 3.5%, and 3.5%, respectively, with an average increase of 4.6%.
The biomass from the CH50 tillage was 10.6% higher than that in the control. The CH50 tillage led to a significantly greater biomass than that in SR. However, there was no significant difference in the biomass between the CH40, CH30, and SR treatments. In 2015, the yield of the two varieties showed the same trend, with the subsoil tillage depth treatments generating greater yields than those receiving the shallow rotary tillage treatment. Subsoil tillage increased Xianyu335 yields by 3.7% to 8.9%, but there was no significant difference between the CH40 and CH30 treatments. The biomass in the subsoil tillage depth treatment was significantly higher than that of SR, with an average increase of 5.0%. As for Zhengdan958, plants in the CH50, CH40, and CH30 tillage treatment increased the yield, on average, by 4.0%, 1.5%, and 0.7%, respectively. In addition, the biomass of Zhengdan958 increased by 6.0%, 3.9%, and 3.7% compared to the control. There was no significant difference among the three treatments in biomass.
For the production components, the 100-grain weight of Xianyu335 was significantly increased by the subsoil tillage depth treatment, but not for Zhengdan958. It indicated that the treatment of deepening the subsoil depth could lead to a significant increase in the 100-grain weight of Xianyu335, but no significant increase of Zhengdan958.
3.7.2. Correlation Analysis between Canopy Characteristics and Yield
Correlation analysis between the canopy characteristics and yield showed that the leaf area duration, stover biomass dry matter, and leaf area index were significantly positively correlated with the yield at the 0.01 probability level. Photosynthesis assimilation, transpiration ratio, stomatal conductance, and intercellular CO2 concentration were significantly positively correlated with the yield at the 0.05 probability level (Table 7). The net assimilation rate, photosynthesis rate, and intercellular CO2 concentration were significantly positively correlated with leaf water use efficiency at the 0.05 probability level. The correlation coefficients of the leaf area duration, stover biomass dry matter, and leaf area index with the yield were 0.997, 0.972, and 0.952, and the correlation coefficients of the photosynthesis ratio, transpiration ratio, stomatal conductance, and intercellular CO2 concentration were 0.948, 0.979, 0.980, and 0.976, respectively. The results showed that the leaf area duration and dry matter were the main factors affecting the grain yield. The correlation coefficients of the net assimilation rate, photosynthesis rate, and intercellular CO2 concentration with the leaf water use efficiency were 0.963, 0.981, and 0.928, respectively. The results showed that the ear leaf photosynthesis rate and the plant net assimilation rate were the main factors affecting the leaf water use efficiency.
3.7.3. Effect of Subsoil Tillage Depth on Water Use Efficiency
Regardless of drought or rainy years, plant WUE was significantly improved by the subsoil tillage depth treatment (Table 8). In 2014, the treatments of CH50, CH40, and CH30 increased WUE by 14.62%, 8.29%, and 6.92%, respectively. In 2015, CH50, CH40, and CH30 increased WUE of Xianyu335 by 18.49%, 8.74%, and 9.53% respectively, and WUE of Zhengdan958 by 6.41%, 1.93%, and 2.28% respectively, compared with the control. The two years of data showed that the CH50 treatment led to higher WUE under the condition of the lower water availability, followed by CH40 and CH30. Notably, there was no significant difference in WUE between the CH40 and CH30 treatments.
In 2014, CH50, CH40, and CH30 increased WPE more than the control by 18.40%, 7.11%, and 4.34%, respectively; in 2015, the WPE of Xianyu335 increased by 15.66%, 9.32%, and 8.52%, and 8.45%, 4.48%, and 4.70% of Zhengdan958, respectively. The CH50 tillage increased WPE by 3.80% and 3.58% compared to CH40 and CH30, respectively, but WPE showed no significant difference between the CH40 and CH30 treatments.
3.7.4. Economic Benefit Analysis
The depth of the subsoil tillage is an important factor for farmers when considering the cost. Therefore, our experiment analyzed the economic input-output ratio for growing maize using the different tillage depths.
The results are presented in Table 9. On average, from 2014 to 2015, the net income increased due to increasing depths of the subsoil tillage by 2.24% to 6.97% more than that of the shallow rotary tillage treatment. Among them, the subsoil tillage depth of 50 cm led to the highest returns, followed by tillage to a depth of 30 cm. There was no significant difference between the yields from tilling to 40 cm versus 30 cm depths. The test results showed that the most economic advantage was the subsoil tillage to a depth of 50 cm. Thus, the results of this study could offer a reference for farmers to choose the subsoil tillage depth and to increase income.
4. Discussion
4.1. The Effect of Subsoil Tillage on Corn Canopy
As the leaf area of the maize plants and Pn, Tr of the maize ear leaf treated with subsoil tillage increased, the total dry matter accumulation amount and the rate increased; especially at the later stage, the yield was significantly increased [23,24,25,26]. The yield of spring corn increased by 14.6% through subsoil tillage [27], which may have loosened soil, improved permeability, and promoted dry matter accumulation of winter wheat and summer corn [28,29], and in so doing, significantly improved the grain yield and water utilization efficiency of crops [30,31,32]. This study indicated that subsoil tillage could result in a high photosynthetic assimilation, transpiration rate, stomatal conductance and intercellular CO2 concentration at the R3 stage, maintain a relatively high LAI in different growth periods, and increase LAD. The deeper the subsoil tillage, the longer it maintained plant vitality. The subsoil tillage effectively delayed leaf senescence, which provided the possibility for plants to capture more light for photosynthesis. The net assimilation rate in the late silking period was obviously increased by the subsoiling tillage compared to the control, with CH50 > CH40 > CH30. These results indicated that subsoil tillage was beneficial to the accumulation of dry matter in the early growth stage and laid a foundation for the formation of yield in the late growth period.
Many studies have demonstrated that subsoil tillage increased soil porosity, water infiltration, as well as root penetration [33]. Similar initial decreases in soil density and penetration resistance compared to no-tillage plots [33]. Subsoil tillage practices can improve the content of water and nutrient in soil [34], increase soil structure [35] and promote crop yields [36]. Specifically, compared to rotary tillage, subsoil tillage led decrease in water consumption by 1.5%, increase in soil water content by 0.1%, WUE by 2.5% and maize yield by 29.4 kg ha−1 in Northern Huang–Huai–Hai Valley [37]. Subsoil tillage is typical cultivation method applied to promote crop yields in arid areas [38,39], such as the dryland region of northwest China [40]. Similarly, in abroad, using subsoil tillage fracture dense layers in a loamy sand soil and reduction of penetration resistance was found and yield increased in wheat (Triticum aestivum L), soybean [Glycine max L. (Merr.)] and maize [33].
4.2. Response of Different Corn Varieties to Subsoil Tillage Depth
The LAI of Zhengdan958 was higher than Xianyu335 from the V6 stage to the R1 stage, but lower than Xianyu335 after the R1 stage, indicating that the leaf senescence rate of Zhengdan958 was faster than that of Xianyu335 after the R1 stage. The WUE of Xianyu335 and Zhengdan958 with the subsoil tillage increased by 12.25% and 3.54% more compared to the control, respectively, which indicated that Xianyu335 was more sensitive to subsoil tillage depth than Zhengdan958. The results of this study indicated that different varieties had different responses to the subsoil tillage depth, but how the different varieties respond to different soil types and climatic conditions remains to be further studied [41].
4.3. The Effect of Subsoil Tillage on Economic Efficiency
The intensity of the subsoiling tillage should be suitable to avoid economic efficiency decreasing [42]. Cai Hongguang [43] found that a subsoil tillage of 50 cm was superior to that of 30 cm or no chiseling. Our study indicated that subsoiling tillage of 50 cm was optimal, and there was no significant economic difference between the 40 cm and 30 cm subsoil tillages. Compared to compacted soil by shallow rotary tillage for many years, subsoil tillage maximized the energy gain, while, in contrast, reduced tillage or no tillage minimized energy intensity for corn–soybean in eastern Nebraska [44]. Compacted soils reduced the plant height of field corn, and decreased the aboveground biomass in potato, snap bean, cucumber, and cabbage [45]. Subsoil tillage has been recommended to use across the United States to alleviate the negative effect of a compacted layer on potato (Solanum tuberosum L.) productivity [46]. Compared with no-till plots, subsoil tillage dramatically decreased foliar symptoms of sudden death syndrome for soybeans [47].
4.4. Preliminary Discuss on Area Suitable to Subsoil Tillage
The ratio of yield and WUE were improved by subsoil tillage compared to the control in 2014, and 2015 showed that the result of subsoil tillage was effected by the precipitation or the irrigation rate. The result can be better expressed in the condition of more precipitation or irrigation rate, due to strong moisture conservation by loosened soil. On the contrary, even if the soil possesses a large storage ability of moisture through treatment by subsoil tillage, without enough water supply, the results of moisture conservation will not be shown. A lower soil bulk density, greater soil porosity, and decreased soil moisture was observed in subsoiled plots [47]. For example, in the semi-arid Segarra region in Spain, no-tillage is regarded as the best system for executing fallow only, if residues of the preceding crops are left spread over the soil [48]. Similarly, residue management and tillage effects on soil-water storage and grain yields of dryland wheat and sorghum [Sorghum bicolor L. (Moench)] for a clay loam in Texas. No-tillage increased the average soil water storage compared to stubble mulch-tillage. Therefore, compared to subsoil tillage, no-tillage residue management was more favorable for dryland crop production [33]. Various tradeoffs indicate that farmers should alternate between subsoil tillage and no-tillage to enhance the soil quality, and to decrease disease and yield problems, which may occur with continuous minimum tillage [49]. After all, the subsoil tillage is a method to maintain the moisture, not the method to produce the moisture, so the subsoil tillage can be used in a rainfed area with certain precipitation. The range of the precipitation suitable for soil moisture conservation by subsoil tillage is a topic for future research.
5. Conclusions
Subsoil tillage increased the ear leaf photosynthetic assimilation, transpiration rate, stomatal conductance, and intercellular CO2 concentration; maintained relatively high LAI; and extended LAD. In this experiment, the deeper the subsoil tillage, the longer it lasted, and the senescence of leaves was effectively delayed, which made it possible to prolong the photosynthetic time of plants. Compared with the control, subsoil tillage obviously increased NAR after the R1 stage, ordered from high to low values: CH50, CH40, and CH30.
There was a significant difference in yield among treatments, and the yield under the subsoil tillage treatment was significantly higher (0.7% to 8.9%) than that of the control (SR). In terms of yield components, subsoil tillage significantly increased the 100-grain weight of Xianyu335, while other factors had no significant difference. Correlation analysis between the canopy parameters and yield indicated that LAD and dry matter were the main factors affecting the final yield. Considering the economic benefits, the net income of the CH50 was higher than that of the shallow rotary tillage treatment, thus, the best tillage system was the 50 cm subsoil tillage treatment.
Author Contributions
J.S. and J.G. conceived and designed the experiments; F.Z. and Y.F. performed the experiments; H.B. performed the statistical analysis; Z.W. and S.H. analyzed the results; J.S. wrote the paper.
Funding
This study was funded by the National Natural Science Foundation of China (31360304), National Key Research and Development Program of China [2017YFD0300802,2016YFD0300103], the Maize Industrial Technology System Construction of Modem Agriculture of China (CARS-02-63) and the Fund of Crop Cultivation Scientific Observation Experimental Station in North China Loess Plateau of China (25204120).
Acknowledgments
We would like to thank the Maize High-yield and High-efficiency Cultivation Team for field and data collection, and especially Juliann Seebauer for manuscript revisions.
Conflicts of Interest
The authors declare no conflict of interest.
References
- Wang, Z.; Wang, C.S.; Zhang, J.B. Study of Soil Deep Loosening Influencing Crop Growth. Heilongjiang Agric. Sci. 2009, 4, 33–35. [Google Scholar]
- Zhao, Y.L.; Xue, Z.W.; Guo, H.B.; Mu, X.Y.; Li, C.H. Effects of Tillage and Straw Returning on Water Consumption Characteristics and Water Use Efficiency in the Winter Wheat and Summer Maize Rotation System. Sci. Agric. Sin. 2014, 47, 3359–3371. [Google Scholar] [CrossRef]
- Ghosh, P.K.; Mohanty, M.; Bandyopadhyay, K.K.; Painuli, D.K.; Misra, A.K. Growth, Competition, Yield Advantage and Economics in Soybean/pigeonpea Intercropping System in Semi-arid Tropics of India. Field Crops Res. 2005, 96, 89. [Google Scholar] [CrossRef]
- Guo, J.; Xiao, K.; Guo, X.; Zhao, C. Review on Maize Canopy Structure, Light Distributing and Canopy Photosynthesis. Maize Sci. 2005, 13, 55–59. [Google Scholar] [CrossRef]
- Borras, L.; Maddonni, G.A.; Otegui, M.E. Leaf Senescence in Maize Hybrids: Plant Population, Rowspacing and Kernel Set Effects. Field Crops Res. 2003, 82, 13–14. [Google Scholar] [CrossRef]
- He, P.; Osaki, M.; Takebe, M.; Shinano, T. Changes of Photosynthetic Characteristics in Relation to Leaf Senescence in Two Maize Hybrids with Different Senescent Appearance. Photosynthetica 2002, 40, 547–552. [Google Scholar] [CrossRef]
- Dong, S.T.; Gao, R.Q.; Hu, C.H.; Wang, Q.; Wang, K. Study of Canopy Photosynthesis Property and High Yield Potential after Anthesis in Maize. Acta Agron. Sin. 1997, 23, 318–325. [Google Scholar]
- Dong, X.W.; Liu, S.T. A study of Canopy Apparent Photosynthesis Property in Summer Maize with Superhigh Yield. Acta Agric. Boreali Sin. 1999, 14, 36–41. [Google Scholar]
- Zheng, P.R. Photosynthetic Physiology. In Intorduction to Crop Physiology, 5th ed.; Hu, C.H., Yu, Z.W., Eds.; China Agricultural University Press: Beijing, China, 1992; Volume 5, pp. 222–275. ISBN 7-S1002-259-8/O.260. [Google Scholar]
- Bai, J.F. Effect of Different Farming Measure on Canopy and Root of High Yield Spring Maize. Master’s Thesis, Inner Mongolia Agricultural University, Hohhot, China, July 2012. [Google Scholar]
- Huang, Z.X.; Wang, Y.J.; Wang, K.J.; Li, D.H.; Zhao, M.; Liu, J.G.; Dong, S.T.; Wang, H.J.; Wang, J.H.; Yang, J.S. Photosynthetic Characteristics During Grain Filling Stage of Summer Maize Hybrids with High Yield Potential of 15 000 kg·ha−1. Sci. Agric. Sin. 2007, 40, 1898–1906. [Google Scholar]
- Lin, Z.H.; Xiang, Y.Q.; Mo, X.G.; Li, J.; Wang, L. Normalized Leaf Area Index Model for Summer Maize. Chin. J. Eco-Agric. 2003, 11, 69–72. [Google Scholar]
- Sun, R.; Zhu, P.; Wang, Z.M.; Cong, Y.; Gou, L.; Fang, L.; Zhao, M. Effect of Plant Density on Dynamic Characteristics of Leaf Area Index in Development of Spring Maize. Acta Agron. Sin. 2009, 35, 1097–1105. [Google Scholar] [CrossRef]
- Chanh, T.T.; Roeske, C.A.; Eaglesham, A.R. Changes in Maize-Stalk Proteins during Ear Development. Physiol. Plant. 1993, 87, 21–24. [Google Scholar] [CrossRef]
- Guo, S.Y.; Zhang, X.; Zhang, Q.J.; Wang, Z.H.; Li, Y.Z.; Gu, S.F.; Jiao, N.Y.; Yin, F.; Fu, G.Z. Effects of Straw Mulching and Water-retaining Agent on Ear Leaf Senescence after Anthesis and Yield of Summer Maize. Maize Sci. 2012, 20, 104–107. [Google Scholar] [CrossRef]
- Tong, S.Y.; Song, F.B.; Xu, H.W. Differences of Morphological Senescence of Leaves in Various Maize Varieties during Mature Period of Seed. Acta Agric. Boreali Sin. 2009, 24, 11–15. [Google Scholar]
- Paponov, I.A.; Sambo, P.; Schulte auf’m, G.E.; Presterl, T.; Geiger, H.H.; Engels, C. Kernel Set in Maize Genotypes Differing in Nitrogen Use Efficiency in Response to Resource Availability around Flowering. Plant Soil 2005, 272, 101–110. [Google Scholar] [CrossRef]
- Paponov, I.A.; Sambo, P.; Schulteaufm, G.E.; Presterl, T.; Geiger, H.H.; Engels, C. Grain Yield and Kernel Weight of Two Maize Genotypes Differing in Nitrogen Use Efficiency at Various Levels of Nitrogen and Carbohydrate Availability during Flowering and Grain Filling. Plant Soil 2005, 272, 111–123. [Google Scholar] [CrossRef]
- Song, B.; Wu, S.L.; Yu, S.H.; Chen, F.; Xu, L.; Fan, W.B. A Study on Population Quality Indexes of Maize under Different Ecological Condition. Tillage Cultiv. 1998, 23–28. [Google Scholar] [CrossRef]
- Li, S.; Peng, Y.F.; Yu, P.; Zhang, Y.; Fang, Z.; Li, C.J. Accumulation and Distribution of Dry Matter and Potassium in Maize Varieties Released in Different Years. Plant Nutr. Fertil. Sci. 2011, 17, 325–332. [Google Scholar]
- Statistical Analysis System (SAS) Version SAS/STAT 9.0; SAS Institute Inc.: Cary, NC, USA, 2004.
- Song, H.X.; Li, S.X. Effects of Root Growing Space of on Maize Its Absorbing Characteristics. Sci. Agric. Sin. 2003, 36, 899–904. [Google Scholar]
- Li, D.M.; Guo, H.; Zhu, H.Y.; Liu, M.; Chen, T.; Qi, H. Effect of Different Tillageon the Development, Root Distribution and Yield in Maize. Maize Sci. 2014, 22, 115–119. [Google Scholar] [CrossRef]
- Song, R.; Wu, C.S.; Mu, J.M.; Xu, K.Z. The Effect of Breaking the Bottom of the Plow on The Growth and Development of Corn Roots. Tillage Cultiv. 2000, 5, 6–7. [Google Scholar] [CrossRef]
- Zou, H.T.; Zhang, Y.L.; Huang, Y.; Huang, Y.; Song, H.; Yu, N.; Zhang, Y.; Sun, Z. Effect of Deep Tillage on Maize Growth in the Semi-arid Region of Liaoning Northwest Area. Shenyang Agric. Univ. 2009, 40, 475–477. [Google Scholar]
- Wang, T.C.; Li, X.M.; Sui, R.T.; Liu, D.J. A Primary Study on the Technical Effects of Subsoiling in Row Space at Corn Seedling Growth Stage. Chin. Agric. Sci. Bull. 2003, 19, 40–43. [Google Scholar]
- Shang, J.X.; Li, J.; Jia, Z.K.; Zhang, L.H. Soil Water Conservation Effect, Yield and Income Increments of Conservation Tillage Measures on Dryland Wheat Field. Sci. Agric. Sin. 2010, 43, 2668–2678. [Google Scholar] [CrossRef]
- Serrano, J.M.; Shahidian, S.; Da Silva, J.M.; Carvalho, M. Monitoring of Soil Organic Carbon over 10 Years in a Mediterranean Silvo-pastoral System: Potential Evaluation for Differential Management. Precis. Agric. 2016, 17, 274–295. [Google Scholar] [CrossRef]
- Zhao, J.B.; Mei, X.R.; Xue, J.H.; Zhong, Z.Z. The Effect of Straw Mulch on Crop Water Use Efficiency in Dryland. Sci. Agric. Sin. 1996, 29, 59–66. [Google Scholar]
- Fu, G.Z.; Li, C.H.; Wang, J.Z.; Wang, Z.L.; Cao, H.M.; Jiao, N.Y.; Chen, M.C. Effects of Stubble Mulch and Tillage Managements on Soil Physical Properties and Water Use Efficiency of Summer Maize. Agric. Eng. 2005, 21, 52–56. [Google Scholar]
- Wang, X.B.; Wu, H.J.; Dai, K.; Zhang, D.; Feng, Z.; Zhao, Q.; Wu, X.; Jin, K.; Cai, D.; Oenema, O.; et al. Tillage and Crop Residue Effects on Rainfed Wheat and Maize Production in Northern China. Field Crops Res. 2012, 132, 106–116. [Google Scholar] [CrossRef]
- Zhu, P.F.; Yu, Z.W.; Wang, D.; Zhang, Y. Effects of Tillage on Water Consumption Characteristics and Grain Yield of Wheat. Sci. Agric. Sin. 2010, 43, 3954–3964. [Google Scholar] [CrossRef]
- Baumhardt, R.L.; Jones, O.R. Residue Management and Tillage Effects on Soil-water Storage and Grain Yield of Dryland Wheat and Sorghum for a Clay Loam in Texas. Soil Tillage Res. 2002, 68, 71–82. [Google Scholar] [CrossRef]
- Moraru, P.I.; Rusu, T. Soil Tillage Conservation and its Effect on Soil Organic Matter, Water Management and Carbon Sequestration. J. Food Agric. Environ. 2010, 8, 309–312. [Google Scholar]
- Rusu, T.; Gus, P.; Bogdan, I.; Moraru, P.I.; Pop, A.I.; Clapa, D.; Marin, D.I.; Oroian, I.; Pop, L.I. Implications of Minimum Tillage Systems on Sustainability of Agricultural Production and Soil Conservation. J. Food Agric. Environ. 2002, 216, 335–338. [Google Scholar]
- Chen, Y.; Liu, S.; Li, H.; Li, X.F.; Song, C.Y.; Cruse, R.M.; Zhang, X.Y. Effects of Conservation Tillage on Corn and Soybean Yield in the Humid Continental Climate Region of Northeast China. Soil Tillage Res. 2011, 115, 56–61. [Google Scholar] [CrossRef]
- Tao, Z.; Li, C.; Li, J.; Ding, Z.; Xu, J.; Sun, X.; Zhou, P.; Zhao, M. Tillage and Straw Mulching Impacts on Grain Yield and Water Use Efficiency of Spring Maize in Northern Huang-Huai-Hai Valley. Crop J. 2015, 3, 445–450. [Google Scholar] [CrossRef]
- Hou, X.Q.; Li, R.; Jia, Z.K.; Han, Q.F.; Yang, B.P.; Nie, J.F. Effects of Rotational Tillage Practices on Soil Structure, Organic Carbon Concentration and Crop Yields in Semi-arid Areas of Northwest China. Soil Use Manag. 2012, 28, 551–558. [Google Scholar] [CrossRef]
- Verhulst, N.; Nelissen, V.; Jespers, N.; Haven, H.; Sayre, K.D.; Raes, D.; Deckers, J.; Govaerts, B. Soil Water Content, Maize Yield and its Stability as Affected by Tillage and Crop Residue Management in Rainfed Semi-arid Highlands. Plant Soil 2011, 344, 73–85. [Google Scholar] [CrossRef]
- Liu, Y.; Gao, M.; Wu, W.; Tanveer, S.K.; Wen, X.; Liao, Y. The Effects of Conservation Tillage Practices on the Soil Water-holding Capacity of a non-irrigated Apple Orchard in the Loess Plateau, China. Soil Tillage Res. 2013, 130, 7–12. [Google Scholar] [CrossRef]
- Feng, Y.; Zhang, Y.X.; Wang, C.L.; Zhang, J.H. An Influence of Different Subsoiling Depth on Corn Root Activity and Output. Inner Mong. Univ. Natl. 2013, 28, 196–199. [Google Scholar] [CrossRef]
- He, J.; Li, H.W.; Gao, H.W. Subsoiling Effect and Economic Benefit under Conservation Tillage Mode in Northern China. Trans. Chin. Soc. Agric. Eng. 2006, 22, 62–67. [Google Scholar]
- Cai, H.G.; Ma, W.; Zhang, X.Z.; Ping, J.; Yan, X.; Liu, J.; Yuan, J.; Wang, L.; Ren, J. Effect of Subsoil Tillage Depth on Nutrient Accumulation, Root Distribution, and Grain Yield in Spring Maize. Crop J. 2014, 2, 297–307. [Google Scholar] [CrossRef]
- Rathke, G.W.; Wienhold, B.J.; Wilheim, W.W.; Diepenbrock, W. Tillage and Rotation Effect on Corn-soybean Energy Balances in Eastern Nebraska. Soil Tillage Res. 2007, 97, 60–70. [Google Scholar] [CrossRef]
- Alva, A.K.; Hodges, T.; Boydston, R.A.; Collins, H.P. Effects of Irrigation and Tillage Practices on Yield of Potato under High Production Conditions in the Pacific Northwest. Commun. Soil Sci. Plant Anal. 2002, 33, 1451–1460. [Google Scholar] [CrossRef]
- Copas, M.E.; Bussan, A.J.; Drilias, M.J.; Wolkowski, R.P. Potato Yield and Quality Response to Subsoil Tillage and Compaction. Agron. J. 2009, 101, 82–90. [Google Scholar] [CrossRef]
- Vick, C.M.; Chong, S.K.; Bond, J.P.; Russin, J.S. Response of Soybean Sudden Death Syndrome to Subsoil tillage. Plant Dis. 2003, 87, 629–632. [Google Scholar] [CrossRef]
- Lampurlanes, J.; Angas, P.; Cantero-Martinez, C. Tillage Effects on Water Storage During Fallow, and on Barley Root Growth and Yield in Two Contrasting Soils of the Semi-arid Segarra Region in Spain. Soil Tillage Res. 2002, 65, 207–220. [Google Scholar] [CrossRef]
- Jackson, L.E.; Ramirez, I.; Yokota, R.; Fennimore, S.A.; Koike, S.T.; Henderson, D.M.; Chaney, W.E.; Calderón, F.J.; Klonsky, K. On-farm Assessment of Organic Matter and Tillage Management on Vegetable Yield, Soil, Weeds, Pests, and Economics in California. Agric. Ecosyst. Environ. 2004, 103, 443–463. [Google Scholar] [CrossRef]
Figure 1.
Precipitation and monthly average temperature at the study site during 2014–2015.

Figure 2.
The change of the leaf area index due to the subsoil tillage depth. Values are the average of three replications. Bars indicate ±1 standard error of the mean.
Figure 2.
The change of the leaf area index due to the subsoil tillage depth. Values are the average of three replications. Bars indicate ±1 standard error of the mean.

Figure 3.
Photosynthetic assimilation (A), transpiration rate (B), stomatal conductance (C), intercellular CO2 concentration (D), and water use efficiency (E) of maize due to subsoil tillage depth. Values are means ± SE of three replicates, bars represent ± 1 standard error of the mean, the same letters labeled upon the bars are not significantly different at p ≤ 0.05, and the different letters are significantly different at p ≤ 0.05.


Table 1.
Soil properties in 2014 and 2015 years.
| Year | Soil Organic C (g·kg−1) | Soil Available N (mg·kg−1) | Soil Available P (mg·kg−1) | Soil Available K (mg·kg−1) |
|---|---|---|---|---|
| 2014 matter | 7.30 | 73.45 | 15.10 | 120.40 |
| 2015 | 7.60 | 77.05 | 14.05 | 118.80 |
Table 2.
Effect of subsoil tillage treatments on the accumulation of Xianyu335 dry matter at different growth stages in 2014. Values are the average ±1 standard error.
Table 2.
Effect of subsoil tillage treatments on the accumulation of Xianyu335 dry matter at different growth stages in 2014. Values are the average ±1 standard error.
| Year and Variety | Stage | Treatments | Dry Matter (g Per Plant) | Increased Compared to Control (%) | |||
|---|---|---|---|---|---|---|---|
| Stem | Leaf | Ear | Total | ||||
| 2014 (Xianyu335) | V6 | CH50 | † 37.8 ± 1.13 a | † 47.8 ± 6.01 a | — | † 85.6 ± 7.24 a | 78.33 |
| CH40 | 33.3 ± 4.82 b | 39.5 ± 3.03 b | — | 72.7 ± 7.85 b | 51.46 | ||
| CH30 | 29.2 ± 6.32 b | 35.6 ± 4.18 c | — | 64.8 ± 5.24 b | 35.00 | ||
| SR | 19.3 ± 1.90 c | 28.7 ± 0.38 d | — | 48.0 ± 2.28 c | -- | ||
| V12 | CH50 | 59.6 ± 4.92 a | 45.0 ± 0.96 a | — | 104.6 ± 5.88 a | 16.48 | |
| CH40 | 53.5 ± 7.25 b | 38.6 ± 4.92 b | — | 92.1 ± 6.62 b | 2.56 | ||
| CH30 | 52.2 ± 5.98 b | 41.2 ± 2.11 b | — | 93.4 ± 5.28 b | 4.01 | ||
| SR | 50.9 ± 5.77 c | 38.9 ± 3.62 b | — | 89.8 ± 8.22 b | -- | ||
| R1 | CH50 | 127.1 ± 2.39 a | 55.9 ± 4.15 b | † 37.2 ± 5.44 b | 220.1 ± 6.54 b | 13.63 | |
| CH40 | 125.2 ± 7.49 b | 55.5 ± 7.91 b | 38.4 ± 7.03 b | 219.1 ± 7.11 b | 13.11 | ||
| CH30 | 122.6 ± 2.79 c | 66.0 ± 1.68 a | 51.7 ± 4.51 a | 240.3 ± 4.47 a | 24.06 | ||
| SR | 114.6 ± 5.08 d | 50.7 ± 1.96 c | 28.4 ± 1.61 c | 193.7 ± 3.57 c | -- | ||
| R3 | CH50 | 176.0 ± 2.80 a | 62.9 ± 1.96 a | 192.2 ± 7.82 a | 431.0 ± 7.14 a | 56.61 | |
| CH40 | 148.5 ± 5.75 b | 56.4 ± 6.82 b | 152.1 ± 2.36 b | 357.1 ± 9.18 b | 29.76 | ||
| CH30 | 136.2±2.89 c | 49.3 ± 3.62 b | 155.0 ± 4.67 b | 340.4 ± 8.29 b | 23.69 | ||
| SR | 112.1 ± 2.99 d | 46.2 ± 5.41 c | 116.9 ± 4.59 c | 275.2 ± 8.40 c | -- | ||
| R6 | CH50 | 146.3 ± 5.47 a | 49.5 ± 3.94 a | 304.0 ± 2.66 a | 499.7 ± 4.9.41 a | 20.79 | |
| CH40 | 120.4 ± 6.89 b | 44.4 ± 2.30 b | 278.7 ± 2.04 b | 443.5 ± 10.16 b | 7.20 | ||
| CH30 | 116.8 ± 3.16 b | 48.4 ± 0.60 a | 284.7 ± 0.51 b | 449.9 ± 7.29 b | 8.75 | ||
| SR | 106.8 ± 5.02 c | 46.1 ± 9.03 b | 260.8 ± 6.57 c | 413.7 ± 11.24 c | -- | ||
| 2015 (Xianyu335) | V6 | CH50 | † 37.4 ± 5.26 a | † 40.3 ± 4.44 a | — | † 77.7 ± 4.24 a | 50.58 |
| CH40 | 26.5 ± 4.67 b | 31.4 ± 4.50 b | — | 57.9 ± 8.43 b | 12.21 | ||
| CH30 | 25.7 ± 5.44 b | 29.1 ± 7.05 c | — | 54.8 ± 10.49 b | 6.20 | ||
| SR | 23.3 ± 4.20 b | 28.4 ± 4.81 c | — | 51.6 ± 9.01 b | -- | ||
| V12 | CH50 | 53.7 ± 8.34 a | 46.2 ± 2.49 a | — | 99.9 ± 8.83 a | 21.98 | |
| CH40 | 49.9 ± 3.97 b | 39.1 ± 3.45 b | — | 88.9 ± 6.45 b | 8.55 | ||
| CH30 | 47.6 ± 4.94 b | 41.8 ± 1.34 b | — | 89.4 ± 5.28 b | 9.16 | ||
| SR | 43.5 ± 1.37 c | 38.4 ± 1.88 b | — | 81.9 ± 3.25 c | -- | ||
| R1 | CH50 | 86.5 ± 4.85 a | 43.5 ± 2.89 a | † 48.3 ± 3.00 a | 178.3 ± 7.74 a | 19.91 | |
| CH40 | 79.5 ± 2.79 b | 42.8 ± 6.14 a | 43.3 ± 9.08 b | 165.4 ± 8.93 b | 11.23 | ||
| CH30 | 73.7 ± 7.04 c | 36.7 ± 2.52 b | 30.3 ± 3.31 c | 140.8 ± 4.04 c | -- | ||
| SR | 73.5 ± 1.57 c | 36.8 ± 5.13 b | 38.4 ± 7.88 b | 148.7 ± 6.74 c | -- | ||
| R3 | CH50 | 91.1 ± 8.50 a | 49.7 ± 5.65 a | 111.3 ± 7.82 a | 252.1 ± 7.14 a | 23.70 | |
| CH40 | 82.3 ± 3.38 b | 41.3 ± 4.45 b | 101.8 ± 2.60 b | 225.3 ± 7.83 b | 10.55 | ||
| CH30 | 91.0 ± 2.96 a | 44.6 ± 6.30 b | 103.7 ± 9.70 b | 239.3 ± 9.26 b | 17.42 | ||
| SR | 73.8 ± 7.21 c | 36.6 ± 8.85 c | 93.4 ± 4.87 c | 203.8 ± 7.26 c | -- | ||
| R6 | CH50 | 71.6 ± 6.61 a | 41.6 ± 7.00 a | 254.1 ± 3.03 a | 367.2 ± 4.64 a | 5.09 | |
| CH40 | 62.1 ± 5.96 c | 41.7 ± 3.20 a | 243.7 ± 5.75 b | 347.5 ± 9.16 b | -- | ||
| CH30 | 68.6 ± 3.16 b | 40.8 ± 8.80 a | 252.5 ± 4.13 a | 361.8 ± 7.29 a | 3.55 | ||
| SR | 68.6 ± 1.47 b | 37.1 ± 5.77 b | 243.7 ± 7.01 b | 349.4 ± 7.24 b | -- | ||
| 2015 (Zhengdan958) | V6 | CH50 | † 34.9 ± 4.76 b | † 38.7 ± 6.04 b | — | † 73.6 ± 5.84 b | 40.99 |
| CH40 | 39.3 ± 5.68 a | 42.5 ± 4.54 a | — | 81.8 ± 9.45 a | 56.70 | ||
| CH30 | 32.8 ± 9.87 b | 35.0 ± 6.37 b | — | 67.9 ± 6.49 b | 30.08 | ||
| SR | 24.9 ± 4.87 c | 27.2 ± 4.53 c | — | 52.2 ± 7.55 c | -- | ||
| V12 | CH50 | 85.9 ± 7.43 a | 43.5 ± 7.14 a | — | 129.4 ± 7.14 a | 37.37 | |
| CH40 | 63.6 ± 5.27 b | 46.2 ± 1.80 a | — | 109.8 ± 6.07 b | 16.56 | ||
| CH30 | 55.1 ± 2.69 c | 46.7 ± 6.05 a | — | 101.8 ± 8.74 b | 8.07 | ||
| SR | 53.7 ± 6.72 c | 40.5 ± 6.75 b | — | 94.2 ± 7.72 c | -- | ||
| R1 | CH50 | 75.6 ± 5.96 a | 41.1 ± 5.69 a | † 48.7 ± 3.94 a | 165.4 ± 8.69 a | 24.74 | |
| CH40 | 70.4 ± 5.41 a | 40.7 ± 7.35 a | 46.1 ± 5.56 a | 157.1 ± 6.56 b | 18.48 | ||
| CH30 | 72.7 ± 3.52 a | 37.4 ± 3.35 b | 48.5 ± 3.59 a | 158.6 ± 6.87 b | 19.61 | ||
| SR | 63.0 ± 5.87 b | 30.5 ± 1.58 c | 39.1 ± 5.29 b | 132.6 ± 6.77 c | -- | ||
| R3 | CH50 | 75.2 ± 8.80 a | 37.7 ± 3.11 b | 115.9 ± 2.90 a | 228.7 ± 6.01 a | 9.95 | |
| CH40 | 74.4 ± 2.21 a | 39.4 ± 5.54 b | 104.9 ± 3.46 b | 218.7 ± 5.67 a | 5.14 | ||
| CH30 | 72.6 ± 4.09 a | 43.7 ± 5.01 a | 104.6 ± 3.64 b | 220.9 ± 7.73 a | 6.20 | ||
| SR | 68.2 ± 2.60 b | 37.0 ± 5.62 b | 102.8 ± 7.07 b | 208.0 ± 8.22 b | -- | ||
| R6 | CH50 | 66.1 ± 1.44 a | 43.6 ± 8.41 a | 247.0 ± 9.07 b | 356.7 ± 6.85 b | 10.19 | |
| CH40 | 64.5 ± 6.60 a | 45.6 ± 8.18 a | 255.5 ± 3.56 a | 365.7 ± 9.78 a | 12.97 | ||
| CH30 | 67.7 ± 9.30 a | 37.2 ± 3.86 b | 252.6 ± 3.39 a | 357.5 ± 6.39 b | 10.44 | ||
| SR | 62.4 ± 7.49 a | 35.3 ± 4.81 b | 226.0 ± 7.35 c | 323.7 ± 7.48 c | -- | ||
† Means within a column and growth stage followed by the same letter are not significantly different at p ≤ 0.05, and the different letters are significantly different at p ≤ 0.05.
Table 3.
Dynamics of leaf area duration under different chiseling depths for two maize varieties grown in 2014 and/or 2015. Values are the average ±1 standard error.
Table 3.
Dynamics of leaf area duration under different chiseling depths for two maize varieties grown in 2014 and/or 2015. Values are the average ±1 standard error.
| Year Varieties | Treatment | Dynamics of Leaf Area Duration [104m2/(d·ha)] | |||
|---|---|---|---|---|---|
| V6 Stage–V12 Stage | V12 Stage–R1 Stage | R1 Stage–R3 Stage | R3g Stage–R6 Stage | ||
| 2014 Xianyu335 | CH50 | † 3.1 ± 0.19 a | † 13.0 ± 1.09 a | † 17.6 ± 1.14 a | † 12.7 ±0.56 a |
| CH40 | 3.0 ± 0.13 a | 12.7 ± 1.01 a | 16.9 ± 0.79 b | 12.6 ± 1.19 a | |
| CH30 | 2.7 ± 0.14 a | 11.6 ± 0.63 a | 16.4 ± 0.58 b | 11.9 ± 0.89 b | |
| SR | 2.4 ± 0.19 a | 11.2 ± 1.18 a | 15.4 ± 0.49 c | 11.1 ± 0.75 b | |
| 2015 Xianyu335 | CH50 | 2.7 ± 0.22 a | 12.9 ± 0.59 a | 18.9 ± 1.03 a | 13.3 ± 0.79 a |
| CH40 | 2.6 ± 0.19 a | 12.7 ± 0.19 a | 17.8 ± 1.21 b | 11.8 ± 1.13 b | |
| CH30 | 2.5 ± 0.21 a | 12.2 ± 0.89 a | 17.2 ± 1.37 b | 11.9 ± 1.07 b | |
| SR | 1.8 ± 0.29 b | 9.9 ± 0.75 b | 16.2 ± 0.89 c | 11.1 ± 0.87 b | |
| 2015 Zhengdan958 | CH50 | 3.1 ± 0.16 a | 13.8 ± 0.97 a | 19.3 ± 1.10 a | 13.2 ± 0.56 a |
| CH40 | 2.9 ± 0.20 a | 13.0 ± 0.89 a | 18.1 ± 1.15 b | 11.6 ± 0.67 b | |
| CH30 | 2.8 ± 0.09 a | 12.1 ± 1.19 b | 17.2 ± 0.97 b | 11.7 ± 0.71 b | |
| SR | 2.4 ± 0.09 a | 11.2 ± 1.06 b | 16.1 ± 0.94 c | 10.7 ± 0.55 c | |
† Means within a column and year variety followed by the same letter are not significantly different at p ≤ 0.05, and the different letters are significantly different at p ≤ 0.05.
Table 4.
Dynamics of net assimilation rate between plant stages when grown under different chiseling depths. Values are the mean of three replications ±1 standard error.
Table 4.
Dynamics of net assimilation rate between plant stages when grown under different chiseling depths. Values are the mean of three replications ±1 standard error.
| Year Varieties | Treatment | Dynamics of Net Assimilation Rate [g/(m2·d)] | |||
|---|---|---|---|---|---|
| V6 to V12 Stage | V12 stage to R1 Stage | R1 Stage to R3 Stage | R3 Stage to R6 Stage | ||
| 2014 Xianyu335 | CH50 | † 13.3 ± 1.19 c | † 5.8 ± 0.19 a | † 5.4 ± 0.59 a | † 5.6 ± 0.44 c |
| CH40 | 14.2 ± 1.01 c | 6.9 ± 0.13 a | 5.4 ± 0.19 a | 7.0 ± 0.28 c | |
| CH30 | 19.0 ± 0.63 b | 6.3 ± 0.14 a | 4.3 ± 0.49 b | 9.5 ± 0.31 b | |
| SR | 29.4 ± 1.18 a | 5.8 ± 0.19 a | 4.6 ± 0.38 b | 12.7 ± 0.52 a | |
| 2015 Xianyu335 | CH50 | 8.8 ± 0.59 c | 6.2 ± 0.22 a | 4.9 ± 0.44 a | 8.9 ± 0.42 c |
| CH40 | 13.0 ± 0.79 b | 6.2 ± 0.19 a | 4.4 ± 0.58 a | 10.6 ± 0.57 b | |
| CH30 | 14.8 ± 0.75 b | 7.3 ± 0.31 a | 5.7 ± 0.42 a | 10.6 ± 0.36 b | |
| SR | 17.1 ± 0.89 a | 7.9 ± 0.35 a | 3.4 ± 0.39 b | 13.7 ± 0.31 a | |
| 2015 Zhengdan958 | CH50 | 11.1 ± 0.97 b | 3.1 ± 0.49 a | 3.3 ± 0.41 a | 10.0 ± 0.46 b |
| CH40 | 9.9 ± 0.89 c | 3.8 ± 0.52 a | 3.4 ± 0.56 a | 13.1 ± 0.29 a | |
| CH30 | 12.4 ± 1.12 b | 4.8 ± 0.55 a | 3.6 ± 0.35 a | 12.0 ± 0.19 a | |
| SR | 18.2 ± 1.06 a | 4.4 ± 0.25 a | 2.8 ± 0.39 b | 13.3 ± 0.27 a | |
† Means within a column and year variety followed by the same letter are not significantly different at p ≤ 0.05, and the different letters are significantly different at p ≤ 0.05.
Table 5.
Dry matter distribution in different organs and shoot root ratio in maize at the silking stage as affected by tillage treatment. Values are the mean of three replications ±1 standard error.
Table 5.
Dry matter distribution in different organs and shoot root ratio in maize at the silking stage as affected by tillage treatment. Values are the mean of three replications ±1 standard error.
| Year Varieties | Treatment | Dry Matter (g Per Plant) | Shoot/Root | ||||
|---|---|---|---|---|---|---|---|
| † Stem | † Leaf | † Ear | † Shoot | † Root | |||
| 2014 XianYu 335 | CH50 | 121.5 ± 14.37 b | 54.5 ± 3.34 a | 60.3 ± 1.82 a | 236.3 ± 18.31 a | 18.4 ± 0.73 a | 12.84 |
| CH40 | 138.3 ± 10.5 a | 54.3 ± 4.14 a | 47.4 ± 7.62 b | 240.0 ± 16.71 a | 17.6 ± 0.25 a | 13.64 | |
| CH30 | 123.9 ± 14.27 b | 49.2 ± 4.55 b | 48.2 ± 6.40 b | 221.3 ± 6.34 b | 16.2 ± 0.67 b | 13.66 | |
| SR | 102.0 ± 16.04 c | 39.9 ± 4.69 c | 37.4 ± 2.40 c | 179.3 ± 30.03 c | 16.1 ± 0.33 b | 11.14 | |
| 2015 XianYu 335 | CH50 | 85.1 ± 2.59 a | 33.5 ± 2.89 b | 44.9 ± 4.81 a | 163.6 ± 16.29 a | 18.5 ± 0.50 a | 8.84 |
| CH40 | 79.5 ± 12.79 a | 42.8 ± 6.14 a | 43.3 ± 3.09 a | 165.6 ± 22.32 a | 17.8 ± 0.42 ab | 9.30 | |
| CH30 | 63.7 ± 9.12 b | 36.7 ± 2.52 ab | 37.0 ± 6.11 b | 137.5 ± 17.58 b | 17.2 ± 0.92 bc | 7.99 | |
| SR | 63.5 ± 7.73 b | 36.8 ± 5.13 ab | 35.1 ± 2.11 b | 135.3 ± 5.22 b | 16.3 ± 0.22 c | 8.30 | |
| 2015 Zheng Dan958 | CH50 | 75.6 ± 5.96 a | 41.1 ± 5.69 a | 48.7 ± 3.94 a | 165.4 ± 23.94 a | 19.5 ± 0.34 a | 8.48 |
| CH40 | 70.4 ± 5.41 ab | 40.7 ± 7.35 a | 39.7 ± 5.56 b | 150.8 ± 18.17 b | 18.6 ± 0.75 ab | 8.11 | |
| CH30 | 72.6 ± 3.52 b | 37.4 ± 3.35 a | 48.5 ± 2.59 a | 158.6 ± 16.19 ab | 18.5 ± 0.48 b | 8.57 | |
| SR | 63.0 ± 5.88 c | 30.5 ± 1.58 b | 39.1 ± 5.29 b | 132.6 ± 12.93 c | 17.4 ± 0.58 c | 7.62 | |
† Means within a column and year variety followed by the same letter are not significantly different at p ≤ 0.05, and the different letters are significantly different at p ≤ 0.05.
Table 6.
Biomass, grain yield, and yield components under different subsoiling treatments. Values are the mean of three replications ±1 standard error.
Table 6.
Biomass, grain yield, and yield components under different subsoiling treatments. Values are the mean of three replications ±1 standard error.
| Year Varieties | Treatment | t/ha | 104/ha | Per Ear | g | |
|---|---|---|---|---|---|---|
| Biomass | Grain Yield | Ear number | Kernel Number | 100-Kernel Weight | ||
| 2014 Xianyu 335 | CH50 | † 41.6 ± 0.11 a | † 15.4 ± 0.26 a | † 7.67 ± 0.03 a | † 646 ± 24.12 a | † 35.4 ± 0.15 a |
| CH40 | 38.4 ± 0.72 b | 14.9 ± 0.14 b | 7.60 ± 0.05 a | 637 ± 33.41 a | 35.2 ± 0.11 a | |
| CH30 | 37.9 ± 0.72 b | 14.9 ± 0.11 b | 7.50 ± 0.16 a | 651 ± 12.13 a | 34.9 ± 0.12 ab | |
| SR | 37.6 ± 0.54 b | 14.4 ± 0.16 c | 7.62 ± 0.19 a | 656 ± 5.76 a | 34.5 ± 0.34 b | |
| 2015 Xianyu 335 | CH50 | 29.7 ± 0.68 a | 14.7 ± 0.11 a | 8.80 ± 0.01 a | 618 ± 16.94 a | 31.7 ± 0.09 a |
| CH40 | 29.2 ± 0.66 a | 14.2 ± 0.17 b | 8.44 ± 0.25 a | 610 ± 11.15 a | 31.9 ± 0.13 a | |
| CH30 | 29.6 ± 0.64 a | 14.0 ± 0.29 b | 8.51 ± 0.18 a | 607 ± 11.32 a | 32.8 ± 0.12 a | |
| SR | 28.1 ± 0.45 b | 13.5 ± 0.13 c | 8.43 ± 0.19 a | 610 ± 10.67 a | 30.9 ± 0.17 b | |
| 2015 Zhengdan 958 | CH50 | 30.0 ± 0.49 a | 13.6 ± 0.11 a | 8.65 ± 0.06 a | 589 ± 12.15 a | 31.3 ± 0.14 a |
| CH40 | 29.3 ± 0.14 a | 13.2 ± 0.14 a | 8.49 ± 0.18 a | 574 ± 9.98 a | 31.8 ± 0.18 a | |
| CH30 | 29.4 ± 0.23 a | 13.1 ± 0.09 a | 8.44 ± 0.16 a | 573 ± 19.56 a | 32.2 ± 0.10 a | |
| SR | 28.3 ± 0.54 b | 13.0 ± 0.1 b | 8.43 ± 0.14 a | 575 ± 13.12 a | 31.6 ± 0.16 a | |
† Means within a column and year variety followed by the same letter are not significantly different at p ≤ 0.05, and the different letters are significantly different at p ≤ 0.05.
Table 7.
Pearson correlation coefficients and associated significance level for final grain yield between selected corn canopy parameters as influenced by subsoil tillage depth.
Table 7.
Pearson correlation coefficients and associated significance level for final grain yield between selected corn canopy parameters as influenced by subsoil tillage depth.
| NAR | LAD | Pn | Tr | Gs | Ci | DM | LAI | GY | LWUE | |
|---|---|---|---|---|---|---|---|---|---|---|
| NAR | 1.000 | |||||||||
| LAD | 0.732 | 1.000 | ||||||||
| Pn | 0.909 | 0.940 | 1.000 | |||||||
| Tr | 0.630 | 0.965 * | 0.896 | 1.000 | ||||||
| Gs | 0.817 | 0.967 * | 0.982 * | 0.962 * | 1.000 | |||||
| Ci | 0.864 | 0.973 * | 0.993 ** | 0.929 | 0.989 * | 1.000 | ||||
| DM | 0.612 | 0.943 | 0.883 | 0.997 ** | 0.955 * | 0.912 | 1.000 | |||
| LAI | 0.642 | 0.989 * | 0.882 | 0.949 * | 0.921 | 0.930 | 0.902 ** | 1.000 | ||
| GY | 0.736 | 0.997 ** | 0.948 * | 0.979 * | 0.980 * | 0.976 * | 0.972 ** | 0.952 ** | 1.000 | |
| LWUE | 0.963 * | 0.888 | 0.981 * | 0.801 | 0.928 | 0.965 * | 0.779 | 0.825 | 0.888 | 1.000 |
** Significant at the 0.01 probability level, * Significant at the 0.05 probability level. NAR: Net assimilation rate, LAD: leaf area duration, Pn: photosynthesis assimilation, Tr: transpiration ratio, Gs: stomatal conductance, Ci: intercellular CO2 concentration, DM: dry Matter, LAI: leaf area index, GY: grain yield, LWUE: leaf water use efficiency at leaf level.
Table 8.
Water use efficiency of spring maize under different tillage depths. Values are the mean of three replications.
Table 8.
Water use efficiency of spring maize under different tillage depths. Values are the mean of three replications.
| Year Varieties | Treatment | mm | kg/ha | kg/(ha·mm) | (kg/ha·mm) | |
|---|---|---|---|---|---|---|
| Water Consume | Seed Yield | Biological Yield | Water Use Efficiency | Water Productivity | ||
| 2014 Xianyu335 | CH50 | † 770.9 bc | † 15,447 a | † 41,614 a | † 20.04 a | † 53.98 a |
| CH40 | 786.6 b | 14,891 b | 38,405 b | 18.93 b | 48.83 b | |
| CH30 | 796.2 b | 14,883 b | 37,876 b | 18.69 b | 47.57 b | |
| SR | 823.6 a | 14,398 c | 37,551 b | 17.48 c | 45.59 c | |
| 2015 Xianyu335 | CH50 | 540.7 c | 14,660 a | 29,710 a | 27.11 a | 54.95 a |
| CH40 | 562.1 b | 13,985 bc | 29,196 a | 24.88 b | 51.94 b | |
| CH30 | 574.9 b | 14,404 ab | 29,638 a | 25.06 b | 51.56 b | |
| SR | 591.5 a | 13,531 c | 28,100 b | 22.88 c | 47.51 c | |
| 2015 Zhengdan958 | CH50 | 560.5 b | 13,576 a | 29,993 a | 24.22 a | 53.51 a |
| CH40 | 568.7 b | 13,192 a | 29,319 a | 23.20 b | 51.55 b | |
| CH30 | 568.6 b | 13,234 a | 29,374 a | 23.28 b | 51.66 b | |
| SR | 573.3 a | 13,048 b | 28,284 b | 22.76 c | 49.34 c | |
† Means within a column and year variety followed by the same letter are not significantly different at p ≤ 0.05, and the different letters are significantly different at p ≤ 0.05.
Table 9.
Inputs and outputs of maize production for different treatments in the year, 2014.
| Year | CH50 | CH40 | CH30 | SR | ||
|---|---|---|---|---|---|---|
| 2014 | Inputs | Seeds (RMB/ha) | 1050 | 1050 | 1050 | 1050 |
| Fertilizer (RMB/ha) | 1600 | 1600 | 1600 | 1600 | ||
| Pesticides (RMB/ha) | 1500 | 1500 | 1500 | 1500 | ||
| Irrigation (RMB/ha) | 1200 | 1200 | 1200 | 1200 | ||
| Mechanical work (RMB/ha) | 900 | 750 | 600 | 450 | ||
| Total (RMB/ha) | 6250 | 6100 | 5950 | 5800 | ||
| Outputs | Yield (kg/ha) | 15,447 | 14,891 | 14,883 | 14,398 | |
| Price (RMByuan/kg) | 1 | 1 | 1 | 1 | ||
| Income (RMB/ha) | 15,447 | 14,891 | 14,883 | 14,398 | ||
| Net income (RMB/ha) | 9197 | 8791 | 8933 | 8598 | ||
| Increase (%) | 6.97 | 2.24 | 3.90 | |||
| 2015 | Inputs | Seeds (RMB/ha) | 1050 | 1050 | 1050 | 1050 |
| Fertilizer (RMB/ha) | 1600 | 1600 | 1600 | 1600 | ||
| Pesticides (RMB/ha) | 1500 | 1500 | 1500 | 1500 | ||
| Irrigation (RMB/ha) | 1200 | 1200 | 1200 | 1200 | ||
| Mechanical work (RMB/ha) | 900 | 750 | 600 | 450 | ||
| Total (RMB/ha) | 6250 | 6100 | 5950 | 5800 | ||
| Outputs | Yield (kg/ha) | † 14,118 | † 13,589 | † 13,819 | † 13,290 | |
| Price (RMByuan/kg) | 1 | 1 | 1 | 1 | ||
| Income (RMB/ha) | 14,118 | 13,589 | 13,819 | 13,290 | ||
| Net income (RMB/ha) | 7868 | 7489 | 7869 | 7490 | ||
| Increase (%) | 5.05 | -- | 5.06 |
† Means within a column and subsoil tillage depth treatment and the control are average of Xianyu335 and Zhengdan958 in 2015.
© 2018 by the authors. Licensee MDPI, Basel, Switzerland. This article is an open access article distributed under the terms and conditions of the Creative Commons Attribution (CC BY) license (http://creativecommons.org/licenses/by/4.0/).
Share and Cite
MDPI and ACS Style
Sun, J.; Gao, J.; Wang, Z.; Hu, S.; Zhang, F.; Bao, H.; Fan, Y. Maize Canopy Photosynthetic Efficiency, Plant Growth, and Yield Responses to Tillage Depth. Agronomy 2019, 9, 3. https://doi.org/10.3390/agronomy9010003
AMA Style
Sun J, Gao J, Wang Z, Hu S, Zhang F, Bao H, Fan Y. Maize Canopy Photosynthetic Efficiency, Plant Growth, and Yield Responses to Tillage Depth. Agronomy. 2019; 9(1):3. https://doi.org/10.3390/agronomy9010003
Chicago/Turabian StyleSun, Jiying, Julin Gao, Zhigang Wang, Shuping Hu, Fengjie Zhang, Haizhu Bao, and Yafang Fan. 2019. "Maize Canopy Photosynthetic Efficiency, Plant Growth, and Yield Responses to Tillage Depth" Agronomy 9, no. 1: 3. https://doi.org/10.3390/agronomy9010003
Note that from the first issue of 2016, this journal uses article numbers instead of page numbers. See further details here.