3.1. Design and Analysis of the FluoroSpot Assay
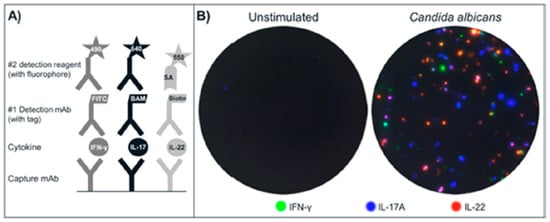
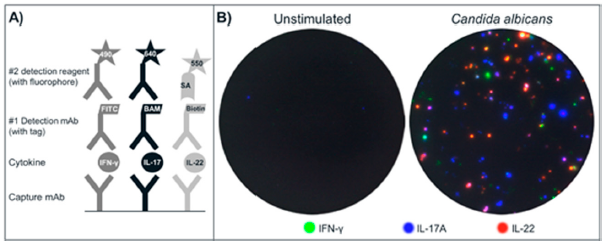
A triple FluoroSpot assay based on mAbs to human IFN-γ, IL-17A and IL-22 was developed. Detection was performed in two steps to amplify the signals. The respective detection mAbs were labeled with unique tags that in turn were bound by secondary anti-tag reagents conjugated with fluorophores absorbing and emitting light at 490/520 nm (IFN-γ), 640/660 nm (IL-17A) and 550/570 nm (IL-22) (
Figure 1A).
Figure 1.
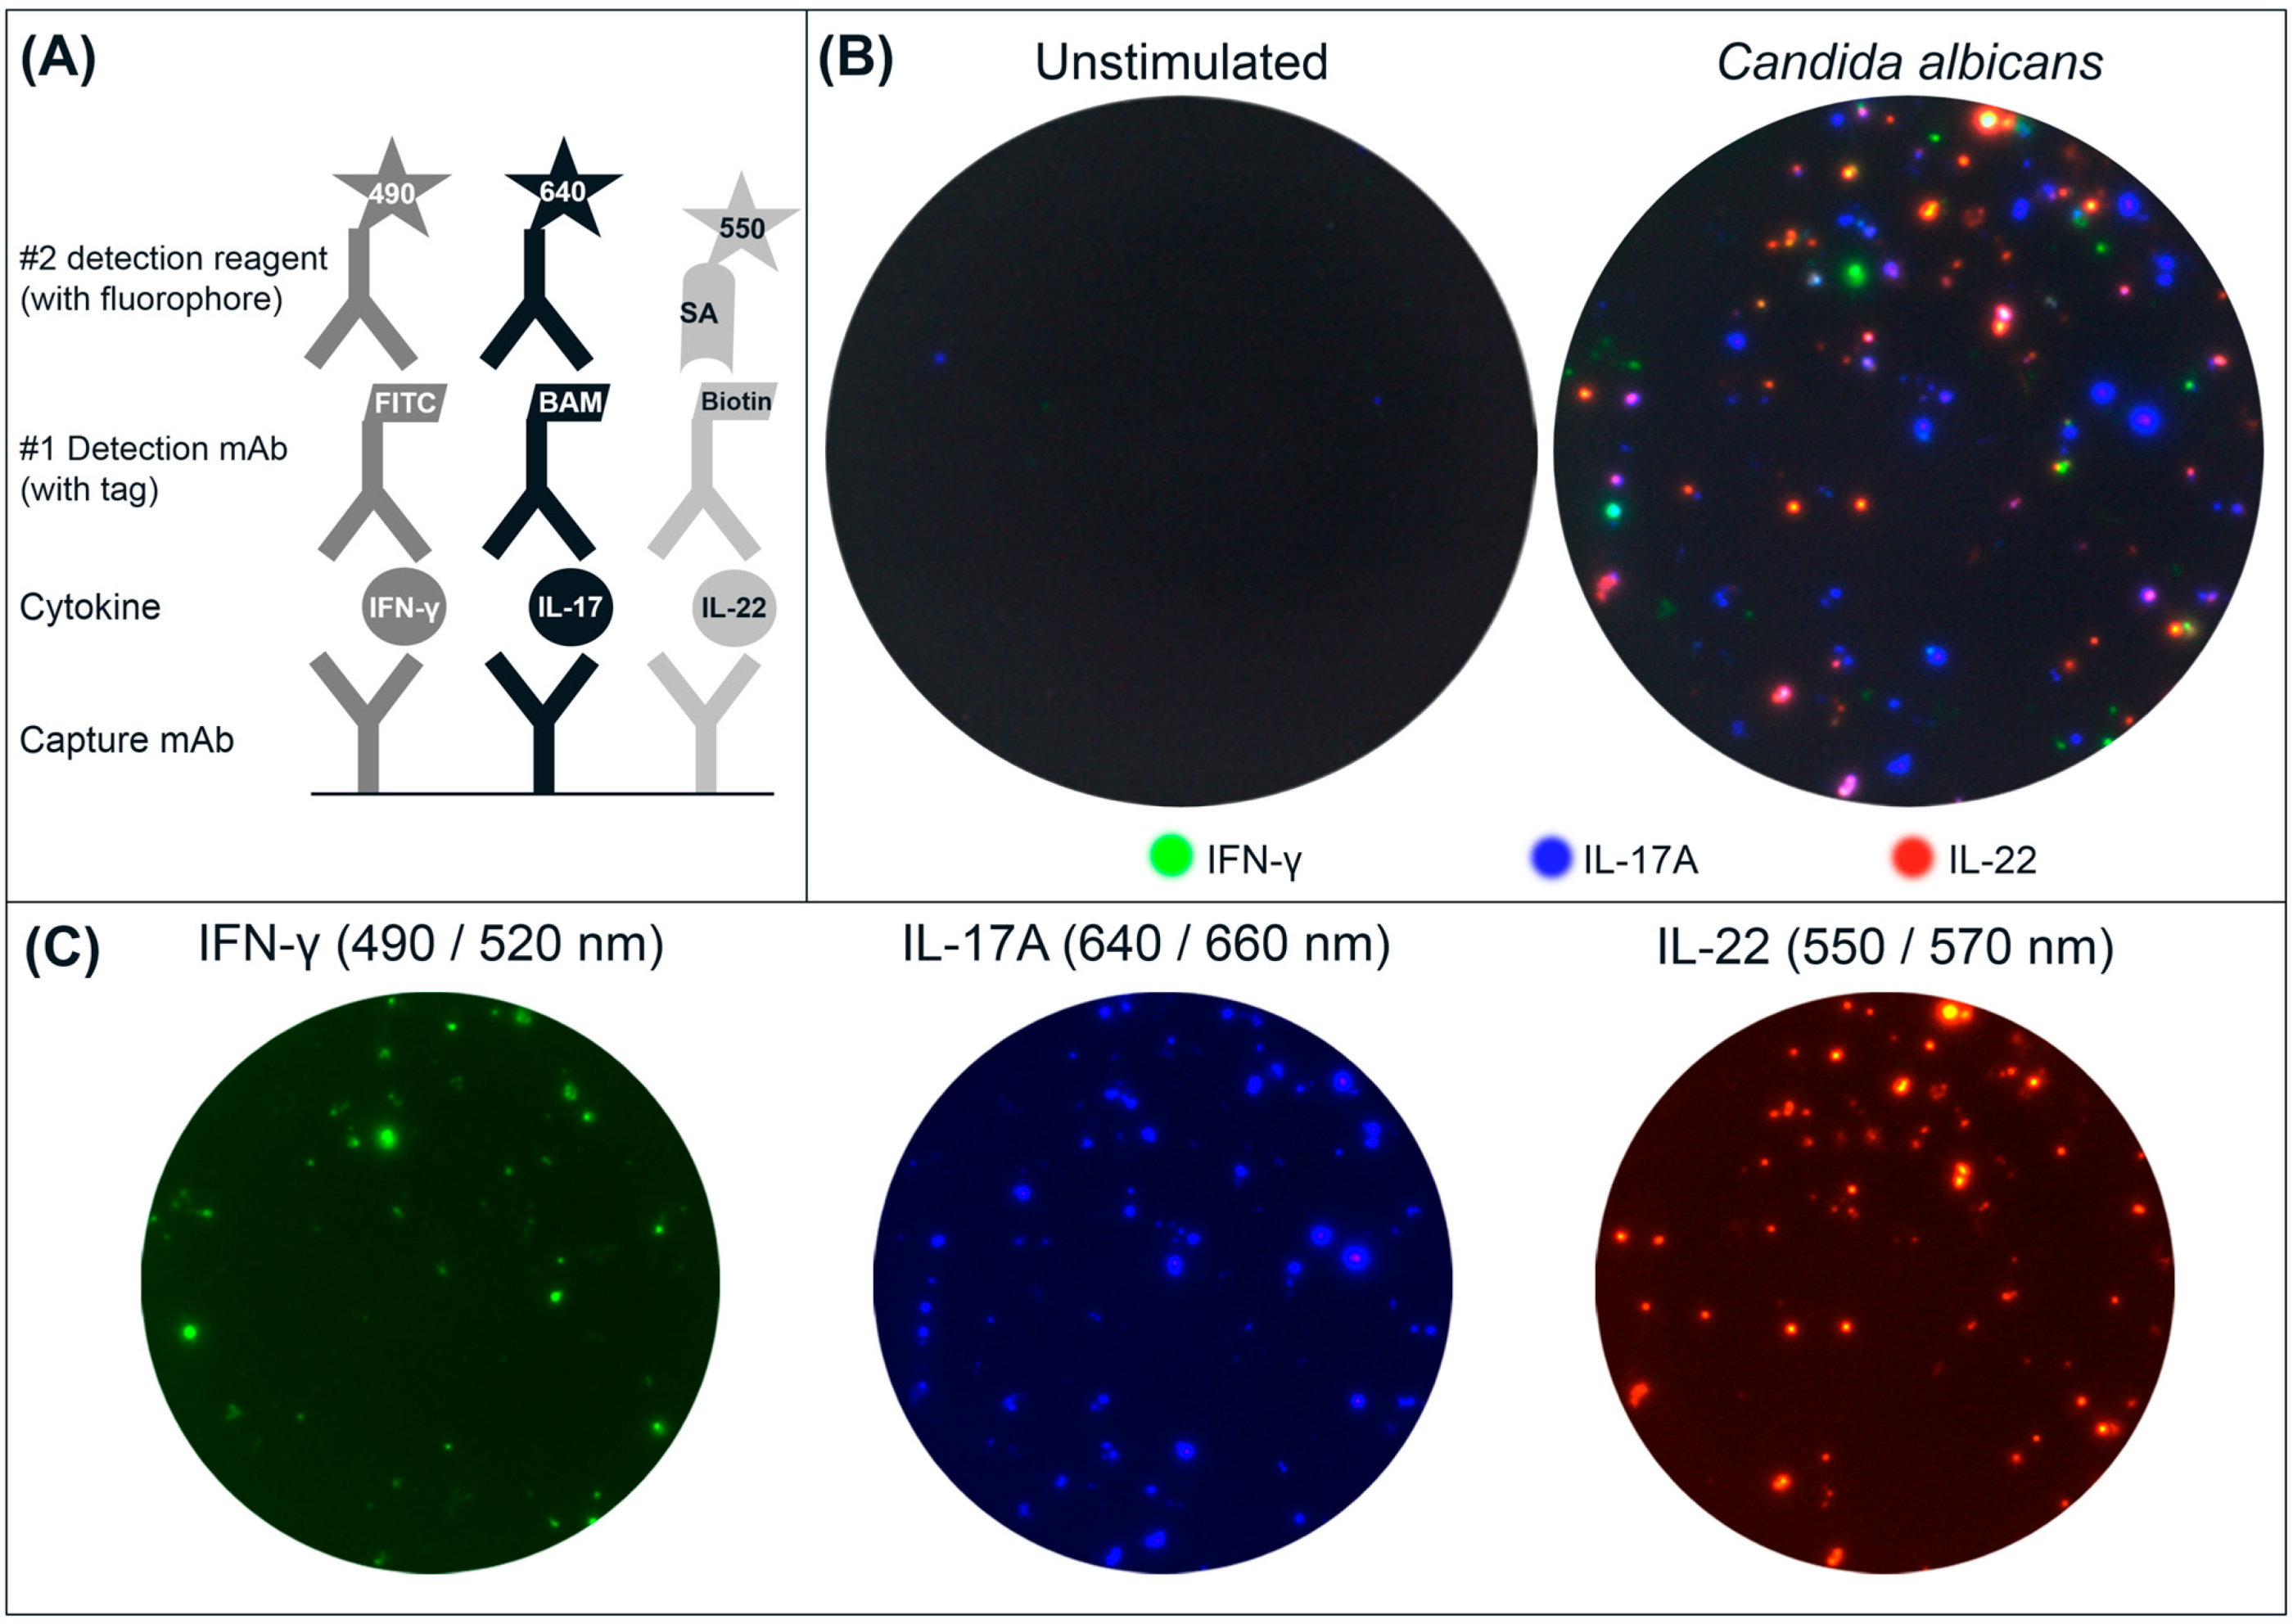
(A) Schematic drawing of the triple IFN-γ/IL-17A/IL-22 FluoroSpot assay. Capture mAbs to the cytokines are coated in the same well. After cell incubation, each cytokine is detected by the respective detection mAb labeled with a unique tag enabling the binding of secondary detection reagents with fluorophores. The tag/anti-tag systems used were FITC/anti-FITC-mAb (IFN-γ), peptide BAM/anti-BAM-mAb (IL-17A) and biotin/Streptavidin (IL-22). Cells secreting single cytokines will be detected by one detection system alone, whereas cells secreting multiple cytokines will be detected by two or three detection mAbs and result in double- or triple-stained spots respectively; (B) Example of image overlays from wells with unstimulated and CA-stimulated PBMC (300,000 cells/well); (C) Individual images were captured for IFN-γ (FITC filter), IL-17A (Cy5 filter), and IL-22 (Cy3 filter) and used to generate the computerized overlay (shown for CA-stimulated cells).
Figure 1.
(A) Schematic drawing of the triple IFN-γ/IL-17A/IL-22 FluoroSpot assay. Capture mAbs to the cytokines are coated in the same well. After cell incubation, each cytokine is detected by the respective detection mAb labeled with a unique tag enabling the binding of secondary detection reagents with fluorophores. The tag/anti-tag systems used were FITC/anti-FITC-mAb (IFN-γ), peptide BAM/anti-BAM-mAb (IL-17A) and biotin/Streptavidin (IL-22). Cells secreting single cytokines will be detected by one detection system alone, whereas cells secreting multiple cytokines will be detected by two or three detection mAbs and result in double- or triple-stained spots respectively; (B) Example of image overlays from wells with unstimulated and CA-stimulated PBMC (300,000 cells/well); (C) Individual images were captured for IFN-γ (FITC filter), IL-17A (Cy5 filter), and IL-22 (Cy3 filter) and used to generate the computerized overlay (shown for CA-stimulated cells).
PBMC were incubated, with or without stimuli, and secreted cytokines were detected. Following that, the plates were analyzed in a FluoroSpot reader equipped with filters for both incoming and outgoing light to avoid bleeding over between the fluorophores. An example of spots obtained with PBMC incubated with CA or with medium only is shown in
Figure 1B. Spot colors shown are not true to each fluorophore’s respective emission wavelength, but have been substituted to yield a more intuitive visual representation. The change of colors has no impact on the analysis of spots [
18]. Spots representing seven different secretion patterns can be found: three for single-stained spots, three for the combinations of double-stained spots, and one for triple-stained spots. The number of single, double and triple spots is determined by comparing spot locations on each filter image. Spots with matching coordinates in two or three filter images are defined as double and triple spots respectively.
3.4. Cytokine Profile of Antigen-Specific Responses
Using triple FluoroSpot, the cytokine profile of PBMC from eight donors was investigated after the cells had been stimulated with CA, TT or PPD (
Figure 3). A majority of PBMC donors can be expected to respond to these antigens after exposure to commensal fungi (CA), non-pathogenic or pathogenic mycobacteria (PPD), or after vaccination (TT and PPD). All PBMC donors responded to the antigens to different degrees, with some displaying the highest reactivity against CA and others against TT or PPD. All antigens elicited single positive spots representing all three cytokines, as well as lower frequencies of all possible combinations of double positive spots, whereas triple positive spots were rare (
Figure 3A). All PBMC donors displayed a higher proportion (
i.e., % of total spots) of double- and triple-stained spots after stimulation with CA compared to TT or PPD (
Figure 3B). The triple spots were few and found at mean proportions of 0.2%–0.4% of the total number of spots. Despite the limited number of PBMC samples analyzed and variations between them, some patterns in the cytokine profiles were seen (
Figure 3C). With regard to single positive spots, CA had a higher proportion of IL-17A and IL-22 while TT and PPD had higher proportions of IFN-γ and IL-22. CA also elicited a higher proportion of double-stained IL-17A/IL-22 spots compared to other double combinations induced by CA, as well as by the other antigens.
Figure 2.
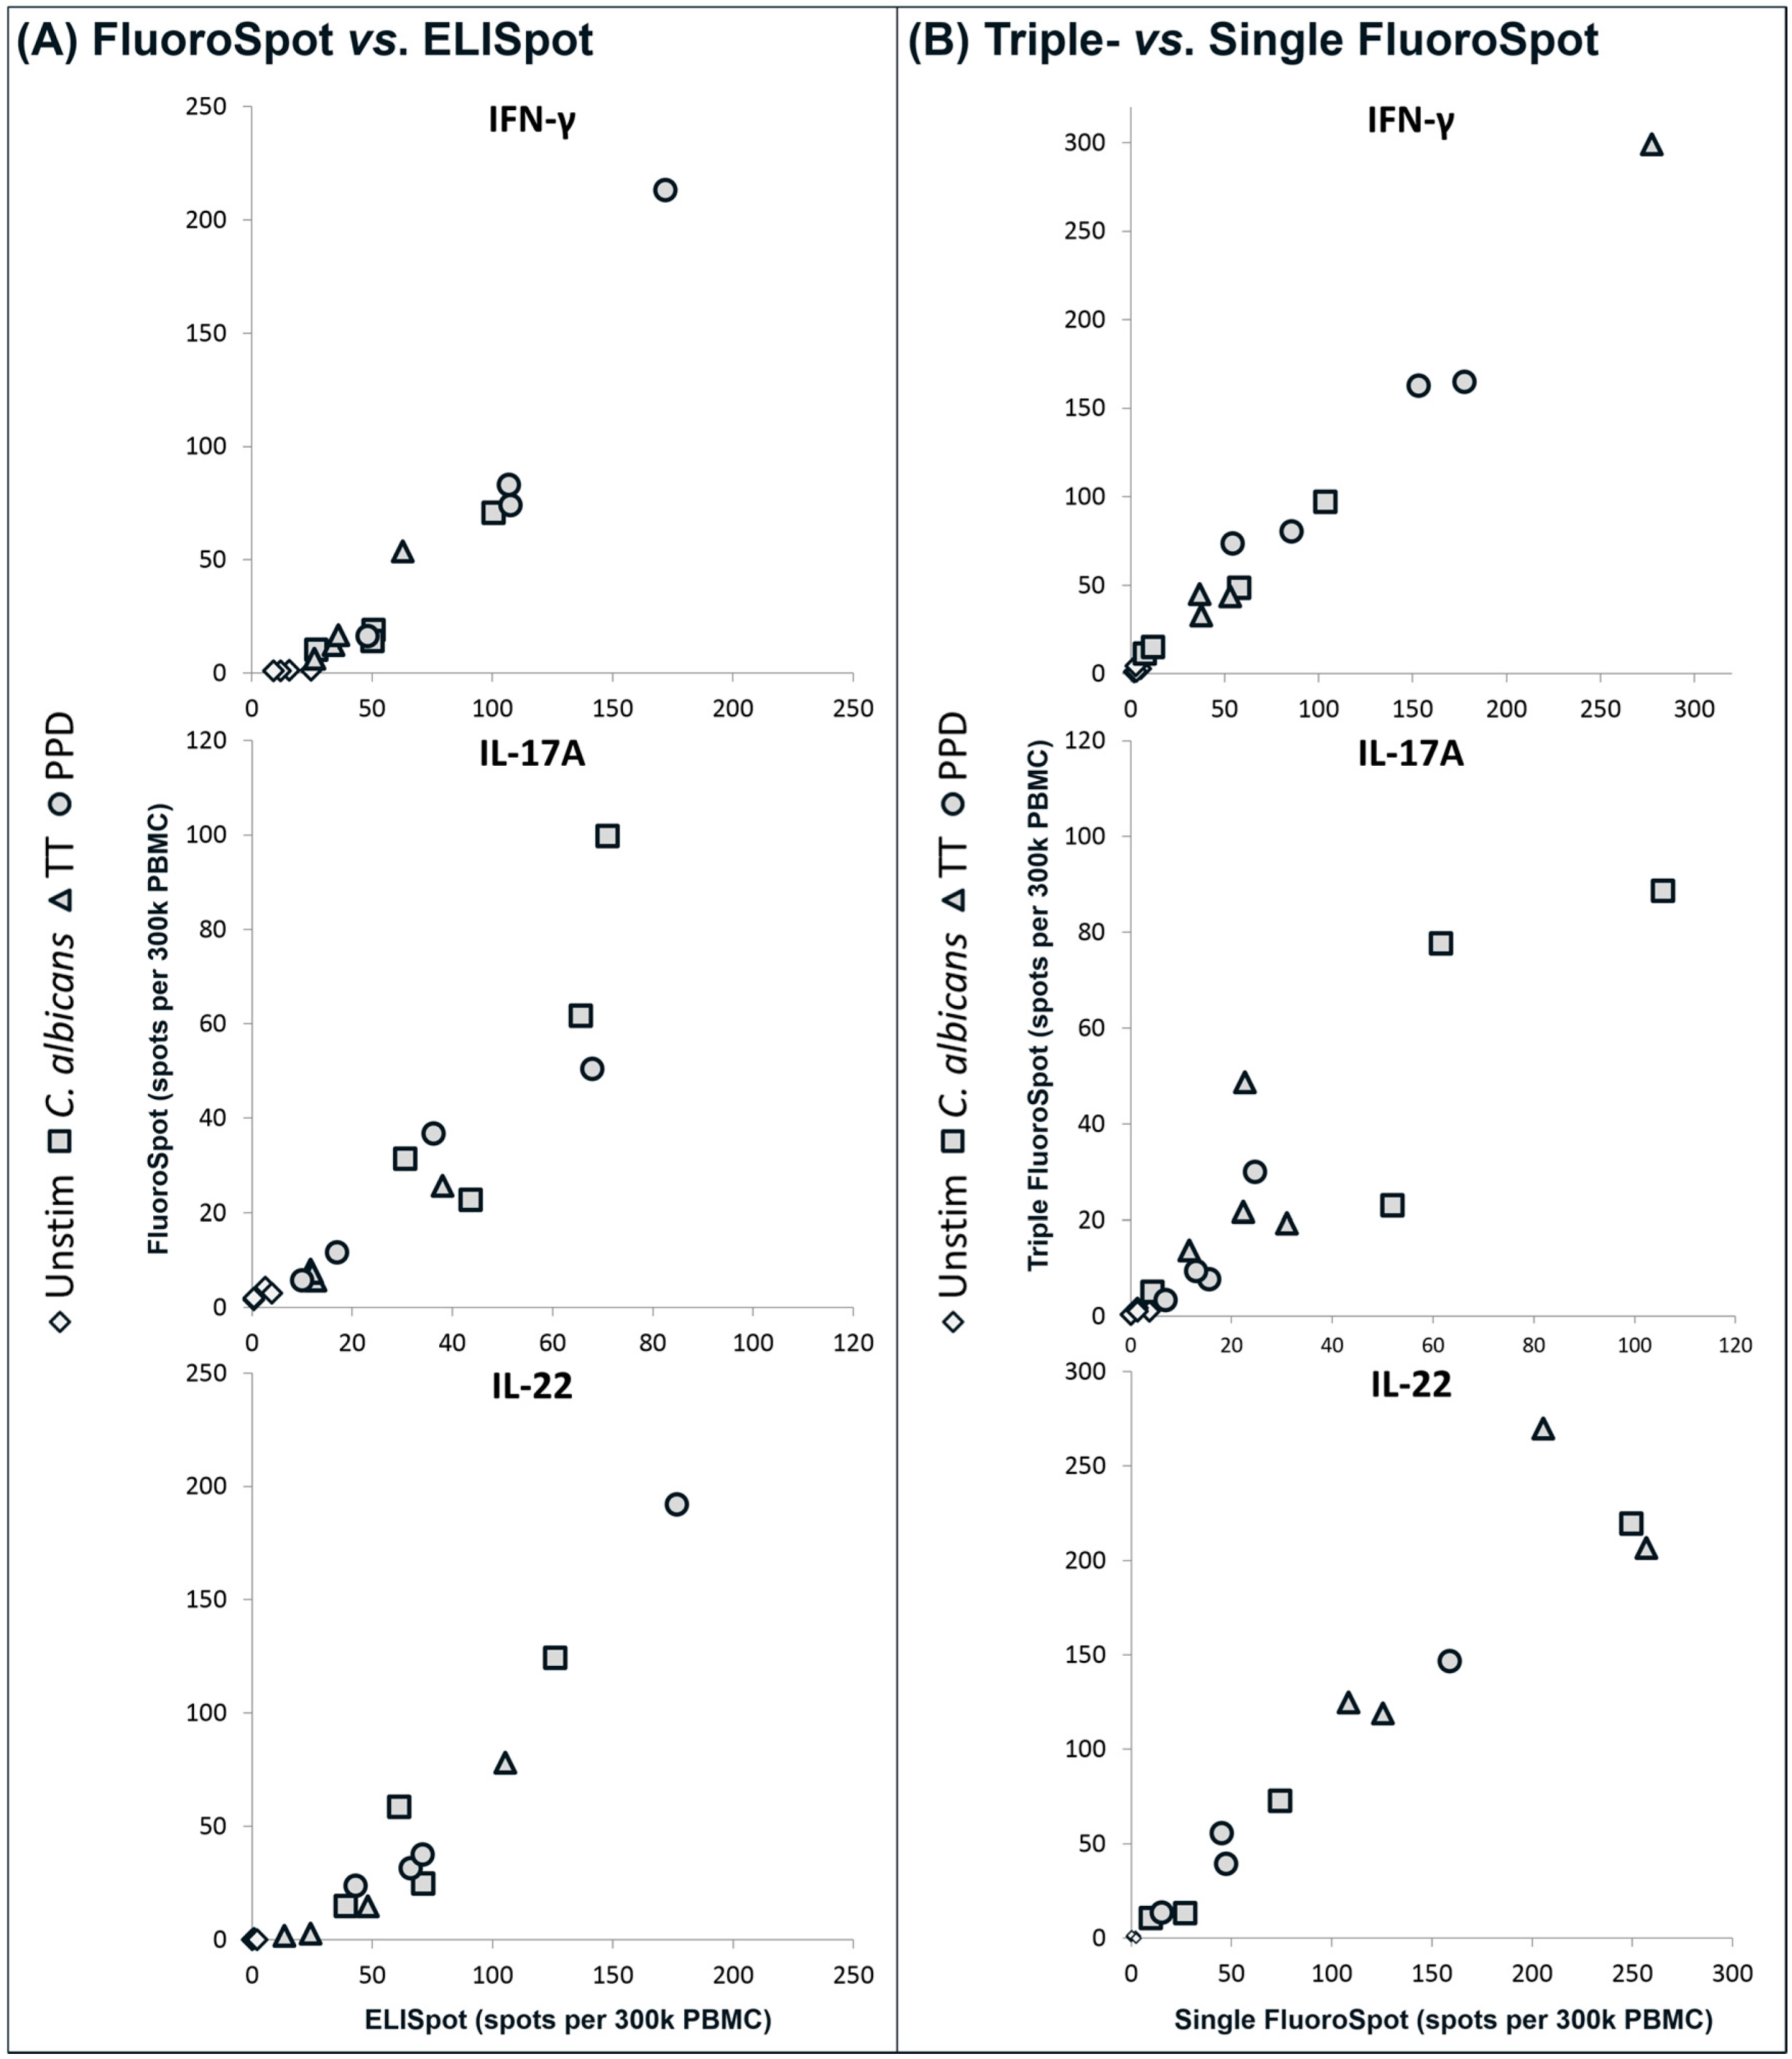
(A) Comparison of single cytokine FluoroSpot versus ELISpot. PBMC from four donors were stimulated with CA, TT or PPD or incubated with medium only and the number of cells secreting IFN-γ, IL-17A or IL-22 was determined by FluoroSpot and ELISpot; (B) Comparison of triple versus single cytokine FluoroSpot. PBMC from four other donors than in (A) were cultured as in (A) and analyzed in triple and single FluoroSpot for the number of cells secreting IFN-γ, IL-17A or IL-22. To obtain comparable data, spots in the triple FluoroSpot were counted as single cytokine spots, i.e., double and triple positive spots were counted as positive for each cytokine. The symbols in (A) and (B) represent the mean of triplicates with different symbols corresponding to unstimulated or antigen-stimulated PBMC. The variation within triplicates for the antigen-stimulated wells was on average 25%. All comparisons in (A) and (B) correlated positively (rs = 0.92–0.98 and p < 0.0001). The experiments were repeated with PBMC from additional donors with similar results.
Figure 2.
(A) Comparison of single cytokine FluoroSpot versus ELISpot. PBMC from four donors were stimulated with CA, TT or PPD or incubated with medium only and the number of cells secreting IFN-γ, IL-17A or IL-22 was determined by FluoroSpot and ELISpot; (B) Comparison of triple versus single cytokine FluoroSpot. PBMC from four other donors than in (A) were cultured as in (A) and analyzed in triple and single FluoroSpot for the number of cells secreting IFN-γ, IL-17A or IL-22. To obtain comparable data, spots in the triple FluoroSpot were counted as single cytokine spots, i.e., double and triple positive spots were counted as positive for each cytokine. The symbols in (A) and (B) represent the mean of triplicates with different symbols corresponding to unstimulated or antigen-stimulated PBMC. The variation within triplicates for the antigen-stimulated wells was on average 25%. All comparisons in (A) and (B) correlated positively (rs = 0.92–0.98 and p < 0.0001). The experiments were repeated with PBMC from additional donors with similar results.
![Cells 03 01116 g002]()
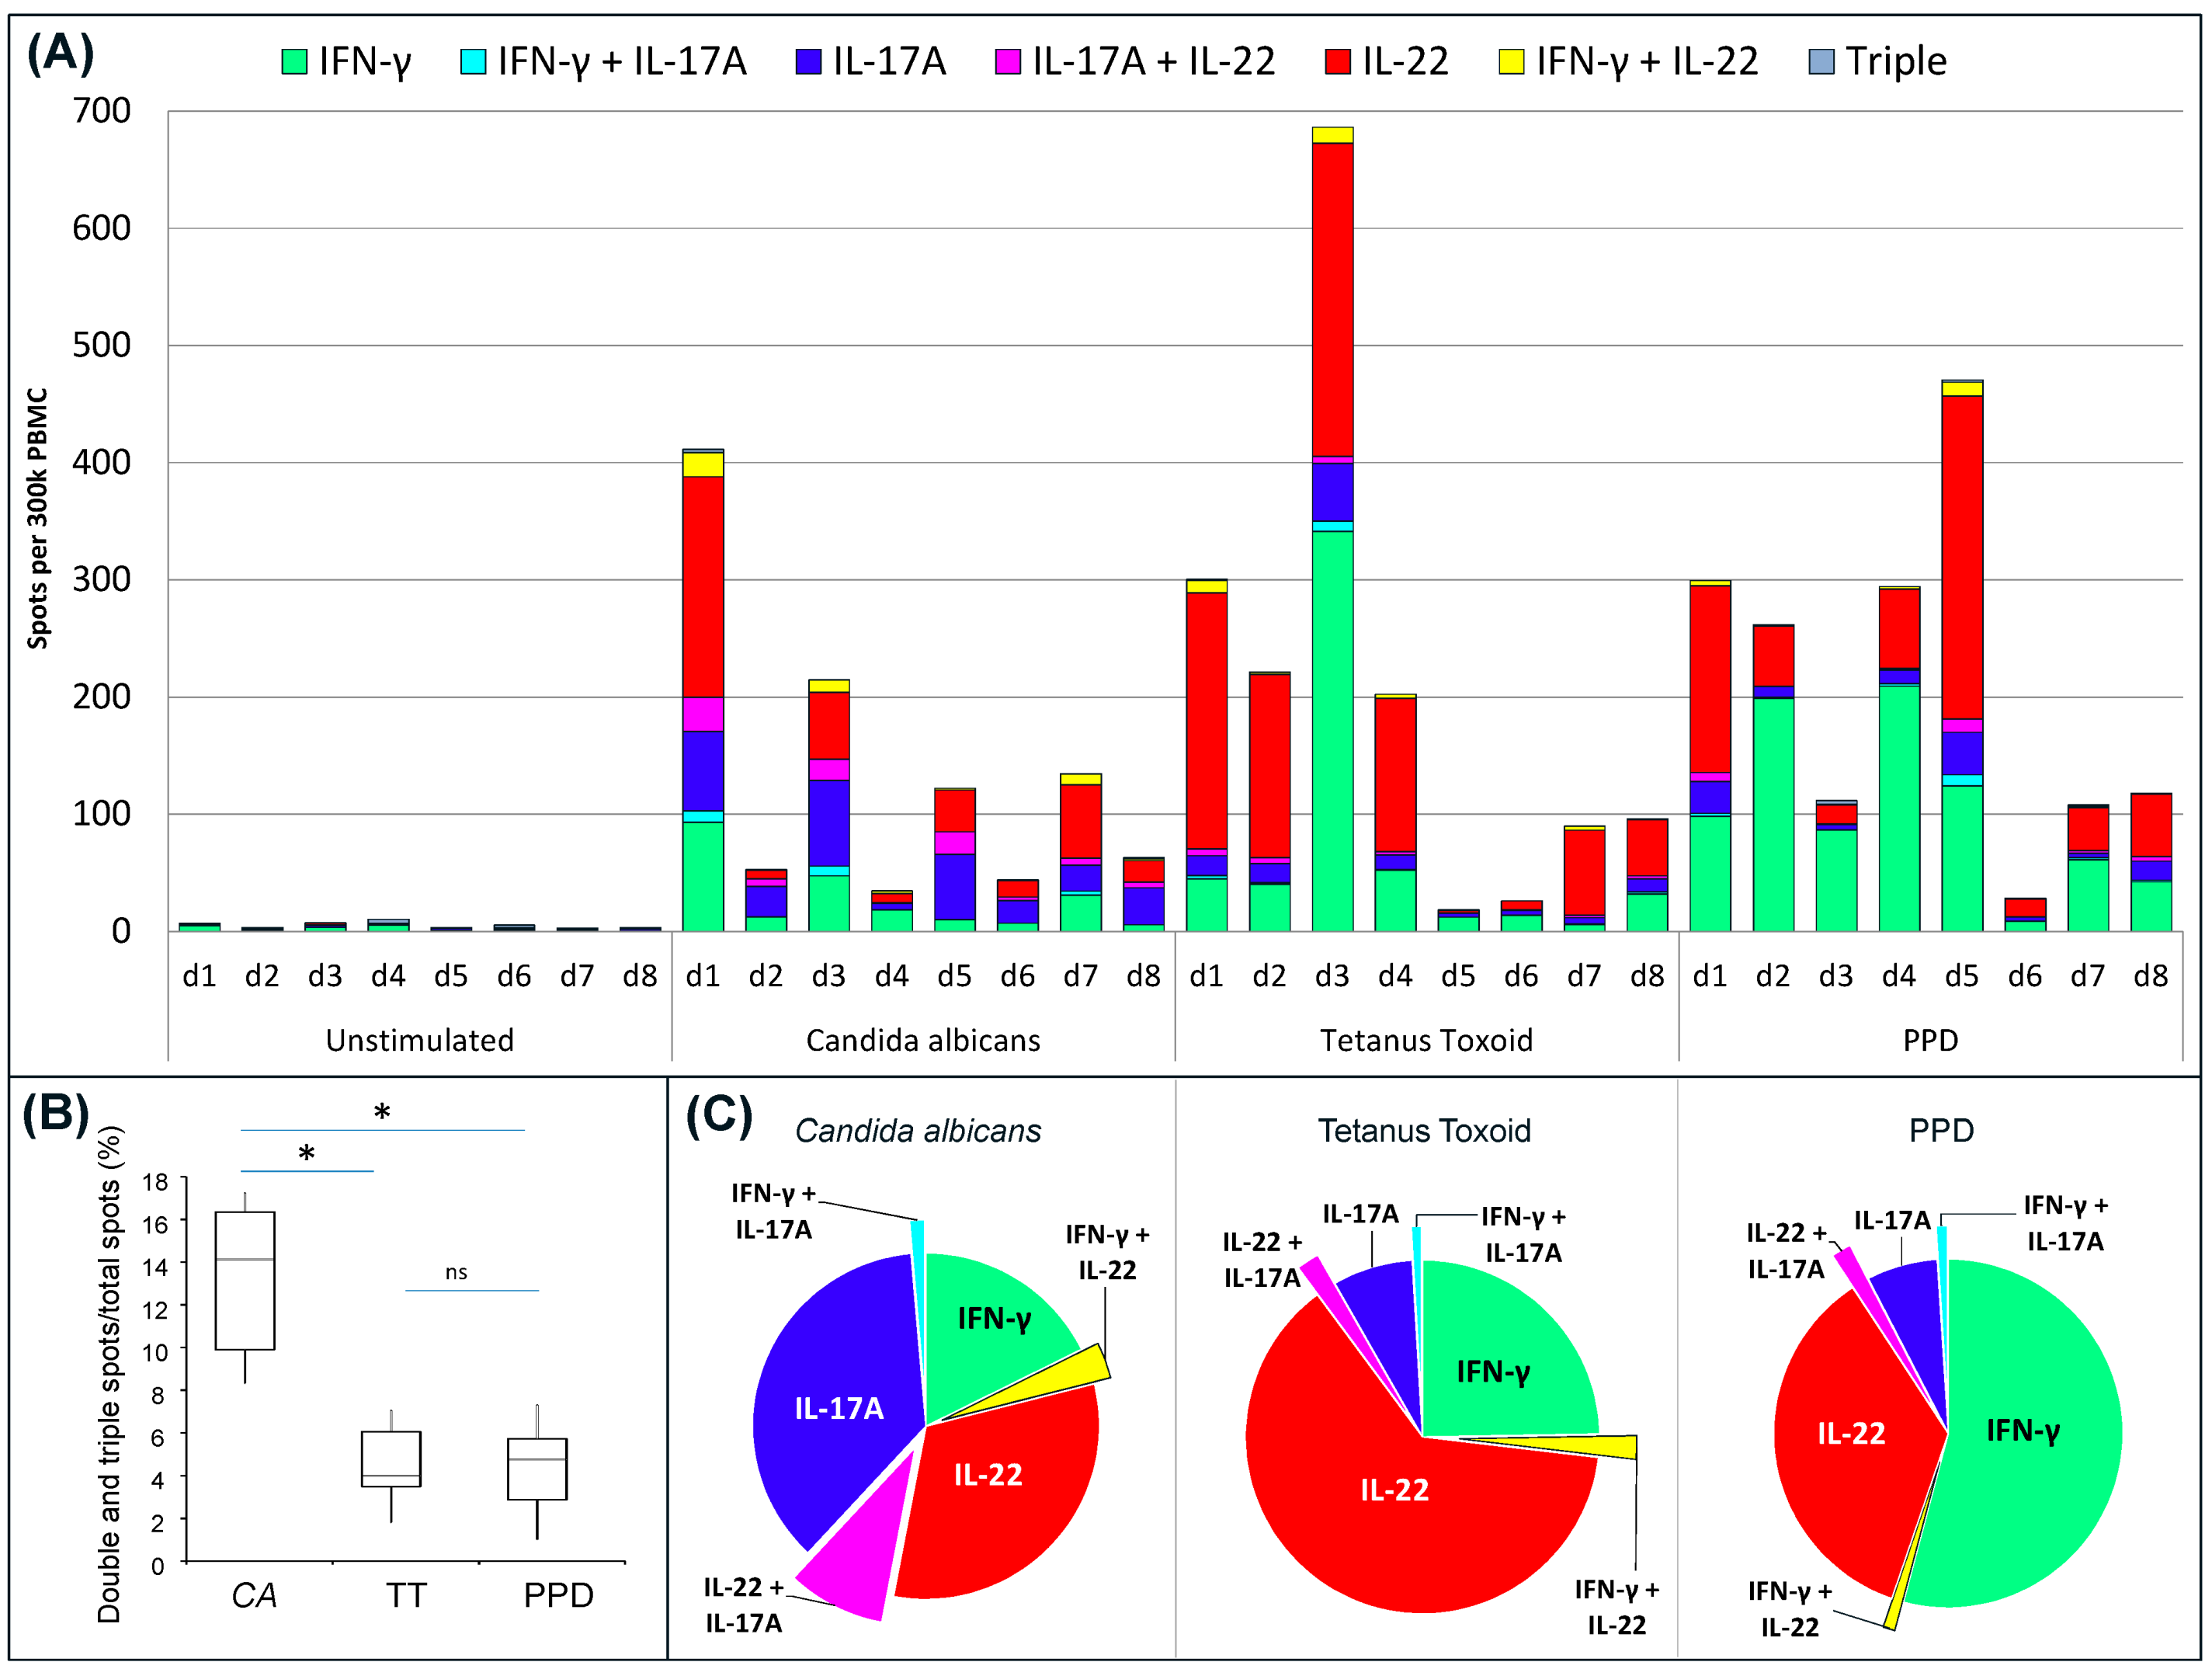
Figure 3.
IFN-γ/IL-17A/IL-22 triple FluoroSpot analysis of PBMC responses to CA, TT and PPD. PBMC incubated with stimuli or medium alone were analyzed for spots representing cells secreting single, double and triple combinations of IFN-γ, IL-17A and IL-22. (A) The bars represent individual responses (n = 8) to all antigens divided into single, double or triple spots; (B) Analysis of the proportion of double- and triple-stained spots induced by the different antigens shown for all eight donors. The box plot show median (line in box), min and max (vertical lines), and 25 and 75 percentiles (box) for CA, TT, and PPD stimulation (n = 8). Statistical significance is indicated as * (p < 0.01) or ns (not significant); (C) Average proportion of single and double spots for each cytokine/cytokine combination per total number of spots. PBMC with responses below 40 spots in total were excluded for the analysis (1 donor for CA, 2 donors for TT and 1 donor for PPD) to avoid an impact of subtle differences in spot numbers in the low responders.
![Cells 03 01116 g003]()
The linearity of the cytokine response to one of the antigens (CA) was assessed by incubating different cell concentrations in the wells, from 500,000 down to 200,000 PBMC/well (
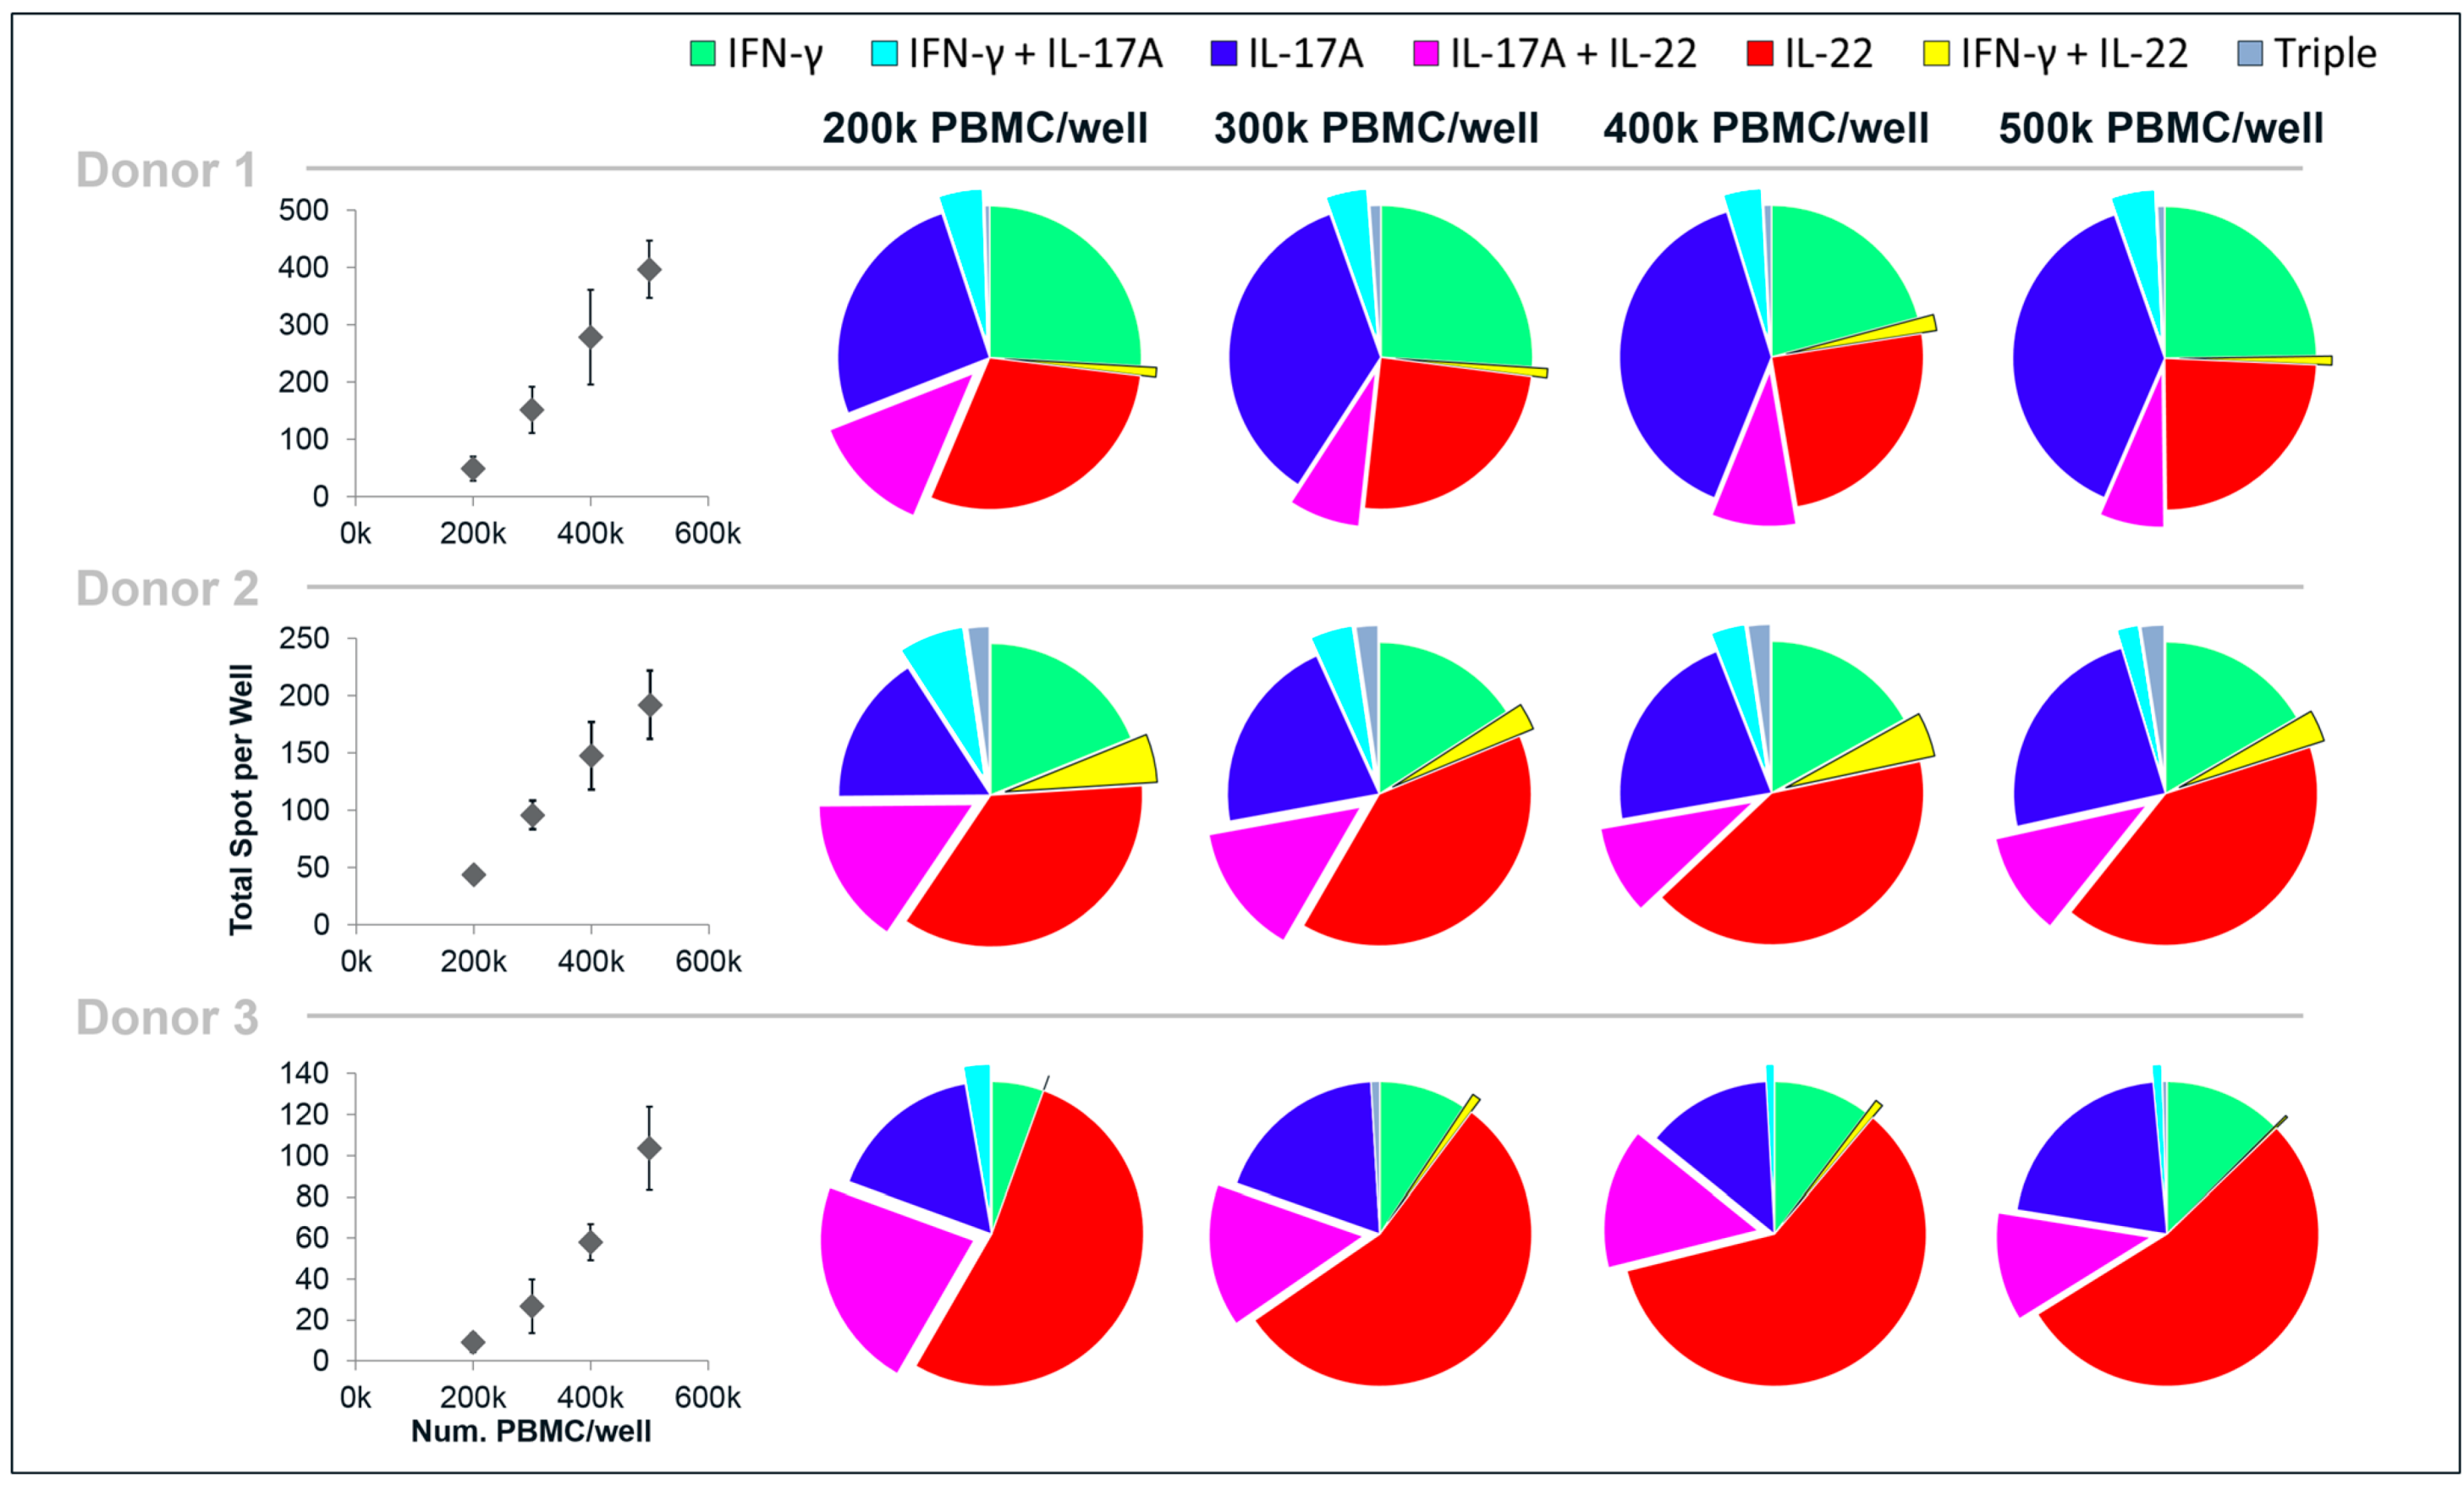
Figure 4). Decreasing the cell concentrations in the wells had little impact on the cytokine profile in terms of the proportion of single-, double- and triple-secreting cells. Even with as few spots as 10 spots/well (donor 3:200,000 PBMC/well), a cytokine pattern similar to the higher cell concentrations was observed (it should be noted that 10 spots is the mean of a quadruplicate and hence the analysis is based on the average of 40 spots). As could be expected, decreasing cell concentrations led to a decrease of the number of total spots/well. The decrease in spots was proportionally larger than the decrease in cell numbers, suggesting that cytokine responses to the antigens are favored by a high cell density.
Figure 4.
Linearity of PBMC responses to CA, analyzed by IFN-γ/IL-17A/IL-22 triple FluoroSpot. PBMC from three donors were incubated with stimuli or medium alone and analyzed for spots representing cells secreting single-, double- and triple combinations of IFN-γ, IL-17A and IL-22. Quadruplicate wells with 200,000, 300,000, 400,000 or 500,000 PBMC/well were analyzed. The graphs to the left show the mean total number of spots/well and standard deviation obtained for each cell concentration. The charts to the right show the proportion of single-, double- and triple spots for each cytokine/cytokine combination per total number of spots.
3.5. Reliability of the Analysis of Double and Triple Spots
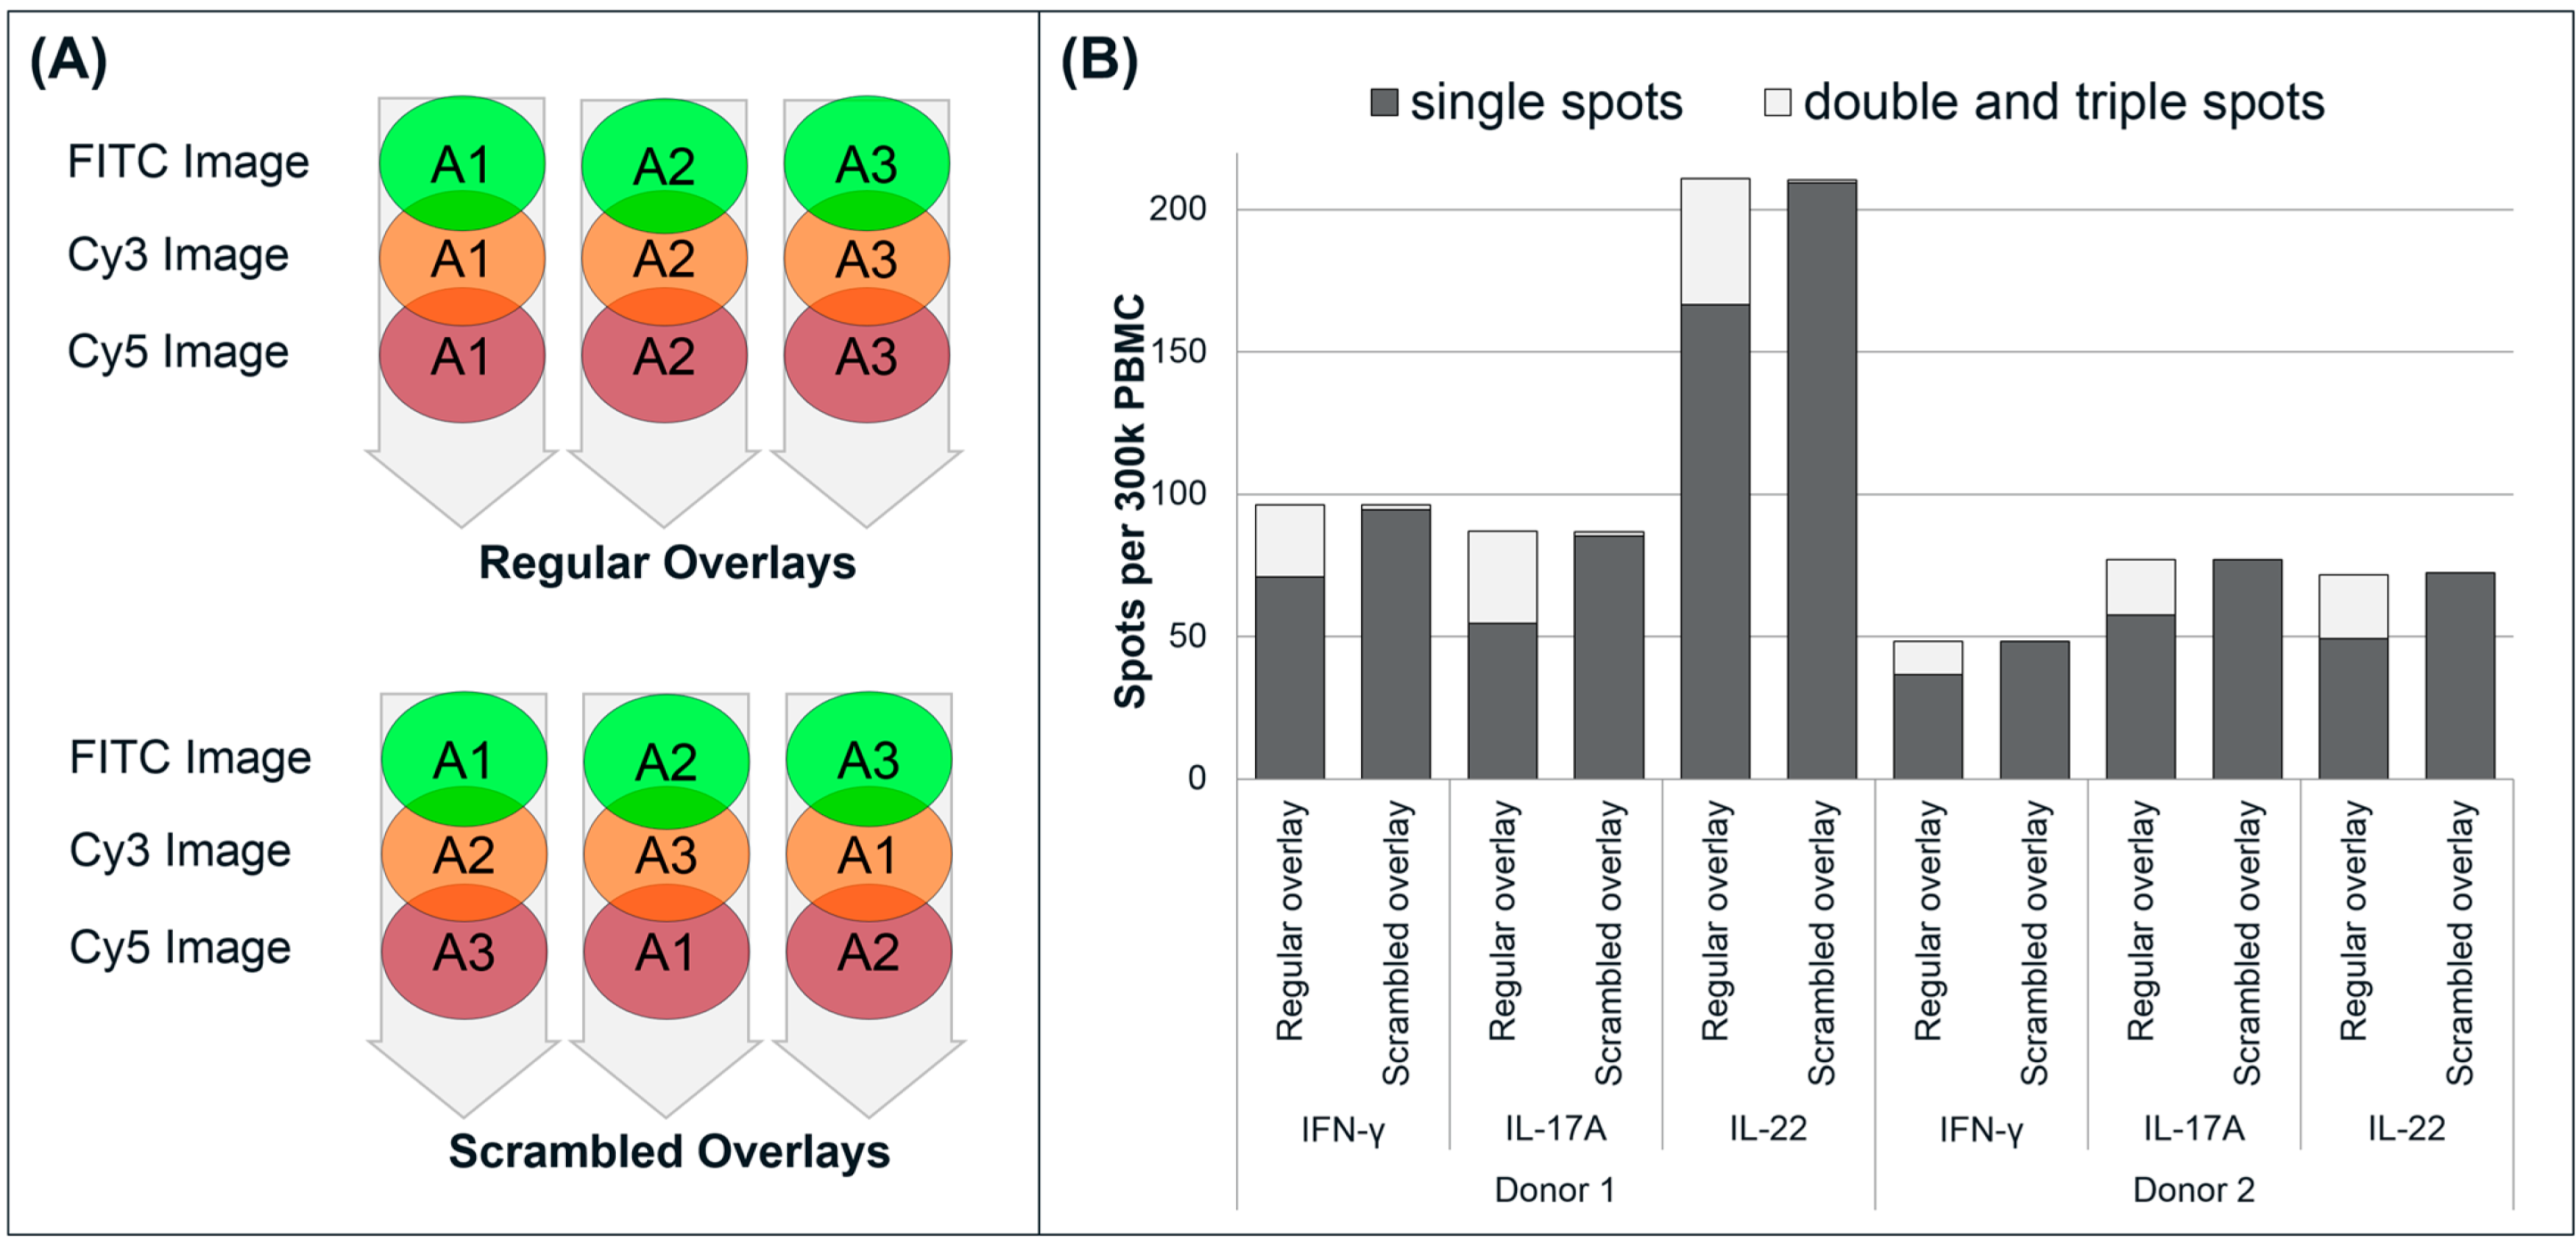
To assess the potential risk of having false positive double spots caused by random co-localization (spots generated by adjacent cells), well images from sample triplicates were scrambled (
i.e., mismatched) and evaluated for dual and triple secretion (
Figure 5) as previously described by Rebhahn
et al., 2008 [
17]. In the examples shown, control wells represent the regular overlay analysis where a substantial number of double- and triple-stained spots are found (approximately 15% of total events), in addition to the single-stained spots. A scrambled overlay analysis,
i.e., of mismatched images from different replicates within a triplicate, only one or two (false positive) double stained spots/well and no triple stained spots could be found.
Figure 5.
Scrambled analysis of triple FluoroSpot. (A) The regular overlay analysis of a well is made by comparing the location of spots on three images (one for each fluorophore) from one well. In the scrambled analysis, three images (each representing one fluorophore) from different wells within a triplicate were mismatched. Thus, one fluorophore image from well 1 was combined with another fluorophore image from well 2, a third fluorophore image from well 3, etc.; (B) Example of two triplicates analyzed by a regular and scrambled overlay analysis.
3.7 Discussion
This study shows the functionality of the FluoroSpot assay for the enumeration of human PBMC secreting IFN-γ, IL-17A or IL-22, as well as cell populations secreting combinations of the three cytokines. Most antigen-reactive cells secreted only single cytokines whereas the proportion of cells secreting two cytokines was lower and yet lower for triple-secreting cells. The antigens were selected based on previously shown reactivity with Th1, Th17, and/or Th22 cells upon stimulation of peripheral blood cells or CD4+ T cells from healthy individuals [
19,
20,
21]. In line with this, most donors responded well to the antigens. On average CA induced higher single IL-17A and IL-22 responses than IFN-γ whereas TT and PPD were more prone to induce IFN-γ and IL-22. CA also induced a significantly greater proportion of co-secreting cells than did TT and PPD, in particular IL-17A/IL-22. Stimulation with CA has been shown to elicit CD4+ T cells that are IFN-γ+, IL-17+ or IL-22+ in flow cytometry but also, to a lesser extent, cells co-expressing combinations of these cytokines [
19]. In that study, responses to TT were defined as primarily single IFN-γ+. However, increased IL-17A mRNA after stimulation of PBMC with TT has been described [
20]. Herein, TT was found to elicit IFN-γ, IL-17A, and IL-22. Discrepancies between studies may be explained by differences in secretion kinetics for the three cytokines. The FluoroSpot, measuring cumulatively over the entire 44-hour incubation, differ in that sense from flow cytometry. Shortening the cell incubation time in the FluoroSpot to 20 h resulted in lower spot counts, in particular for IL-17A. Although IFN-γ and several other cytokines often are analyzed in, e.g., ELISpot after 20 h, the simultaneous analysis of three cytokines in FluoroSpot requires the incubation time to be adapted to suit all three cytokines.
Figure 6.
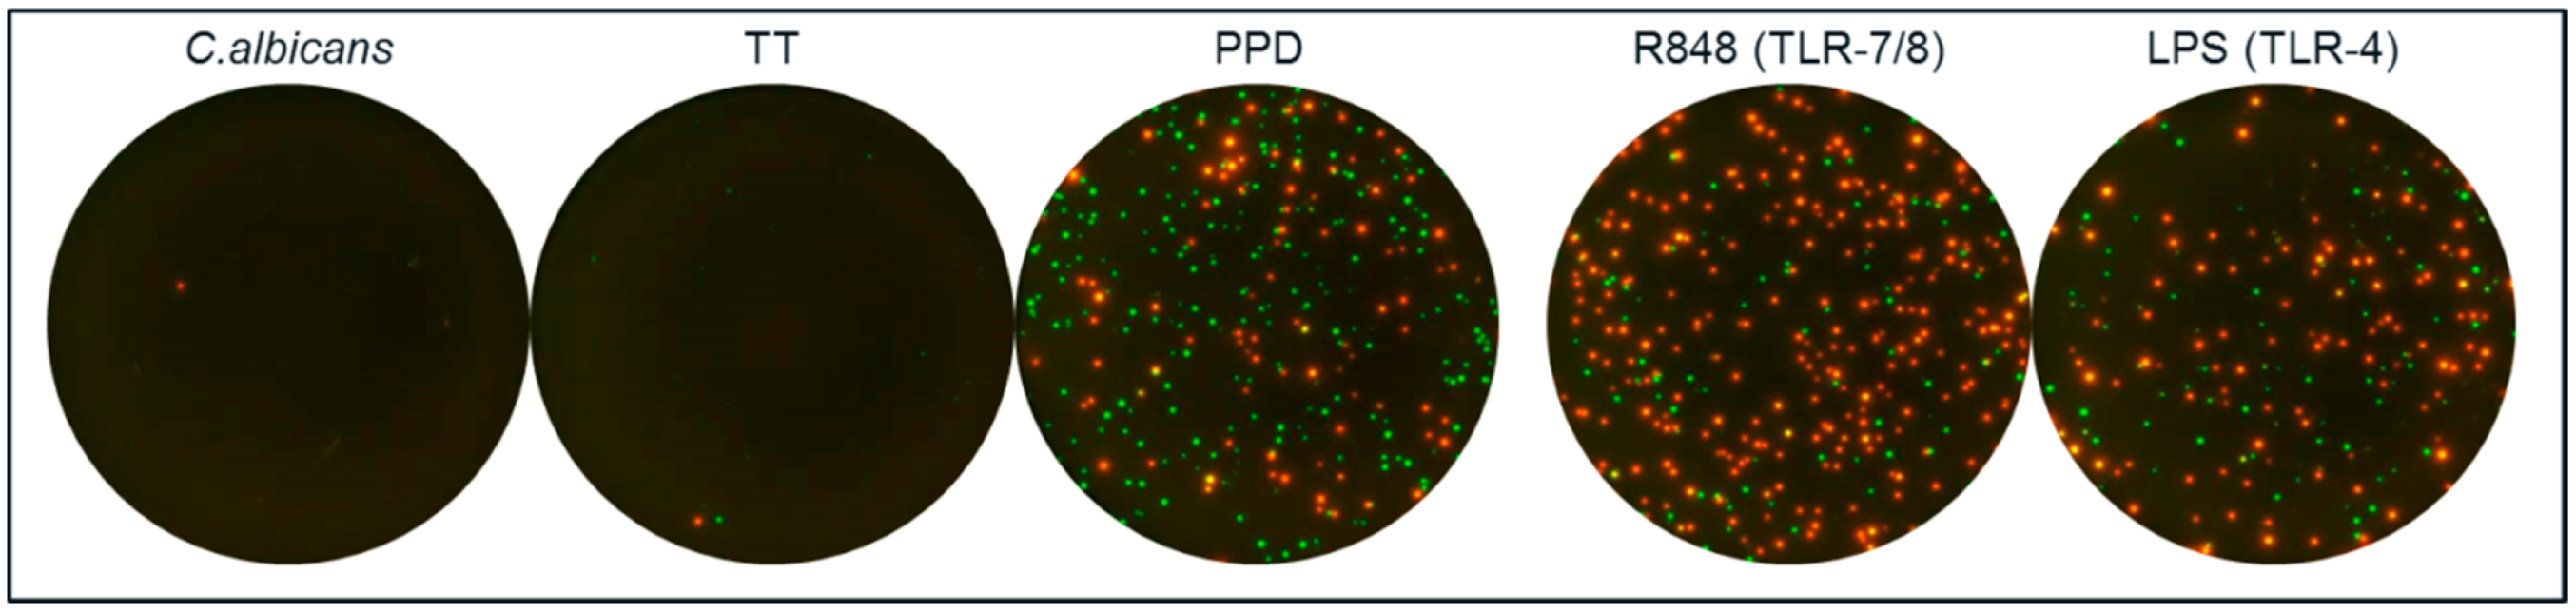
Assessment of the ability of CA, TT and PPD to induce activation of non-T cells. PBMC from two donors were stimulated with CA, TT and PPD and analyzed by a dual IL-6/IL-1β FluoroSpot. TLR agonists R848 (TLR-7/8) and LPS (TLR-4) were included for comparison. Two thousand five hundred PBMC per well were incubated with antigen or TLR agonist and IL-1β and IL-6 detected. IL-1 β spots are shown in red and IL-6 spots in green. PPD and R848 yielded >250 of IL-1β, IL-6 and IL-1b/IL-6 spots per 2500 PBMC and LPS resulted in >150 spots/2500 PBMC. In contrast, PBMC incubated with CA, TT or medium alone (not shown) resulted in a total number of <6 spots/2500 PBMC. The experiment was repeated with other PBMC donors with similar results.
Figure 6.
Assessment of the ability of CA, TT and PPD to induce activation of non-T cells. PBMC from two donors were stimulated with CA, TT and PPD and analyzed by a dual IL-6/IL-1β FluoroSpot. TLR agonists R848 (TLR-7/8) and LPS (TLR-4) were included for comparison. Two thousand five hundred PBMC per well were incubated with antigen or TLR agonist and IL-1β and IL-6 detected. IL-1 β spots are shown in red and IL-6 spots in green. PPD and R848 yielded >250 of IL-1β, IL-6 and IL-1b/IL-6 spots per 2500 PBMC and LPS resulted in >150 spots/2500 PBMC. In contrast, PBMC incubated with CA, TT or medium alone (not shown) resulted in a total number of <6 spots/2500 PBMC. The experiment was repeated with other PBMC donors with similar results.
PPD elicited secretion of IL-1β and IL-6 in the same manner as did two TLR agonists known to activate monocytes to secrete these cytokines [
22]. This was not seen with CA and TT. This raises the question whether monocyte-derived cytokines influences the PPD-specific T-cell response
in vitro. When PBMC from healthy donors were stimulated with PPD and analyzed by flow cytometry, a similar cytokine profile as observed in this evaluation was found [
21]. In that study, to assess if the T-cell response to PPD was affected by other cells, PPD was substituted with synthetic peptides corresponding to mycobacterial antigens but no shift in the cytokine profile was seen [
21]. Nonetheless, caution has to be taken when using antigen extracts for the analysis of T cells.
FluoroSpot is a versatile tool for studying co-secretion of molecules but is also used for the detection of antibodies of different immunoglobulin (Ig) isotypes secreted by B cells that produce only one Ig isotype per cell [
23]. Studies utilizing cytokine FluoroSpot cover a variety of cytokines secreted alone or in combinations by T cells and monocytes [
16,
22]. Several studies have specifically addressed co-secretion of IFN-γ and IL-2 by T cells as an indicator of poly-functionality [
24,
25,
26]. In future studies using IFN-γ/IL-17A/IL-22 FluoroSpot it is likely that both distinct single-secreting cells and co-secreting cells will be found and the ability of FluoroSpot readers to distinguish between spot types is crucial. As shown by the cell titration in
Figure 4, the identification of spot sub-populations is insignificantly affected by the total number of spots per well, so long as an accurate spot count is possible. The computerized overlay analysis used herein to define double- and triple-stained spots appears to be precise judging from the near total loss of such spots when mismatched images from different wells were subjected to a scrambled overlay analysis. The coincidence limit (CL) used for these experiments equates to approximately 15 µm. Estimating that the size of resting lymphocytes is approximately 10 µm, false double spots are theoretically possible as two separate single-secreting cells, each producing a uniform spot of one cytokine only, would fit within the CL. However, as only a very small fraction of the cells respond to antigen-specific stimulation, the probability that two single secreting cells lie adjacent to one another is quite small. For the same reason, false triple-stained spots are even less likely. Assessing the probability of false double-positive spots by analysis of scrambled images is particularly important if high spot numbers coincide with low frequencies of double-stained cells.
When capture mAbs to different cytokines are coated in the same well, the absorption of one cytokine may influence the production of another cytokine. In particular this appears to be the case for IL-2. The capture of IL-2 had a negative effect on, e.g., IFN-γ and IL-5 measured simultaneously in dual ELISpot [
27]. To compensate for the absorption of IL-2, antibodies to CD28 can be added to the cells and by providing a co-stimulatory signal restore the production of, e.g., IFN-γ [
24]. When addressing this potential issue in the IFN-γ/IL-17A/IL-22 FluoroSpot, no absorption effects were seen and no anti-CD28 antibodies were used.
Taking the ELISpot-based technique a step closer to multiplex analysis by utilizing fluorophores for the detection makes the method more comparable to flow cytometry. Still, the methods differ in that flow cytometry detects intracellular cytokines and simultaneously defines the surface markers of the involved cell populations. ELISpot and FluoroSpot, on the other hand, detect antigen-specific cytokine-secreting T cells with a higher sensitivity and are more adaptable to screening of large sample numbers in, e.g., vaccination trials [
28,
29]. The detection sensitivity of the single FluoroSpot for IFN-γ, IL-17A, and IL-22 was comparable to ELISpot with a slightly better detection displayed by the ELISpot with regard to the low frequencies of spontaneously secreting cells. From the fact that single- and triple FluoroSpot displayed a fully comparable sensitivity, it can be deduced that also the triple FluoroSpot is comparable to ELISpot in terms of detection sensitivity. Many parameters affect the sensitivity of the FluoroSpot assay and there is room for further improvements of tag/anti-tag systems, fluorophores, fluorescence enhancers and the automated readers. The use of tag/anti-tag systems has the benefit that it can be adapted to a variety of assays and inclusion of a fourth tag system allows for future analysis of four cytokines. FluoroSpot amplification strategies, based on primary detection antibodies from different species, followed by secondary detection with species-specific anti-Ig antibodies coupled with fluorophores, have also been used [
17]. However, this approach is limited in the sense that it prevents the use of capture antibodies from certain species and requires compatible detection antibodies from different species for each application.
Facilitating a rapid and simple way of determining the relative frequency of cells secreting IFN-γ, IL-17A and IL-22 and intermediate cell populations is likely to help in shedding light upon the nature of immune reactions involved in protective, as well as detrimental reactions.


