Hypoxia and IF1 Expression Promote ROS Decrease in Cancer Cells
by
 , ,
, ,
Gianluca Sgarbi
1,* ,
,
Giulia Gorini
1,2,
Francesca Liuzzi
1,
Giancarlo Solaini
1 and
Alessandra Baracca
1 1
Department of Biomedical and Neuromotor Sciences, Laboratory of Biochemistry and Mitochondrial Pathophysiology, University of Bologna, Bologna 40126, Italy
2
Department of Biomedical, Experimental, and Clinical Sciences “Mario Serio”, University of Florence, Florence 50121, Italy
*
Author to whom correspondence should be addressed.
Cells 2018, 7(7), 64; https://doi.org/10.3390/cells7070064
Submission received: 25 May 2018
/
Revised: 15 June 2018
/
Accepted: 19 June 2018
/
Published: 21 June 2018
(This article belongs to the Section Mitochondria)
Abstract
:The role of reactive oxygen species (ROS) in the metabolic reprogramming of cells adapted to hypoxia and the interplay between ROS and hypoxia in malignancy is under debate. Here, we examined how ROS levels are modulated by hypoxia in human cancer compared to untransformed cells. Short time exposure (20 min) of either fibroblasts or 143B osteosarcoma cells to low oxygen tension down to 0.5% induced a significant decrease of the cellular ROS level, as detected by the CellROX fluorescent probe (−70%). Prolonging the cells’ exposure to hypoxia for 24 h, ROS decreased further, reaching nearly 20% of the normoxic value. In this regard, due to the debated role of the endogenous inhibitor protein (IF1) of the ATP synthase complex in cancer cell bioenergetics, we investigated whether IF1 is involved in the control of ROS generation under severe hypoxic conditions. A significant ROS content decrease was observed in hypoxia in both IF1-expressing and IF1- silenced cells compared to normoxia. However, IF1-silenced cells showed higher ROS levels compared to IF1-containing cells. In addition, the MitoSOX Red-measured superoxide level of all the hypoxic cells was significantly lower compared to normoxia; however, the decrease was milder than the marked drop of ROS content. Accordingly, the difference between IF1-expressing and IF1-silenced cells was smaller but significant in both normoxia and hypoxia. In conclusion, the interplay between ROS and hypoxia and its modulation by IF1 have to be taken into account to develop therapeutic strategies against cancer.
1. Introduction
Reactive oxygen species (ROS) are critical chemicals in cells: at controlled concentrations, they function as second messengers mediating the responses of cells to various endogenous and exogenous signals [1], although at high concentrations ROS cause a redox imbalance and subsequent oxidative stress [2]. This induces cytotoxicity due to oxidation of lipids, proteins, and nucleic acids, particularly within mitochondria, where ROS are mainly produced at the level of redox centers of the respiratory chain [3,4]. Besides the respiratory chain Complexes I-III, cytoplasmic oxidoreductases can generate ROS as a by-product, including cyclooxygenase, uncoupled nitric oxide synthase [5], and xanthine oxidase [1]. In addition, membrane proteins such as β-nicotinamide adenine dinucleotide 2′-phosphate (NADPH) oxidases deliberately produce hydrogen peroxide [6]. Low levels of oxygen in tissues (hypoxia) arise in both normal development and different pathophysiological conditions where limited oxygen supply is frequently caused by a defective vasculature. Such conditions include ischemic disorders, atherosclerosis, inflammatory diseases, chronic obstructive pulmonary disease and cancer [7]. Hypoxia induces HIF-1α stabilization in cells (the subunit α of the hypoxia-inducible factor 1) that in turn triggers the activation of a cellular adaptive response that is mediated by HIF-1, the master regulator of transcription in hypoxia. Mitochondria are one of the main targets of this process since HIF-1 can induce pyruvate dehydrogenase kinase-1 (PDK1) activation, that hinders pyruvate dehydrogenase (PDH) activity, thus limiting the substrates availability to the Tricarboxylic Acids Cycle, and consequently to oxidative phosphorylation (OXPHOS) [8]. Other factors have been shown to contribute to OXPHOS activity decrease in cells exposed to hypoxia, including mitophagy and Complex I deactivation [9,10]. Nevertheless, our recent observations indicated that the adaptive response of normal human cells to hypoxia is strongly dependent on glucose availability. Indeed, in hypoxic human fibroblasts forced to rely on OXPHOS as the major source of ATP, the mitochondrial mass is almost completely preserved and the levels of OXPHOS enzymes are significantly increased; the contrary occurs when glucose is the main energy substrate of cells [9].
An important feature that is still under discussion concerns the level and the potential role of Reactive Oxygen Species (ROS) in cell adaptation to hypoxia. Several studies demonstrated that under hypoxia ROS production, mostly derived from the mitochondrial electron transport chain (ETC), increased in both normal and transformed cells [11,12,13,14], whereas others reported the opposite [15,16,17,18]. Two more peculiar papers are worth being mentioned: the first reported that hypoxia causes a ROS decrease in the mitochondrial matrix compartment of vascular smooth muscle cells, whereas it increases ROS production in the mitochondrial intermembrane space, which diffuse to the cytosol [18]. The second, a recent paper, reported a burst in superoxide radicals within the first 40 min of acute hypoxia declining afterwards to a level similar to normoxia in some cell types [19]. Therefore, a controversy exists regarding the effect of hypoxia on cellular ROS generation.
To address the study of the relationships and mechanisms connecting hypoxia, ROS, and cellular redox status in cancer and untransformed cells, we first validated a method to measure the levels of oxidant species in human primary fibroblasts adapted to decreased O2 tension (0.5% O2). The cellular ROS level dependence on oxygen tension has been investigated. The cancer cell model chosen was 143B osteosarcoma cell line being osteosarcoma the most common primary malignant bone tumor, that as a solid tumor is characterized by the presence of hypoxic areas. Finally, due to the critical role ascribed to the endogenous inhibitor protein (IF1) of the mitochondrial F1F0-ATPase in the regulation of cancer cell energy metabolism [20,21,22,23,24], we assayed whether IF1 is involved in the control of ROS generation in osteosarcoma cells and whether ROS handling could distinguish normal from transformed cells.
2. Materials and Methods
2.1. Reagents
Bovine serum albumin, Dulbecco’s Modified Eagle Medium, glucose, glutamine, NaCl, N-Acetyl-L-Cysteine (NAC), phenylmethylsulfonyl fluoride (PMSF), protease inhibitors, pyruvate, SDS, sodium deoxycholate, tert-butylhydroperoxide (Luperox), tris/Cl, triton X-100, were all purchased from Sigma-Aldrich (St. Luis, MO, USA). CellROX Orange and MitoSOX Red were from (Thermo Fisher Scientific, Waltham, MA, USA).
2.2. Cell Culture
Fibroblasts were obtained from skin biopsies of four healthy individuals (9–35 years) after informed consent had been obtained. Cell lines were established and expanded in Dulbecco’s modified Eagle’s medium (DMEM) containing 25 mM glucose, 4 mM glutamine, 1 mM pyruvate, 100 U/ml penicillin, 100 mg/ml streptomycin, 0.25 mg/ml amphotericin B, and supplemented with 15% fetal bovine serum (FBS) (Thermo Fisher Scientific, Waltham, MA, USA). Fibroblasts were seeded at 8 × 10³ cells/cm2 in high glucose to favor adhesion, and, after 16 h, the medium was replaced with the experimental one containing 5 mM glucose. Controls and IF1-silenced clones derived from the 143B osteosarcoma cell line [24] were seeded at 3.5 × 10⁴ cells/cm2 in high glucose medium containing 10% FBS to favor adhesion, and, after 16 h, the medium was replaced with fresh medium. Routine mycoplasma tests were performed to ensure the absence of contamination. All the cell types were cultured simultaneously for up to 24 h in two different incubators; in a humidified atmosphere at 37 °C containing 5% CO2 and either atmospheric (21% O2; pO2 = 21 kPa) or low (0.5% O2; pO2 = 0.5 kPa) oxygen tension as previously reported [15].
2.3. Flow Cytometry Analysis
Flow cytometry determination of ROS, the most contributors to total cellular reactive oxidant species, and superoxide anion was performed using a MUSE cytometer (Merk Millipore, Darmstadt, Germany) after loading the cells with either 5 μM CellROX Orange or 5 μM MitoSOX Red [25,26,27], respectively. The cells were incubated with each dye for 30 min at 37 °C under both normoxia and hypoxia (0.5% O2) and wells were then washed with HBSS to remove any remaining unincorporated dye. The cells were rapidly trypsinized, diluted to the optimal density with HBSS supplemented with 10% FBS and immediately analyzed. The cell fluorescence intensity was measured using a 532 nm excitation and a 576/28 nm emission filter; a total of 10,000 events were acquired for each analysis. Top right quadrant post-analysis of the cellular fluorescence distribution (expressed as percent of total events) were performed by the Flowing software (Cell Imaging Core, Turku Centre for Biotechnology, University of Turku).
To validate the CellROX Orange as a proper probe for cellular ROS detection, 1 mM N-Acetyl-Cysteine (NAC) and 200 μM tert-butylhydroperoxide (Luperox) were added to cells as negative and positive controls, respectively.
2.4. Immunoblot Analysis
Cells maintained under either normoxia or hypoxia (0.5% O2) were lysed, and proteins separated by sodium dodecyl sulfate-polyacrylamide gel electrophoresis (SDS-PAGE) were blotted onto nitrocellulose membranes to perform a semiquantitative analysis according to Sgarbi et al. [28]. Blots of resolved proteins were incubated with both mouse monoclonal anti-HIF-1α, anti IF1 (12 kDa), anti F1F0 ATPase a-subunit (54 kDa) (Abcam, Cambridge, UK) and mouse monoclonal anti-β actin (42 kDa) (Sigma-Aldrich, St. Louis, MO, USA) primary antibodies. Beta-Actin was used as an internal standard. Immunodetection of primary antibody was carried out with secondary goat anti-mouse IgGH + L antibody (Life Technologies, Carlsbad, CA, USA) labelled with horseradish peroxidase. Chemiluminescent detection of the specific proteins was performed with the ECL Western Blotting Detection Reagent Kit (GE Healthcare, Waukesha, WI, USA) using the ChemiDoc MP system equipped with ImageLab software (BioRad, Hercules, CA, USA) to perform the densitometric scanning of the relative protein intensity.
2.5. Protein Determination
Protein concentration of samples was assessed by a method previously reported [29]. Essentially, cellular protein content was determined in presence of 0.3% (v/v) sodium deoxycholate, using bovine serum albumin as standard.
2.6. Data analysis
Results were analyzed by means of the one-way analysis of variance (ANOVA) with Bonferroni’s post-hoc test. Statistical analysis was performed by running the OriginPro 7.5 software (Origin-Lab Corporation, Northampton, MA, USA). Data are reported as mean ± SD of at least three independent experiments. A level of p ≤ 0.05 was selected to indicate statistical significance.
3. Results
3.1. Validation of CellROX Responsiveness in Detecting ROS Level Changes
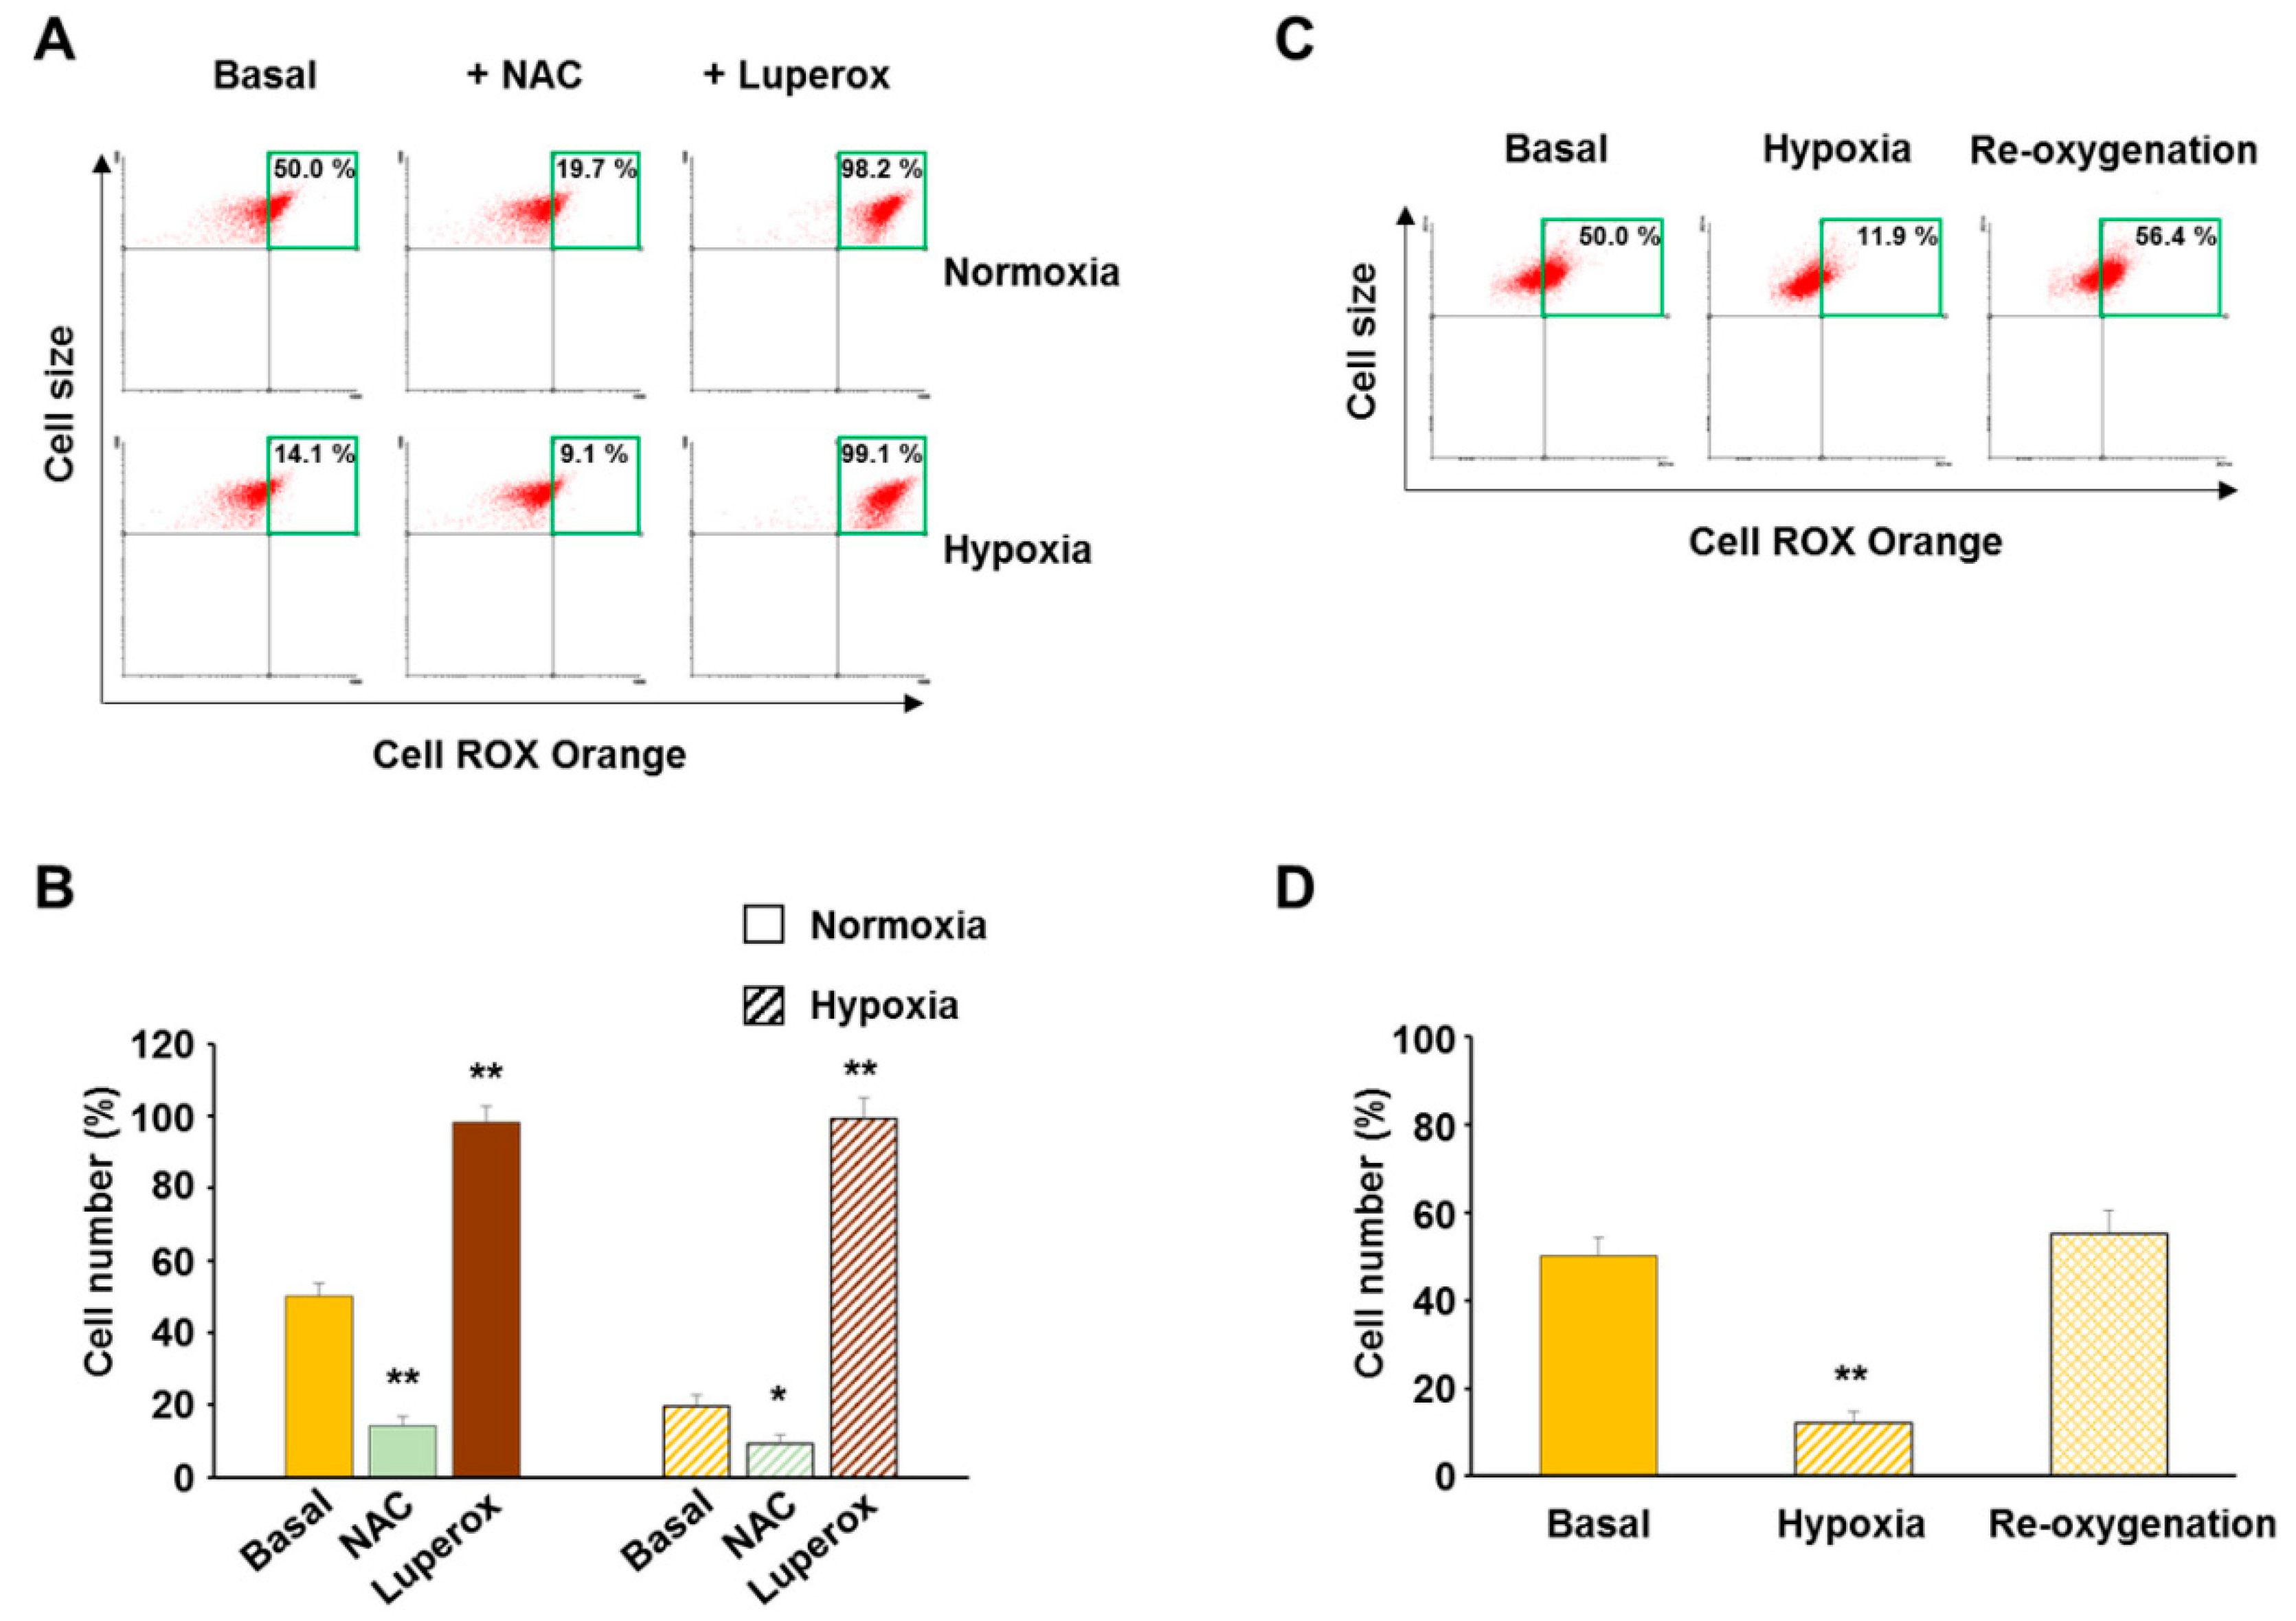
Reactive oxygen species are important chemical intermediates in biological systems, playing a dual role as either intracellular messengers in physiological functions or detrimental molecules when their generation exceeds the cell capability to control it. Due to the high reactivity, the very short life span and the extremely low concentration of cellular ROS make their assessment critical. Several recent reviews addressed the issue and compared novel approaches with commonly used methods to assay ROS in cells [30,31,32]. We identified the new oxidative stress-sensitive dye CellROX Orange as a suitable and sensitive probe to investigate ROS level changes in human fibroblasts. Indeed, with the aim to assess the oxidative status of both normal and cancer cells in response to either acute or chronic hypoxia, we tested the fluorescence responsiveness of the probe to either tert-butylhydroperoxide (Luperox), as a positive control, or N-acetyl-L-cysteine, as a negative control, in primary human fibroblasts. Flow cytometry top right quadrant analysis of cell fluorescence distribution (expressed as percent of total events) allows to evaluate changes in cellular ROS levels. Under normoxia (6 h), the cells exposure to either 1 mM NAC or 0.2 mM Luperox before loading the probe, resulted in a change of the high fluorescence cells (top right quadrant cells), with a mean of nearly 20% and 100%, respectively, compared to basal conditions (Figure 1A,B). Under hypoxia (0.5% O2), the high fluorescence cells dropped to a mean residual 20% under basal condition and the exposure to NAC further decreased ROS levels to nearly 10%. Consistently, the presence of Luperox determined a strong increase of high fluorescence cells showing values similar to those observed in normoxia (Figure 1A,B). To further support the use of the CellROX fluorescent dye, we exposed fibroblasts to 4 h hypoxia followed by 4 h re-oxygenation. As expected, hypoxia-adapted fibroblasts exposed to 21% O2 reversed the high fluorescence cell percentage to the higher basal level (Figure 1C,D) showing that cellular ROS level changes were strictly related to oxygen tension.
3.2. Hypoxia Decreased ROS Level in Both Normal and Cancer Cells
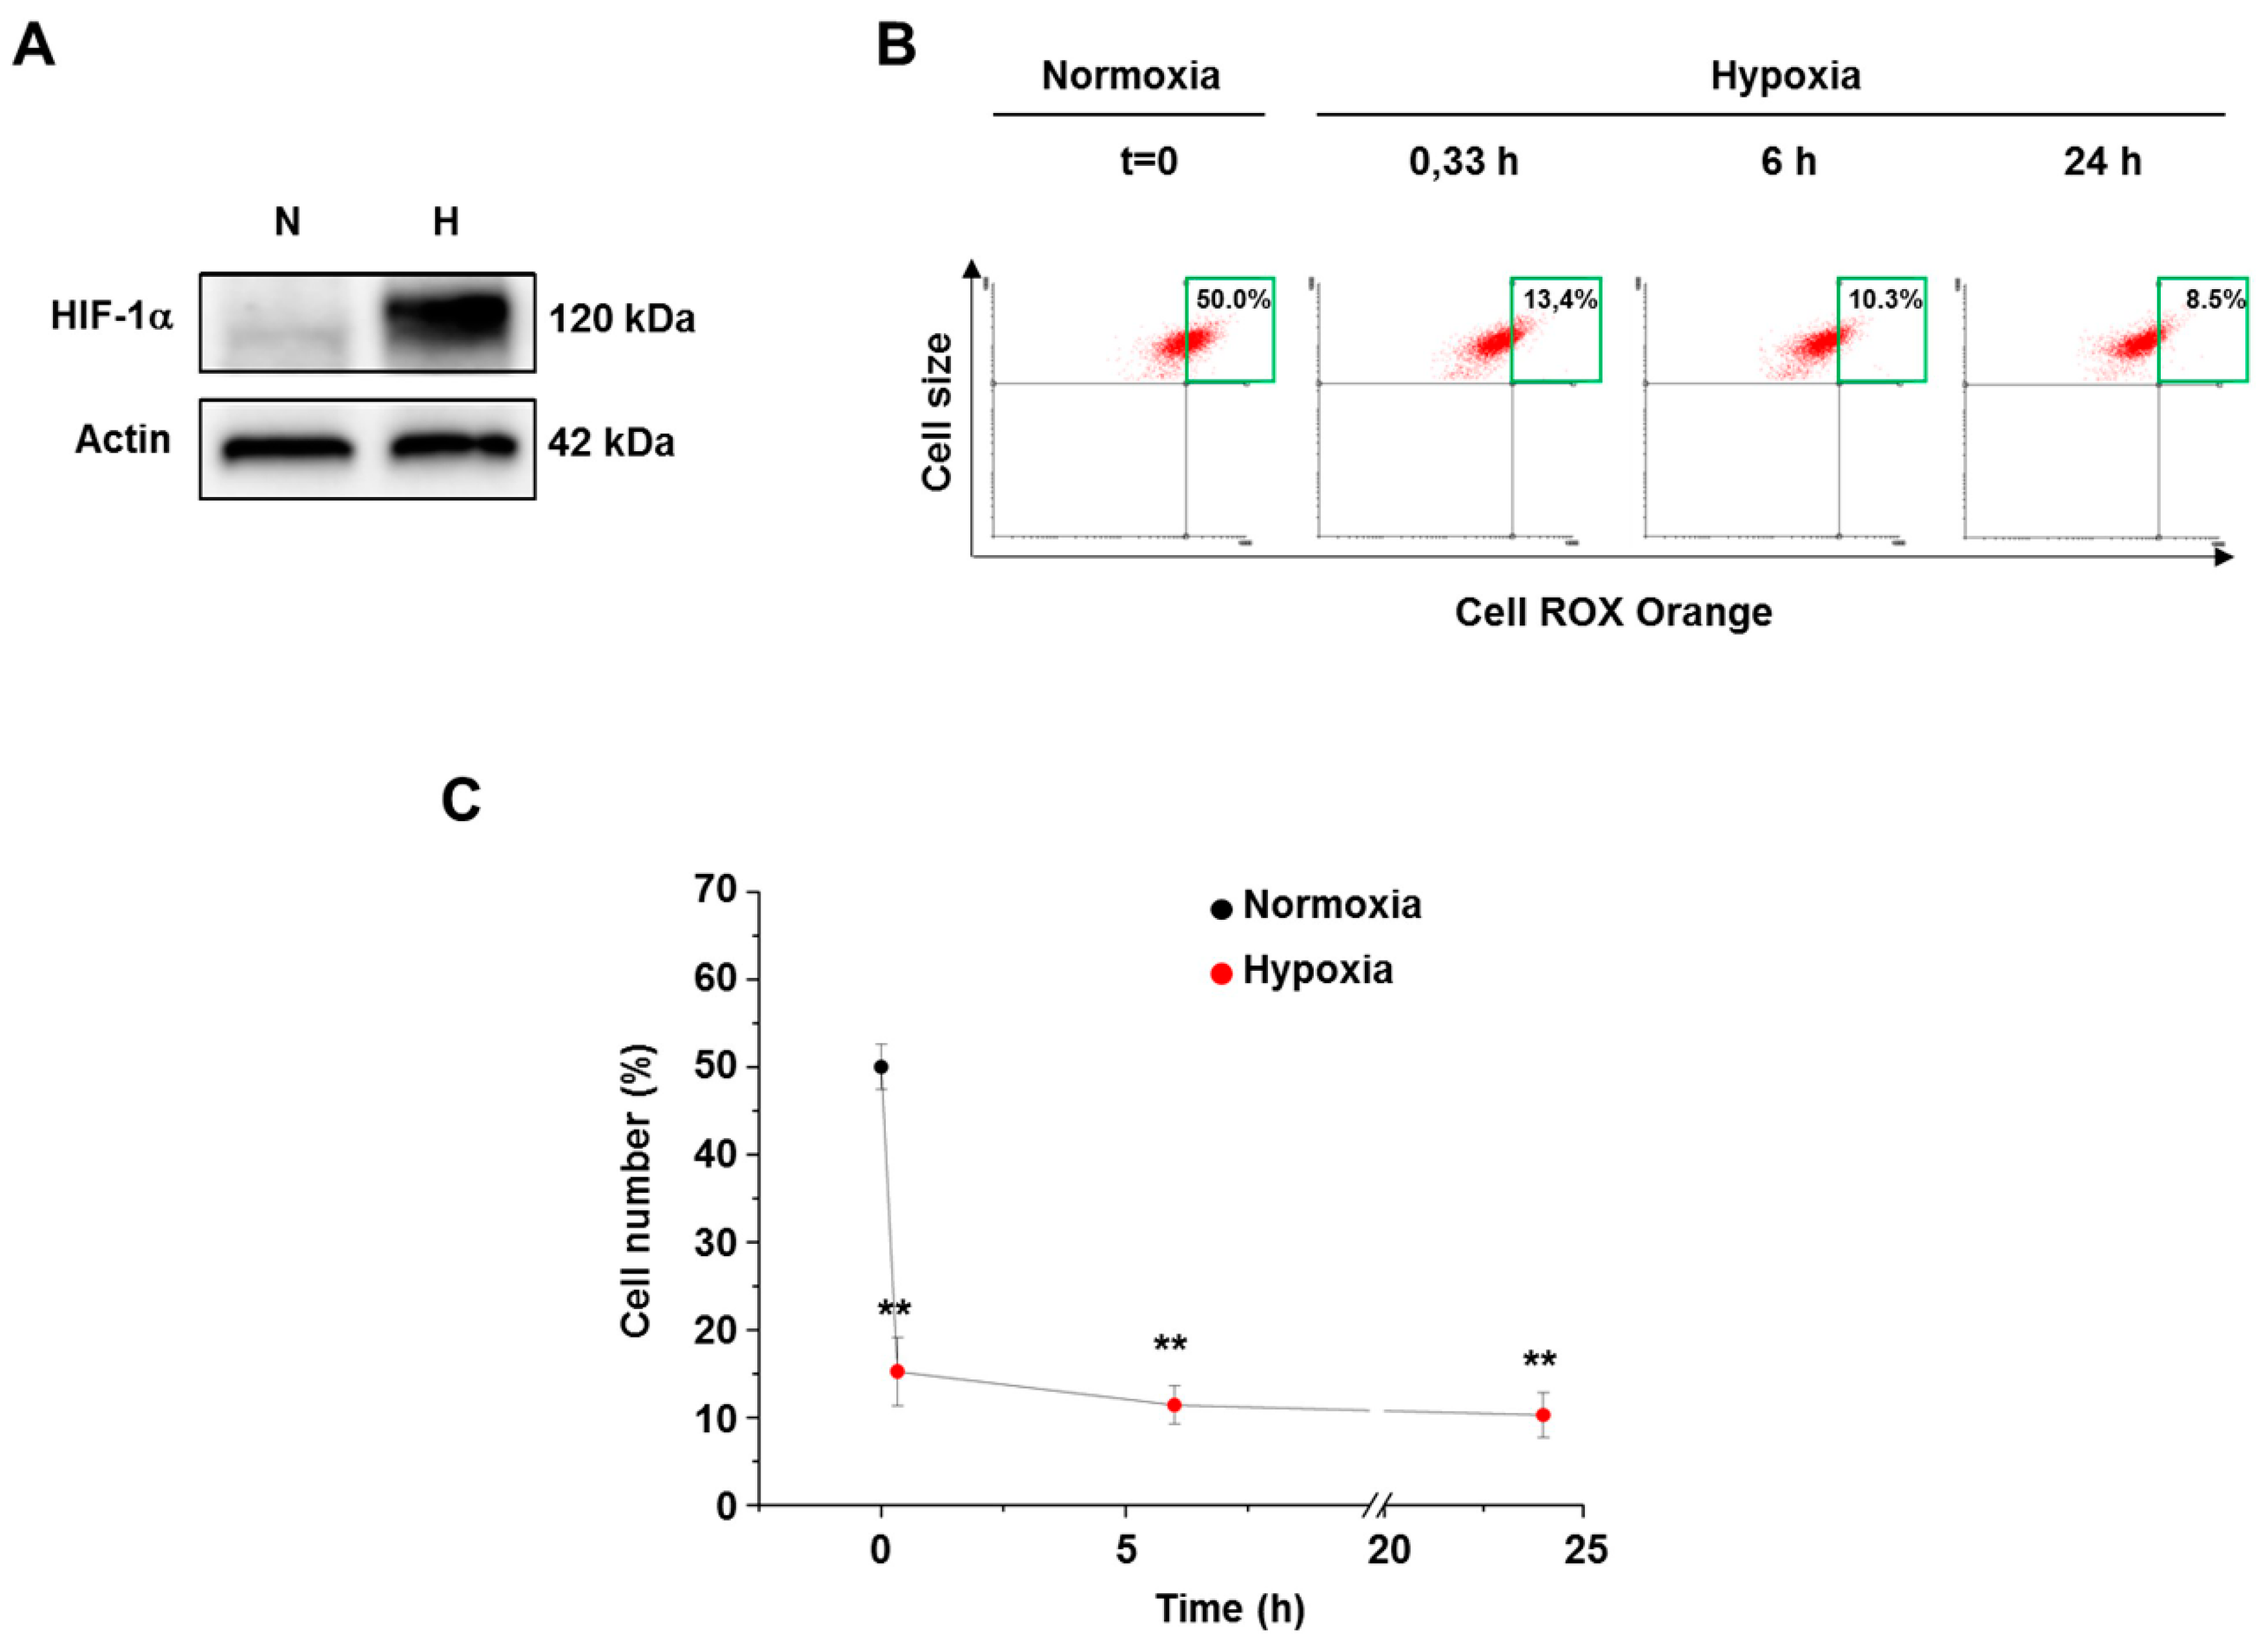
Following the CellROX Orange cell loading, we assayed the fluorescence distribution of either normal or transformed cells adapted to hypoxia at different time points up to 24 h. We first confirmed that 0.5% oxygen tension stabilizes HIF-1α in normal human fibroblasts and hence activates the HIF-1-dependent hypoxia signaling pathways (Figure 2A). Under this condition, a sharp ROS level decrease was detected following 20 min hypoxic exposure of fibroblasts, being the mean high fluorescence cells percentage nearly 20% compared to the 50% normoxic basal value (Figure 2B,C). Maintaining cells up to 24 h under hypoxia resulted in a further consistent and progressive decline of cellular ROS levels (nearly 10% top right quadrant cells).
Exposure of osteosarcoma 143B cells to severe hypoxia (0.5% O2) revealed a strong HIF-1α stabilization (Figure 3A). However, hypoxia similarly affected ROS levels of normal and transformed cells as shown by the dependence of the high fluorescence cell percentages on the hypoxic exposure time (Figure 3B,C). Again, transformed cells showed a steep fall of ROS content after 20 min hypoxic exposure, as shown by cell fluorescence distribution. A further mild decline of the cellular ROS levels up to 24 h was detected. Incidentally, ROS levels of 24 h hypoxia-exposed transformed cells were not affected by growing cells in 25 mM glucose concentration. Since several authors reported that a reduction of ROS levels in hypoxia might follow an initial burst of ROS [19], we also assessed ROS levels by exposing CellROX-loaded cells to a hypoxic short time (10 min). This condition again induced a decline of ROS level compared to normoxia (nearly 12% top right quadrant cells).
3.3. The Inhibitor Protein IF1 Controlled ROS Cellular Level
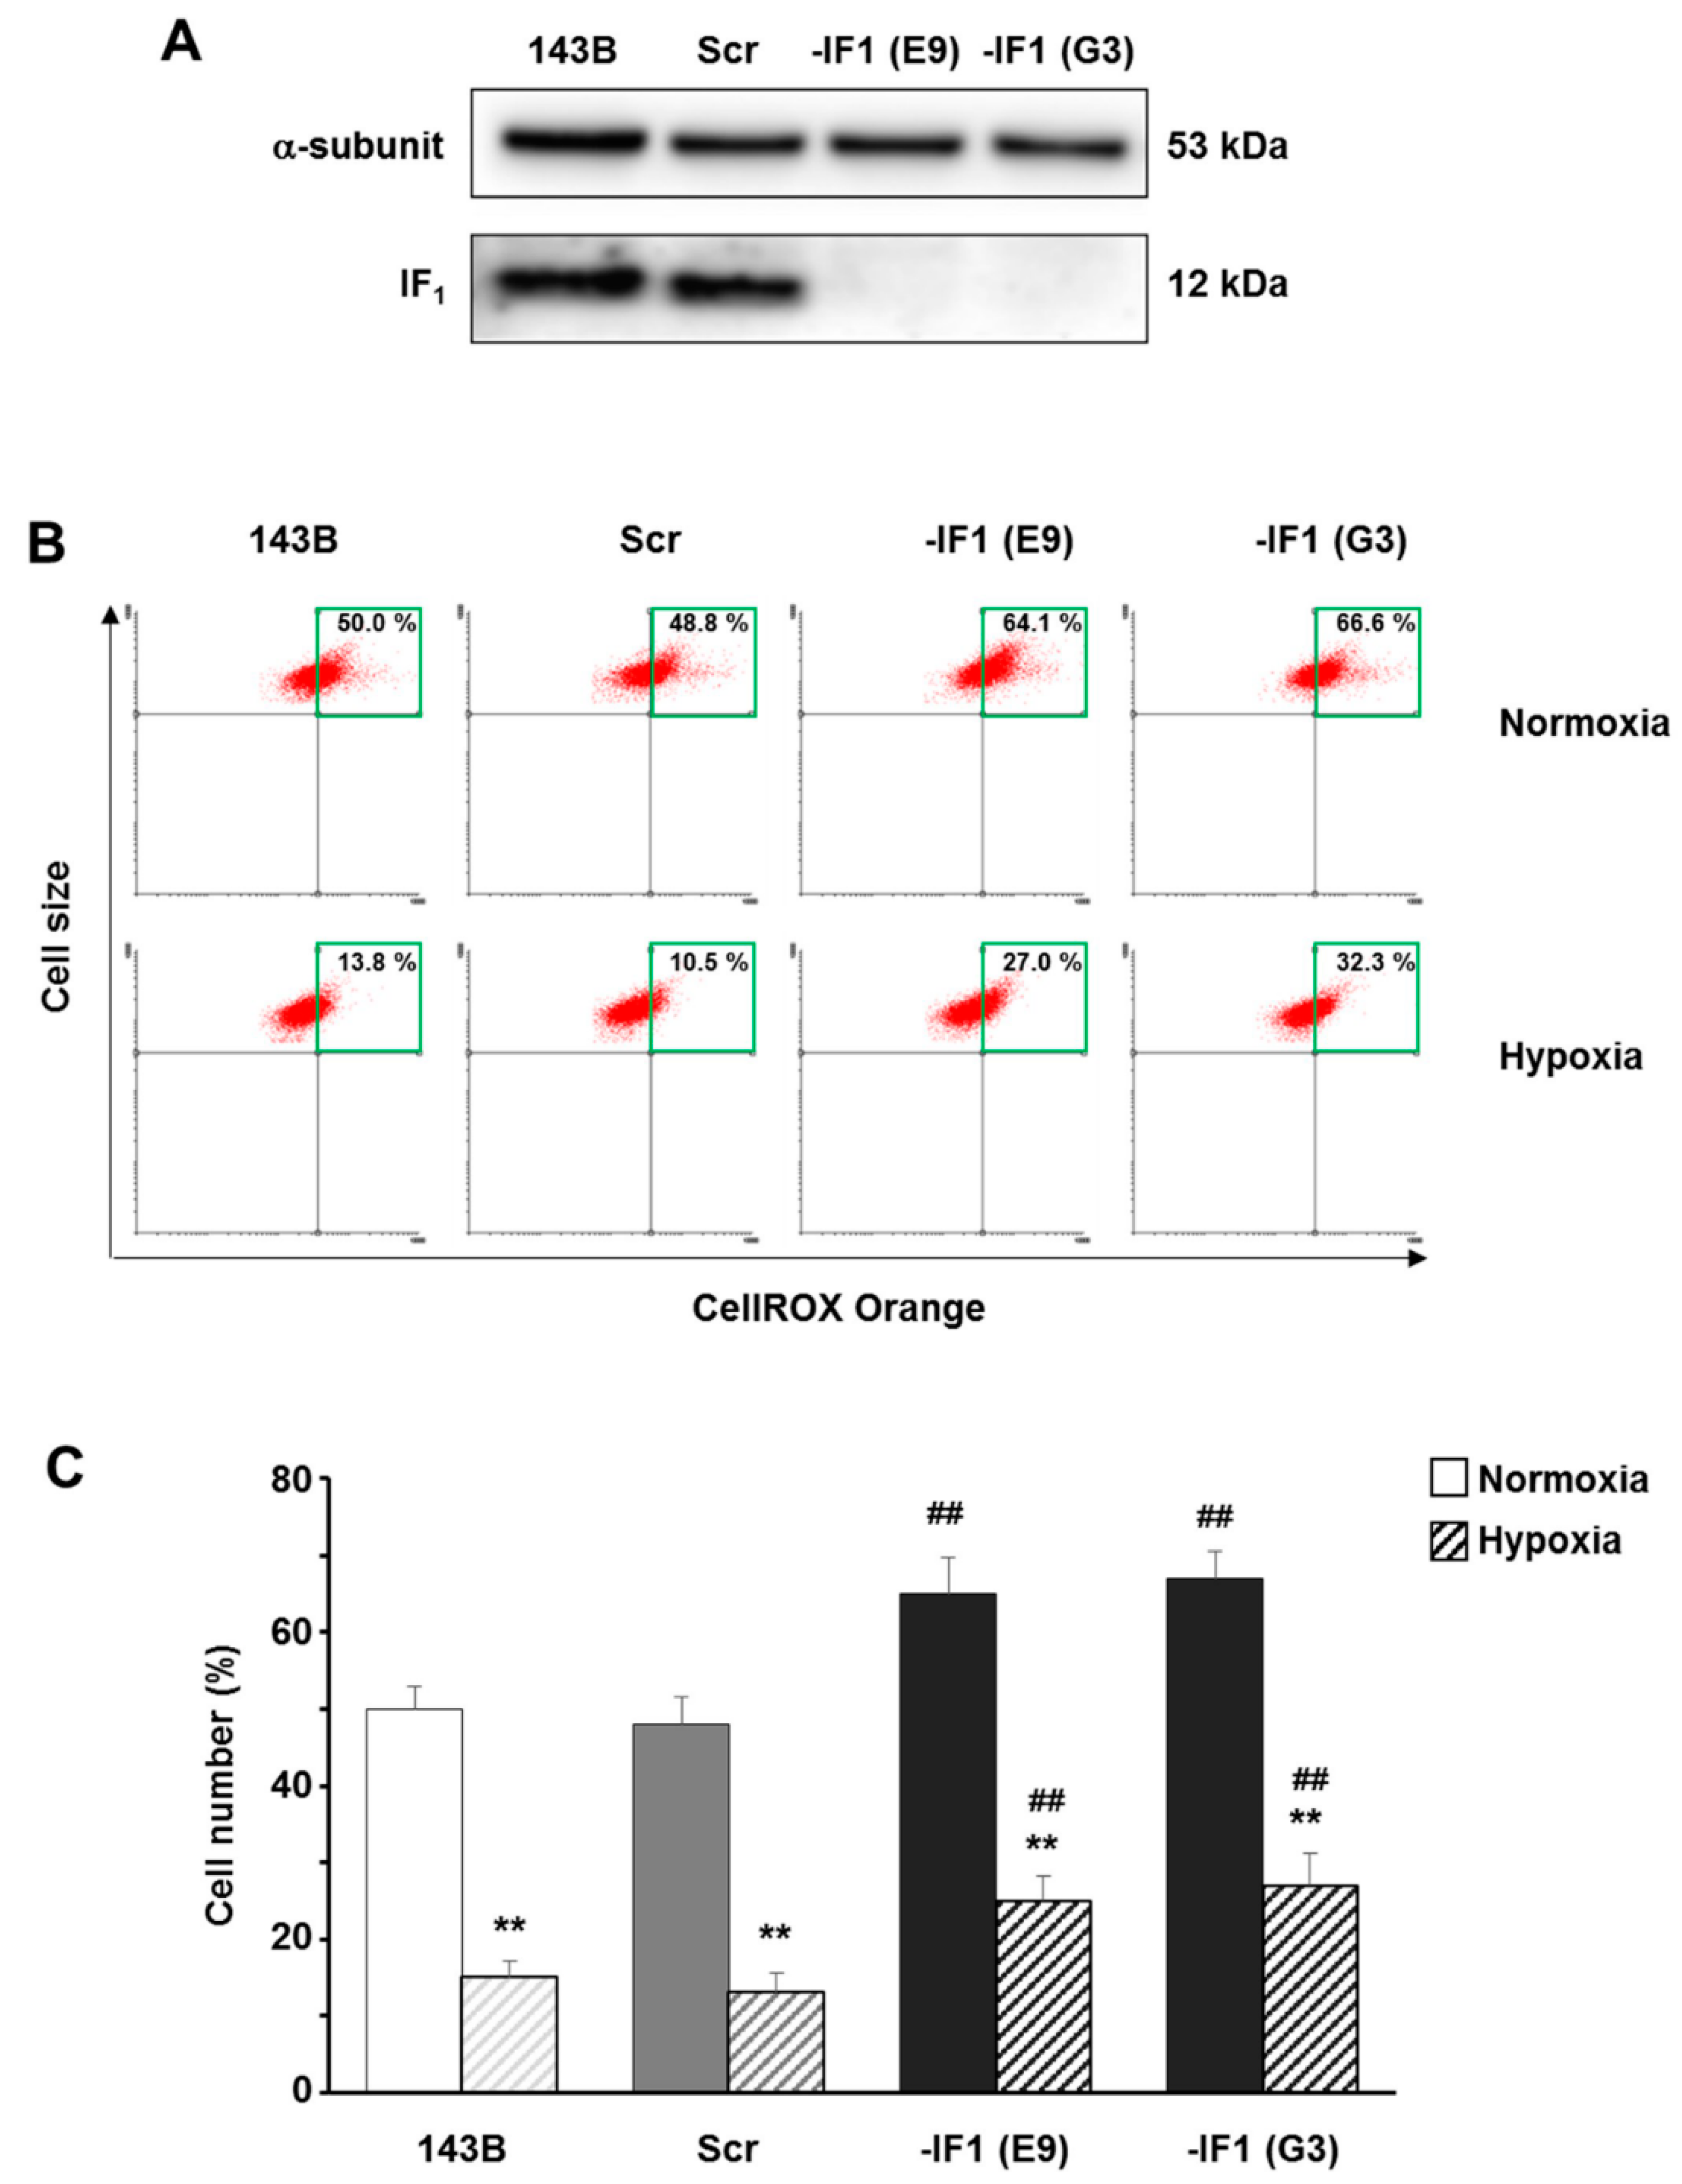
High ROS levels were detected in many types of cancers and were shown to be involved in both tumor development and progression. Moreover, according to recent studies, IF1 has been proposed to play a major role in the metabolic adaptation of cells during neoplastic transformation. Due to the emerging importance of ROS homeostasis and IF1 up-regulation in cancer cells, we hypothesized a putative role of IF1 in the modulation of cellular oxidative status. In order to address this issue, we explored the role of IF1 on the modulation of cellular ROS in both normoxia and hypoxia (0.5% O2) by silencing IF1 in 143 osteosarcoma cells. ROS level changes were assayed by using the CellROX Orange probe in both IF1-expressing cells (143B parental cell line and scrambled clones) and two stably IF1-silenced clones (Figure 4A), obtained as previously described [24]. A significant increase of ROS levels (about 65% top right quadrant cells) was detected in both IF1-silenced clones compared to controls, when cells were cultured at 21% oxygen tension for 24 h (Figure 4B,C). Although we observed a significant ROS content decrease in all types of cells under hypoxia, IF1-silenced clones still displayed higher ROS levels compared to controls.
3.4. IF1 Limited the Superoxide Anion Generation in Osteosarcoma Cells
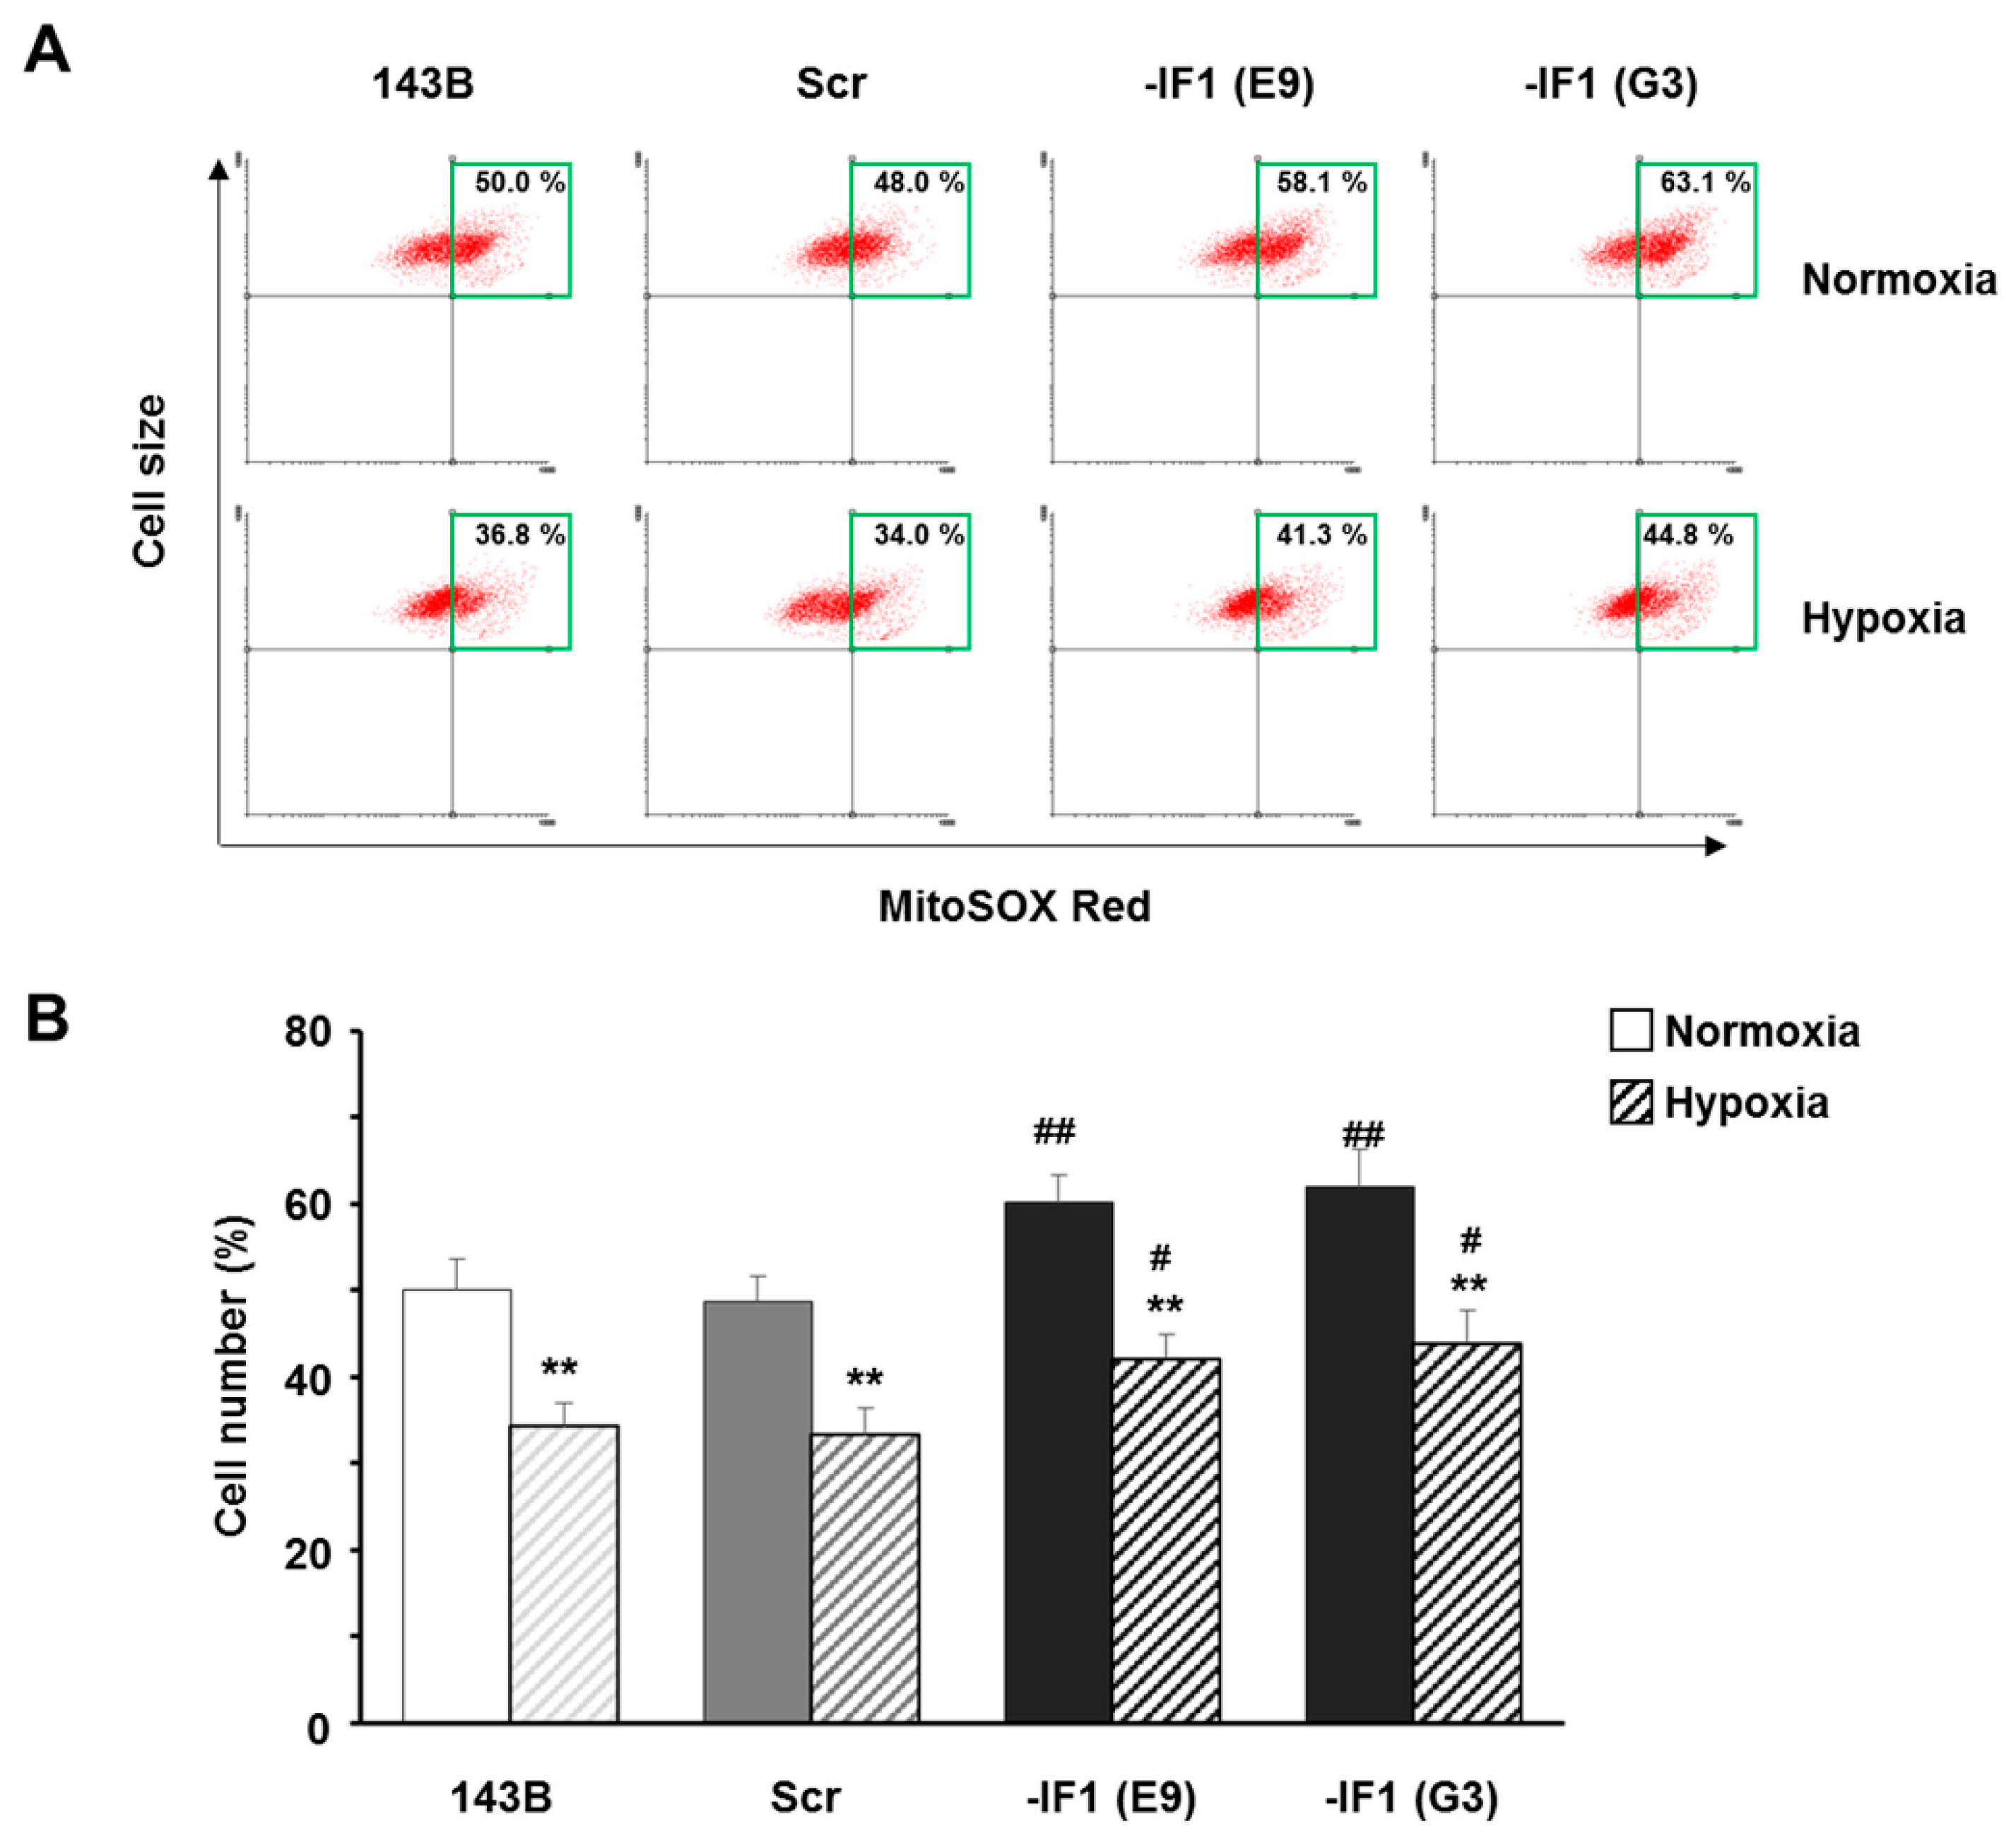
The higher ROS content, assessed in IF1-silenced cells compared to controls in both normoxia and hypoxia, prompted us to investigate whether these changes were associated with a different rate of mitochondrial superoxide anion production. To this aim, we performed experiments by using the specific and sensitive mitochondria-targeted superoxide probe MitoSOX Red [27]. Loading cells with the dye revealed a mild but significant increase of the superoxide anion production in IF1-silenced cells compared to controls, when cells were exposed to either normoxia (about 61 and 50% top right quadrant cells in IF1-silenced and control cells, respectively) or hypoxia (about 43 and 33% top right quadrant cells in IF1 silenced and control cells, respectively) for 24 h (Figure 5B). Furthermore, according to the cell fluorescence distribution parameter the superoxide production rate of all the hypoxic cells was significantly lower compared to normoxia (Figure 5A,B). Incidentally, the mitochondrial superoxide production rate of cells adapted to hypoxia showed a milder decrease compared to the marked drop of ROS content measured with the CellROX Orange probe, suggesting that in transformed cells, the superoxide anion is removed by the SODs quicker than hydrogen peroxide by peroxidases.
4. Discussion
In a hypoxic environment, often found in ageing human tissues and various diseases, mitochondrial metabolism of cells changes due to the alteration of membrane potential, OXPHOS complexes level, and OXPHOS rate, being all factors linked to energy substrates available to cells [9]. These changes certainly affect mitochondrial ROS homeostasis due to different rates of ROS production and/or removal; since ROS are the prevailing oxidants in cells, they are crucial players in determining the redox state of the cells. The latter has to be strictly controlled because it can affect cells [33]. Therefore, to properly design therapeutic interventions against cancer cells, it is of paramount importance to define both cellular level and parameters affecting ROS, considering in particular the oxygen concentrations experienced by that type of cell.
The main result of this study is that 143B osteosarcoma cells exposed to severe hypoxia present steady-state ROS levels lower than in normoxia, substantially behaving as non-transformed cells. We are aware that it is difficult to generalize the results due to the cell type individual response that depends on different levels and activity of endogenous antioxidants and detoxifying enzymes, and the different capabilities of cells to produce ROS through reactions in which oxygen is or is not a substrate. With regard to the osteosarcoma cells, it is well-established that solid tumors experience sharp decreases of O2 tension, due to the distance from the vascularization and the structural abnormalities characterizing the new-generated blood vessels [34]. According to the majority of the work published, ROS levels increase in cancer cells exposed to hypoxia [35], since the decreased O2 availability slows down the electron transport across the mitochondrial complexes, making the electrons able to leak out of the ETC and interact with O2, thus producing ROS [36]. In contrast, we found that when 143B osteosarcoma cells were exposed to 0.5% O2, a condition of severe hypoxia that mimics the very low O2 tension characterizing the most central areas of solid tumors, a substantial decrease of ROS occurred after 20 min. A decrease of the probe incubation time did not show any burst of ROS, in contrast with what was observed by others [19]. A further slight decline of ROS content was detected when cells were exposed to prolonged hypoxia (24 h). This behavior might be due to the 15% decrease of the mitochondrial mass recently observed in the osteosarcoma cells upon 24 h exposure [24]. As a whole, our results support the view that oxygen concentration is one of the main parameters determining ROS levels in cells, confirming our previous observations in normal cells exposed to a milder hypoxic condition [15].
It has been shown that mitochondria increase the production of the superoxide anion radical, a precursor of most other reactive oxygen species, when mitochondria hyperpolarization occurs. There is a general consensus on several reasons causing mitochondrial hyperpolarization, including an impaired activity of either the F1F0-ATPase and/or the Adenine Nucleotide Translocator and/or an impaired organization of the mitochondrial inner membrane, that can influence the redox centers and/or the redox reactions within the respiratory chain [37,38]. In a recent paper [20], we demonstrated that the silencing of the ATP synthase inhibitor factor, IF1, induces an increase of ΔΨm that pushed us to assay the production rate of the superoxide anion radical in mitochondria. We found that in normoxia, the superoxide level was slightly higher in IF1-silenced compared to IF1-expressing cells, as expected in accord with the higher ΔΨm measured in IF1-silenced cells. Surprisingly, in hypoxia, the superoxide level of IF1-silenced compared to IF1-expressing cells was still slightly higher, although ΔΨm of the two cell lines was quite similar. This implies that hypoxic conditions could stimulate mitochondrial superoxide radical production in IF1-silenced cells more than in IF1-expressing cells. The reason for this might be that IF1 deficiency causes an impairment of the mitochondrial cristae ultrastructure [21] to which a diminished OXPHOS super-complex assembly is associated [39], and this in turn can induce higher superoxide production [39,40]. However, the control exerted by IF1 on cellular oxidants is more marked when the whole ROS are assayed, as we did using the CellROX Orange.
5. Conclusions
The present study demonstrated that oxygen tension is one of the main factors affecting cellular ROS levels, and IF1 modulates the interplay between ROS and hypoxia in transformed cells. This might be relevant for the modulation of signaling pathways promoting cell survival, tumor progression, metastasis, and anticancer drug resistance [41,42], and has to be considered when designing innovative therapeutic approaches.
Author Contributions
G.S., G.G., F.L. performed all the experiments and analyzed the data; G.S., A.B. conceived, designed the experiments, and wrote the paper.
Acknowledgments
We are grateful to Fondazione Del Monte di Bologna e Ravenna, Italy; Project “Metabolic modulation of tumor cells adapted to hypoxia” [2015].
Conflicts of Interest
The authors declare no conflict of interest.
References
- Ray, P.D.; Huang, B.W.; Tsuji, Y. Reactive oxygen species (ROS) homeostasis and redox regulation in cellular signaling. Cell. Signal. 2012, 24, 981–990. [Google Scholar] [CrossRef] [PubMed] [Green Version]
- Valko, M.; Rhodes, C.J.; Moncol, J.; Izakovic, M.; Mazur, M. Free radicals, metals and antioxidants in oxidative stress-induced cancer. Chem. Biol. Interact. 2006, 160, 1–40. [Google Scholar] [CrossRef] [PubMed]
- Boveris, A.; Chance, B. The mitochondrial generation of hydrogen peroxide. General properties and effect of hyperbaric oxygen. Biochem. J. 1973, 134, 707–716. [Google Scholar] [CrossRef] [PubMed] [Green Version]
- Solaini, G.; Landi, L.; Pasquali, P.; Rossi, C.A. Protective effect of endogenous coenzyme q on both lipid peroxidation and respiratory chain inactivation induced by an adriamycin-iron complex. Biochem. Biophys. Res. Commun. 1987, 147, 572–580. [Google Scholar] [CrossRef]
- Wu, M.Y.; Yiang, G.T.; Liao, W.T.; Tsai, A.P.; Cheng, Y.L.; Cheng, P.W.; Li, C.Y.; Li, C.J. Current mechanistic concepts in ischemia and reperfusion injury. Cell. Physiol. Biochem. 2018, 46, 1650–1667. [Google Scholar] [CrossRef] [PubMed]
- Lambeth, J.D.; Cheng, G.; Arnold, R.S.; Edens, W.A. Novel homologs of gp91phox. Trends Biochem. Sci. 2000, 25, 459–461. [Google Scholar] [CrossRef]
- Solaini, G.; Baracca, A.; Lenaz, G.; Sgarbi, G. Hypoxia and mitochondrial oxidative metabolism. Biochim. Biophys. Acta 2010, 1797, 1171–1177. [Google Scholar] [CrossRef] [PubMed] [Green Version]
- Semenza, G.L. Oxygen-dependent regulation of mitochondrial respiration by hypoxia-inducible factor 1. Biochem. J. 2007, 405, 1–9. [Google Scholar] [CrossRef] [PubMed] [Green Version]
- Baracca, A.; Sgarbi, G.; Padula, A.; Solaini, G. Glucose plays a main role in human fibroblasts adaptation to hypoxia. Int. J. Biochem. Cell Biol. 2013, 45, 1356–1365. [Google Scholar] [CrossRef] [PubMed]
- Galkin, A.; Abramov, A.Y.; Frakich, N.; Duchen, M.R.; Moncada, S. Lack of oxygen deactivates mitochondrial complex i: Implications for ischemic injury? J. Biol. Chem. 2009, 284, 36055–36061. [Google Scholar] [CrossRef] [PubMed]
- Chandel, N.S.; McClintock, D.S.; Feliciano, C.E.; Wood, T.M.; Melendez, J.A.; Rodriguez, A.M.; Schumacker, P.T. Reactive oxygen species generated at mitochondrial complex III stabilize hypoxia-inducible factor-1alpha during hypoxia: a mechanism of O2 sensing. J. Biol. Chem. 2000, 275, 25130–25138. [Google Scholar] [CrossRef] [PubMed]
- Duranteau, J.; Chandel, N.S.; Kulisz, A.; Shao, Z.; Schumacker, P.T. Intracellular signaling by reactive oxygen species during hypoxia in cardiomyocytes. J. Biol. Chem. 1998, 273, 11619–11624. [Google Scholar] [CrossRef] [PubMed]
- Ferber, E.C.; Peck, B.; Delpuech, O.; Bell, G.P.; East, P.; Schulze, A. FOXO3a regulates reactive oxygen metabolism by inhibiting mitochondrial gene expression. Cell Death Differ. 2012, 19, 968–979. [Google Scholar] [CrossRef] [PubMed]
- Ogunrinu, T.A.; Sontheimer, H. Hypoxia increases the dependence of glioma cells on glutathione. J. Biol. Chem. 2010, 285, 37716–37724. [Google Scholar] [CrossRef] [PubMed]
- Sgarbi, G.; Gorini, G.; Costanzini, A.; Barbato, S.; Solaini, G.; Baracca, A. Hypoxia decreases ROS level in human fibroblasts. Int. J. Biochem. Cell Biol. 2017, 88, 133–144. [Google Scholar] [CrossRef] [PubMed]
- Tuttle, S.W.; Maity, A.; Oprysko, P.R.; Kachur, A.V.; Ayene, I.S.; Biaglow, J.E.; Koch, C.J. Detection of reactive oxygen species via endogenous oxidative pentose phosphate cycle activity in response to oxygen concentration: Implications for the mechanism of HIF-1alpha stabilization under moderate hypoxia. J. Biol. Chem. 2007, 282, 36790–36796. [Google Scholar] [CrossRef] [PubMed]
- Wang, W.; Fang, H.; Groom, L.; Cheng, A.; Zhang, W.; Liu, J.; Wang, X.; Li, K.; Han, P.; Zheng, M.; et al. Superoxide flashes in single mitochondria. Cell 2008, 134, 279–290. [Google Scholar] [CrossRef] [PubMed]
- Waypa, G.B.; Marks, J.D.; Guzy, R.; Mungai, P.T.; Schriewer, J.; Dokic, D.; Schumacker, P.T. Hypoxia triggers subcellular compartmental redox signaling in vascular smooth muscle cells. Circ. Res. 2010, 106, 526–535. [Google Scholar] [CrossRef] [PubMed]
- Hernansanz-Agustin, P.; Izquierdo-Alvarez, A.; Sanchez-Gomez, F.J.; Ramos, E.; Villa-Pina, T.; Lamas, S.; Bogdanova, A.; Martinez-Ruiz, A. Acute hypoxia produces a superoxide burst in cells. Free Radic. Biol. Med. 2014, 71, 146–156. [Google Scholar] [CrossRef] [PubMed] [Green Version]
- Barbato, S.; Sgarbi, G.; Gorini, G.; Baracca, A.; Solaini, G. The inhibitor protein (IF1) of the F1F0-ATPase modulates human osteosarcoma cell bioenergetics. J. Biol. Chem. 2015, 290, 6338–6348. [Google Scholar] [CrossRef] [PubMed]
- Campanella, M.; Casswell, E.; Chong, S.; Farah, Z.; Wieckowski, M.R.; Abramov, A.Y.; Tinker, A.; Duchen, M.R. Regulation of mitochondrial structure and function by the F1Fo-ATPase inhibitor protein, IF1. Cell Metab. 2008, 8, 13–25. [Google Scholar] [CrossRef] [PubMed]
- Fujikawa, M.; Imamura, H.; Nakamura, J.; Yoshida, M. Assessing actual contribution of IF1, inhibitor of mitochondrial F0F1, to ATP homeostasis, cell growth, mitochondrial morphology, and cell viability. J. Biol. Chem. 2012, 287, 18781–18787. [Google Scholar] [CrossRef] [PubMed]
- Sanchez-Cenizo, L.; Formentini, L.; Aldea, M.; Ortega, A.D.; Garcia-Huerta, P.; Sanchez-Arago, M.; Cuezva, J.M. Up-regulation of the ATPase inhibitory factor 1 (IF1) of the mitochondrial H+-ATP synthase in human tumors mediates the metabolic shift of cancer cells to a Warburg phenotype. J. Biol. Chem. 2010, 285, 25308–25313. [Google Scholar] [CrossRef] [PubMed]
- Sgarbi, G.; Barbato, S.; Costanzini, A.; Solaini, G.; Baracca, A. The role of the ATPase inhibitor factor 1 (IF1) in cancer cells adaptation to hypoxia and anoxia. Biochim. Biophys. Acta 2018, 1859, 99–109. [Google Scholar] [CrossRef] [PubMed]
- Kang, T.; Lu, W.; Xu, W.; Anderson, L.; Bacanamwo, M.; Thompson, W.; Chen, Y.E.; Liu, D. Microrna-27 (mir-27) targets prohibitin and impairs adipocyte differentiation and mitochondrial function in human adipose-derived stem cells. J. Biol. Chem. 2013, 288, 34394–34402. [Google Scholar] [CrossRef] [PubMed]
- Sgarbi, G.; Liuzzi, F.; Baracca, A.; Solaini, G. Resveratrol preserves mitochondrial function in a human post-mitotic cell model. J. Nutr. Biochem. 2018, in press. [Google Scholar]
- Wang, Q.; Zou, M.H. Measurement of reactive oxygen species (ROS) and mitochondrial ROS in AMPK knockout mice blood vessels. Methods Mol. Biol. 2018, 1732, 507–517. [Google Scholar] [PubMed]
- Sgarbi, G.; Matarrese, P.; Pinti, M.; Lanzarini, C.; Ascione, B.; Gibellini, L.; Dika, E.; Patrizi, A.; Tommasino, C.; Capri, M.; et al. Mitochondria hyperfusion and elevated autophagic activity are key mechanisms for cellular bioenergetic preservation in centenarians. Aging (Albany NY) 2014, 6, 296–310. [Google Scholar] [CrossRef] [PubMed] [Green Version]
- Sgarbi, G.; Casalena, G.A.; Baracca, A.; Lenaz, G.; DiMauro, S.; Solaini, G. Human NARP mitochondrial mutation metabolism corrected with alpha-ketoglutarate/aspartate: A potential new therapy. Arch. Neurol. 2009, 66, 951–957. [Google Scholar] [CrossRef] [PubMed]
- Bartosz, G. Use of spectroscopic probes for detection of reactive oxygen species. Clin. Chim. Acta 2006, 368, 53–76. [Google Scholar] [CrossRef] [PubMed]
- Kalyanaraman, B.; Darley-Usmar, V.; Davies, K.J.; Dennery, P.A.; Forman, H.J.; Grisham, M.B.; Mann, G.E.; Moore, K.; Roberts, L.J., 2nd; Ischiropoulos, H. Measuring reactive oxygen and nitrogen species with fluorescent probes: challenges and limitations. Free Radic. Biol. Med. 2012, 52, 1–6. [Google Scholar] [CrossRef] [PubMed] [Green Version]
- Oparka, M.; Walczak, J.; Malinska, D.; van Oppen, L.; Szczepanowska, J.; Koopman, W.J.H.; Wieckowski, M.R. Quantifying ros levels using cm-H2DCFDA and hyper. Methods 2016, 109, 3–11. [Google Scholar] [CrossRef] [PubMed]
- Pohl, S.O.; Agostino, M.; Dharmarajan, A.; Pervaiz, S. Cross talk between cellular redox state and the antiapoptotic protein Bcl-2. Antioxid. Redox Signal. 2018. [Google Scholar] [CrossRef] [PubMed]
- Vaupel, P.; Kallinowski, F.; Okunieff, P. Blood flow, oxygen consumption and tissue oxygenation of human tumors. Adv. Exp. Med. Biol. 1990, 277, 895–905. [Google Scholar] [PubMed]
- Liou, G.Y.; Storz, P. Reactive oxygen species in cancer. Free Radic. Res. 2010, 44, 479–496. [Google Scholar] [CrossRef] [PubMed] [Green Version]
- Zhu, X.; Zuo, L. Characterization of oxygen radical formation mechanism at early cardiac ischemia. Cell Death Dis. 2013, 4, e787. [Google Scholar] [CrossRef] [PubMed] [Green Version]
- Boveris, A.; Cadenas, E.; Stoppani, A.O. Role of ubiquinone in the mitochondrial generation of hydrogen peroxide. Biochem. J. 1976, 156, 435–444. [Google Scholar] [CrossRef] [PubMed] [Green Version]
- Lambert, A.J.; Brand, M.D. Superoxide production by NADH:Ubiquinone oxidoreductase (complex I) depends on the pH gradient across the mitochondrial inner membrane. Biochem. J. 2004, 382, 511–517. [Google Scholar] [CrossRef] [PubMed]
- Cogliati, S.; Frezza, C.; Soriano, M.E.; Varanita, T.; Quintana-Cabrera, R.; Corrado, M.; Cipolat, S.; Costa, V.; Casarin, A.; Gomes, L.C.; et al. Mitochondrial cristae shape determines respiratory chain supercomplexes assembly and respiratory efficiency. Cell 2013, 155, 160–171. [Google Scholar] [CrossRef] [PubMed]
- Lenaz, G.; Baracca, A.; Barbero, G.; Bergamini, C.; Dalmonte, M.E.; Del Sole, M.; Faccioli, M.; Falasca, A.; Fato, R.; Genova, M.L.; et al. Mitochondrial respiratory chain super-complex I-III in physiology and pathology. Biochim. Biophys. Acta 2010, 1797, 633–640. [Google Scholar] [CrossRef] [PubMed]
- Catalano, V.; Turdo, A.; Di Franco, S.; Dieli, F.; Todaro, M.; Stassi, G. Tumor and its microenvironment: A synergistic interplay. Semin. Cancer Biol. 2013, 23, 522–532. [Google Scholar] [CrossRef] [PubMed] [Green Version]
- Hughes, V.S.; Wiggins, J.M.; Siemann, D.W. Tumor oxygenation and cancer therapy-then and now. Br. J. Radiol. 2018. [Google Scholar] [CrossRef] [PubMed]
Figure 1.
Validation of ROS detection by CellROX in human fibroblasts. (A) Typical top right quadrant (green-framed) analysis of cell fluorescence distribution as an index of ROS level. CellROX-loaded fibroblasts were analyzed following the exposure to 1 mM NAC or 200 μM Luperox, under both normoxia and hypoxia (6 h). (B) Quantitation of high fluorescent cells as an index of ROS content. (C,D) Fluorescence of CellROX-loaded control cells exposed to 4 h hypoxia followed by 4 h re-oxygenation. Data are means ± SD of three independent experiments, each carried out on four different cell lines. * p ≤ 0.05 and ** p ≤ 0.01 indicate the statistical significance of data compared to basal conditions.

Figure 2.
ROS level in human fibroblasts grown under hypoxia. (A) HIF-1α level determined upon 6 h exposure of fibroblasts to either normoxia or hypoxia. (B) Representative top right quadrant analysis of CellROX-loaded cells maintained in either normoxia or hypoxia (0.5% O2) up to 24 h. (C) Scatter graph showing the time-dependence of cellular ROS level decrease during 24 h hypoxic exposure. Data are means ± SD of three independent experiments, each carried out on four different cell lines. ** p ≤ 0.01 indicates the statistical significance of data compared to normoxia.
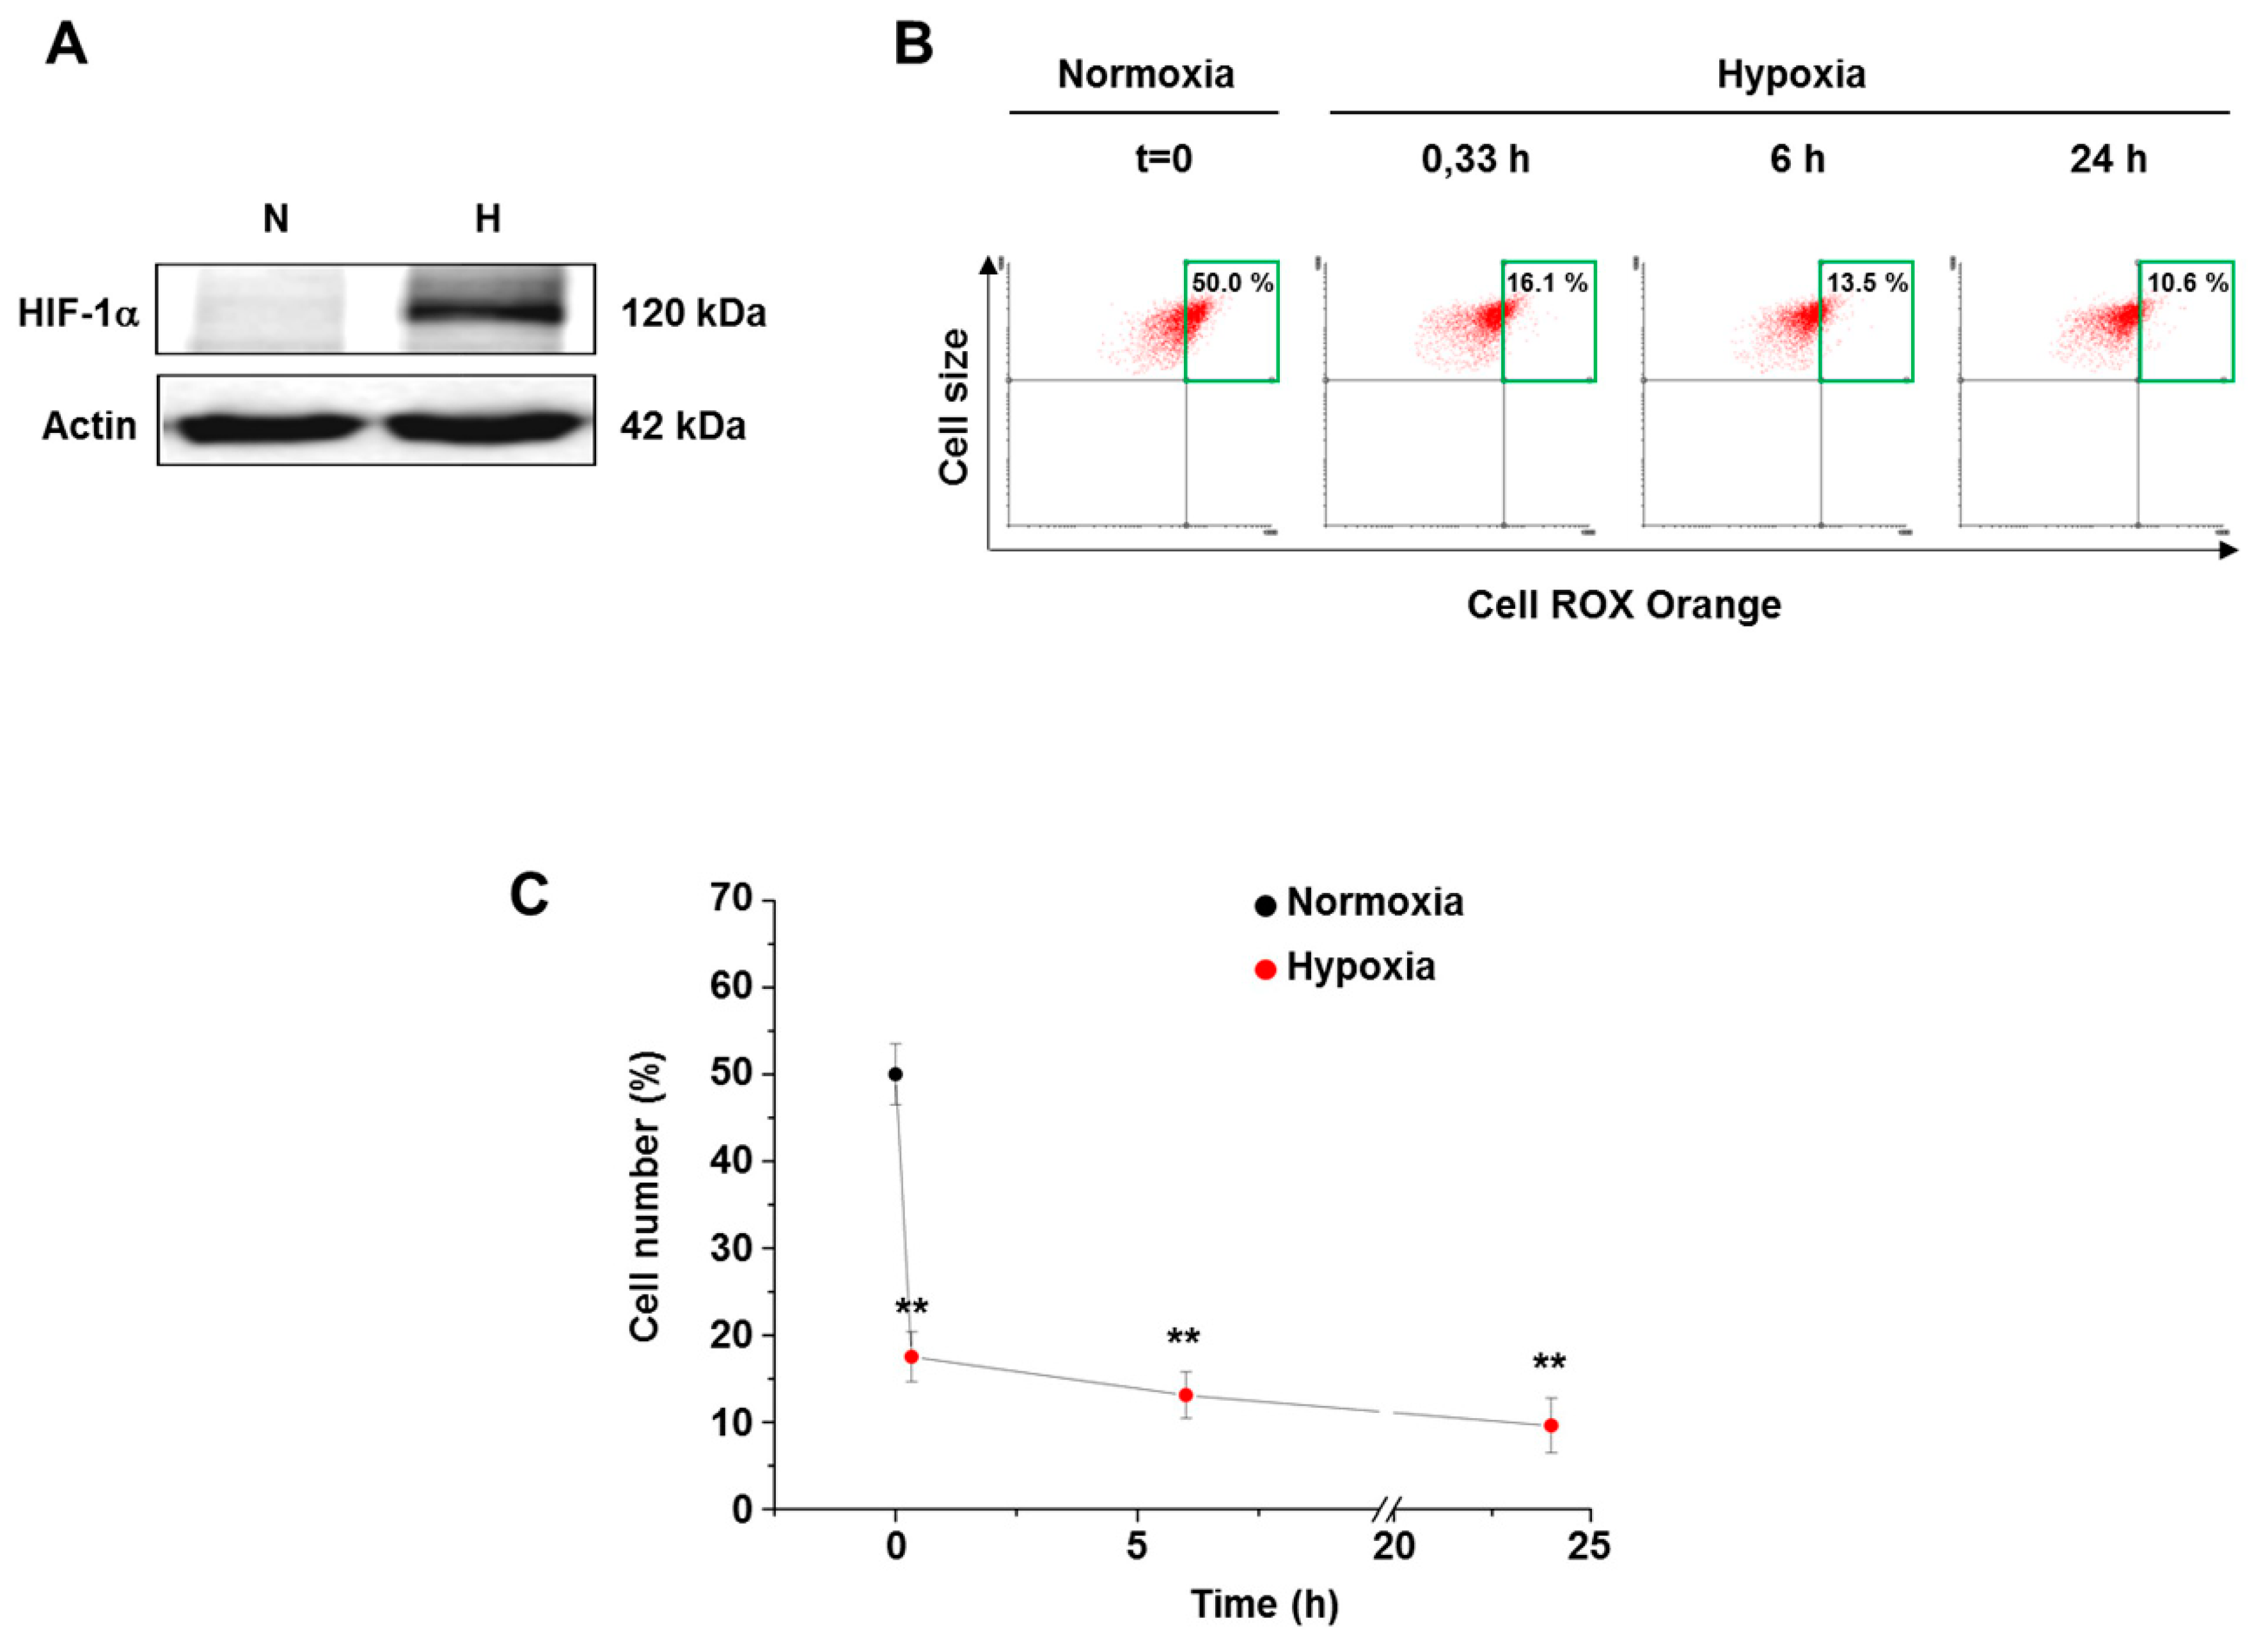
Figure 3.
ROS level in osteosarcoma cells grown under hypoxia. (A) HIF-1α level determined upon 6 h exposure of osteosarcoma cells to either normoxia or hypoxia. (B) Representative top right quadrant analysis of CellROX-loaded cells maintained in either normoxia or hypoxia (0.5% O2 ) up to 24 h. (C) Scatter graph showing the time-dependence of cellular ROS level decrease during 24 h hypoxic exposure. Data are means ± SD of three independent experiments. ** p ≤ 0.01 indicates the statistical significance of data compared to normoxia.

Figure 4.
IF1 affects ROS level in osteosarcoma cells grown under either normoxia or hypoxia. (A) Immunoblot analysis of IF1 protein level in parental cells , scrambled and IF1-silenced clones (E9 and G3). (B) Representative top right quadrant analysis and (C) bars graph of ROS levels measured in all types of CellROX-loaded cells cultured in either normoxia or hypoxia (0.5% O2 ) for 24 h. Data are means ± SD of four independent experiments. ** p ≤ 0.01 and ## p ≤ 0.01 indicate the statistical significance of data compared to normoxia and to controls, respectively.

Figure 5.
IF1 affects superoxide anion production in osteosarcoma cells grown under either normoxia or hypoxia. (A) Representative top right quadrant analysis and (B) bars graph of superoxide anion levels measured in MitoSOX Red-loaded parental (143B), scrambled (Scr) and IF1-silenced (E9 and G3) cells cultured in either normoxia or hypoxia (0.5% O2) for 24 h. Data are means ± SD of four independent experiments. ** p ≤ 0.01, indicates the statistical significance of data compared to normoxia; # p ≤ 0.05 and ## p ≤ 0.01, indicate the statistical significance of data compared to controls.

© 2018 by the authors. Licensee MDPI, Basel, Switzerland. This article is an open access article distributed under the terms and conditions of the Creative Commons Attribution (CC BY) license (http://creativecommons.org/licenses/by/4.0/).
Share and Cite
MDPI and ACS Style
Sgarbi, G.; Gorini, G.; Liuzzi, F.; Solaini, G.; Baracca, A. Hypoxia and IF1 Expression Promote ROS Decrease in Cancer Cells. Cells 2018, 7, 64. https://doi.org/10.3390/cells7070064
AMA Style
Sgarbi G, Gorini G, Liuzzi F, Solaini G, Baracca A. Hypoxia and IF1 Expression Promote ROS Decrease in Cancer Cells. Cells. 2018; 7(7):64. https://doi.org/10.3390/cells7070064
Chicago/Turabian StyleSgarbi, Gianluca, Giulia Gorini, Francesca Liuzzi, Giancarlo Solaini, and Alessandra Baracca. 2018. "Hypoxia and IF1 Expression Promote ROS Decrease in Cancer Cells" Cells 7, no. 7: 64. https://doi.org/10.3390/cells7070064
Note that from the first issue of 2016, this journal uses article numbers instead of page numbers. See further details here.