The Purified Extract from the Medicinal Plant Bacopa monnieri, Bacopaside II, Inhibits Growth of Colon Cancer Cells In Vitro by Inducing Cell Cycle Arrest and Apoptosis

 , , , and
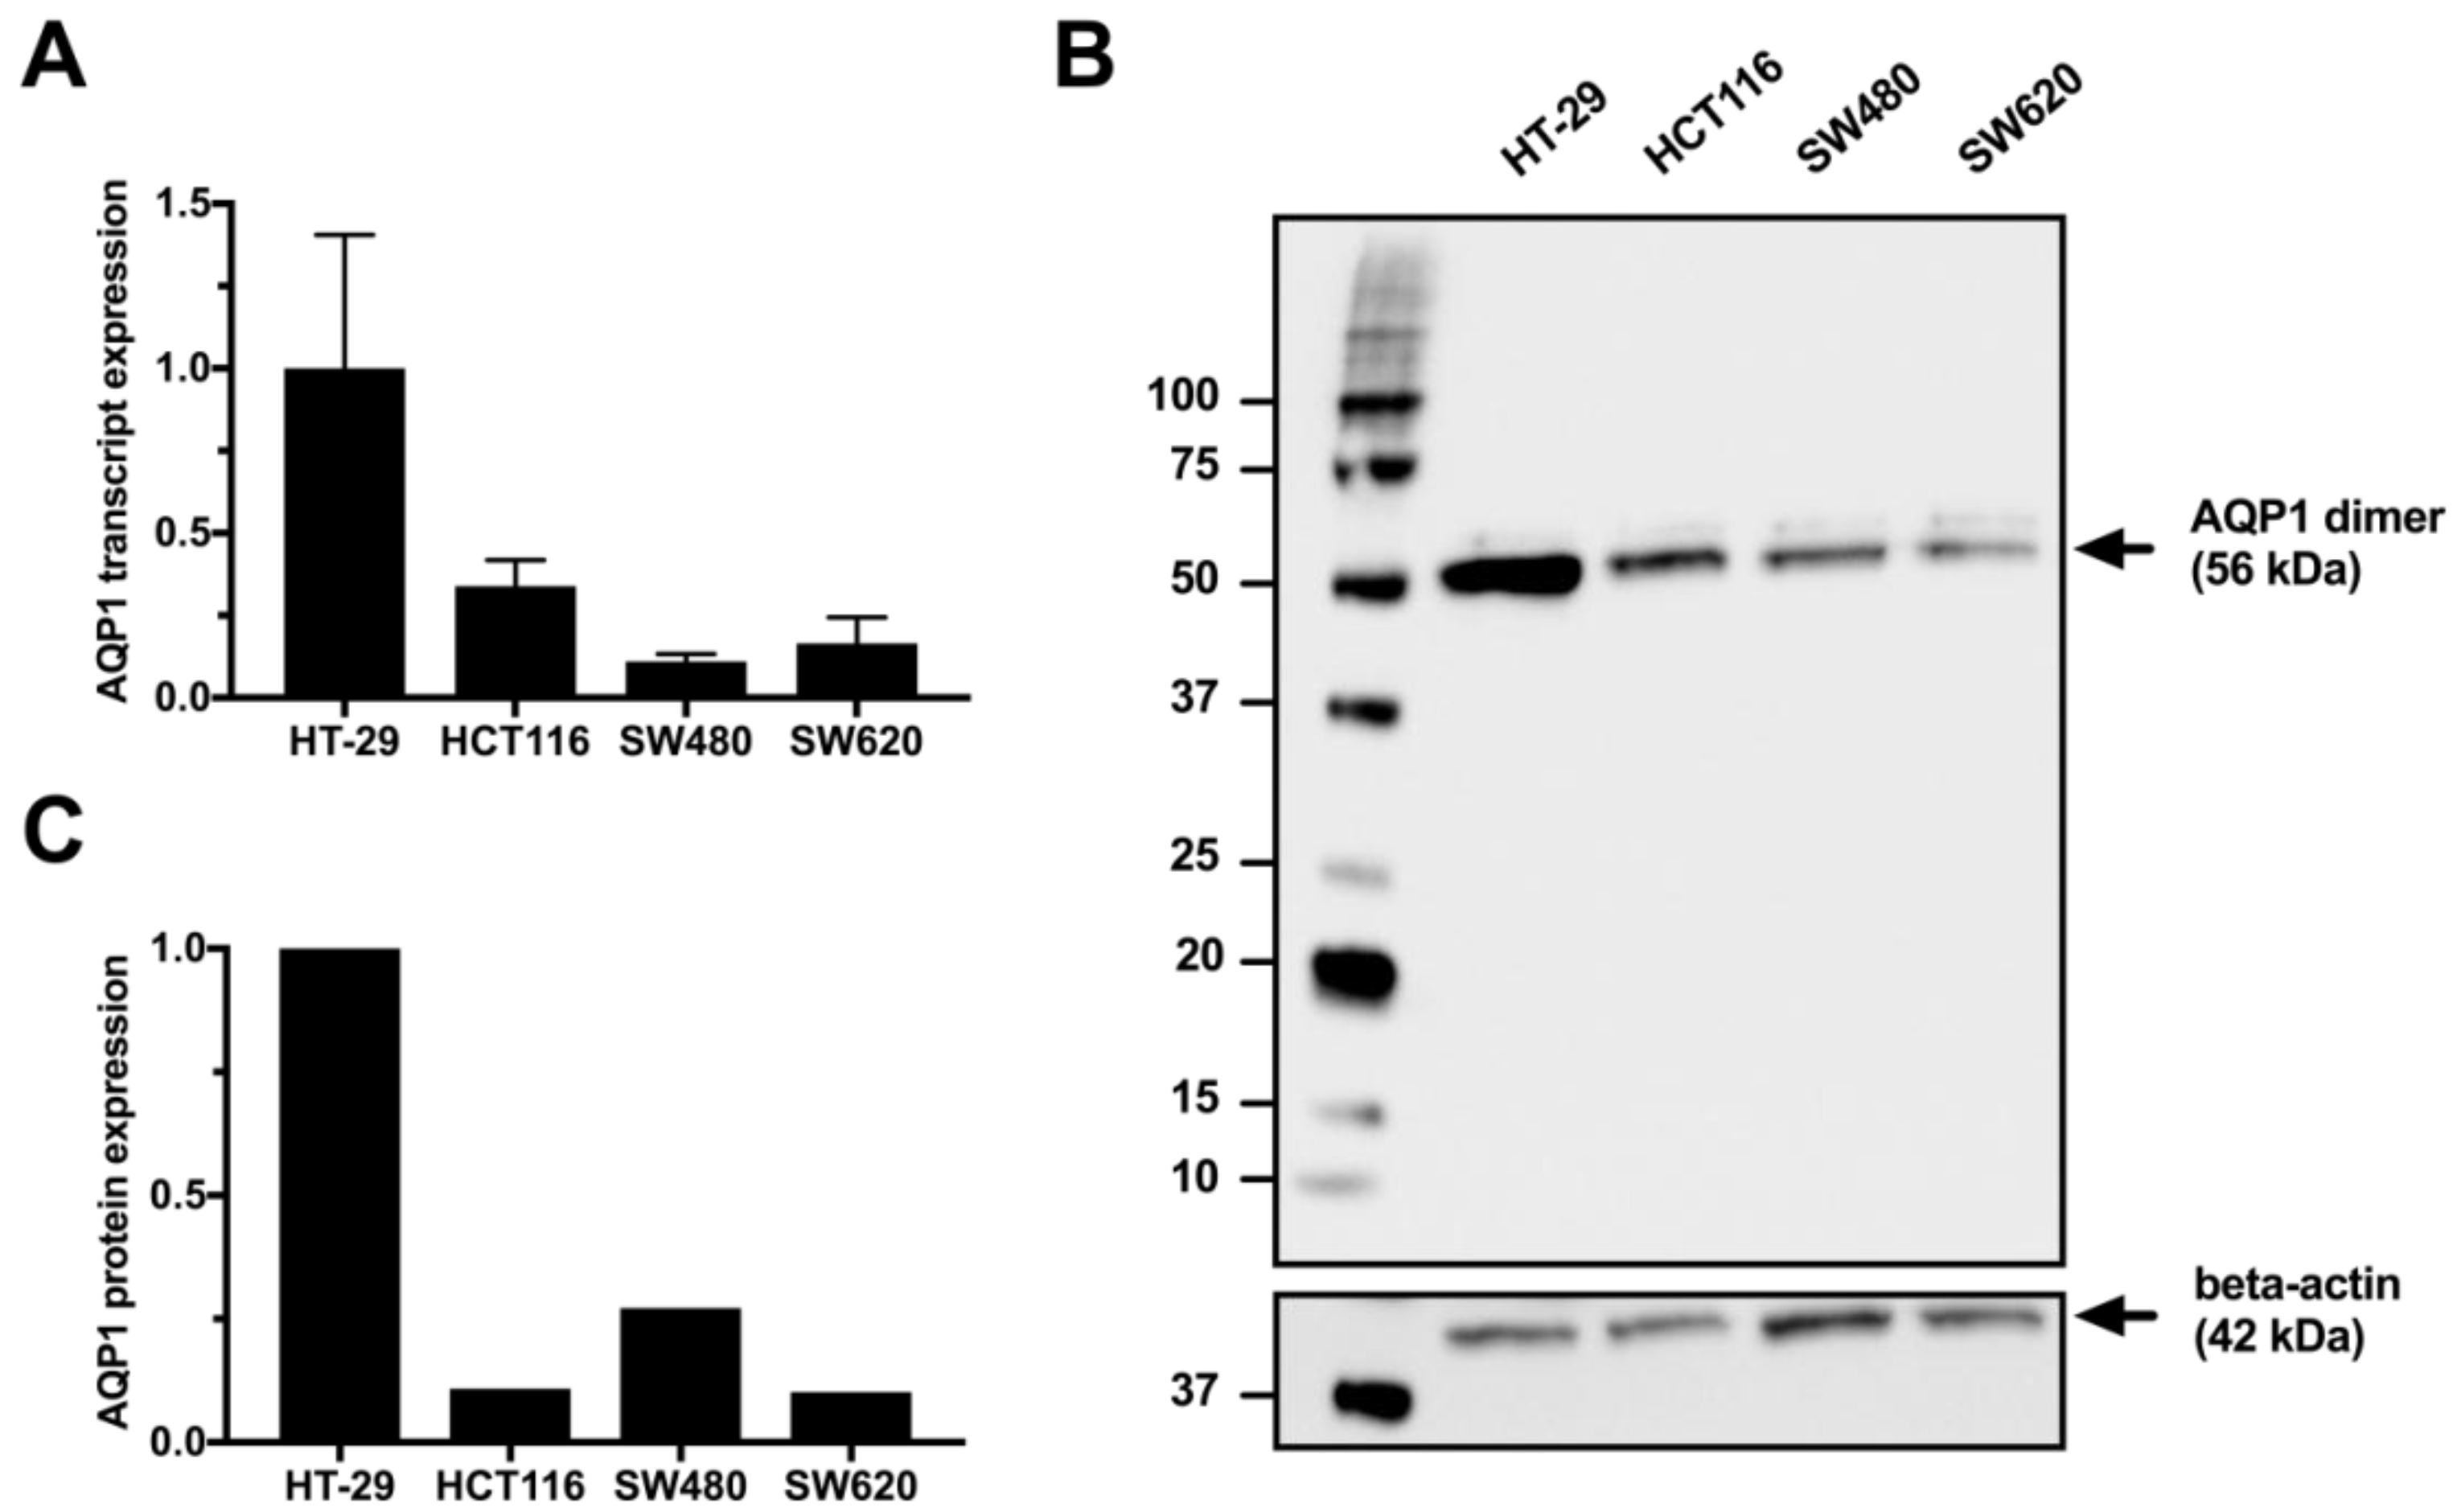
Abstract
:1. Introduction
2. Materials and Methods
2.1. Cell Lines and Culture
2.2. Analysis of AQP1 Expression by Quantitative PCR and by Western Immunoblot
2.3. Cell Growth Assay
2.4. Acridine Orange Staining
2.5. Cell Cycle Analysis by Propidium Iodide Staining
2.6. Apoptosis Assay by Annexin V Propidium Iodide Staining
2.7. Statistical Analysis
3. Results
3.1. Expression of Aquaporin-1 in Colon Cancer Cell Lines
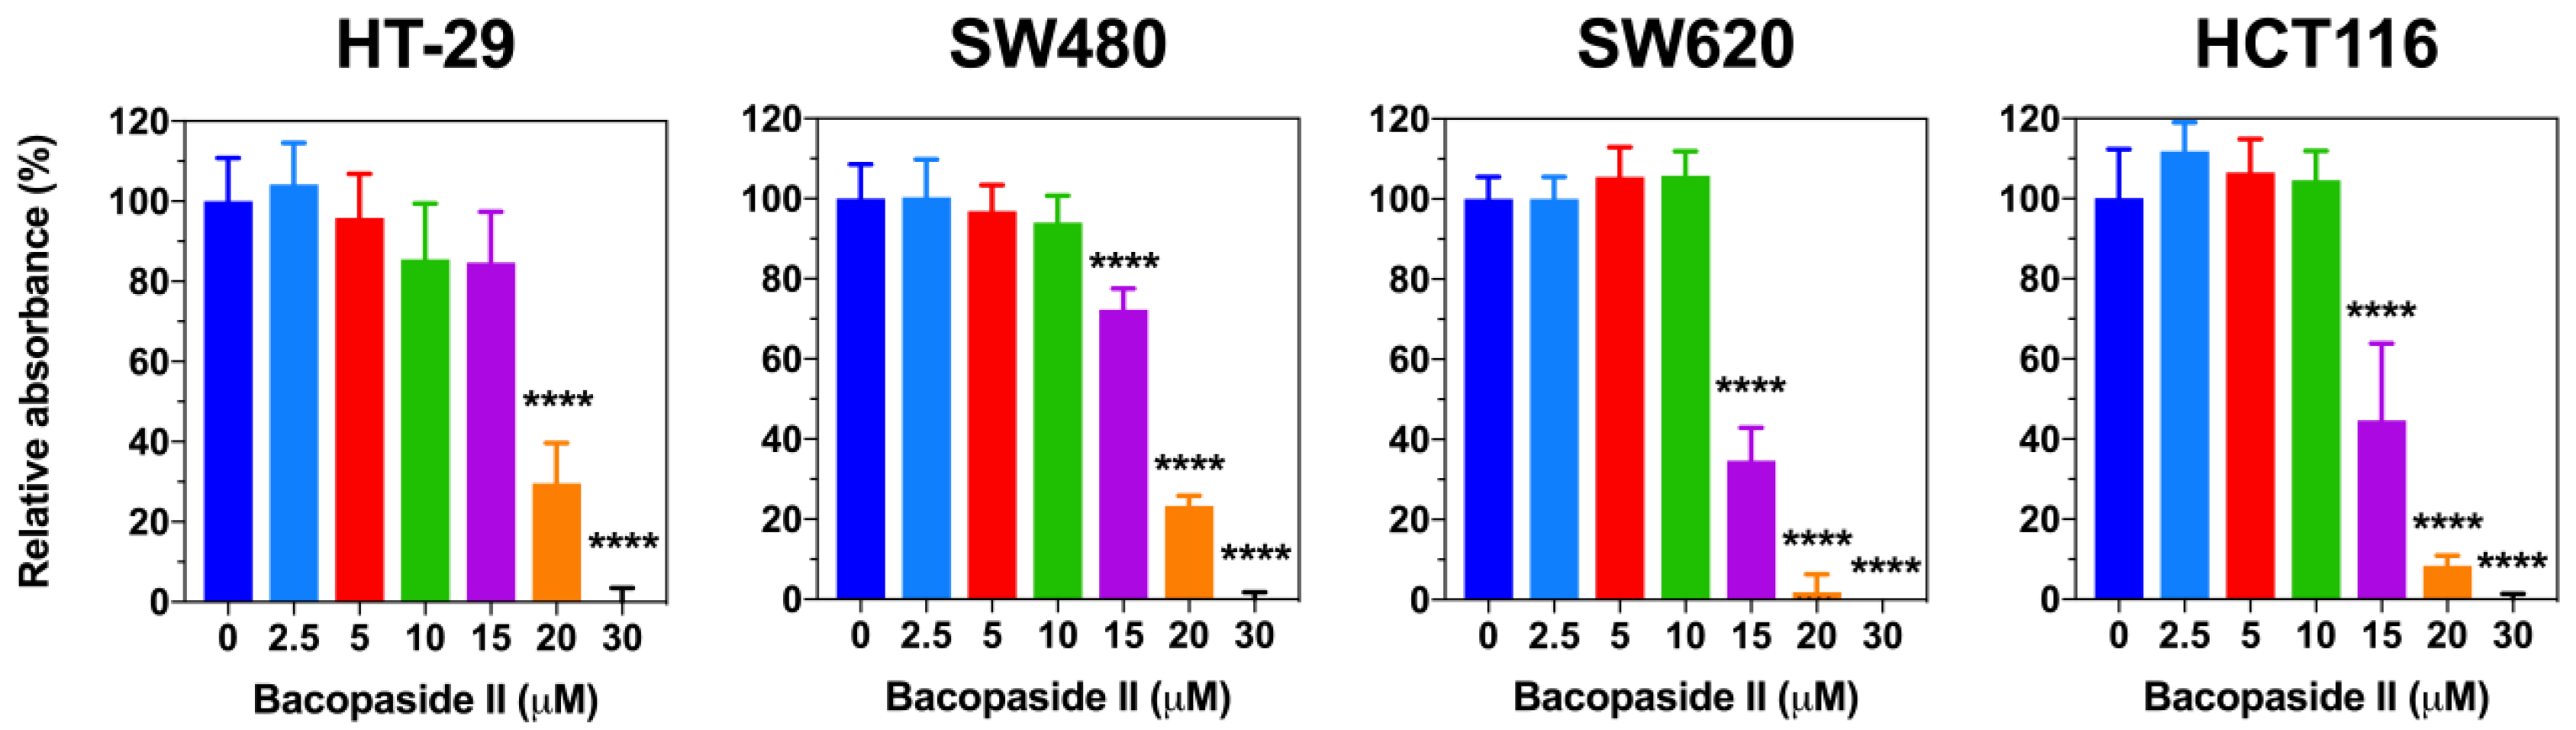
3.2. Bacopaside II Inhibited Colon Cancer Cell Growth
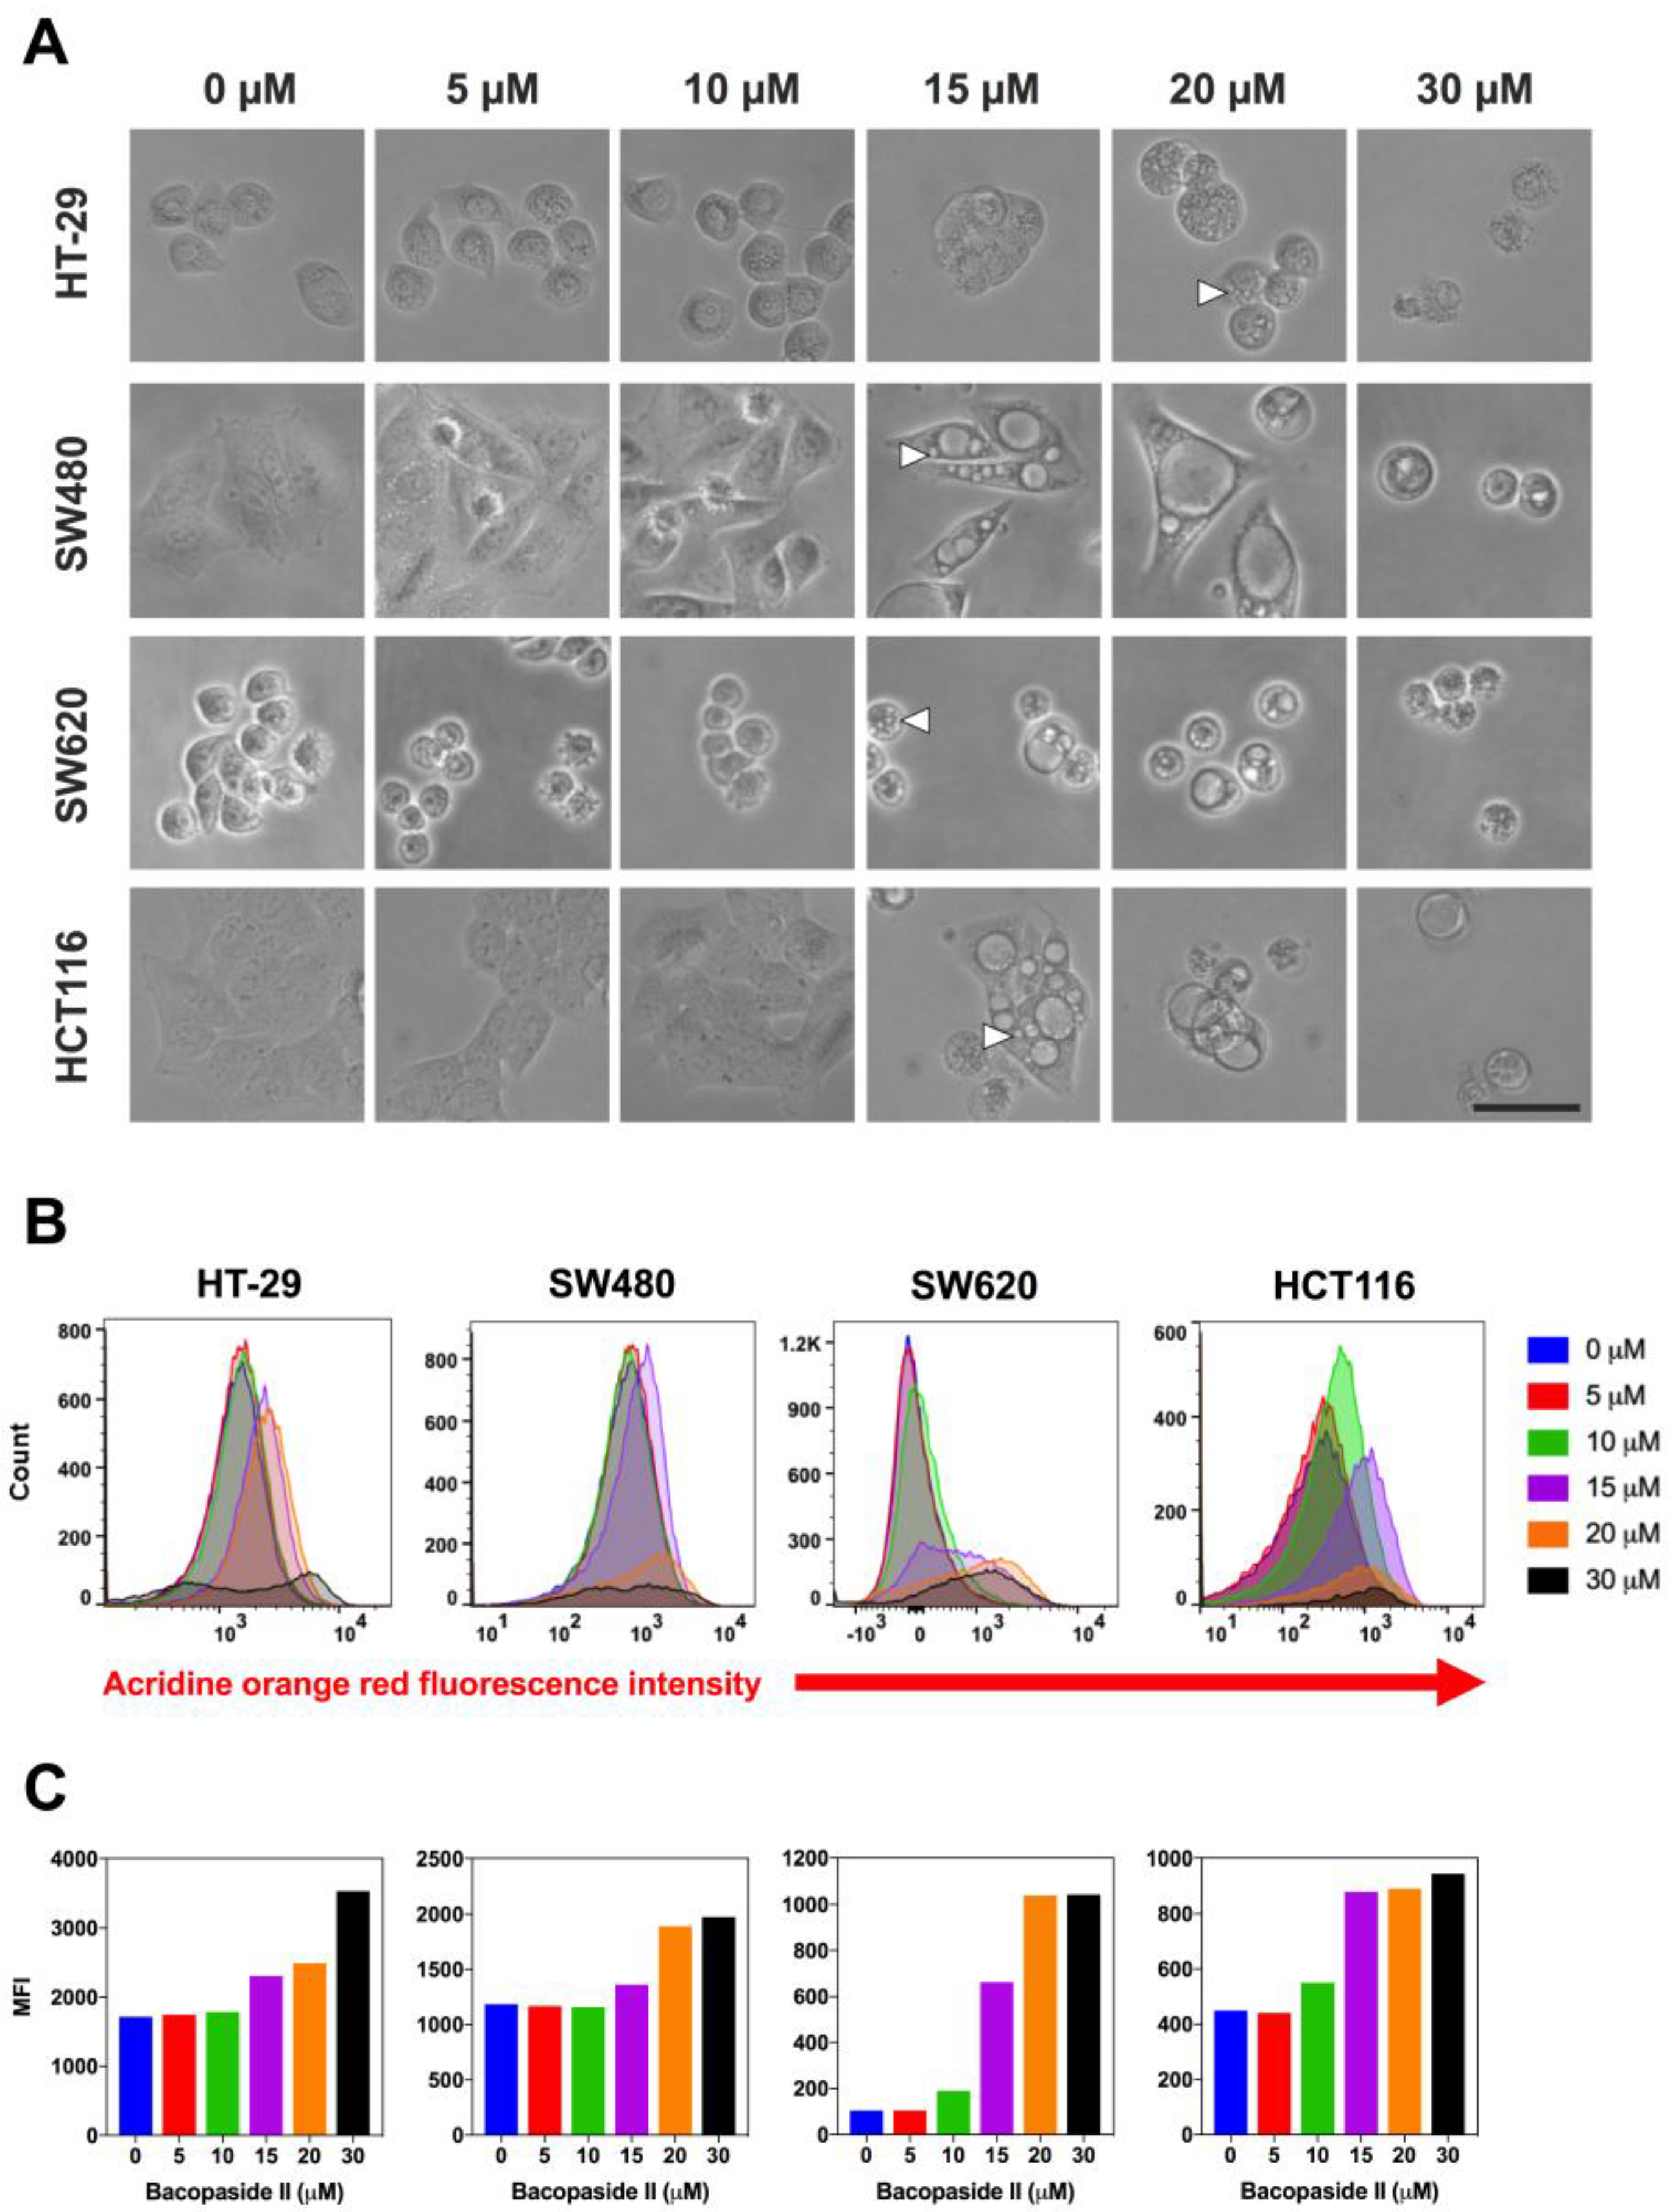
3.3. Bacopaside II Induced Morphological Changes
3.4. Bacopaside II Increased Acridine Orange Staining
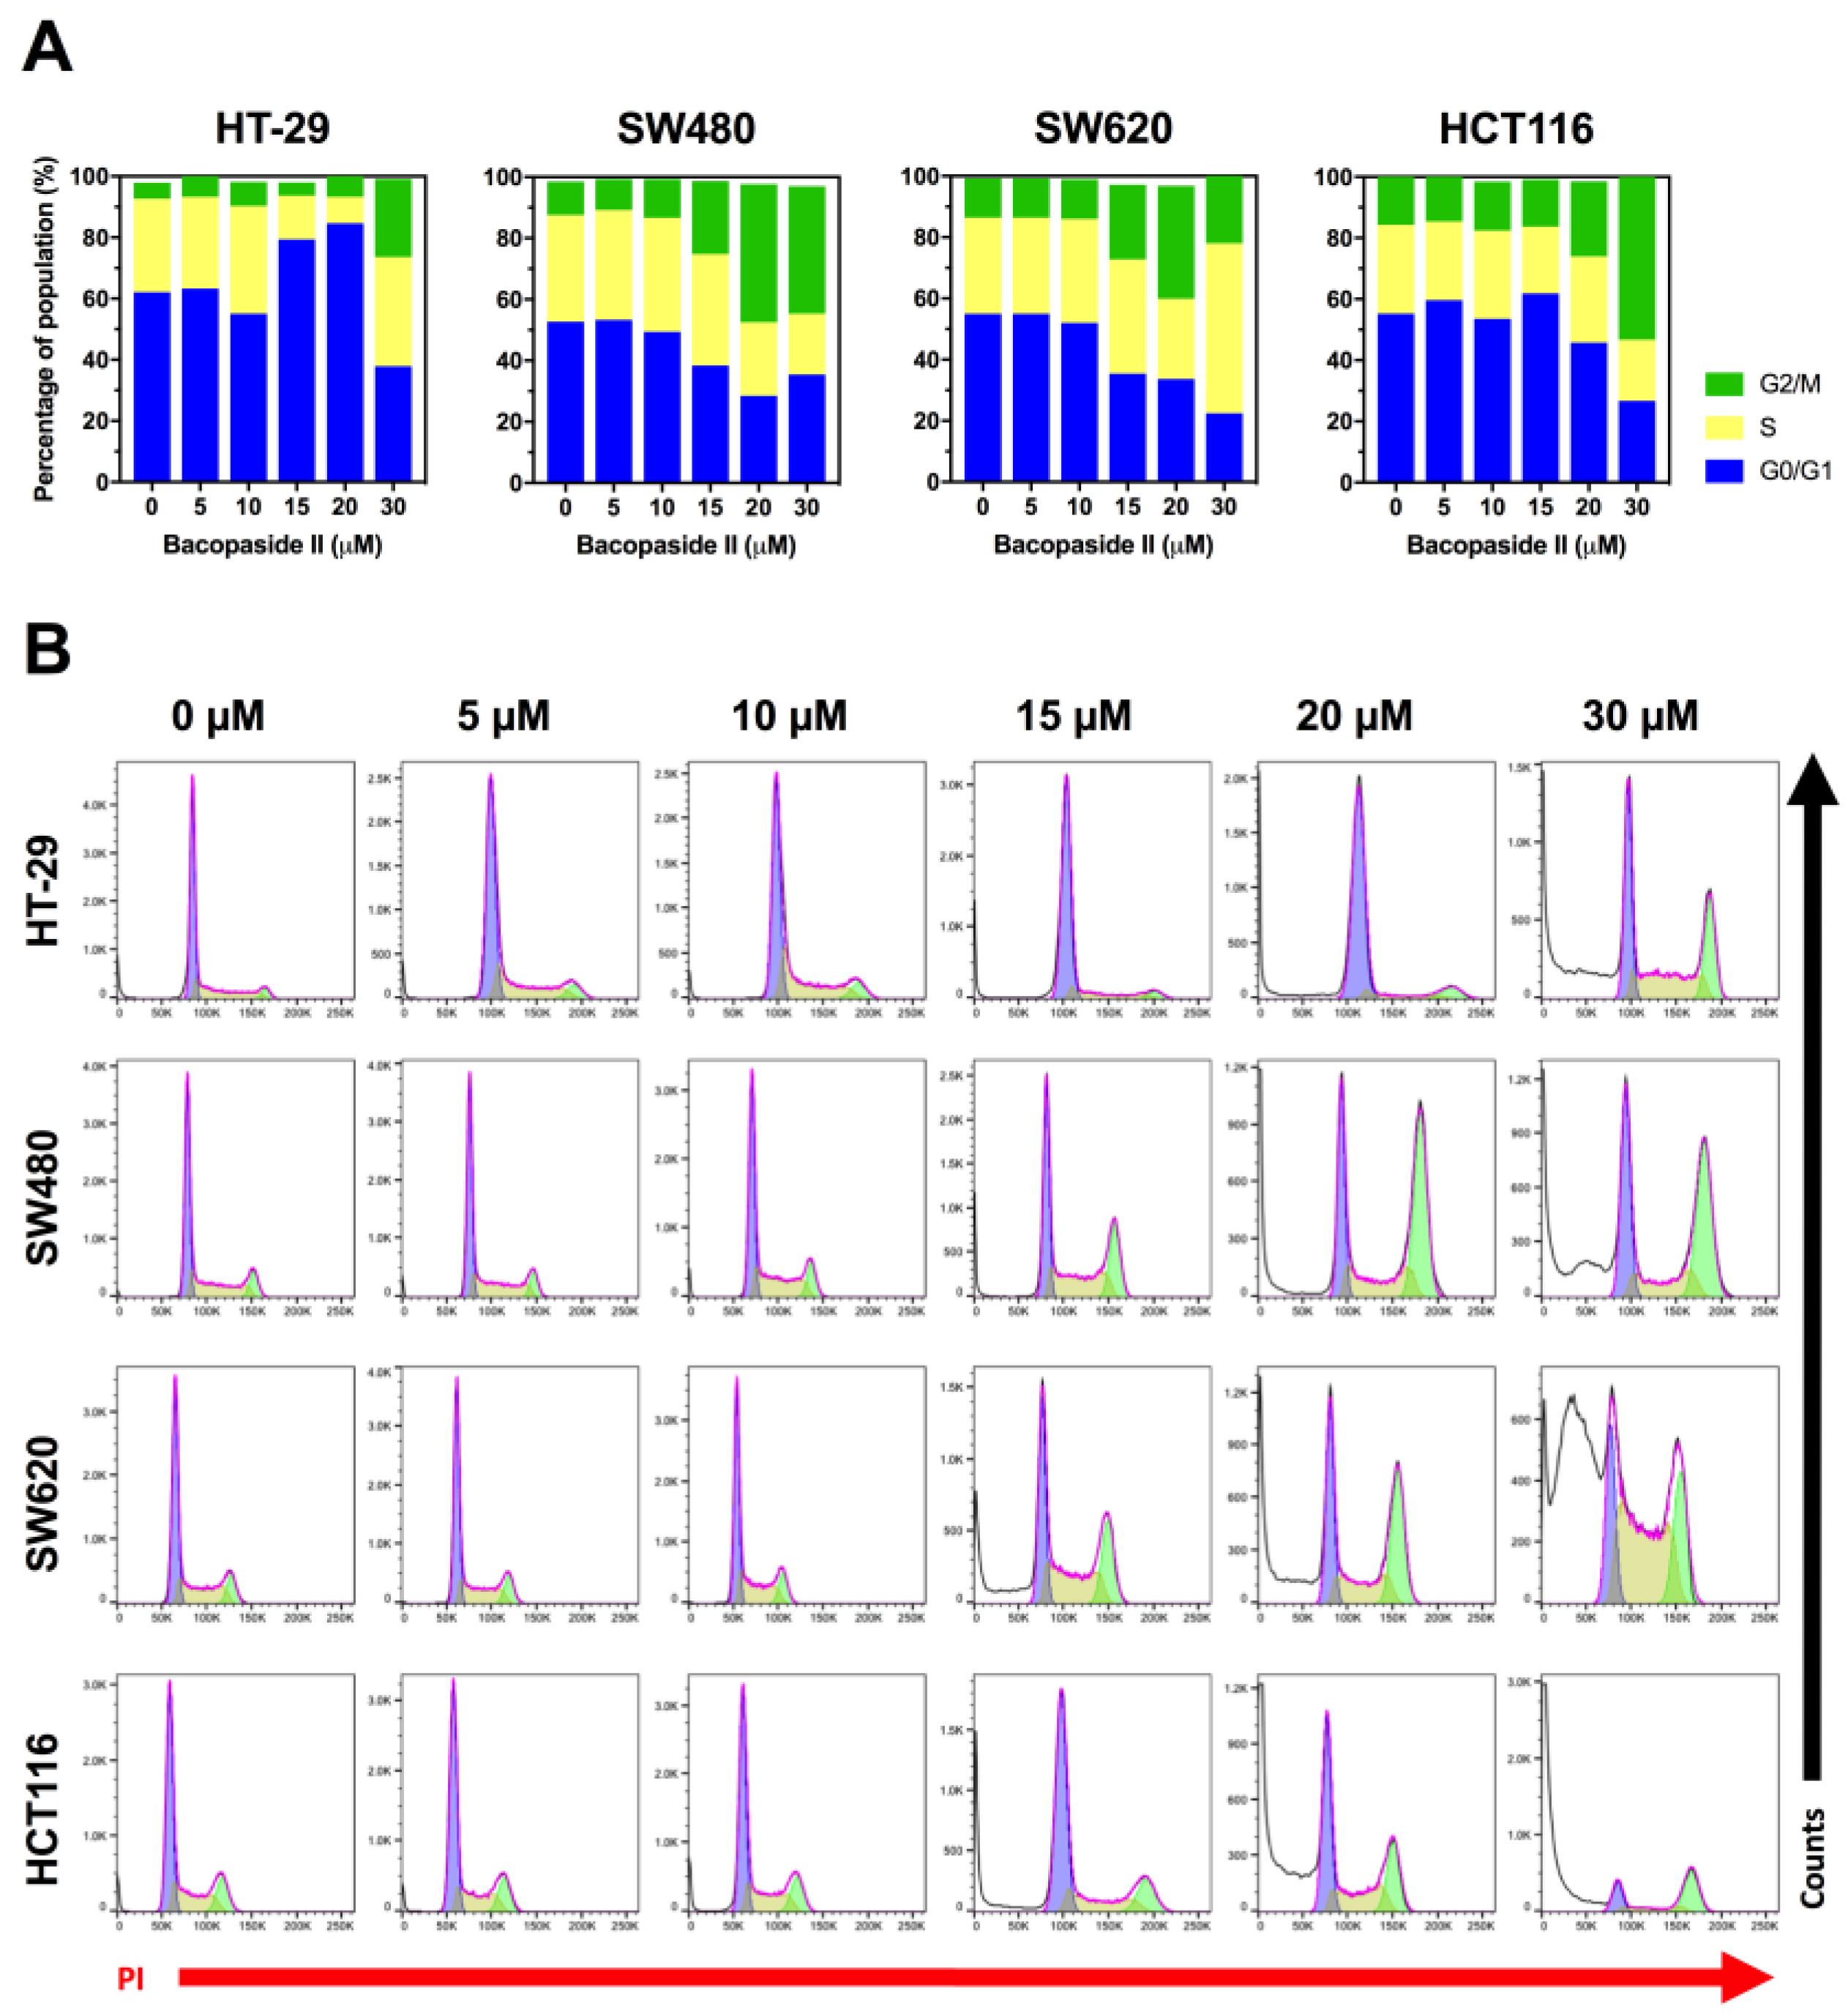
3.5. Bacopaside II Induced Cell Cycle Arrest
3.6. Bacopaside II Induced Apoptosis
4. Discussion
5. Conclusions
Supplementary Materials
Author Contributions
Funding
Conflicts of Interest
References
- Ferlay, J.; Soerjomataram, I.; Dikshit, R.; Eser, S.; Mathers, C.; Rebelo, M.; Parkin, D.M.; Forman, D.; Bray, F. Cancer incidence and mortality worldwide: Sources, methods and major patterns in globocan 2012. Int. J. Cancer 2015, 136, E359–E386. [Google Scholar] [CrossRef] [PubMed]
- Young, P.E.; Womeldorph, C.M.; Johnson, E.K.; Maykel, J.A.; Brucher, B.; Stojadinovic, A.; Avital, I.; Nissan, A.; Steele, S.R. Early detection of colorectal cancer recurrence in patients undergoing surgery with curative intent: Current status and challenges. J. Cancer 2014, 5, 262–271. [Google Scholar] [CrossRef] [PubMed]
- Siegel, R.L.; Miller, K.D.; Fedewa, S.A.; Ahnen, D.J.; Meester, R.G.S.; Barzi, A.; Jemal, A. Colorectal cancer statistics, 2017. CA Cancer J. Clin. 2017, 67, 177–193. [Google Scholar] [CrossRef] [PubMed]
- Van Cutsem, E.; Cervantes, A.; Adam, R.; Sobrero, A.; Van Krieken, J.H.; Aderka, D.; Aranda Aguilar, E.; Bardelli, A.; Benson, A.; Bodoky, G.; et al. Esmo consensus guidelines for the management of patients with metastatic colorectal cancer. Ann. Oncol. 2016, 27, 1386–1422. [Google Scholar] [CrossRef] [PubMed]
- Aguiar, S.; Borowski, T. Neuropharmacological review of the nootropic herb bacopa monnieri. Rejuvenation Res. 2013, 16, 313–326. [Google Scholar] [CrossRef] [PubMed]
- Sivaramakrishna, C.; Rao, C.V.; Trimurtulu, G.; Vanisree, M.; Subbaraju, G.V. Triterpenoid glycosides from bacopa monnieri. Phytochemistry 2005, 66, 2719–2728. [Google Scholar] [CrossRef] [PubMed]
- Garai, S.; Mahato, S.B.; Ohtani, K.; Yamasaki, K. Dammarane-type triterpenoid saponins from bacopa monniera. Phytochemistry 1996, 42, 815–820. [Google Scholar] [CrossRef]
- Chakravarty, A.K.; Sarkar, T.; Nakane, T.; Kawahara, N.; Masuda, K. New phenylethanoid glycosides from bacopa monniera. Chem. Pharm. Bull. (Tokyo) 2002, 50, 1616–1618. [Google Scholar] [CrossRef] [PubMed]
- Zhou, Y.; Shen, Y.H.; Zhang, C.; Su, J.; Liu, R.H.; Zhang, W.D. Triterpene saponins from bacopa monnieri and their antidepressant effects in two mice models. J. Nat. Prod. 2007, 70, 652–655. [Google Scholar] [CrossRef] [PubMed]
- Mallick, M.N.; Khan, W.; Parveen, R.; Ahmad, S.; Sadaf; Najm, M.Z.; Ahmad, I.; Husain, S.A. Exploring the cytotoxic potential of triterpenoids-enriched fraction of bacopa monnieri by implementing in vitro, in vivo, and in silico approaches. Pharmacogn. Mag. 2017, 13, S595–S606. [Google Scholar] [PubMed]
- Mallick, M.N.; Akhtar, M.S.; Najm, M.Z.; Tamboli, E.T.; Ahmad, S.; Husain, S.A. Evaluation of anticancer potential of bacopa monnieri l. Against mcf-7 and mda-mb 231 cell line. J. Pharm. Bioallied Sci. 2015, 7, 325–328. [Google Scholar] [PubMed]
- Pei, J.V.; Kourghi, M.; De Ieso, M.L.; Campbell, E.M.; Dorward, H.S.; Hardingham, J.E.; Yool, A.J. Differential inhibition of water and ion channel activities of mammalian aquaporin-1 by two structurally related bacopaside compounds derived from the medicinal plant bacopa monnieri. Mol. Pharmacol. 2016, 90, 496–507. [Google Scholar] [CrossRef] [PubMed]
- Peng, L.; Zhou, Y.; Kong, D.Y.; Zhang, W.D. Antitumor activities of dammarane triterpene saponins from bacopa monniera. Phytother. Res. 2010, 24, 864–868. [Google Scholar] [PubMed]
- Palethorpe, H.M.; Tomita, Y.; Smith, E.; Pei, J.V.; Townsend, A.R.; Price, T.J.; Young, J.P.; Yool, A.J.; Hardingham, J.E. The aquaporin 1 inhibitor bacopaside II reduces endothelial cell migration and tubulogenesis and induces apoptosis. Int. J. Mol. Sci. 2018, 19, 653. [Google Scholar] [CrossRef] [PubMed]
- Dorward, H.S.; Du, A.; Bruhn, M.A.; Wrin, J.; Pei, J.V.; Evdokiou, A.; Price, T.J.; Yool, A.J.; Hardingham, J.E. Pharmacological blockade of aquaporin-1 water channel by aqb013 restricts migration and invasiveness of colon cancer cells and prevents endothelial tube formation in vitro. J. Exp. Clin. Cancer Res. 2016, 35, 36. [Google Scholar] [CrossRef] [PubMed]
- Smith, E.; Palethorpe, H.M.; Ruszkiewicz, A.R.; Edwards, S.; Leach, D.A.; Underwood, T.J.; Need, E.F.; Drew, P.A. Androgen receptor and androgen-responsive gene fkbp5 are independent prognostic indicators for esophageal adenocarcinoma. Dig. Dis. Sci. 2016, 61, 433–443. [Google Scholar] [CrossRef] [PubMed]
- Fosang, A.J.; Colbran, R.J. Transparency is the key to quality. J. Biol. Chem. 2015, 290, 29692–29694. [Google Scholar] [CrossRef] [PubMed]
- Palethorpe, H.M.; Drew, P.A.; Smith, E. Androgen signaling in esophageal adenocarcinoma cell lines in vitro. Dig. Dis. Sci. 2017, 62, 3402–3414. [Google Scholar] [CrossRef] [PubMed]
- Blanc, L.; Liu, J.; Vidal, M.; Chasis, J.A.; An, X.; Mohandas, N. The water channel aquaporin-1 partitions into exosomes during reticulocyte maturation: Implication for the regulation of cell volume. Blood 2009, 114, 3928–3934. [Google Scholar] [CrossRef] [PubMed]
- Paglin, S.; Hollister, T.; Delohery, T.; Hackett, N.; McMahill, M.; Sphicas, E.; Domingo, D.; Yahalom, J. A novel response of cancer cells to radiation involves autophagy and formation of acidic vesicles. Cancer Res. 2001, 61, 439–444. [Google Scholar] [PubMed]
- Singh, R.; Rachumallu, R.; Bhateria, M.; Panduri, J.; Bhatta, R.S. In vitro effects of standardized extract of bacopa monniera and its five individual active constituents on human p-glycoprotein activity. Xenobiotica 2015, 45, 741–749. [Google Scholar] [CrossRef] [PubMed]
- Das, D.N.; Naik, P.P.; Nayak, A.; Panda, P.K.; Mukhopadhyay, S.; Sinha, N.; Bhutia, S.K. Bacopa monnieri-induced protective autophagy inhibits benzo[a]pyrene-mediated apoptosis. Phytother. Res. 2016, 30, 1794–1801. [Google Scholar] [CrossRef] [PubMed]


© 2018 by the authors. Licensee MDPI, Basel, Switzerland. This article is an open access article distributed under the terms and conditions of the Creative Commons Attribution (CC BY) license (http://creativecommons.org/licenses/by/4.0/).
Share and Cite
Smith, E.; Palethorpe, H.M.; Tomita, Y.; Pei, J.V.; Townsend, A.R.; Price, T.J.; Young, J.P.; Yool, A.J.; Hardingham, J.E. The Purified Extract from the Medicinal Plant Bacopa monnieri, Bacopaside II, Inhibits Growth of Colon Cancer Cells In Vitro by Inducing Cell Cycle Arrest and Apoptosis. Cells 2018, 7, 81. https://doi.org/10.3390/cells7070081
Smith E, Palethorpe HM, Tomita Y, Pei JV, Townsend AR, Price TJ, Young JP, Yool AJ, Hardingham JE. The Purified Extract from the Medicinal Plant Bacopa monnieri, Bacopaside II, Inhibits Growth of Colon Cancer Cells In Vitro by Inducing Cell Cycle Arrest and Apoptosis. Cells. 2018; 7(7):81. https://doi.org/10.3390/cells7070081
Chicago/Turabian StyleSmith, Eric, Helen M. Palethorpe, Yoko Tomita, Jinxin V. Pei, Amanda R. Townsend, Timothy J. Price, Joanne P. Young, Andrea J. Yool, and Jennifer E. Hardingham. 2018. "The Purified Extract from the Medicinal Plant Bacopa monnieri, Bacopaside II, Inhibits Growth of Colon Cancer Cells In Vitro by Inducing Cell Cycle Arrest and Apoptosis" Cells 7, no. 7: 81. https://doi.org/10.3390/cells7070081