Article

Expression of the Y-Encoded TSPY is Associated with Progression of Prostate Cancer

1
Division of Cell and Developmental Genetics, Department of Medicine, VA Medical Center, University of California, San Francisco, CA 94121, USA
2
Department of Urology, Hirosaki University School of Medicine, Hirosaki 036-8562, Japan
*
Author to whom correspondence should be addressed.
Genes 2010, 1(2), 283-293; https://doi.org/10.3390/genes1020283
Submission received: 9 August 2010 / Revised: 1 September 2010 / Accepted: 2 September 2010 / Published: 14 September 2010
(This article belongs to the Special Issue The TSPY Gene Family)

Abstract

:
TSPY is a Y-encoded gene that is expressed in normal testicular germ cells and various cancer types including germ cell tumor, melanoma, hepatocellular carcinoma, and prostate cancer. Currently, the correlation between TSPY expression and oncogenic development has not been established, particularly in somatic cancers. To establish such correlation, we analyzed the expression of TSPY, in reference to its interactive oncoprotein, EEF1A, tumor biomarker, AMACR, and normal basal cell biomarker, p63, in 41 cases of clinical prostate cancers (CPCa), 17 cases of latent prostate cancers (LPCa), and 19 cases of non-cancerous prostate (control) by immunohistochemistry. Our results show that TSPY was detected more frequently (78%) in the clinical prostate cancer specimens than those of latent prostate cancer (47%) and control (50%). In the latent cancer group, the levels of TSPY expression could be correlated with increasing Gleason grades. TSPY expression was detected in seven out of nine high-grade latent cancer samples (Gleason 7 and more). The expression of the TSPY binding partner EEF1A was detectable in all prostate specimens, but the levels were higher in cancer cells in clinical and latent prostate cancer specimens than normal prostatic cells. These observations suggest that expressions of TSPY and its binding partner EEF1A are associated with the development and progression of prostate cancer.

1. Introduction

TSPY is a Y-chromosome located and tandemly repeated gene, normally expressed in the germ cells of both adult and fetal testes [1,2,3,4]. It has been postulated to serve vital functions in male germ cell development and spermatogenesis. The TSPY gene cluster has been mapped to the critical region harboring the gonadoblastoma locus on the human Y chromosome (GBY), which predisposes the dysgenetic gonads of sex-reversed female and intersex patients to develop gonadoblastoma [5,6,7]. Indeed, TSPY is expressed abundantly in gonadoblastoma and numerous types of testicular germ cell tumors, e.g., seminoma and carcinoma in situ/intratubular germ cell neoplasia unclassified (CIS/ITGCNU) [4,8,9]. In addition to germ cell tumors, various somatic cancers including melanoma and hepatocellular carcinoma also express TSPY at significantly high levels, suggesting that TSPY is a cancer/testis (CT)-antigen involved in human oncogenesis [10,11]. The CT-antigens, whose expression are restricted in normal testicular germ cells and in different types of tumors, have been considered as tumor markers and promoted as target molecules for cancer vaccines [12,13]. However, only a few CT-antigens have been detected in prostate cancer [12]. We previously demonstrated that TSPY was strongly expressed in prostate cancer cells [14]. Consistently with this, it was demonstrated that TSPY expression increased in late stages of tumor progression in an independent study with the metastatic prostate cancer LNCaP cell lines [15]. Since prostate cancer involves multiple alteration of gene expression at different stages [16,17,18,19], establishing a correlation between TSPY expression and prostate cancer progression in prostate cancer specimens is crucial to understand its involvement in the initiation and progression of prostate cancer.
TSPY is a member of TSPY/SET/NAP-1 superfamily, and shares a highly conserved NAP/SET domain with other members [20]. Members of this protein family interact with various binding partners, e.g. histones and cyclin B [21,22] via their NAP/SET domains. Recently, we identified the eukaryotic elongation factor 1A (EEF1A), a putative oncoprotein, as a novel binding partner for TSPY [23]. EEF1As are encoded by two separate genes designated as EEF1A1 and EEF1A2, located on human chromosome 6q and chromosome 20q, respectively. These isoforms share >90% sequence identity at the protein level and could serve essentially the same or similar functions in protein synthesis [24]. In addition to their roles in protein translation, EEF1As are involved in various cellular functions including cell signaling and transcriptional regulation [25,26,27]. The expression levels and activities of EEF1A are correlated with cell survival and proliferation [28,29,30]. Both EEF1A genes have been postulated to be oncogenes involved in various types of cancer [27]. In particular, EEF1A2 is amplified in 25% of primary ovarian tumors and is expressed abundantly in breast cancer and lung adenocarcinoma, suggesting that it could play an important role in oncogenesis in these types of cancers [31,32,33]. We previously showed that TSPY and EEF1A were co-expressed strongly in the testicular germ cell tumor cells, and demonstrated that TSPY stimulated the expression of a co-transfected reporter gene [23]. Hence, TSPY and EEF1A could synergistically exert oncogenic functions by stimulating gene expression via enhancement in both protein synthesis and gene transcription.
In the present study, we evaluated the expression of TSPY and EEF1A, with references to prostatic tumor and normal basal cell biomarkers, among non-cancer prostate (control), latent prostate cancer (LPCa) and clinical prostate cancer (CPCa) using immunohistochemistry and specific antibodies against TSPY and EEF1A. Our results suggest that expression of both TSPY and EEF1A could be correlated with oncogenic development and progression in both latent and clinical prostate cancers.

2. Results and Discussion

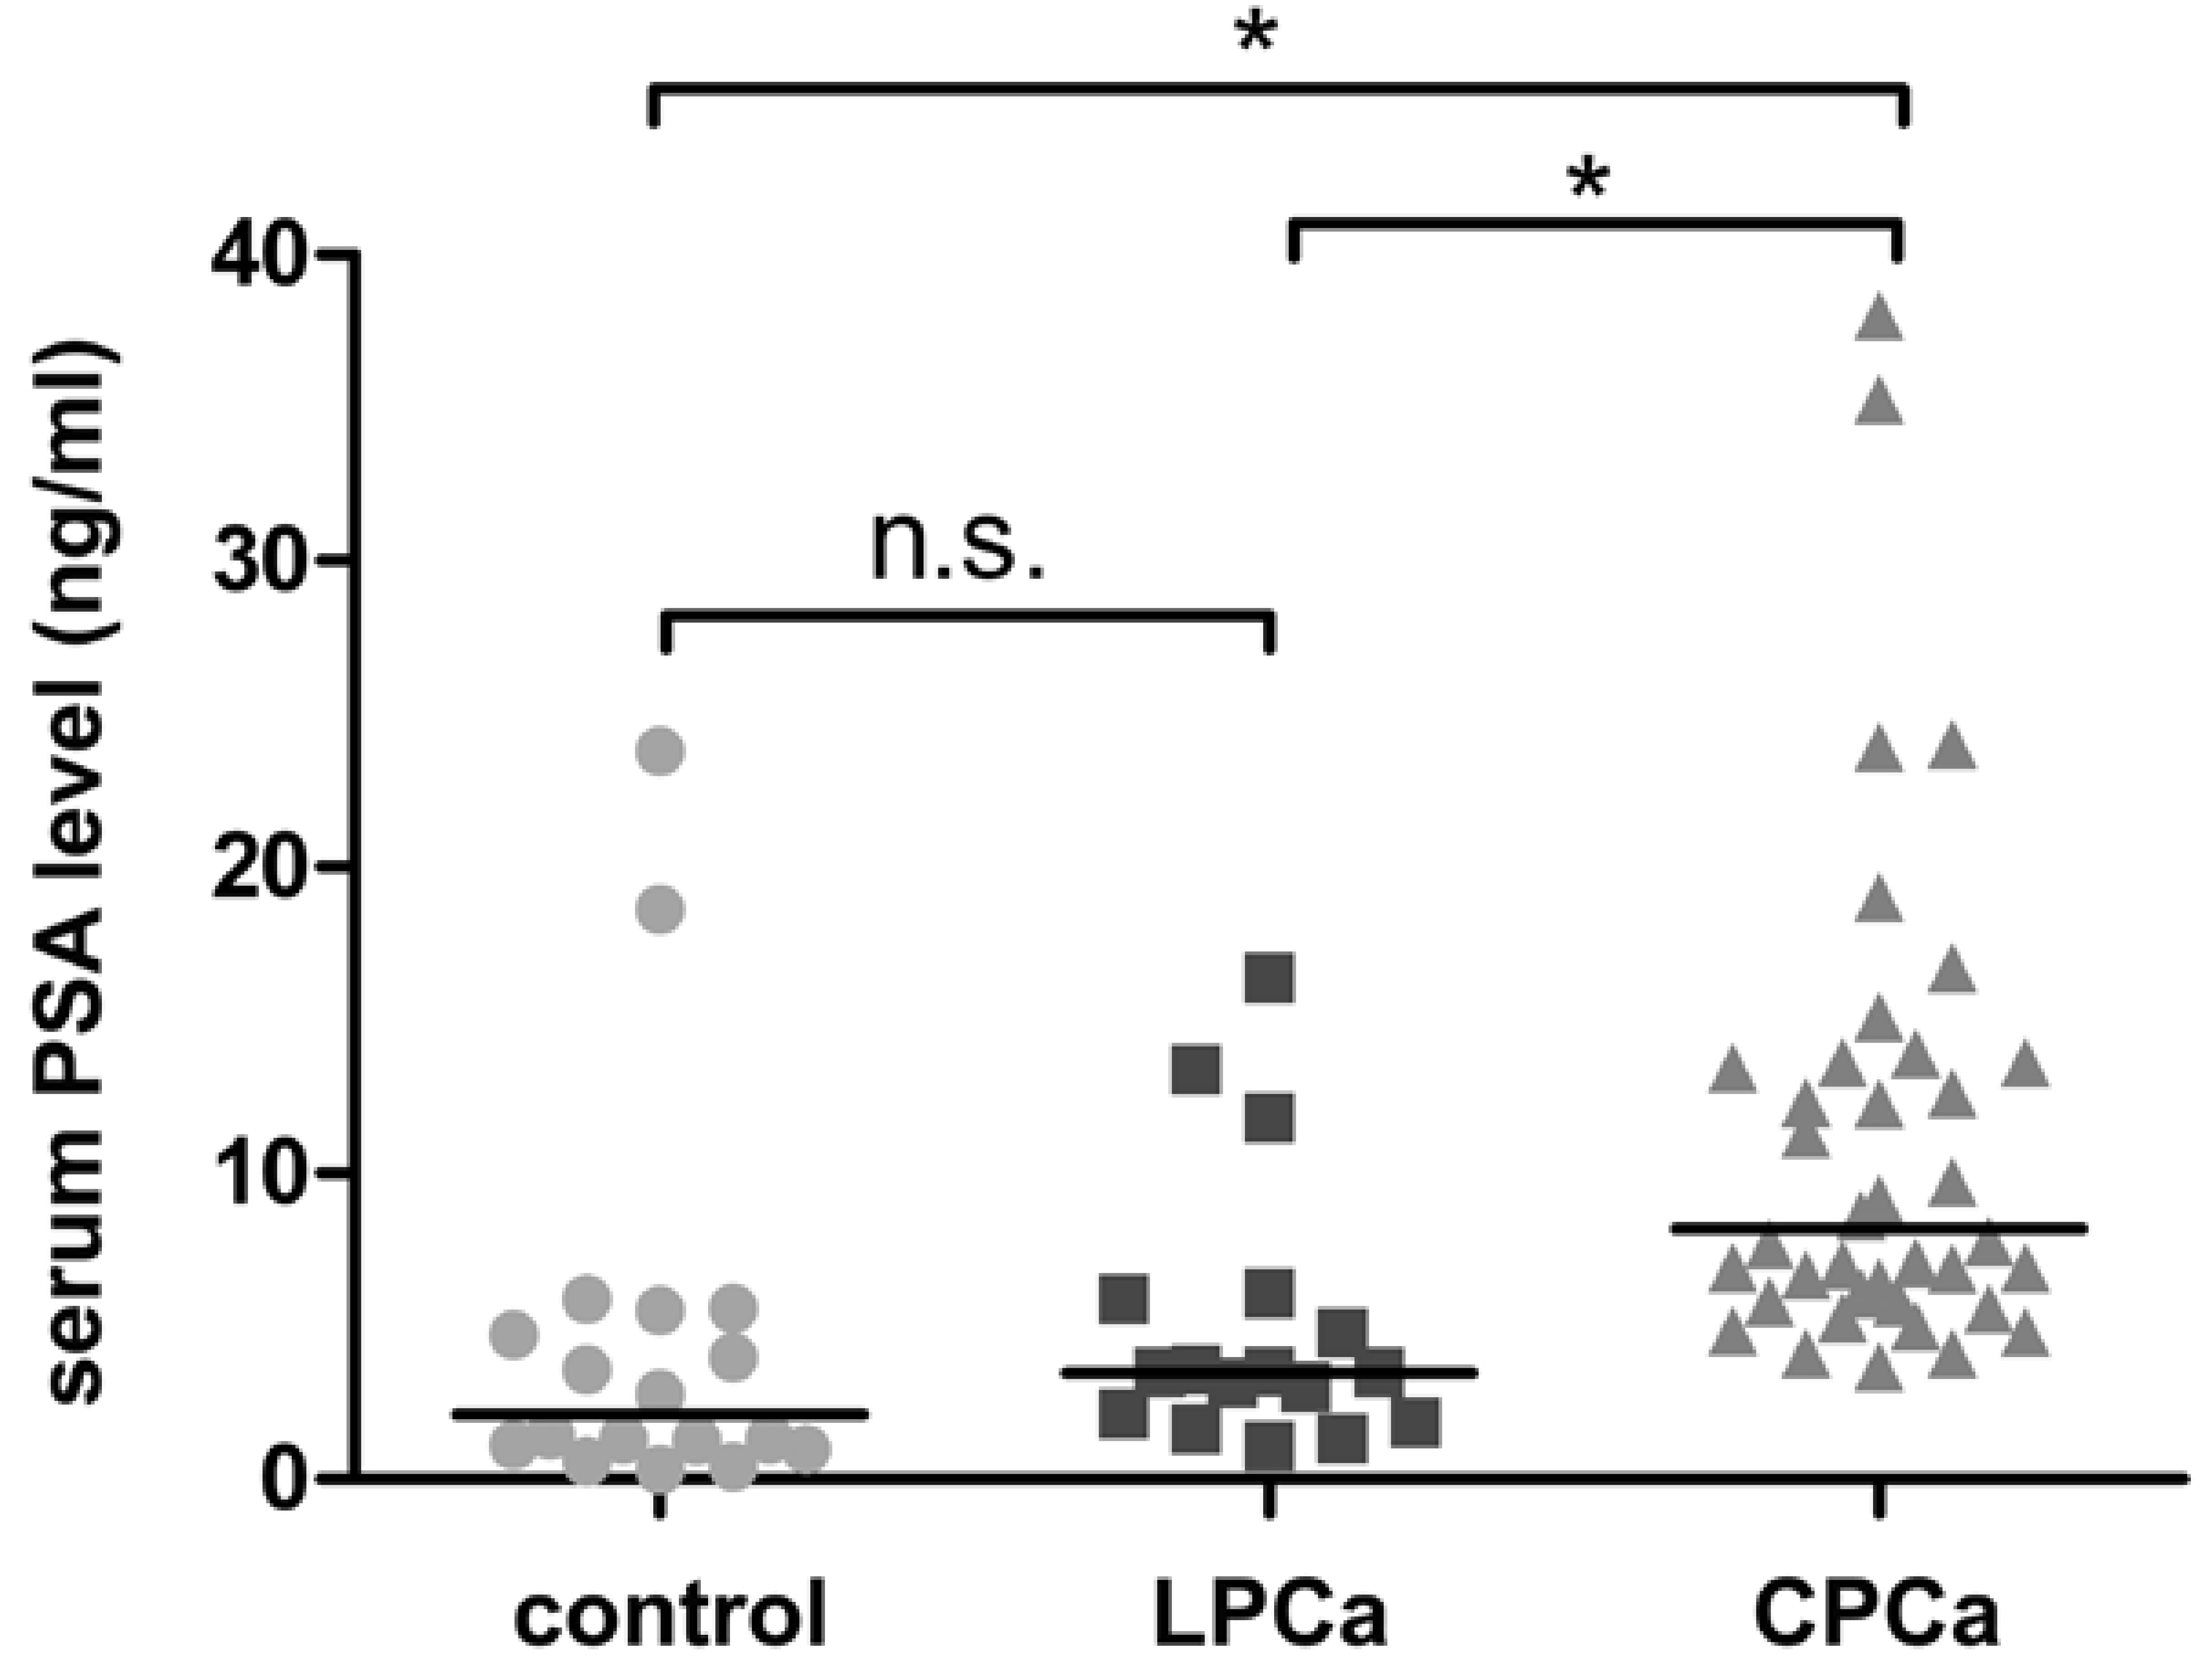
2.1. Characteristics of Normal Prostate, Latent and Clinical Prostate Cancer Specimens

Table 1 shows the mean age, Gleason sum, and preoperative serum PSA level in individuals of CPCa, LPCa and control groups used in the present study. The Mann-Whitney’s U test was used to compare the age, Gleason grades and serum PSA levels among the two groups and non-cancer controls; i.e., control vs. latent prostate cancer group, control vs. clinical prostate cancer group, and latent prostate cancer group vs. clinical prostate cancer group. There was no significant difference in the distribution of Gleason score between latent and clinical prostate cancer groups (p = 0.123). The serum PSA level in clinical cancer patients was significantly higher than the other groups (p < 0.0001; Figure 1), while there was no significant difference between the latent prostate cancer group and control (p = 0.207; Figure 1). The mean age of clinical cancer group was slightly younger than latent prostate cancer group (p = 0.032; Table 1), and there were no significant difference between latent prostate cancer group and control (p = 0.974), and between clinical prostate cancer group and control (p = 0.150).
Table 1. Characteristics of Clinical-and Latent-Prostate Cancer Patients and Controls.
ControlsLatent CancerClinical Cancer
(n = 18)(n = 17)(n = 41)
Mean ± SD age (years)69.3 ± 8.370.9 ± 4.267.6 ± 5.1*
No. Gleason sum (%)
GS < 78 (47%)17 (41%)
GS ≥ 79 (53%)24 (59%)
No. ng/ml serum PSA
PSA < 1016 (89%)14 (82%)24 (59%)
PSA ≥ 102 (11%)3 (18%)17 (41%)**
* The age of clinical cancer patients was younger than latent cancer group (p = 0.032).
**     Serum PSA level in clinical cancer patients was higher than other groups (see Figure 1).
Figure 1. The distribution of serum PSA level in control group, latent prostate cancer group (LPCa), and clinical prostate cancer group (CPCa), respectively. The data were statistically analyzed by Mann-Whitney’s U test (see Materials and Methods). Asterisks indicate significant differences (p < 0.0001). ‘n.s.’ indicates no significant difference.
Genes 01 00283 g001

2.2. TSPY Expression in Human Prostate Cancer

TSPY expression was consistently detected in the majority of adenocarcinoma cells, while minimal or no expression was detected in the stromal components (Figure 2(a)) of the clinical prostate cancer group. Although in general a significantly higher frequency of TSPY expression was observed in clinical cancer samples than non-cancer control samples (Table 2), some histologically normal glands adjacent to cancer cell areas were also positive for TSPY immunostaining in the clinical cancer specimens (Figure 2(b) and Table 2). In the latent prostate cancer group, TSPY expression was positively associated with Gleason score, such that the high-grade cancer foci (Gleason grade > 7) expressed TSPY in similar frequency and levels as those in the clinical prostate cancer group (Table 3). However, our study did not show any significant association between TSPY expression and serum PSA level in any group (p > 0.22). It has been reported that the serum PSA level is not elevated in many cases of prostate cancer, even in high-grade cancer patients [34,35]. The TSPY expression may not be directly associated with the machinery for increasing the serum PSA level.
Figure 2. Immunohistochemical localization of TSPY and other biomarkers in the prostate tissues. (a) Immunostaining of TSPY (brown) in prostatic adenocarcinoma. Nuclei were counterstained by hematoxylin (purple). Note significant TSPY staining in cancer cells (red arrowheads), and faint or negative staining in the surrounding stromal cells (blue arrows). ‘NP’ indicates the TSPY-positive normal prostate gland. (b) Image of normal gland adjacent to cancer area in the same clinical prostate cancer section of (a). Epithelial cells in normal gland were also positively stained (arrows). (c) Representative image of TSPY immunostaining in the TSPY-negative gland of normal prostate. (d) Clinical prostate cancer section doubly immunostained for AMACR (dark blue) and p63 (brown). Arrow indicates the morphologically normal glands containing AMACR-negative epithelial cells and p63-positive basal cell layers. ‘PCa’ indicates the AMACR positive cancer area. (e) An adjacent section of d immunostained by anti-TSPY. Arrows indicate the AMACR-negative glands that were expressing TSPY. Scale bar = 75 μm.
Genes 01 00283 g002
Table 2. The frequency of TSPY expression in prostate specimens. The ratio of TSPY-positive specimens/total are shown.
Non cancerLatent CancerClinical Cancer
Normal gland9/18 (50%)10/17 (59%)33/41 (80%)*
Cancer cellsnd8/17 (47%)32/41 (78%)*
* The ratio is significantly higher than other groups (p < 0.05).
Table 3. The frequency of TSPY expression in lower Gleason grade cancer (GS < 7) and higher Gleason grades cancer (7 ≤ GS).
Gleason score
GS < 77 ≤ GS
Latent cancer1/8 (13%)*7/9 (78%)*
Clinical cancer13/17 (76%)19/24 (79%)
* The ratio is significantly different between two groups; [GS < 7] and [7 ≤ GS] (p < 0.05).
AMACR (alpha-methylacyl-CoA racemase) and p63 (a p53 homolog) have been used as indicators for cancer cells and normal glands respectively within the prostate cancer specimen [36]. AMACR is detected at high levels in the prostate cancer cells in prostate cancer specimens and has been used as a tumor biomarker. On the other hand, p63 is a basal cell marker in the prostate and is negative in cancer cells positive for AMACR (Figure 2(d)). Using these two markers, we demonstrated that TSPY could be detected in both cancer cells, associated .cancer specimens (Figure 2(e) and Table 2).

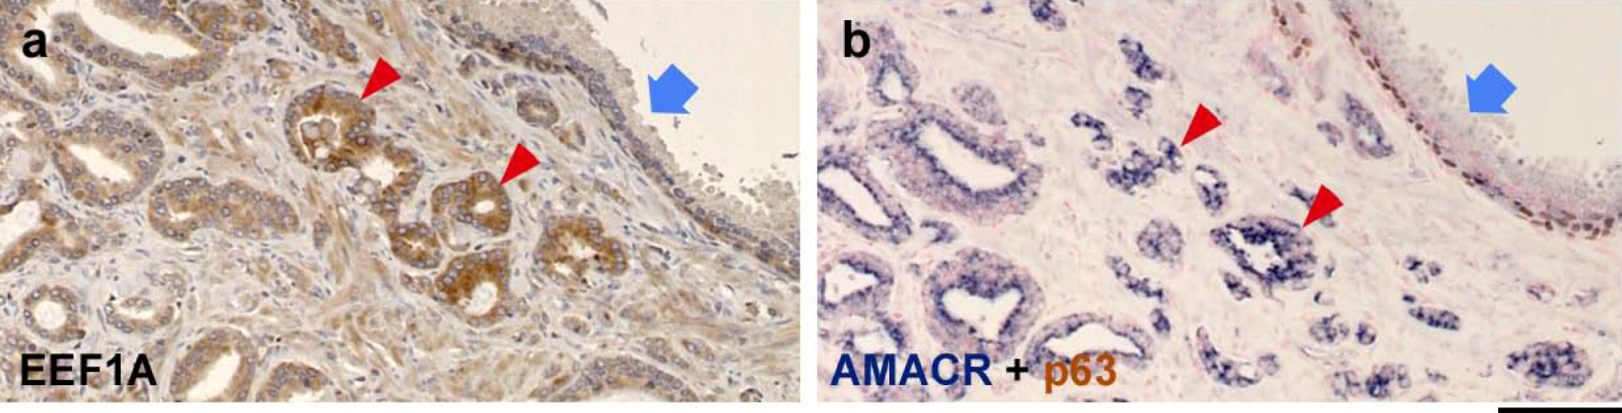
2.3. EEF1A Expression is Elevated in Human Prostate Cancer

Eleven specimens of latent prostate cancer and 25 specimens of clinical prostate cancer were randomly selected and analyzed by immunohistochemistry with an anti-EEF1A antibody. Although there was a variation in the intensity of staining among different cell types, all examined cells were EEF1A-positive. In 30% of samples of both latent cancer group and clinical cancer group, the intensity of EEF1A-immunostaining was relatively stronger in cancer cells than normal glands (arrowheads in Figure 3(a), Figure 3(b) and Table 4). These observations are consistent with the fact that EEF1As are essential components of cell survival, despite their involvement in tumor development [27,28,29,30].
Table 4. Intensity of EEF1A in prostate cancer.
Latent cancerClinical cancer
EEF1A intensity
cancer < normal 1 (9%)1 (4%)
cancer = normal 7 (64%)16 (64%)
cancer > normal 3 (27%)8 (32%)
Abbreviations: cancer, cancer cells; normal, epithelial cells in normal gland
Figure 3. Immunohistochemical localization of EEF1A and other biomarkers in prostate tissues. (a) Representative image of the EEF1A immunostaining of prostate cancer specimen in which EEF1A expression was correlated with cancer development. (b) An adjacent section of a doubly immunostained for AMACR (dark blue) and p63 (brown). Nuclei were counterstained by FastRed (red). Arrows and arrowheads indicate the identical area between (a) and (b). Scale bar = 100 μm.
Genes 01 00283 g003
In present study, we demonstrate that the frequency of TSPY-expression was significantly elevated in clinical prostate cancer. This finding is consistent with those in previous reports suggesting that TSPY expression increased in late stages of tumor progression [14,15]. In clinical prostate cancer group, the frequency of TSPY expression was independent of Gleason grade. On the other hand, we found that the TSPY expression was associated with Gleason grade in latent prostate cancer group (Table 3). Latent prostate cancer, by definition, is not manifested with any clinical symptoms, but is only identified in pathological analysis of specimens derived from autopsy or, in the present study, from bladder surgeries. There were no significant differences in the serum PSA level between latent prostate cancer group and control group in our study (Table 1). It has been suggested that the latent prostate cancer is likely to be a preclinical stage, and its proliferative capacity is lower than clinical prostate cancer [37,38]. TSPY expression in latent prostate cancer suggests that it is an early biomarker for initiation and/or progression of preclinical prostate cancer. Interestingly, we frequently observed expression of TSPY in morphologically “normal” glands, negative for AMACR, adjacent to cancer areas (Arrows in Figure 2(d) and 2(e)). We surmise that although both TSPY and AMACR expressions are associated with cancer development, they could be differentially regulated or activated to high levels at slightly different stages during prostatic carcinogenesis. Such expression patterns suggested that TSPY expression could be associated certain, yet-to-be defined, microenvironments involved in the initiation and progression of prostate cancer [18,19,39]. Further, since over-expression of TSPY could promote oncogenic behaviors of the host cells in both in vitro and in vivo studies [22,23,40], its expression in latent and clinical prostate cancers suggests that it may contribute to the initiation and/or progression of prostate cancer.
Previously, we demonstrated that TSPY interacted with the putative oncoprotein EEF1A, and contributed to the cell growth properties of EEF1A [23]. Other studies also suggested that the elevated levels of EEF1A expression were associated with cell survival and cell proliferation [29,30]. EEF1A was highly expressed in various cancer types including ovarian cancer (approximately 30%), primary breast tumors (approximately 60%), and lung cancer (approximately 30%), and has been postulated as oncogenes involved in the development of various cancers [31,32,41]. The present study shows that EEF1A expression is elevated in cancer cells in 30% of prostate cancer specimens, suggesting that increase in EEF1A expression could also be associated with the progression of prostate cancer, similarly with other types of cancer. These observations support our hypothesis that TSPY and EEF1A could synergistically accelerate the tumorigenic processes in prostate cancer.

3. Experimental Section

3.1. Prostate Specimens

A total 76 prostate specimens (mean age 68.8 years, range 50–80 years), including 41 cases of clinical cancer (CPCa), 17 cases of latent cancer (LPCa) and 18 non-cancer prostates (control) were derived from archival pathological preparations of the Department of Urology, Hirosaki University, Japan. The whole prostates were fixed in 10% neutral formalin and then dehydrated with ethanol series. After the blocks of tissue were embedded in paraffin, sections were cut at a thickness of 5 μm. Sections were stained with hematoxylin and eosin (HE) for pathological evaluation and Gleason grading according to standard criteria. The preoperative serum prostate-specific antigen (PSA) level was assayed in all patients by a service clinical laboratory in Hirosaki University School of Medicine. The human study was performed under approved protocols by the respective Institutional Committees on Human Research, VA Medical Center, San Francisco and Hirosaki University, Aomori, Japan.

3.2. Immunohistochemistry

Immunohistochemistry was performed as described previously [23], using anti-TSPY mouse monoclonal antibody (1:3000), anti-AMACR rabbit IgG (1:50, Abcam Inc., Cambridge, MA), anti-p63 mouse IgG (1:50, Abcam), and anti-eEF1A mouse monoclonal antibody (1:100, clone CBP-KK1, Upstate, Charlottesville, VA). The immunoreactive sites were visualized by the SuperPicTure Polymer Detection kit (ZYMED/Invitrogen, Carlsbad, CA) and/or VECTASTAIN ABC-AP kit (Vector Laboratories, Burlingame, CA). The signals of TSPY-staining were amplified with Tyramide Signal Amplification Kits (Molecular Probes/Invitrogen). All immunostainings were performed by the same investigator with the same equipment setup. The Gleason scores were determined by an experienced urologic pathologist at the Hirosaki University School of Medicine, Japan. The immunostaining results were derived from consensus between the two independent experimenters/observers. Statistical analysis was performed using the non-parametric test (Mann-Whitney U-test) and Chi-square test with SPSS statistics program (Version 12; Statistical Package for Social Sciences for Windows, SPSS Inc., Chicago, IL, USA).

4. Conclusions

Our results suggest that TSPY expression is associated with the initiation and/or progression of tumorigenesis in both latent and clinical prostate cancers. The elevated expression of EEF1A, a binding partner of TSPY, could potentially exacerbate the cell proliferative properties of TSPY and increase the susceptibility of affected cells in oncogenic initiation and/or progression in prostate cancer.

Acknowledgments

This work was partially supported by a Merit-Reviewed grant and a Research Enhancement Award in Prostate Cancer from the Department of Veterans Affairs to Y.-F.C.L. Y.-F.C. Lau is a Research Career Scientist of the Department of Veterans Affairs.

References and Notes

  1. Arnemann, J.; Epplen, J.T.; Cooke, H.J.; Sauermann, U.; Engel, W.; Schmidtke, J. A human Y-chromosomal DNA sequence expressed in testicular tissue. Nucleic Acids Res. 1987, 15, 8713–8724. [Google Scholar] [CrossRef] [PubMed]
  2. Zhang, J.S.; Yang-Feng, T.L.; Muller, U.; Mohandas, T.K.; de Jong, P.J.; Lau, Y.F. Molecular isolation and characterization of an expressed gene from the human Y chromosome. Hum. Mol. Genet. 1992, 1, 717–726. [Google Scholar] [CrossRef] [PubMed]
  3. Schnieders, F.; Dork, T.; Arnemann, J.; Vogel, T.; Werner, M.; Schmidtke, J. Testis-specific protein, Y-encoded (TSPY) expression in testicular tissues. Hum. Mol. Genet. 1996, 5, 1801–1807. [Google Scholar] [CrossRef] [PubMed]
  4. Kersemaekers, A.M.; Honecker, F.; Stoop, H.; Cools, M.; Molier, M.; Wolffenbuttel, K.; Bokemeyer, C.; Li, Y.; Lau, Y.F.; Oosterhuis, J.W.; Looijenga, L.H. Identification of germ cells at risk for neoplastic transformation in gonadoblastoma: an immunohistochemical study for OCT3/4 and TSPY. Hum. Pathol. 2005, 36, 512–521. [Google Scholar] [CrossRef] [PubMed]
  5. Tsuchiya, K.; Reijo, R.; Page, D.C.; Disteche, C.M. Gonadoblastoma: molecular definition of the susceptibility region on the Y chromosome. Am. J. Hum. Genet. 1995, 57, 1400–1407. [Google Scholar] [PubMed]
  6. Salo, P.; Kaariainen, H.; Petrovic, V.; Peltomaki, P.; Page, D.C.; de la Chapelle, A. Molecular mapping of the putative gonadoblastoma locus on the Y chromosome. Genes Chromosomes Cancer 1995, 14, 210–214. [Google Scholar] [CrossRef] [PubMed]
  7. Page, D.C. Hypothesis: a Y-chromosomal gene causes gonadoblastoma in dysgenetic gonads . Development 1987, Suppl. 101, 151–155. [Google Scholar] [PubMed]
  8. Lau, Y.; Chou, P.; Iezzoni, J.; Alonzo, J.; Komuves, L. Expression of a candidate gene for the gonadoblastoma locus in gonadoblastoma and testicular seminoma. Cytogenet. Cell Genet. 2000, 91, 160–164. [Google Scholar] [CrossRef] [PubMed]
  9. Dubovsky, J.A.; McNeel, D.G. Inducible expression of a prostate cancer-testis antigen, SSX-2, following treatment with a DNA methylation inhibitor. Prostate 2007, 67, 1781–1790. [Google Scholar] [CrossRef] [PubMed]
  10. Gallagher, W.M.; Bergin, O.E.; Rafferty, M.; Kelly, Z.D.; Nolan, I.M.; Fox, E.J.; Culhane, A.C.; McArdle, L.; Fraga, M.F.; Hughes, L.; Currid, C.A.; O'Mahony, F.; Byrne, A.; Murphy, A.A.; Moss, C.; McDonnell, S.; Stallings, R.L.; Plumb, J.A.; Esteller, M.; Brown, R.; Dervan, P.A.; Easty, D.J. Multiple markers for melanoma progression regulated by DNA methylation: insights from transcriptomic studies. Carcinogenesis 2005, 26, 1856–1867. [Google Scholar] [CrossRef] [PubMed]
  11. Yin, Y.H.; Li, Y.Y.; Qiao, H.; Wang, H.C.; Yang, X.A.; Zhang, H.G.; Pang, X.W.; Zhang, Y.; Chen, W.F. TSPY is a cancer testis antigen expressed in human hepatocellular carcinoma. Br. J. Cancer 2005, 93, 458–463. [Google Scholar] [CrossRef] [PubMed]
  12. Scanlan, M.J.; Simpson, A.J.; Old, L.J. The cancer/testis genes: Review, standardization, and commentary. Cancer Immun. 2004, 4, 1. [Google Scholar] [PubMed]
  13. Simpson, A.J.; Caballero, O.L.; Jungbluth, A.; Chen, Y.T.; Old, L.J. Cancer/testis antigens, gametogenesis and cancer. Nat. Rev. Cancer 2005, 5, 615–625. [Google Scholar] [CrossRef] [PubMed]
  14. Lau, Y.F.; Lau, H.W.; Komuves, L.G. Expression pattern of a gonadoblastoma candidate gene suggests a role of the Y chromosome in prostate cancer. Cytogenet. Genome Res. 2003, 101, 250–260. [Google Scholar] [CrossRef]
  15. Singh, A.P.; Bafna, S.; Chaudhary, K.; Venkatraman, G.; Smith, L.; Eudy, J.D.; Johansson, S.L.; Lin, M.F.; Batra, S.K. Genome-wide expression profiling reveals transcriptomic variation and perturbed gene networks in androgen-dependent and androgen-independent prostate cancer cells. Cancer Lett. 2008, 259, 28–38. [Google Scholar] [PubMed]
  16. Yu, Y.P.; Landsittel, D.; Jing, L.; Nelson, J.; Ren, B.; Liu, L.; McDonald, C.; Thomas, R.; Dhir, R.; Finkelstein, S.; Michalopoulos, G.; Becich, M.; Luo, J.H. Gene expression alterations in prostate cancer predicting tumor aggression and preceding development of malignancy. J. Clin. Oncol. 2004, 22, 2790–2799. [Google Scholar] [CrossRef] [PubMed]
  17. Stanbrough, M.; Bubley, G.J.; Ross, K.; Golub, T.R.; Rubin, M.A.; Penning, T.M.; Febbo, P.G.; Balk, S.P. Increased expression of genes converting adrenal androgens to testosterone in androgen-independent prostate cancer. Cancer Res. 2006, 66, 2815–2825. [Google Scholar] [CrossRef] [PubMed]
  18. Li, X.; Placencio, V.; Iturregui, J.M.; Uwamariya, C.; Sharif-Afshar, A.R.; Koyama, T.; Hayward, S.W.; Bhowmick, N.A. Prostate tumor progression is mediated by a paracrine TGF-beta/Wnt3a signaling axis. Oncogene 2008, 27, 7118–7130. [Google Scholar] [CrossRef] [PubMed]
  19. Waugh, D.J.; Wilson, C. The interleukin-8 pathway in cancer. Clin. Cancer Res. 2008, 14, 6735–6741. [Google Scholar] [CrossRef]
  20. Park, Y.J.; Luger, K. Structure and function of nucleosome assembly proteins. Biochem. Cell Biol. 2006, 84, 549–558. [Google Scholar] [CrossRef] [PubMed]
  21. Muto, S.; Senda, M.; Akai, Y.; Sato, L.; Suzuki, T.; Nagai, R.; Senda, T.; Horikoshi, M. Relationship between the structure of SET/TAF-Ibeta/INHAT and its histone chaperone activity. Proc. Natl. Acad. Sci. U. S. A. 2007, 104, 4285–4290. [Google Scholar] [CrossRef] [PubMed]
  22. Li, Y.; Lau, Y.F. TSPY and its X-encoded homologue interact with cyclin B but exert contrasting functions on cyclin-dependent kinase 1 activities. Oncogene 2008, 27, 6141–6150. [Google Scholar] [CrossRef] [PubMed]
  23. Kido, T.; Lau, Y.F. The human Y-encoded testis-specific protein interacts functionally with eukaryotic translation elongation factor eEF1A, a putative oncoprotein. Int. J. Cancer 2008, 123, 1573–1585. [Google Scholar] [CrossRef] [PubMed]
  24. Kahns, S.; Lund, A.; Kristensen, P.; Knudsen, C.R.; Clark, B.F.; Cavallius, J.; Merrick, W.C. The elongation factor 1 A-2 isoform from rabbit: cloning of the cDNA and characterization of the protein. Nucleic Acids Res. 1998, 26, 1884–1890. [Google Scholar] [CrossRef] [PubMed]
  25. Shamovsky, I.; Ivannikov, M.; Kandel, E.S.; Gershon, D.; Nudler, E. RNA-mediated response to heat shock in mammalian cells. Nature 2006, 440, 556–560. [Google Scholar] [CrossRef] [PubMed]
  26. Amiri, A.; Noei, F.; Jeganathan, S.; Kulkarni, G.; Pinke, D.E.; Lee, J.M. eEF1A2 activates Akt and stimulates Akt-dependent actin remodeling, invasion and migration. Oncogene 2007, 26, 3027–3040. [Google Scholar] [CrossRef] [PubMed]
  27. Thornton, S.; Anand, N.; Purcell, D.; Lee, J. Not just for housekeeping: protein initiation and elongation factors in cell growth and tumorigenesis. J. Mol. Med. 2003, 81, 536–548. [Google Scholar] [CrossRef] [PubMed]
  28. Shultz, L.D.; Sweet, H.O.; Davisson, M.T.; Coman, D.R. 'Wasted', a new mutant of the mouse with abnormalities characteristic to ataxia telangiectasia. Nature 1982, 297, 402–404. [Google Scholar] [CrossRef] [PubMed]
  29. Kobayashi, Y.; Yonehara, S. Novel cell death by downregulation of eEF1A1 expression in tetraploids. Cell Death Differ. 2009, 16, 139–150. [Google Scholar] [CrossRef] [PubMed]
  30. Chang, Y.W.; Traugh, J.A. Phosphorylation of elongation factor 1 and ribosomal protein S6 by multipotential S6 kinase and insulin stimulation of translational elongation. J. Biol. Chem. 1997, 272, 28252–28257. [Google Scholar] [CrossRef] [PubMed]
  31. Anand, N.; Murthy, S.; Amann, G.; Wernick, M.; Porter, L.A.; Cukier, I.H.; Collins, C.; Gray, J.W.; Diebold, J.; Demetrick, D.J.; Lee, J.M. Protein elongation factor EEF1A2 is a putative oncogene in ovarian cancer. Nat. Genet. 2002, 31, 301–305. [Google Scholar] [PubMed]
  32. Li, R.; Wang, H.; Bekele, B.N.; Yin, Z.; Caraway, N.P.; Katz, R.L.; Stass, S.A.; Jiang, F. Identification of putative oncogenes in lung adenocarcinoma by a comprehensive functional genomic approach. Oncogene 2006, 25, 2628–2635. [Google Scholar] [CrossRef] [PubMed]
  33. Tomlinson, V.A.; Newbery, H.J.; Wray, N.R.; Jackson, J.; Larionov, A.; Miller, W.R.; Dixon, J.M.; Abbott, C.M. Translation elongation factor eEF1A2 is a potential oncoprotein that is overexpressed in two-thirds of breast tumours. BMC Cancer 2005, 5, 113. [Google Scholar] [CrossRef] [PubMed]
  34. Sokoloff, M.H.; Yang, X.J.; Fumo, M.; Mhoon, D.; Brendler, C.B. Characterizing prostatic adenocarcinomas in men with a serum prostate specific antigen level of < 4.0 ng/mL . BJU Int. 2004, 93, 499–502. [Google Scholar] [CrossRef] [PubMed]
  35. Schroder, F.H.; van der Cruijsen-Koeter, I.; de Koning, H.J.; Vis, A.N.; Hoedemaeker, R.F.; Kranse, R. Prostate cancer detection at low prostate specific antigen. J. Urol. 2000, 163, 806–812. [Google Scholar] [CrossRef] [PubMed]
  36. Luo, J.; Zha, S.; Gage, W.R.; Dunn, T.A.; Hicks, J.L.; Bennett, C.J.; Ewing, C.M.; Platz, E.A.; Ferdinandusse, S.; Wanders, R.J.; Trent, J.M.; Isaacs, W.B.; De Marzo, A.M. Alpha-methylacyl-CoA racemase: a new molecular marker for prostate cancer. Cancer Res. 2002, 62, 2220–2226. [Google Scholar] [PubMed]
  37. Delongchamps, N.B.; Singh, A.; Haas, G.P. The role of prevalence in the diagnosis of prostate cancer. Cancer Control 2006, 13, 158–168. [Google Scholar] [PubMed]
  38. Takahashi, S.; Suzuki, S.; Takahashi, S.; Inaguma, S.; Asamoto, M.; Shirai, T. Differences between latent and clinical prostate carcinomas: lower cell proliferation activity in latent cases. Prostate 2006, 66, 211–217. [Google Scholar] [CrossRef] [PubMed]
  39. Tan, D.; Wu, X.; Hou, M.; Lee, S.O.; Lou, W.; Wang, J.; Janarthan, B.; Nallapareddy, S.; Trump, D.L.; Gao, A.C. Interleukin-6 polymorphism is associated with more aggressive prostate cancer. J. Urol. 2005, 174, 753–756. [Google Scholar] [CrossRef] [PubMed]
  40. Oram, S.W.; Liu, X.X.; Lee, T.L.; Chan, W.Y.; Lau, Y.F. TSPY potentiates cell proliferation and tumorigenesis by promoting cell cycle progression in HeLa and NIH3T3 cells. BMC Cancer 2006, 6, 154. [Google Scholar] [CrossRef]
  41. Kulkarni, G.; Turbin, D.A.; Amiri, A.; Jeganathan, S.; Andrade-Navarro, M.A.; Wu, T.D.; Huntsman, D.G.; Lee, J.M. Expression of protein elongation factor eEF1A2 predicts favorable outcome in breast cancer. Breast Cancer Res. Treat. 2007, 102, 31–41. [Google Scholar] [CrossRef] [PubMed]

