Establishment and Molecular Cytogenetic Characterization of a Cell Culture Model of Head and Neck Squamous Cell Carcinoma (HNSCC)

Abstract
:1. Introduction
2. Results and Discussion
2.1. Cytogenetic Characterization of CAL 33 Cells and Derived Cell Clones After Gene Transfection
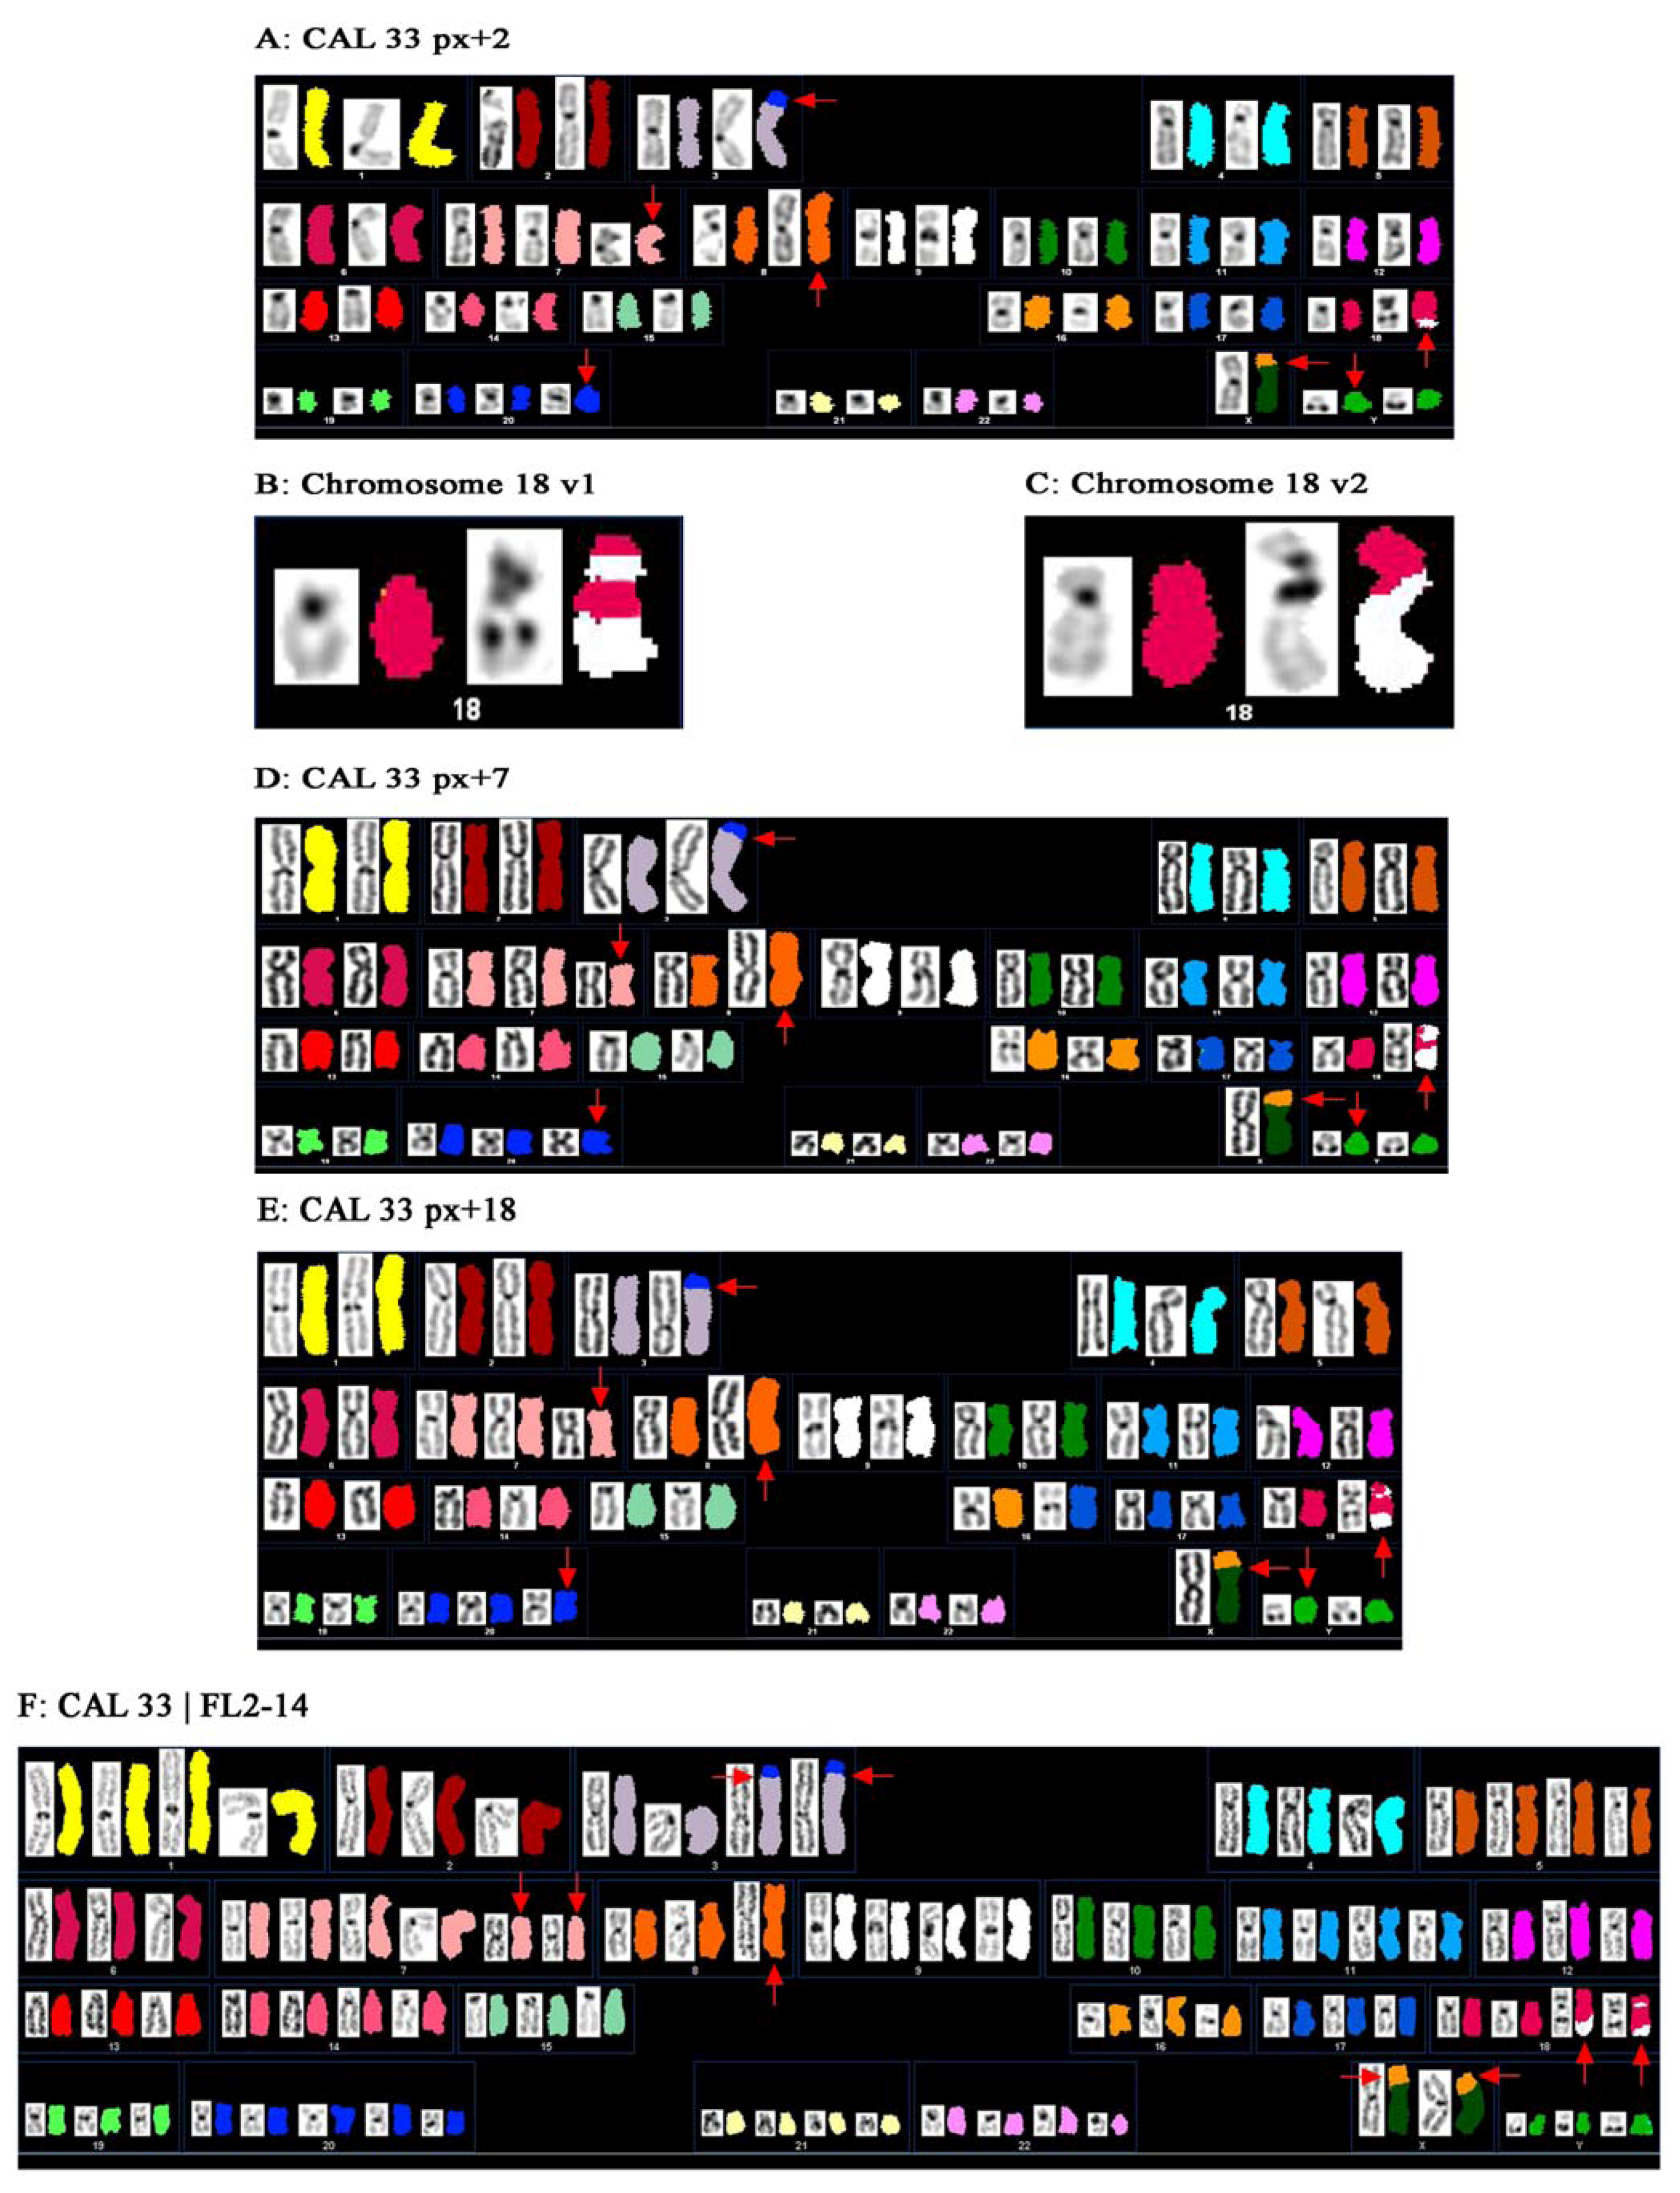
2.1.1. Structural Rearrangements Detected by Spectral Karyotyping (SKY)

| Cell Line | Chromosomal Changes Detected by SKY | Copy Number Changes Detected by array CGH | Validation by FISH | |
|---|---|---|---|---|
| DNA Gains | DNA Losses | |||
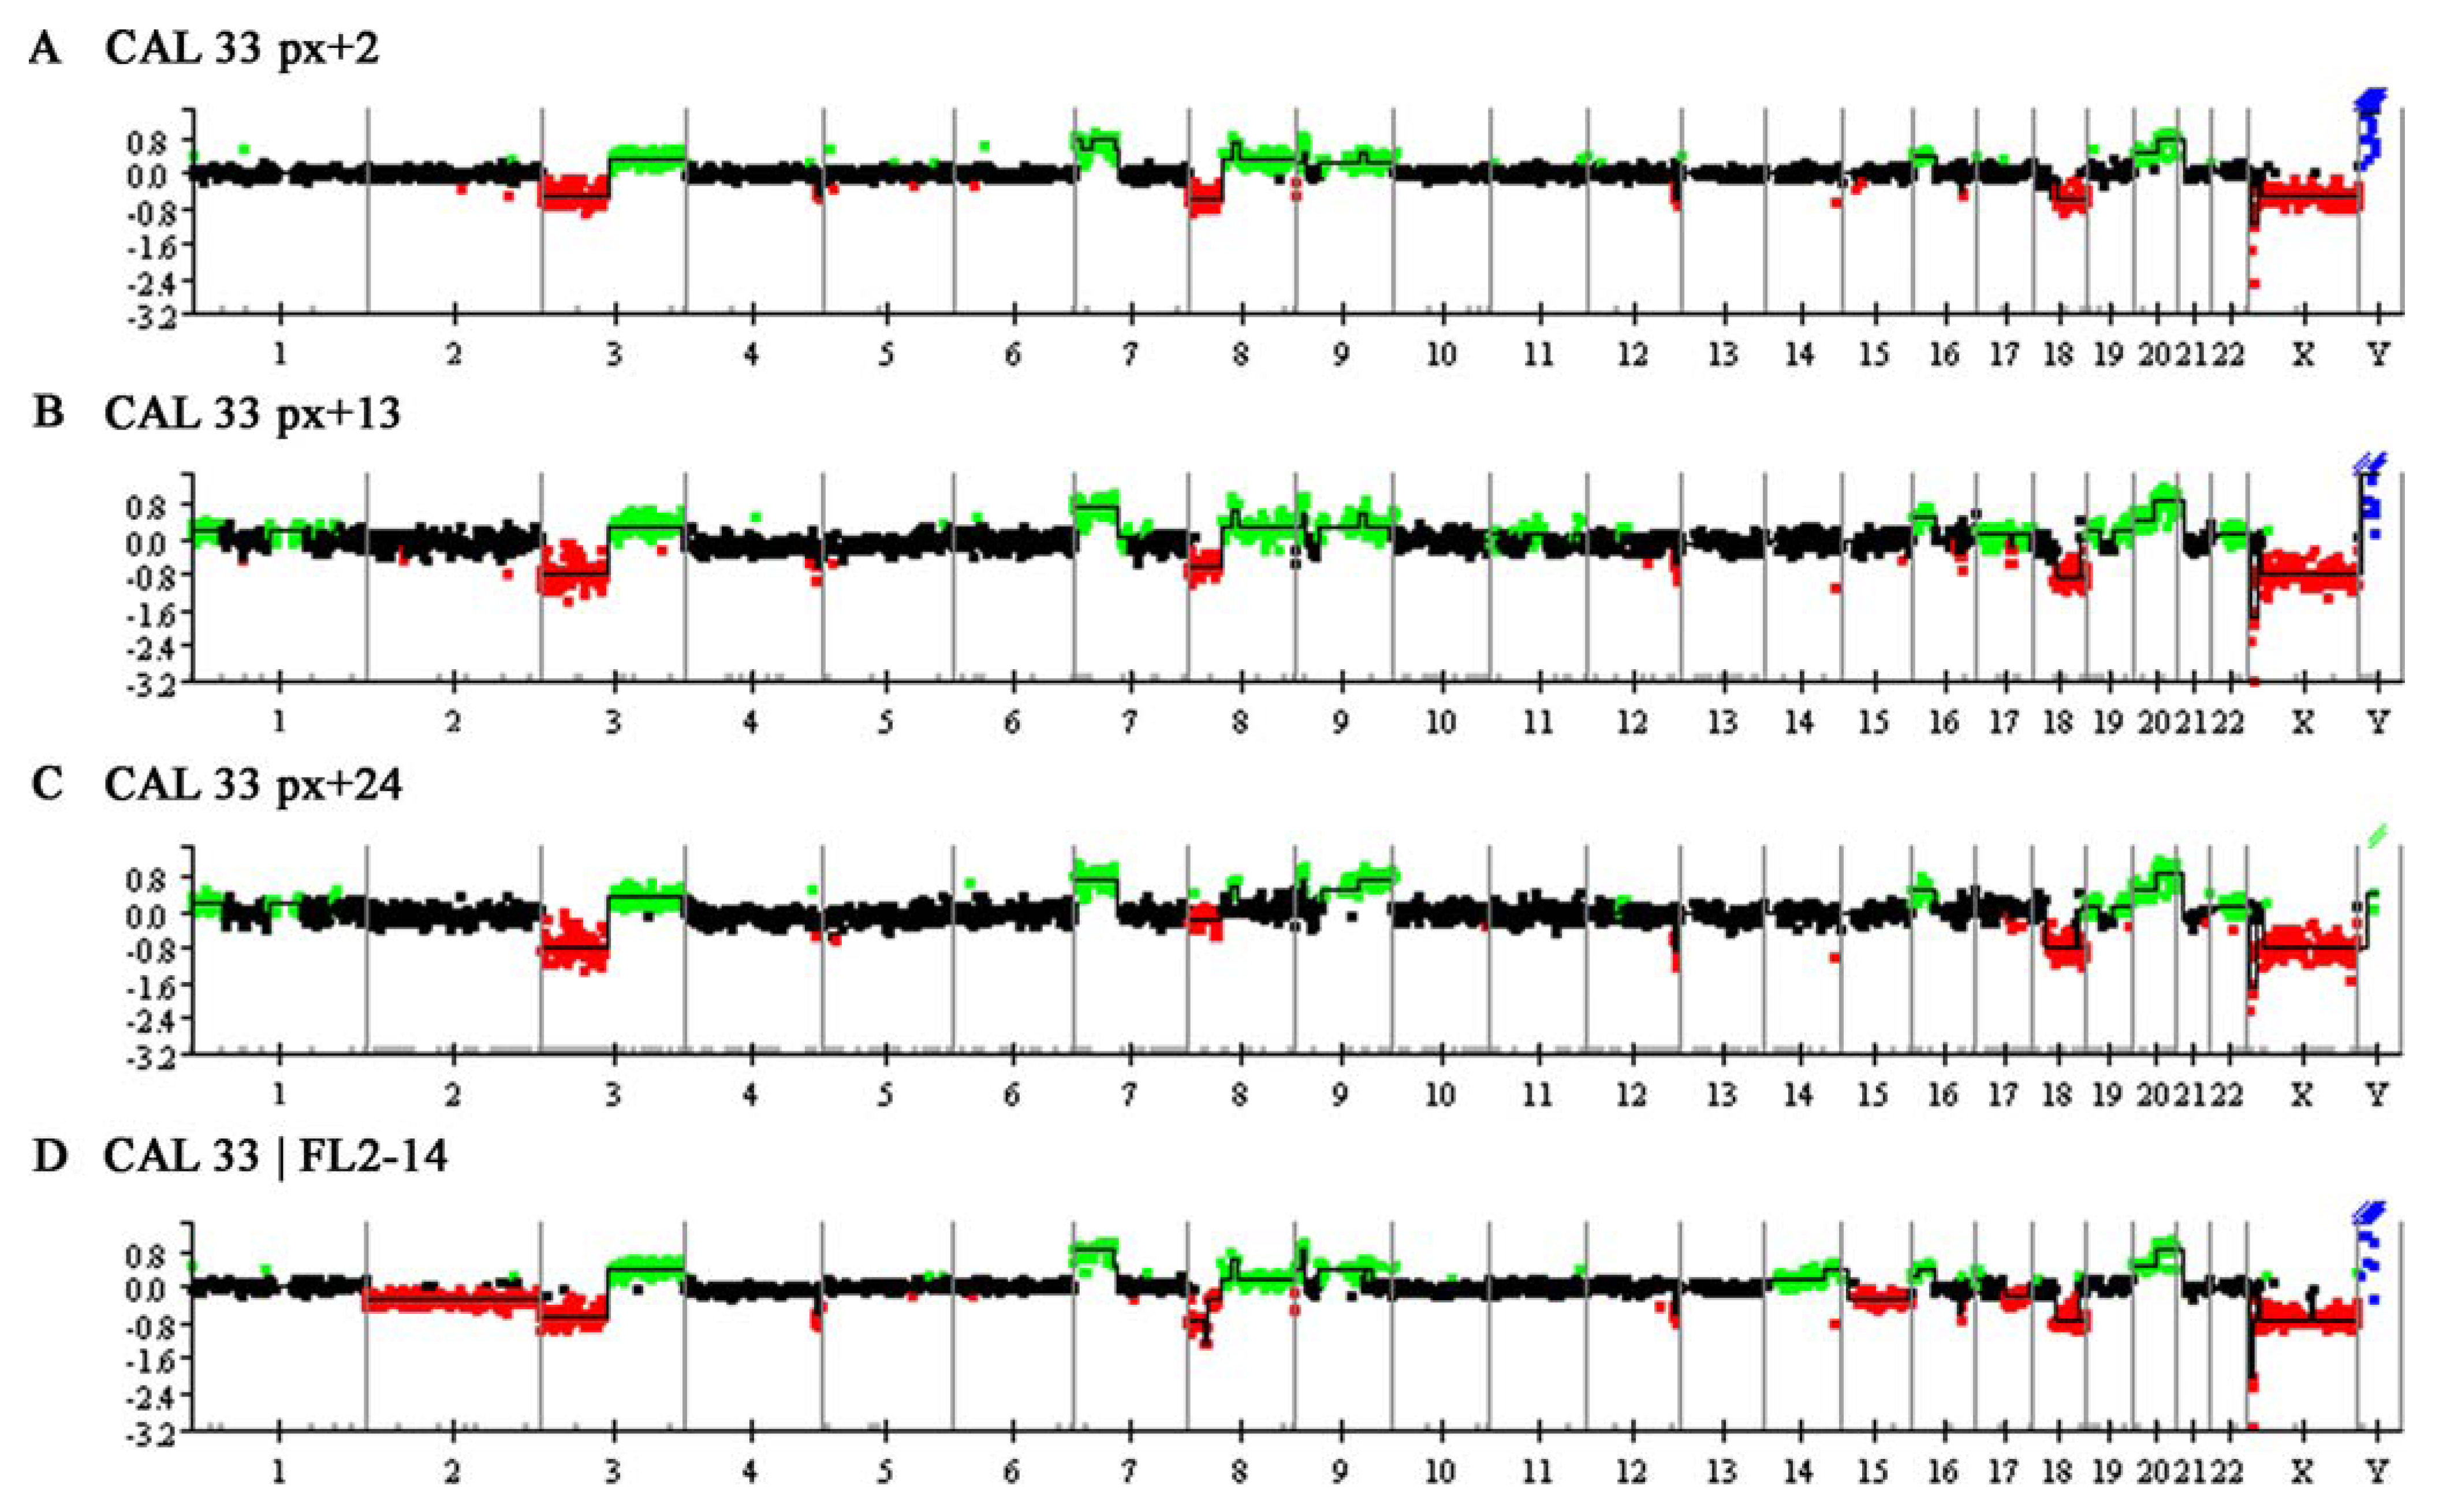
| CAL 33 | Px + 2: 49,Y,Y,der(X)t(X;16)(p22;?), der(3)t(3;20)(p25;?), i(7)(p10),i(8)(q10), der(18)t(18;9)(p13;?)t(18;9)(q21;?),+7,+20 | Px + 2: 3q, 7p, 8q, 9p24.3-22.2, 9p13.2-p11.1, 9q, 16p13.3-11.2, 20 | Px + 2: 3p, 4q34.3-q35.1, 8p, 12q24.3, 16q22.1, 18q12.2-23 | der(3)t(3p;20q); i(3q); i(7p); i(8q); der(X)t(Xp;16p); -4q35.1; -12q24.31; |
| Px + 7: 49,YY,der(X)t(X;16)(p22;?), der(3)t(3;20)(p25;?),i(7)(p10),i(8)(q10), der(18)t(18;9)(p13;?)t(18;9)(q21;?),+7,+20 | Px + 13: 1p36.3-p34.1, 1p13.3-q23.3, 1q25.2-q25.3, 1q32.1, 3q, 7p, 7q11.2, 7q22.1, 8q, 9p24.3-p22.2, 9p13.3-p11.1, 9q, 11p15.5-p15.2, 11p11.2, 11q12.1-q13.5, 11q23.3-q24.2, 12q13.1-q14.1, 16p13.3-p11.2, 17p, 17q11.2-21.3, 17q22-25.3, 19p13.3-13.1, 19q13.1-q13.4, 20, 22q | Px + 13: 2p16.3-p16.2, 3p, 4q34.3-q35.1, 8p, 12q24.3, 16q21, 16q22.1,17q21.3-q22, 18q12.2-q22, 18q22-q23 | - | |
| Px + 18: 49,YY,der(X)t(X;16)(p22;?), der(3)t(3;20)(p25;?),i(7)(p10),i(8)(q10), der(18)t(18;9)(p13;?)t(18;9)(q21;?),+7,+20 | Px + 24: 1p36.3-p34.1, 1p13.3-q23.1, 1q32.1-32.2, 3q, 7p, 8q12.1-q13.1, 9p23-p22.2, 9p12-p11.1, 9q, 12q13.1-q14.1, 16p13.3-p11.2, 19p13.3-13.1, 19q13.1-q13.4, 20, 22q | Px + 24: 3p, 8p, 12q24.3, 17q21.3-q22, 18q11.2-q21.3, 18q22.1-q23 | - | |
| CAL 33/ FL2-14 | 85,YYY,2x der(X)t(X;16)(p22;?), +2x der(3)t(3;20)(p25;?),+2x i(7)(p10),+i(8)(q10), +2x der(18)t(18;9)(p13;?)t(18;9)(q21;?),+1,+1,+2,+4, +5,+5,+6,+7,+7,+9,+9,+10,+11,+11,+12,+13,+14,+14,+15,+16,+17,+19,+19,+20,+20,+20,+21,+21,+22,+22 | 3q, 7p, 8q, 9p24.3-22.2, 9p13-p11.1, 9q13-q22, 9q31, 9q34, 14q, 16p13.3-p11.2, 17p13-p12, 20 | 2, 3p, 4q34.3-q35.1, 8p, 12q24.3, 15q, 16q22, 17q21-q25, 18q12-q22, 18q22-q23 | - |

2.1.2. Copy Number Alterations Detected by Array CGH
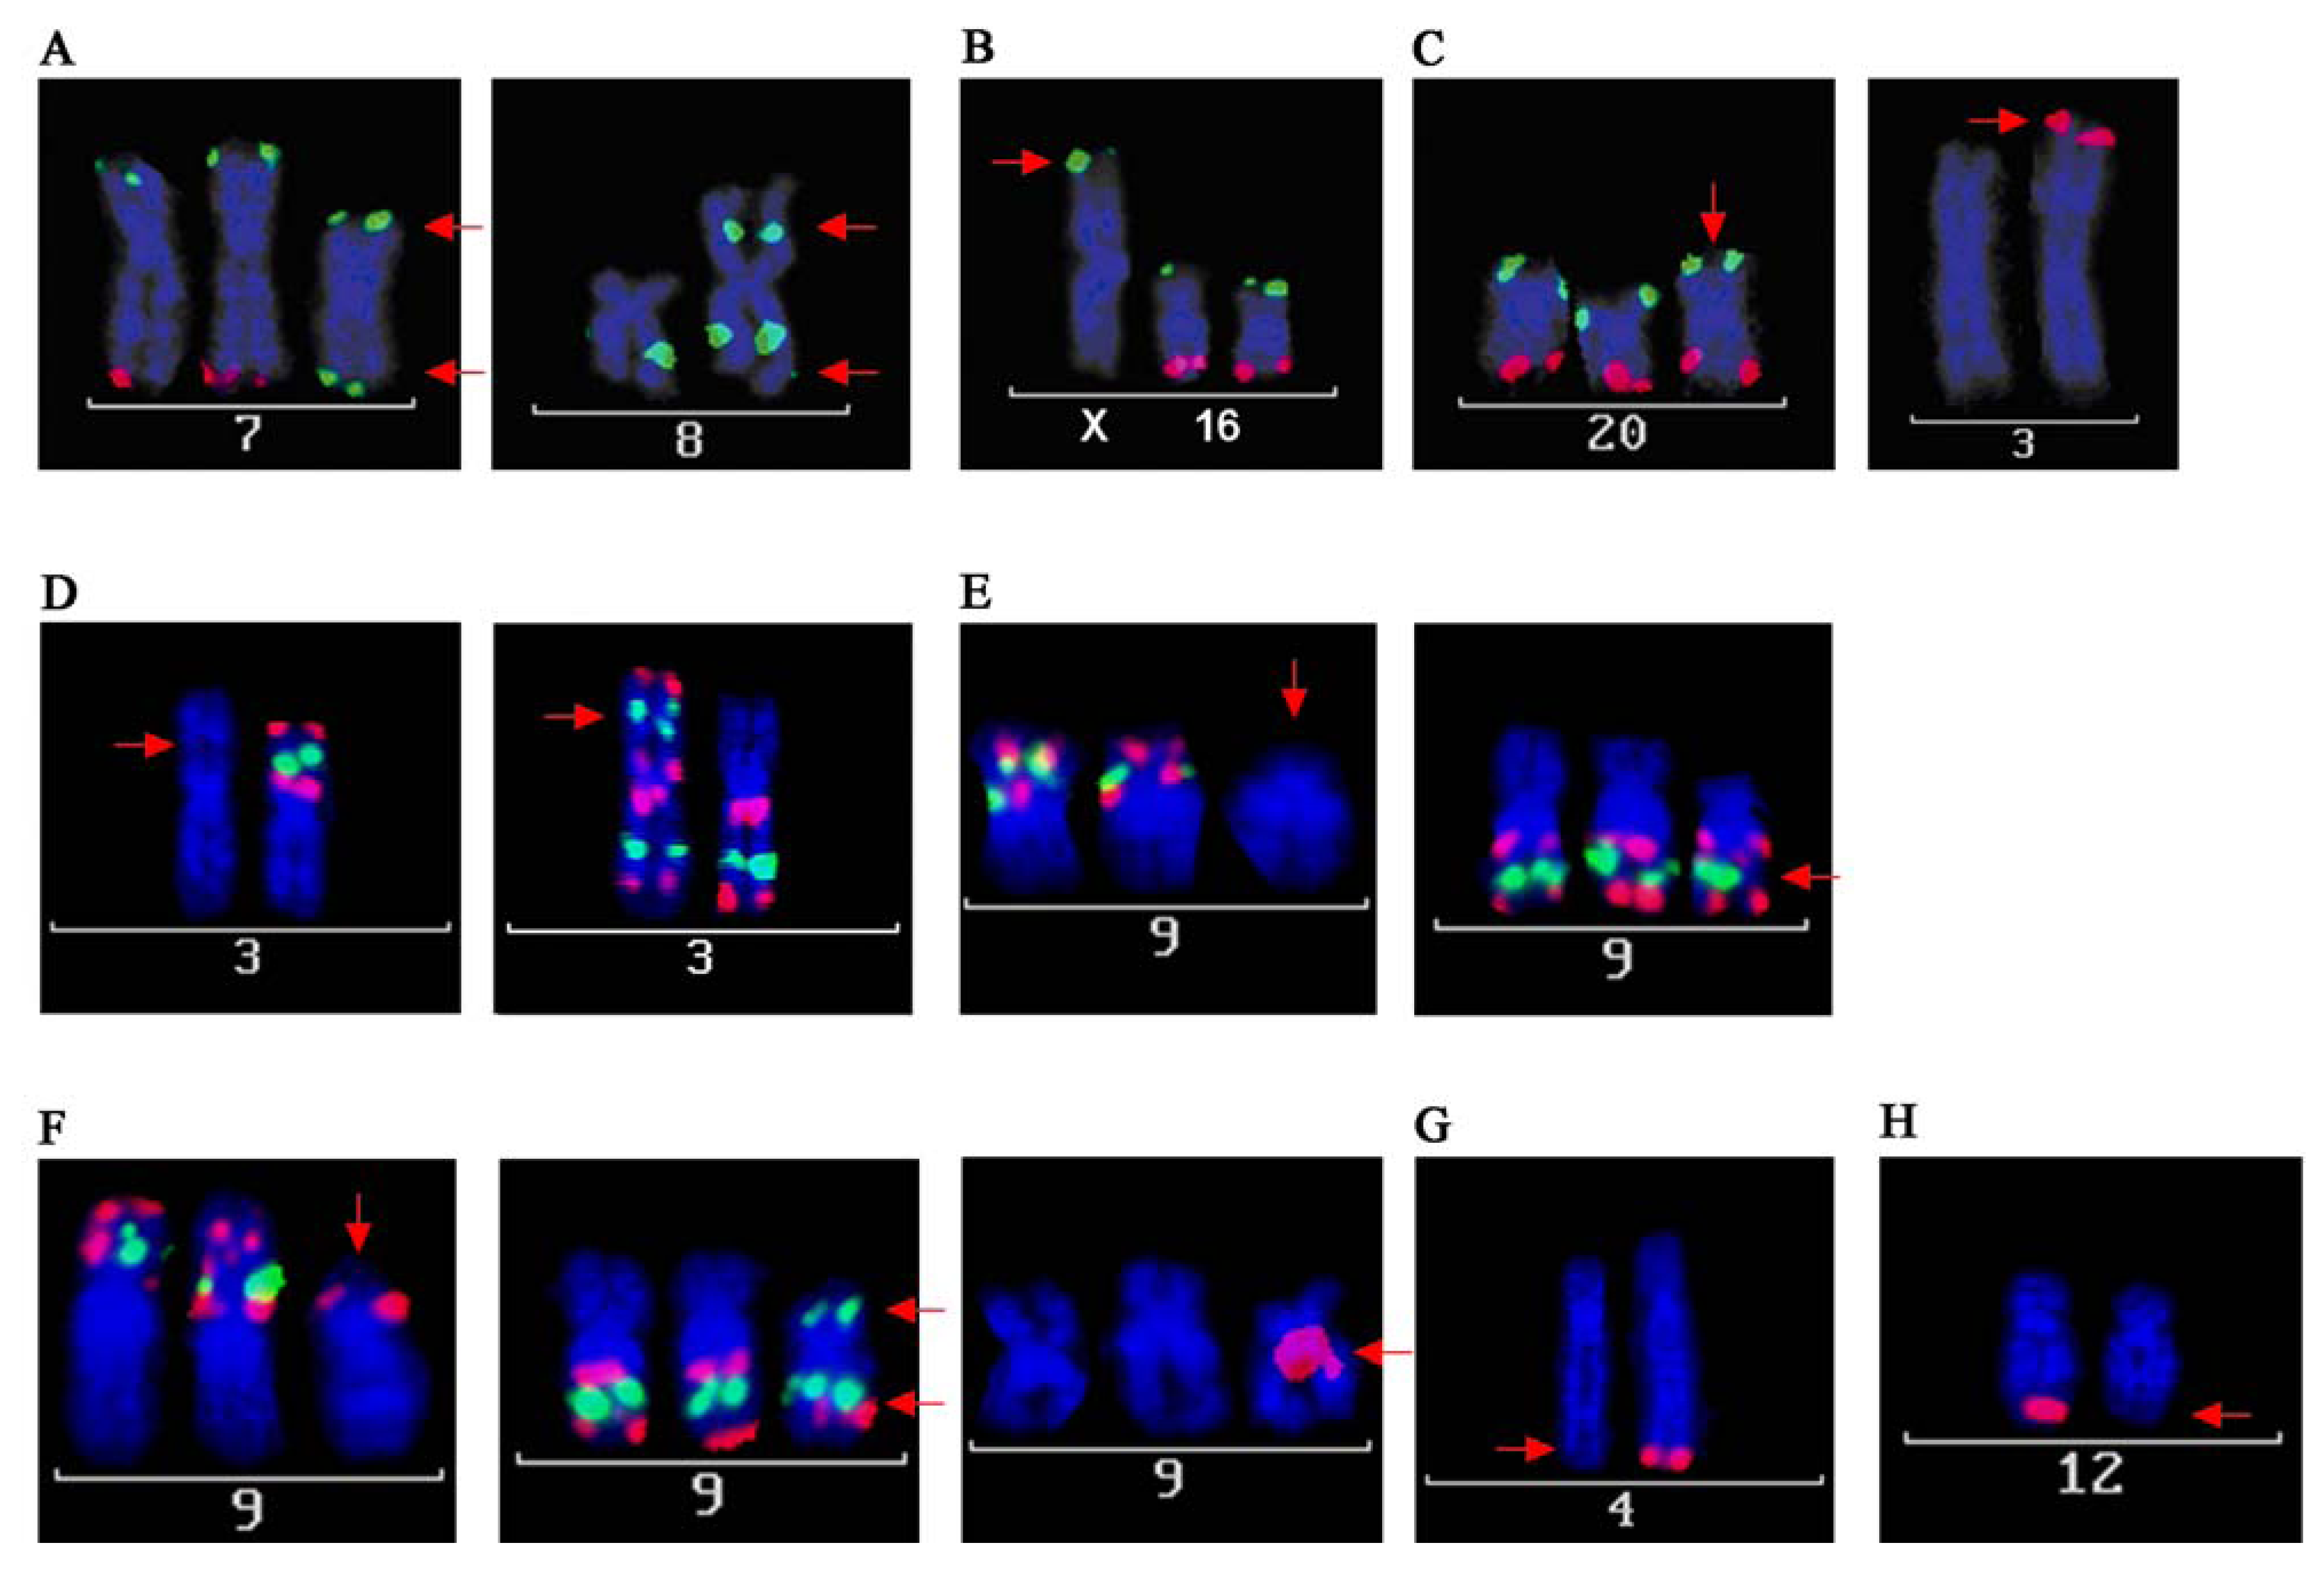
2.1.3. Fine-Mapping by FISH and Complementary Data Analysis


| BAC clone | Chromosome | Localization (bp)* | FISH Labeling |
|---|---|---|---|
| RP11-238A9 | 3p26.1 | 4516514-4676956 | Digoxigenin |
| RP11-424L2 | 3p22.1 | 41012714-41179560 | Biotin |
| RP11-220O14 | 3p12.3 | 77503140-77655193 | Digoxigenin |
| RP11-114I8 | 3q12.2 | 99997014-100148683 | Digoxigenin |
| RP11-30J14 | 3q25.1 | 151663244-151830918 | Biotin |
| RP11-392H18 | 3q28 | 190013809-190173313 | Digoxigenin |
| RP11-228f3 | 4q35.1 | 185636344-185802231 | Digoxigenin |
| RP11-20N02 | 7p22.3 | 758897-908887 | Biotin |
| RP11-664B05 | 7q36.3 | 158712708-158902209 | Digoxigenin |
| RP11-627A06 | 8q21.3 | 90721901-90763832 | Biotin |
| RP11-509J21 | 9p24.2 | 3544199-3705631 | Digoxigenin |
| RP11-33K8 | 9p21.3 | 24101721-24252438 | Biotin |
| RP11-614P24 | 9p13.2 | 37044198-37212970 | Digoxigenin |
| RP11-265B8 | 9q21.11 | 71568181-71737561 | Digoxigenin |
| RP11-23B15 | 9q22.33 | 100545008-100703779 | Biotin |
| RP11-269P11 | 9q33.3 | 128193295-128367188 | Digoxigenin |
| RP11-158L12 | 12q24.31 | 125491151-125667388 | Digoxigenin |
| RP11-22E02 | 16p13.13 | 12342021-12505232 | Biotin |
| RP11-466E19 | 16q23.1 | 77319681-77480278 | Digoxigenin |
| RP11-1076F02 | 18q11.2 | 19542825-19733692 | Digoxigenin |
| RP11-640A09 | 20p13 | 113369-267637 | Biotin |
| RP11-631L08 | 20q13.33 | 62410553-62589484 | Digoxigenin |
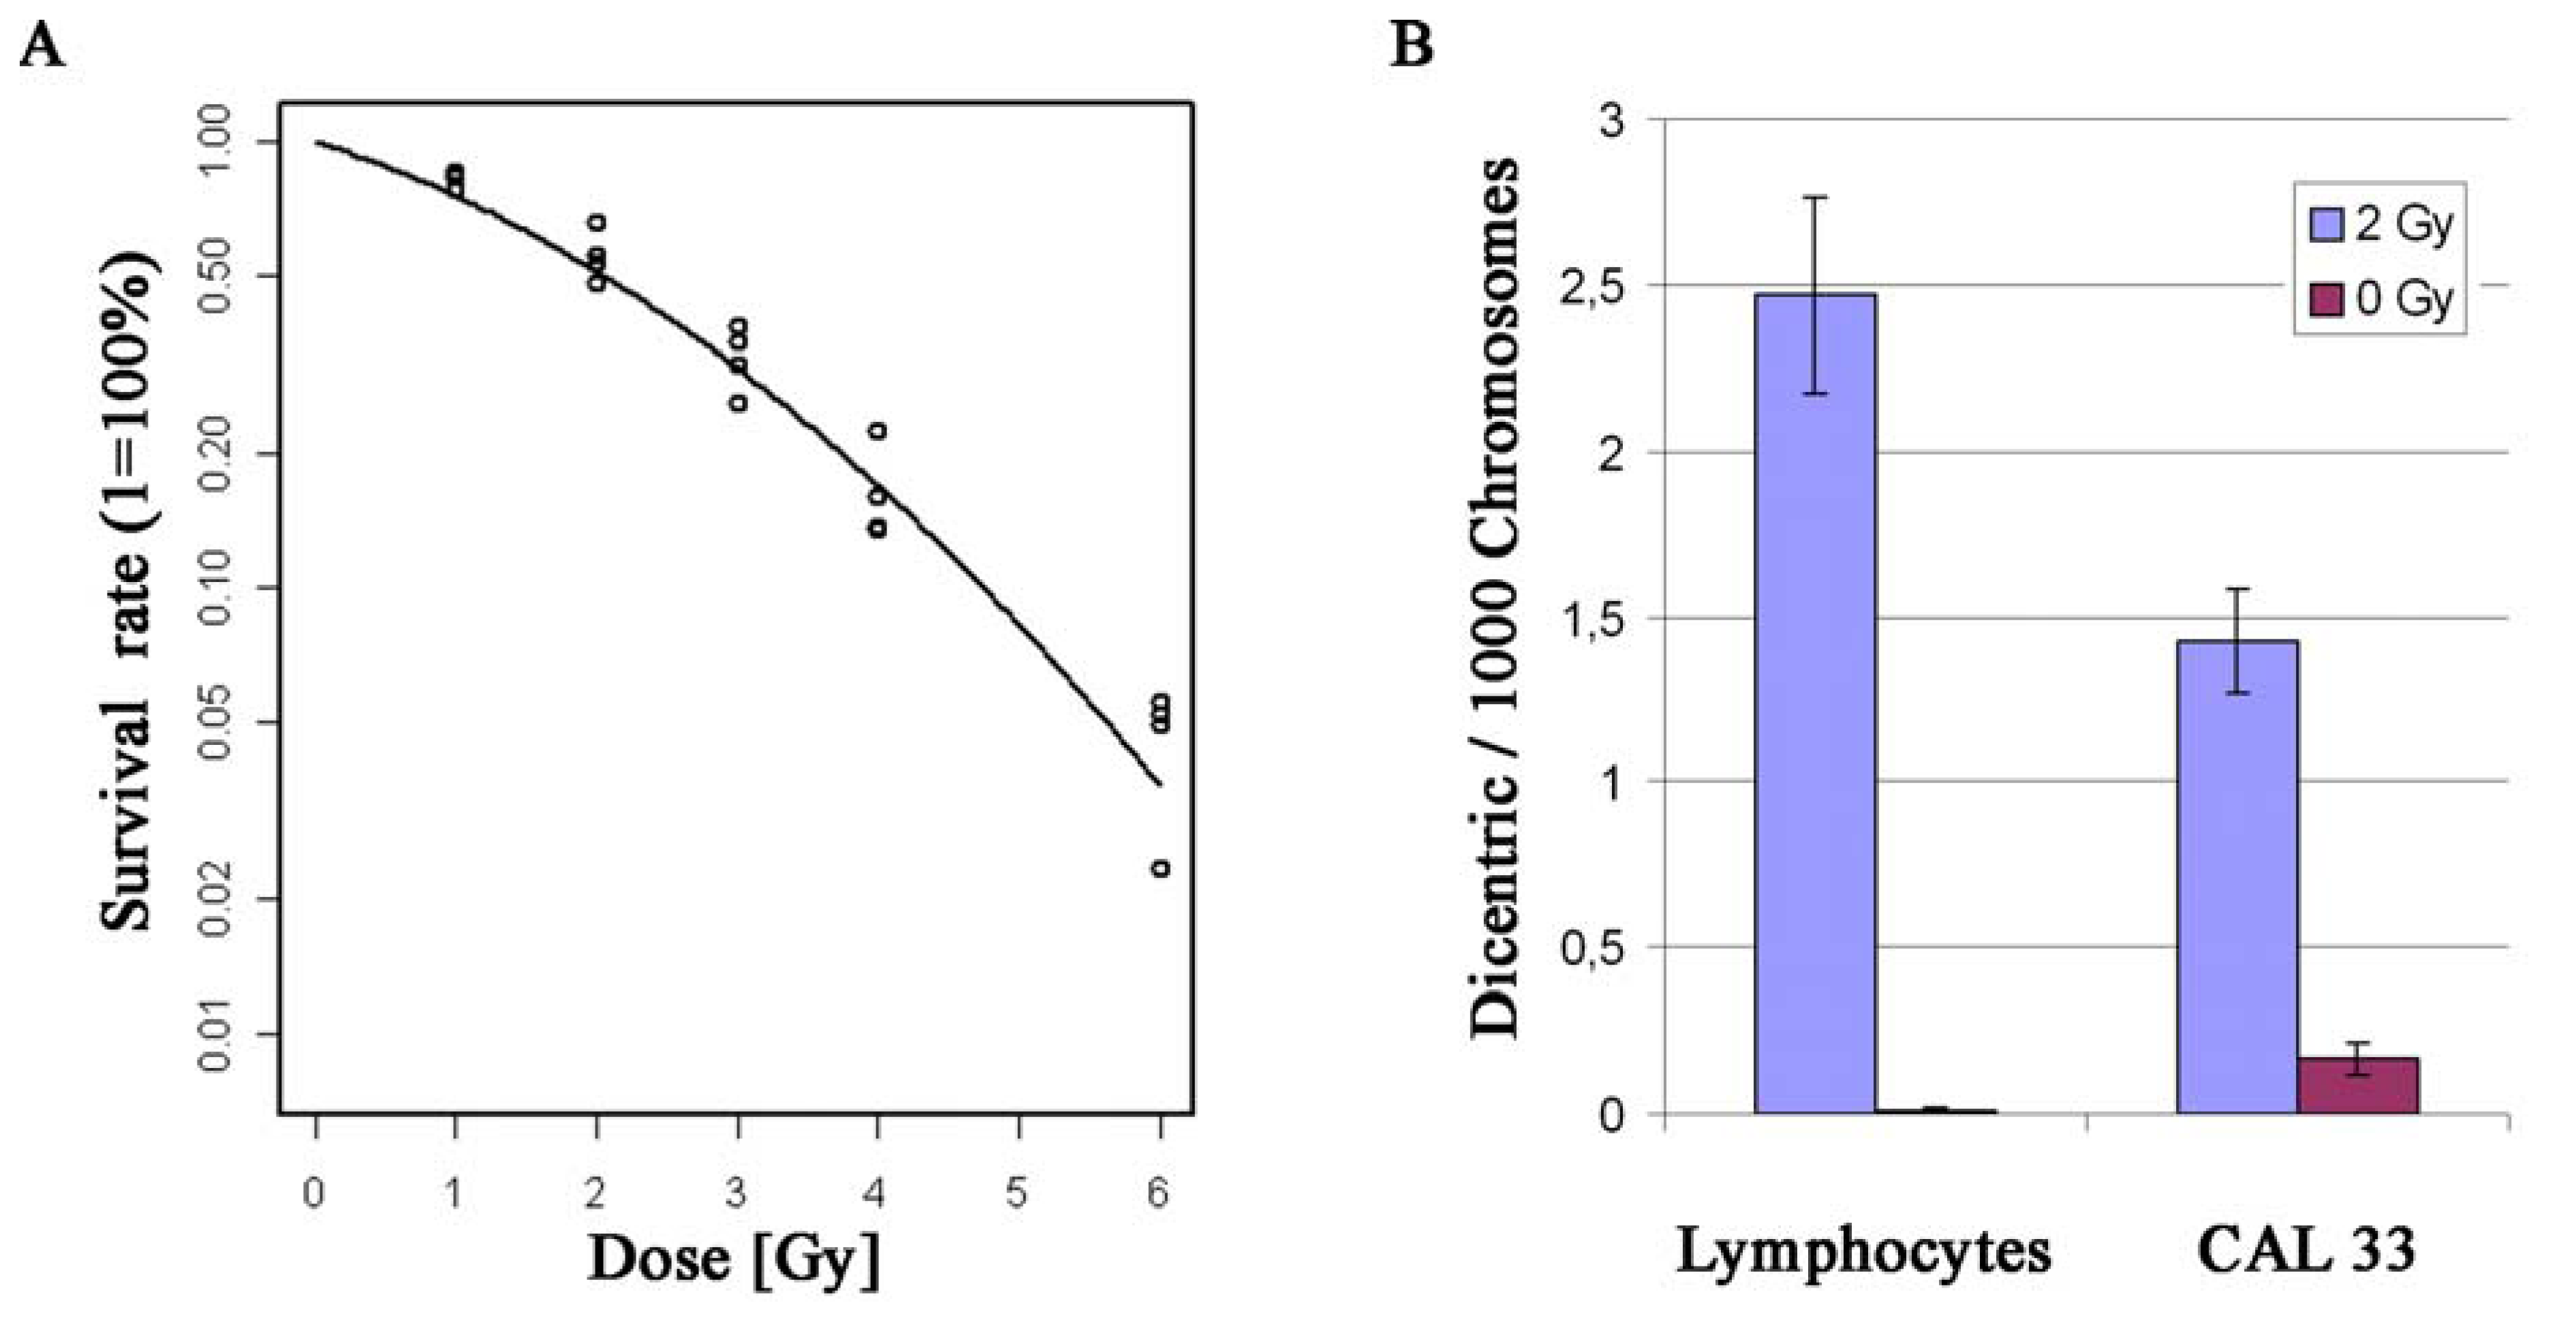
2.2. Establishment of a CAL 33 Cell Culture Model for Functional Studies of Radiosensitivity

3. Experimental Section
3.1. Cell Culture
3.2. Array CGH
3.3. Metaphase Preparation
3.4. Spektral Karyotyping (SKY)
3.5. FISH
3.6. Dicentric Chromosomes
3.7. Cell Survival Curves
3.8. Transfection of CAL 33
4. Conclusions
Acknowledgements
References and Notes
- Freier, K.; Hofele, C.; Knoepfle, K.; Gross, M.; Devens, F.; Dyckhoff, G.; Plinkert, P.; Lichter, P.; Herold-Mende, C. Cytogenetic characterization of head and neck squamous cell carcinoma cell lines as model systems for the functional analyses of tumor-associated genes. J. Oral Pathol. Med. 2010, 39, 382–389. [Google Scholar]
- Jemal, A.; Siegel, R.; Xu, J.; Ward, E. Cancer Statistics, 2010. CA Cancer J. Clin. 2010, 60, 277–300. [Google Scholar] [CrossRef]
- Burian, M.; Selzer, E.; Kornek, G.V. Fortschritte in der Behandlung von HNO-Tumoren. Onkologie 2002, 25, 26–30. [Google Scholar] [CrossRef]
- Boehm, A.; Wichmann, G.; Mozet, C.; Dietz, A. Current therapy options in recurrent head and neck cancer. HNO 2010, 58, 762–769. [Google Scholar] [CrossRef]
- American Cancer Society. Cancer Facts & Figures 2010. Available online: http://www.cancer.org/Research/CancerFactsFigures/CancerFactsFigures/cancer-facts-and-figures-2010 (accessed on 20 July 2010).
- Lehnerdt, G.; Hoffmann, T.K.; Mattheis, S.; Brandau, S.; Zeidler, R.; Lang, S. Diagnostic and prognostic biomarkers in head and neck squamous cell carcinoma. HNO 2010, 58, 713–723. [Google Scholar] [CrossRef]
- Chang, S.S.; Califano, J. Current status of biomarkers in head and neck cancer. J. Surg. Oncol. 2008, 97, 640–643. [Google Scholar] [CrossRef]
- Wreesmann, V.B.; Shi, W.; Thaler, H.T.; Poluri, A.; Kraus, D.H.; Pfister, D.; Shaha, A.R.; Shah, J.P.; Rao, P.H.; Singh, B. Identification of novel prognosticators of outcome in squamous cell carcinoma of the head and neck. J. Clin. Oncol. 2004, 22, 3965–3972. [Google Scholar] [CrossRef]
- Choi, P.; Chen, C. Genetic expression profiles and biologic pathway alterations in head and neck squamous cell carcinoma. Cancer 2005, 104, 1113–1128. [Google Scholar] [CrossRef]
- Unger, K.; Malisch, E.; Thomas, G.; Braselmann, H.; Walch, A.; Jackl, G.; Lewis, P.; Lengfelder, E.; Bogdanova, T.; Wienberg, J.; Zitzelsberger, H. Array CGH demonstrates characteristic aberration signatures in human papillary thyroid carcinomas governed by RET/PTC. Oncogene 2008, 27, 4592–4602. [Google Scholar] [CrossRef]
- Bauer, V.L.; Braselmann, H.; Henke, M.; Mattern, D.; Walch, A.; Unger, K.; Baudis, M.; Lassmann, S.; Huber, R.; Wienberg, J.; Werner, M.; Zitzelsberger, H.F. Chromosomal changes characterize head and neck cancer with poor prognosis. J. Mol. Med. 2008, 86, 1353–1365. [Google Scholar] [CrossRef]
- Lin, C.J.; Grandis, J.R.; Carey, T.E.; Gollin, S.M.; Whiteside, T.L.; Koch, W.M.; Ferris, R.L.; Lai, S.Y. Head and neck squamous cell carcinoma cell lines: established models and rationale for selection. Head Neck 2007, 29, 163–188. [Google Scholar] [CrossRef]
- Gioanni, J.; Fischel, J.L.; Lambert, J.C.; Demard, F.; Mazeau, C.; Zanghellini, E.; Ettore, F.; Formento, P.; Chauvel, P.; Lalanne, C.M.; et al. Two new human tumor cell lines derived from squamous cell carcinomas of the tongue: establishment, characterization and response to cytotoxic treatment. Eur. J. Cancer Clin. Oncol. 1988, 24, 1445–1455. [Google Scholar] [CrossRef]
- Todorovic, V.; Desai, B.V.; Eigenheer, R.A.; Yin, T.; Amargo, E.V.; Mrksich, M.; Green, K.J.; Patterson, M.J. Detection of differentially expressed basal cell proteins by mass spectrometry. Mol. Cell Proteomics 2010, 9, 351–361. [Google Scholar] [CrossRef]
- Magne, N.; Fischel, J.L.; Dubreuil, A.; Formento, P.; Ciccolini, J.; Formento, J.L.; Tiffon, C.; Renee, N.; Marchetti, S.; Etienne, M.C.; Milano, G. ZD1839 (Iressa) modifies the activity of key enzymes linked to fluoropyrimidine activity: rational basis for a new combination therapy with capecitabine. Clin. Cancer Res. 2003, 9, 4735–4742. [Google Scholar]
- Bozec, A.; Sudaka, A.; Toussan, N.; Fischel, J.L.; Etienne-Grimaldi, M.C.; Milano, G. Combination of sunitinib, cetuximab and irradiation in an orthotopic head and neck cancer model. Ann. Oncol. 2009, 20, 1703–1707. [Google Scholar] [CrossRef]
- Bozec, A.; Sudaka, A.; Fischel, J.L.; Brunstein, M.C.; Etienne-Grimaldi, M.C.; Milano, G. Combined effects of bevacizumab with erlotinib and irradiation: a preclinical study on a head and neck cancer orthotopic model. Br. J.Cancer 2008, 99, 93–99. [Google Scholar] [CrossRef]
- Bozec, A.; Lassalle, S.; Gugenheim, J.; Fischel, J.L.; Formento, P.; Hofman, P.; Milano, G. Enhanced tumour antiangiogenic effects when combining gefitinib with the antivascular agent ZD6126. Br. J. Cancer 2006, 95, 722–728. [Google Scholar] [CrossRef]
- Bozec, A.; Formento, P.; Lassalle, S.; Lippens, C.; Hofman, P.; Milano, G. Dual inhibition of EGFR and VEGFR pathways in combination with irradiation: antitumour supra-additive effects on human head and neck cancer xenografts. Br. J. Cancer 2007, 97, 65–72. [Google Scholar] [CrossRef]
- Schrock, E.; du Manoir, S.; Veldman, T.; Schoell, B.; Wienberg, J.; Ferguson-Smith, M.A.; Ning, Y.; Ledbetter, D.H.; Bar-Am, I.; Soenksen, D.; Garini, Y.; Ried, T. Multicolor spectral karyotyping of human chromosomes. Science 1996, 273, 494–497. [Google Scholar]
- Miyai, T.; Maruyama, Y.; Osakabe, Y.; Nejima, R.; Miyata, K.; Amano, S. Karyotype changes in cultured human corneal endothelial cells. Mol. Vis. 2008, 14, 942–950. [Google Scholar]
- Mamaeva, S.E. Karyotypic evolution of cells in culture: a new concept. Int. Rev. Cytol. 1998, 178, 1–40. [Google Scholar] [CrossRef]
- Kerler, R.; Rabes, H.M. Karyotype evolution of the clonal rat liver cell line CL 52 during progression in vitro and in vivo. Cancer Genet. Cytogenet. 1996, 87, 140–147. [Google Scholar] [CrossRef]
- Fitzgerald, P.H.; Morris, C.M.; Rosman, I.; Archer, S.A.; Hollings, P.E. Karyotypic evolution in a B-cell lymphoma. Cancer Genet. Cytogenet. 1987, 24, 271–279. [Google Scholar] [CrossRef]
- Bahia, H.; Ashman, J.N.; Cawkwell, L.; Lind, M.; Monson, J.R.; Drew, P.J.; Greenman, J. Karyotypic variation between independently cultured strains of the cell line MCF-7 identified by multicolour fluorescence in situ hybridization. Int. J. Oncol. 2002, 20, 489–494. [Google Scholar]
- Watson, M.B.; Greenman, J.; Drew, P.J.; Lind, M.J.; Cawkwell, L. Variation between independently cultured strains of the MDA-MB-231 breast cancer cell line identified by multicolour fluorescence in situ hybridisation. Cancer Ther. 2004, 2, 167–172. [Google Scholar]
- Naim, V.; Rosselli, F. The FANC pathway and mitosis: A replication legacy. Cell Cycle 2009, 8, 2907–2911. [Google Scholar] [CrossRef]
- D’Andrea, A.D.; Grompe, M. The Fanconi anaemia/BRCA pathway. Nat. Rev. Cancer 2003, 3, 23–34. [Google Scholar] [CrossRef]
- Wreesmann, V.B.; Estilo, C.; Eisele, D.W.; Singh, B.; Wang, S.J. Downregulation of Fanconi anemia genes in sporadic head and neck squamous cell carcinoma. ORL J. Otorhinolaryngol Relat. Spec. 2007, 69, 218–225. [Google Scholar] [CrossRef]
- Squire, J.A.; Bayani, J.; Luk, C.; Unwin, L.; Tokunaga, J.; MacMillan, C.; Irish, J.; Brown, D.; Gullane, P.; Kamel-Reid, S. Molecular cytogenetic analysis of head and neck squamous cell carcinoma: By comparative genomic hybridization, spectral karyotyping, and expression array analysis. Head Neck 2002, 24, 874–887. [Google Scholar] [CrossRef]
- Singh, B.; Gogineni, S.K.; Sacks, P.G.; Shaha, A.R.; Shah, J.P.; Stoffel, A.; Rao, P.H. Molecular cytogenetic characterization of head and neck squamous cell carcinoma and refinement of 3q amplification. Cancer Res. 2001, 61, 4506–4513. [Google Scholar]
- Akervall, J. Genomic screening of head and neck cancer and its implications for therapy planning. Eur. Arch. Otorhinolaryngol 2006, 263, 297–304. [Google Scholar] [CrossRef]
- Kallioniemi, A.; Kallioniemi, O.P.; Sudar, D.; Rutovitz, D.; Gray, J.W.; Waldman, F.; Pinkel, D. Comparative genomic hybridization for molecular cytogenetic analysis of solid tumors. Science 1992, 258, 818–821. [Google Scholar]
- Pinkel, D.; Segraves, R.; Sudar, D.; Clark, S.; Poole, I.; Kowbel, D.; Collins, C.; Kuo, W.L.; Chen, C.; Zhai, Y.; Dairkee, S.H.; Ljung, B.M.; Gray, J.W.; Albertson, D.G. High resolution analysis of DNA copy number variation using comparative genomic hybridization to microarrays. Nat. Genet. 1998, 20, 207–211. [Google Scholar] [CrossRef]
- Fiegler, H.; Carter, N.P. Genomic array technology. Methods Cell Biol. 2004, 75, 769–785. [Google Scholar] [CrossRef]
- Baudis, M.; Cleary, M.L. Progenetix.net: an online repository for molecular cytogenetic aberration data. Bioinformatics 2001, 17, 1228–1229. [Google Scholar] [CrossRef]
- Patmore, H.S.; Cawkwell, L.; Stafford, N.D.; Greenman, J. Unraveling the chromosomal aberrations of head and neck squamous cell carcinoma: a review. Ann. Surg. Oncol. 2005, 12, 831–842. [Google Scholar] [CrossRef]
- Zitzelsberger, H.; Hieber, L.; Richter, H.; Unger, K.; Briscoe, C.V.; Peddie, C.; Riches, A. Gene amplification of atypical PKC-binding PARD3 in radiation-transformed neoplastic retinal pigment epithelial cell lines. Gene. Chromosome. Canc. 2004, 40, 55–59. [Google Scholar] [CrossRef]
- Zitzelsberger, H.; Bauer, V.; Thomas, G.; Unger, K. Molecular rearrangements in papillary thyroid carcinomas. Clin. Chim. Acta 2010, 411, 301–308. [Google Scholar] [CrossRef]
- Wiech, T.; Nikolopoulos, E.; Weis, R.; Langer, R.; Bartholome, K.; Timmer, J.; Walch, A.K.; Hofler, H.; Werner, M. Genome-wide analysis of genetic alterations in Barrett's adenocarcinoma using single nucleotide polymorphism arrays. Lab. Invest. 2009, 89, 385–397. [Google Scholar] [CrossRef]
- Albrecht, B.; Hausmann, M.; Zitzelsberger, H.; Stein, H.; Siewert, J.R.; Hopt, U.; Langer, R.; Hofler, H.; Werner, M.; Walch, A. Array-based comparative genomic hybridization for the detection of DNA sequence copy number changes in Barrett’s adenocarcinoma. J. Pathol. 2004, 203, 780–788. [Google Scholar] [CrossRef]
- Singh, B.; Gogineni, S.; Goberdhan, A.; Sacks, P.; Shaha, A.; Shah, J.; Rao, P. Spectral karyotyping analysis of head and neck squamous cell carcinoma. Laryngoscope 2001, 111, 1545–1550. [Google Scholar] [CrossRef]
- Jin, Y.; Jin, C.; Wennerberg, J.; Hoglund, M.; Mertens, F. Cytogenetic and fluorescence in situ hybridization characterization of chromosome 8 rearrangements in head and neck squamous cell carcinomas. Cancer Genet. Cytogenet. 2001, 130, 111–117. [Google Scholar]
- Bockmuhl, U.; Petersen, I. DNA ploidy and chromosomal alterations in head and neck squamous cell carcinoma. Virchows Arch. 2002, 441, 541–550. [Google Scholar] [CrossRef]
- Akervall, J.; Guo, X.; Qian, C.N.; Schoumans, J.; Leeser, B.; Kort, E.; Cole, A.; Resau, J.; Bradford, C.; Carey, T.; Wennerberg, J.; Anderson, H.; Tennvall, J.; Teh, B.T. Genetic and expression profiles of squamous cell carcinoma of the head and neck correlate with cisplatin sensitivity and resistance in cell lines and patients. Clin. Cancer Res. 2004, 10, 8204–8213. [Google Scholar] [CrossRef]
- Bockmuhl, U.; Schwendel, A.; Dietel, M.; Petersen, I. Distinct patterns of chromosomal alterations in high- and low-grade head and neck squamous cell carcinomas. Cancer Res. 1996, 56, 5325–5329. [Google Scholar]
- Huang, Q.; Yu, G.P.; McCormick, S.A.; Mo, J.; Datta, B.; Mahimkar, M.; Lazarus, P.; Schaffer, A.A.; Desper, R.; Schantz, S.P. Genetic differences detected by comparative genomic hybridization in head and neck squamous cell carcinomas from different tumor sites: construction of oncogenetic trees for tumor progression. Gene. Chromosome. Canc. 2002, 34, 224–233. [Google Scholar] [CrossRef]
- Liebertz, D.J.; Lechner, M.G.; Masood, R.; Sinha, U.K.; Han, J.; Puri, R.K.; Correa, A.J.; Epstein, A.L. Establishment and Characterization of a Novel Head and Neck Squamous Cell Carcinoma Cell Line USC-HN1. Head Neck Oncol. 2010, 2, 5. [Google Scholar] [CrossRef]
- Yamaguchi, K.; Okami, K.; Hibi, K.; Wehage, S.L.; Jen, J.; Sidransky, D. Mutation analysis of hBUB1 in aneuploid HNSCC and lung cancer cell lines. Cancer Lett. 1999, 139, 183–187. [Google Scholar] [CrossRef]
- Reiter, R.; Gais, P.; Steuer-Vogt, M.K.; Boulesteix, A.L.; Deutschle, T.; Hampel, R.; Wagenpfeil, S.; Rauser, S.; Walch, A.; Bink, K.; Jutting, U.; Neff, F.; Arnold, W.; Hofler, H.; Pickhard, A. Centrosome abnormalities in head and neck squamous cell carcinoma (HNSCC). Acta Otolaryngol. 2009, 129, 205–213. [Google Scholar] [CrossRef]
- Bockmuhl, U.; Petersen, S.; Schmidt, S.; Wolf, G.; Jahnke, V.; Dietel, M.; Petersen, I. Patterns of chromosomal alterations in metastasizing and nonmetastasizing primary head and neck carcinomas. Cancer Res. 1997, 57, 5213–5216. [Google Scholar]
- Califano, J.; van der Riet, P.; Westra, W.; Nawroz, H.; Clayman, G.; Piantadosi, S.; Corio, R.; Lee, D.; Greenberg, B.; Koch, W.; Sidransky, D. Genetic progression model for head and neck cancer: Implications for field cancerization. Cancer Res. 1996, 56, 2488–2492. [Google Scholar]
- Speicher, M.R.; Carter, N.P. The new cytogenetics: Blurring the boundaries with molecular biology. Nat. Rev. Genet. 2005, 6, 782–792. [Google Scholar] [CrossRef]
- Worsham, M.J.; Pals, G.; Schouten, J.P.; Van Spaendonk, R.M.; Concus, A.; Carey, T.E.; Benninger, M.S. Delineating genetic pathways of disease progression in head and neck squamous cell carcinoma. Arch. Otolaryngol. Head Neck Surg. 2003, 129, 702–708. [Google Scholar] [CrossRef]
- Kang, Y.H.; Park, J.E.; Yu, L.R.; Soung, N.K.; Yun, S.M.; Bang, J.K.; Seong, Y.S.; Yu, H.; Garfield, S.; Veenstra, T.D.; Lee, K.S. Self-regulated Plk1 recruitment to kinetochores by the Plk1-PBIP1 interaction is critical for proper chromosome segregation. Mol. Cell. 2006, 24, 409–422. [Google Scholar] [CrossRef]
- Foltz, D.R.; Jansen, L.E.; Black, B.E.; Bailey, A.O.; Yates, J.R., 3rd; Cleveland, D.W. The human CENP-A centromeric nucleosome-associated complex. Nat. Cell Biol. 2006, 8, 458–469. [Google Scholar] [CrossRef]
- Lin, L.; Wu, Y.; Li, C.; Zhao, S. Cloning, tissue expression pattern, and chromosome location of a novel human gene BRI3B. Biochem. Genet. 2001, 39, 369–377. [Google Scholar] [CrossRef]
- Yamazaki, T.; Sasaki, N.; Nishi, M.; Yamazaki, D.; Ikeda, A.; Okuno, Y.; Komazaki, S.; Takeshima, H. Augmentation of drug-induced cell death by ER protein BRI3BP. Biochem. Biophys. Res. Commun. 2007, 362, 971–975. [Google Scholar] [CrossRef]
- Lacroix, M. Persistent use of “false” cell lines. Int. J. Cancer 2008, 122, 1–4. [Google Scholar] [CrossRef]
- Masters, J.R. HeLa cells 50 years on: The good, the bad and the ugly. Nat. Rev. Cancer 2002, 2, 315–319. [Google Scholar] [CrossRef]
- Schweppe, R.E.; Klopper, J.P.; Korch, C.; Pugazhenthi, U.; Benezra, M.; Knauf, J.A.; Fagin, J.A.; Marlow, L.A.; Copland, J.A.; Smallridge, R.C.; Haugen, B.R. Deoxyribonucleic acid profiling analysis of 40 human thyroid cancer cell lines reveals cross-contamination resulting in cell line redundancy and misidentification. J. Clin. Endocrinol. Metab. 2008, 93, 4331–4341. [Google Scholar] [CrossRef]
- Vaidya, M.M.; Borges, A.M.; Pradhan, S.A.; Bhisey, A.N. Cytokeratin expression in squamous cell carcinomas of the tongue and alveolar mucosa. Eur. J. Cancer B Oral Oncol. 1996, 32B, 333–336. [Google Scholar]
- Walch, A.; Helmholtz Zentrum München, Institute of Pathology, Neuherberg, Germany. Personal communication, 2010.
- Sacks, P.G. Cell, tissue and organ culture as in vitro models to study the biology of squamous cell carcinomas of the head and neck. Cancer Metastasis Rev. 1996, 15, 27–51. [Google Scholar]
- Neve, R.M.; Chin, K.; Fridlyand, J.; Yeh, J.; Baehner, F.L.; Fevr, T.; Clark, L.; Bayani, N.; Coppe, J.P.; Tong, F.; Speed, T.; Spellman, P.T.; DeVries, S.; Lapuk, A.; Wang, N.J.; Kuo, W.L.; Stilwell, J.L.; Pinkel, D.; Albertson, D.G.; Waldman, F.M.; McCormick, F.; Dickson, R.B.; Johnson, M.D.; Lippman, M.; Ethier, S.; Gazdar, A.; Gray, J.W. A collection of breast cancer cell lines for the study of functionally distinct cancer subtypes. Cancer Cell 2006, 10, 515–527. [Google Scholar] [CrossRef]
- Sobin, L.H.; Wittekind, C. International Union against Cancer. Head and neck tumours. In TNM: Classification of Malignant Tumours, 6th ed.; Wiley-Liss: New York, NY, USA, 2002; pp. 19–56. [Google Scholar]
- Ragin, C.C.; Modugno, F.; Gollin, S.M. The epidemiology and risk factors of head and neck cancer: a focus on human papillomavirus. J. Dent. Res. 2007, 86, 104–114. [Google Scholar] [CrossRef]
- Pai, S.I.; Westra, W.H. Molecular pathology of head and neck cancer: Implications for diagnosis, prognosis, and treatment. Annu. Rev. Pathol. 2009, 4, 49–70. [Google Scholar] [CrossRef]
- Wang, X.; Schneider, A. HIF-2alpha-mediated activation of the epidermal growth factor receptor potentiates head and neck cancer cell migration in response to hypoxia. Carcinogenesis 2010, 31, 1202–1210. [Google Scholar] [CrossRef]
- Furuse, S.; Adachi, M.; Ijichi, K.; Ohta, S.; Torigoe, S.; Nakazawa, M.; Miura, S.; Mitsudo, K.; Tohnai, I. Pre-radiation enhances the cytotoxicity of docetaxel in head and neck squamous cell carcinoma cells. Oncol. Rep. 2010, 23, 1339–1343. [Google Scholar]
- Cai, C.; Bottcher, M.C.; Werner, J.A.; Mandic, R. Differential expression of VEGF121, VEGF165 and VEGF189 in angiomas and squamous cell carcinoma cell lines of the head and neck. Anticancer Res. 2010, 30, 805–810. [Google Scholar]
- Pekkola-Heino, K.; Jaakkola, M.; Kulmala, J.; Grenman, R. Comparison of cellular radiosensitivity between different localizations of head and neck squamous-cell carcinoma. J. Cancer Res. Clin. Oncol. 1995, 121, 452–456. [Google Scholar] [CrossRef]
- Gerster, K.; Shi, W.; Ng, B.; Yue, S.; Ito, E.; Waldron, J.; Gilbert, R.; Liu, F.F. Targeting polo-like kinase 1 enhances radiation efficacy for head-and-neck squamous cell carcinoma. Int. J. Radiat. Oncol. Biol. Phys. 2010, 77, 253–260. [Google Scholar] [CrossRef]
- Hall, E.J. Radiobiology for the Radiologist, 5th ed.; Lippincott Williams & Wilkins: Philadelphia, PA, USA, 2000; p. 588S. [Google Scholar]
- Amundson, S.A.; Do, K.T.; Vinikoor, L.C.; Lee, R.A.; Koch-Paiz, C.A.; Ahn, J.; Reimers, M.; Chen, Y.; Scudiero, D.A.; Weinstein, J.N.; Trent, J.M.; Bittner, M.L.; Meltzer, P.S.; Fornace, A.J., Jr. Integrating global gene expression and radiation survival parameters across the 60 cell lines of the National Cancer Institute Anticancer Drug Screen. Cancer Res. 2008, 68, 415–424. [Google Scholar]
- Bauchinger, M.; Schmid, E.; Braselmann, H. Time-course of translocation and dicentric frequencies in a radiation accident case. Int. J. Radiat. Biol. 2001, 77, 553–557. [Google Scholar] [CrossRef]
- Kutlaca, R.; Alder, S.J.; Seshadri, R.S.; Morley, A.A. Radiation sensitivity of human lymphocytes. Mutat. Res. 1982, 94, 125–131. [Google Scholar] [CrossRef]
- Seshadri, R.; Matthews, C.; Morley, A.A. Radiation sensitivity of human malignant lymphocytes. Acta Radiol. Oncol. 1985, 24, 411–414. [Google Scholar] [CrossRef]
- Schmid, E.; Roos, H.; Sauter, W.; Rickinger, A.; Jaehnert, I.; Eckardt-Schupp, F. Chromosome analysis of the differential radiosensitivity of an Epstein-Barr virus (EBV)-transformed B cell line and B and T lymphocytes from the same blood donor. Int. J. Radiat. Biol. 2010, 86, 47–55. [Google Scholar] [CrossRef]
- Bauchinger, M.; Schmid, E.; Braselmann, H. Cell survival and radiation induced chromosome aberrations. II. Experimental findings in human lymphocytes analysed in first and second post-irradiation metaphases. Radiat. Environ. Biophys. 1986, 25, 253–260. [Google Scholar] [CrossRef]
- Neuvial, P.; Hupe, P.; Brito, I.; Liva, S.; Manie, E.; Brennetot, C.; Radvanyi, F.; Aurias, A.; Barillot, E. Spatial normalization of array-CGH data. BMC Bioinf. 2006, 7, 264. [Google Scholar] [CrossRef]
- Hupe, P.; Stransky, N.; Thiery, J.P.; Radvanyi, F.; Barillot, E. Analysis of array CGH data: from signal ratio to gain and loss of DNA regions. Bioinformatics 2004, 20, 3413–3422. [Google Scholar]
- La Rosa, P.; Viara, E.; Hupe, P.; Pierron, G.; Liva, S.; Neuvial, P.; Brito, I.; Lair, S.; Servant, N.; Robine, N.; Manie, E.; Brennetot, C.; Janoueix-Lerosey, I.; Raynal, V.; Gruel, N.; Rouveirol, C.; Stransky, N.; Stern, M.H.; Delattre, O.; Aurias, A.; Radvanyi, F.; Barillot, E. VAMP: visualization and analysis of array-CGH, transcriptome and other molecular profiles. Bioinformatics 2006, 22, 2066–2073. [Google Scholar] [CrossRef]
- Zitzelsberger, H.; Lehmann, L.; Hieber, L.; Weier, H.U.; Janish, C.; Fung, J.; Negele, T.; Spelsberg, F.; Lengfelder, E.; Demidchik, E.P.; Salassidis, K.; Kellerer, A.M.; Werner, M.; Bauchinger, M. Cytogenetic changes in radiation-induced tumors of the thyroid. Cancer Res. 1999, 59, 135–140. [Google Scholar]
- Unger, K.; Zitzelsberger, H.; Salvatore, G.; Santoro, M.; Bogdanova, T.; Braselmann, H.; Kastner, P.; Zurnadzhy, L.; Tronko, N.; Hutzler, P.; Thomas, G. Heterogeneity in the distribution of RET/PTC rearrangements within individual post-Chernobyl papillary thyroid carcinomas. J. Clin. Endocrinol. Metab. 2004, 89, 4272–4279. [Google Scholar] [CrossRef]
- Perry, P.; Wolff, S. New Giemsa method for the differential staining of sister chromatids. Nature 1974, 251, 156–158. [Google Scholar] [CrossRef]
- Puck, T.T.; Marcus, P.I.; Cieciura, S.J. Clonal growth of mammalian cells in vitro; growth characteristics of colonies from single HeLa cells with and without a feeder layer. J. Exp. Med. 1956, 103, 273–283. [Google Scholar] [CrossRef]
© 2010 by the authors; licensee MDPI, Basel, Switzerland. This article is an open access article distributed under the terms and conditions of the Creative Commons Attribution license (http://creativecommons.org/licenses/by/3.0/).
Share and Cite
Bauer, V.L.; Hieber, L.; Schaeffner, Q.; Weber, J.; Braselmann, H.; Huber, R.; Walch, A.; Zitzelsberger, H. Establishment and Molecular Cytogenetic Characterization of a Cell Culture Model of Head and Neck Squamous Cell Carcinoma (HNSCC). Genes 2010, 1, 388-412. https://doi.org/10.3390/genes1030388
Bauer VL, Hieber L, Schaeffner Q, Weber J, Braselmann H, Huber R, Walch A, Zitzelsberger H. Establishment and Molecular Cytogenetic Characterization of a Cell Culture Model of Head and Neck Squamous Cell Carcinoma (HNSCC). Genes. 2010; 1(3):388-412. https://doi.org/10.3390/genes1030388
Chicago/Turabian StyleBauer, Verena L., Ludwig Hieber, Quirin Schaeffner, Johannes Weber, Herbert Braselmann, Reinhard Huber, Axel Walch, and Horst Zitzelsberger. 2010. "Establishment and Molecular Cytogenetic Characterization of a Cell Culture Model of Head and Neck Squamous Cell Carcinoma (HNSCC)" Genes 1, no. 3: 388-412. https://doi.org/10.3390/genes1030388