Aberrant Single Exon Skipping is not Altered by Age in Exons of NF1, RABAC1, AATF or PCGF2 in Human Blood Cells and Fibroblasts

Abstract
: In human pre-mRNA splicing, infrequent errors occur resulting in erroneous splice products as shown in a genome-wide approach. One characteristic subgroup consists of products lacking one cassette exon. The noise in the splicing process, represented by those misspliced products, can be increased by cold shock treatment or by inhibiting the nonsense mediated decay. Here, we investigated whether the splicing noise frequency increases with age in vivo in peripheral bloods cells or in vitro in cultured and aged fibroblasts from healthy donors. Splicing noise frequency was measured for four erroneously skipped NF1 exons and one exon of RABAC1, AATF and PCGF2 by RT-qPCR. Measurements were validated in cultured fibroblasts treated with cold shock or puromycin. Intragenic but not interpersonal differences were detected in splicing noise frequencies in vivo in peripheral blood cells of 11 healthy donors (15 y–85 y) and in in vitro senescent fibroblasts from three further donors. No correlation to the age of the donors was found in the splicing noise frequencies. Our data demonstrates that splicing error frequencies are not altered by age in peripheral blood cells or in vitro aged fibroblasts in the tested exons of the four investigated genes, indicating a high importance of correct splicing in these proliferating aged cells.1. Introduction
Cotranscriptional splicing of human pre-mRNA involves the interaction of several distinct protein factors and 5 snRNAs with sequences specific to the pre-mRNA [1]. The U1 and U2 snRNAs comprise the U1 respective U2 snRNP. U1 binds to the 5' splice site, the U2 snRNP complexes are directed to the branch point by U2AF which binds to the polypyrimidin tract. Further spliceosomal compounds (U4, U5, U6) join together with the RNA-bound complexes and SR proteins to build the spliceosome. Two transesterification reactions lead to the release of the intron and to the ligation of the exons [2]. Errors resulting for example in transcripts lacking one or more cassette exons rarely occur in splicing [3]. Such erroneous transcripts were first observed in low temperature (cold shock) treated peripheral blood cells whilst screening for NF1 mutations at RNA level [4,5]. In a systemic approach using real-time quantitative PCR (RT-qPCR), these transcripts were found in all tested NF1 exons at levels varying between 0.007 and about 2% of the total amount of constitutive spliced (wildtype) NF1 transcripts in collected tissues [6]. Erroneous transcripts were also found in the tumor suppressor genes NF2 and TSC2 both in cultured cells and tissues. The levels of these erroneous transcripts increased in cells cultured in media with a low pH or at high temperature, conditions found in tumor tissue [7]. In addition, multi-exon skipping was found at very low frequencies in NF1, TSC2, RPL23 and UBA52 in cultured human cells [1,6,7].
It is debated whether these erroneous transcripts (splicing noise) are caused by a stochastic missing exon recognition, insufficient fidelity of transcription, inaccuracy of the splicing machinery or somatic mutations in single cells in splice regulating sequences or genes such as SC2 [1,6-8]. In alternative splicing, the recognition of exon splice sites depends on splice site strength, intron length and a sufficient concentration of splice-relevant proteins such as SC2 [8]. SC2 and SMN (a protein whose expression is decreased in spinal muscle atrophy (SMA)) also influence the splicing noise frequencies as shown in investigations of RPL23 and UBA52 [1]. In a recent genome-wide approach, it was shown that the amount of splicing errors can be correlated to the expression rate of genes [9].
There are several RNA surveillance mechanisms degrading misspliced mRNAs [10]. One of them, the nonsense-mediated mRNA decay (NMD), degrades mRNA isoforms containing premature termination codons [11]. Inhibition of NMD by puromycin treatment or hUpf1 knockdown increases splicing noise frequencies [1,12].
We are interested in age-dependent changes in splicing noise frequencies in human cells. There are several models which explain the complex phenotype of aging [13,14]. One of these models centers on the age-dependent increase of stochastic mutations in nuclear and mitochondrial DNA. Until now, age-dependent effects on gene transcription have not been investigated with the same intensity as alterations in DNA structure. However, there is data suggesting an age-dependent expression pattern of genes [15]. One of the most interesting findings in this field is the observation that cell-to-cell variation in gene expression (transcriptional noise) is increased in aged cells in isolated single cells [16]. Additionally age-related changes in alternative splice site usage have been described in specific genes [2], while age-dependent alterations in splicing noise frequencies, represented by cassette ex on skipping, have not yet been investigated.
A highly reliable method of measuring splicing noise frequencies is the relative quantification of an erroneous product compared to the wildtype product by RT-qPCR [6]. Because this method is very sensitive, it is a prerequisite to avoid artefacts such as those incurred by incorrect RNA isolation or mispriming. The detection method can be validated by the measurement of exon skips in cultured fibroblasts treated with cold shock or puromycin, conditions known to increase splicing noise frequencies. To test whether splicing errors are correlated to the transcription rate or if they are caused by inaccurate exon recognition, reduced transcription fidelity or mutations in splice genes in single cells [1,6,17], we investigated intragenic and interpersonal variations in splicing noise frequencies in several exons of one single gene. This gene, the tumour suppressor NF1, contains at least 58 exons and has been extensively investigated for alternative splice products, consequences of germline mutations on splicing and splicing noise [6,7,18]. Additionally one exon skip was measured in each of three other genes, the housekeeping genes PCGF2, RABAC1 and AATF.
In vivo, the most accessible human tissue for these investigations is represented by carefully isolated peripheral blood cells. Using these cells, we showed an unchanged high fidelity in splicing in aged peripheral blood cells in the investigated exons of the selected genes NF1, PCGF2, RABAC1 and AATF. In vitro investigations of old fibroblasts revealed comparable results.
2. Results and Discussion
2.1. Results
2.1.1. Reliable Detection of Splicing Noise Frequencies by RT-qPCR
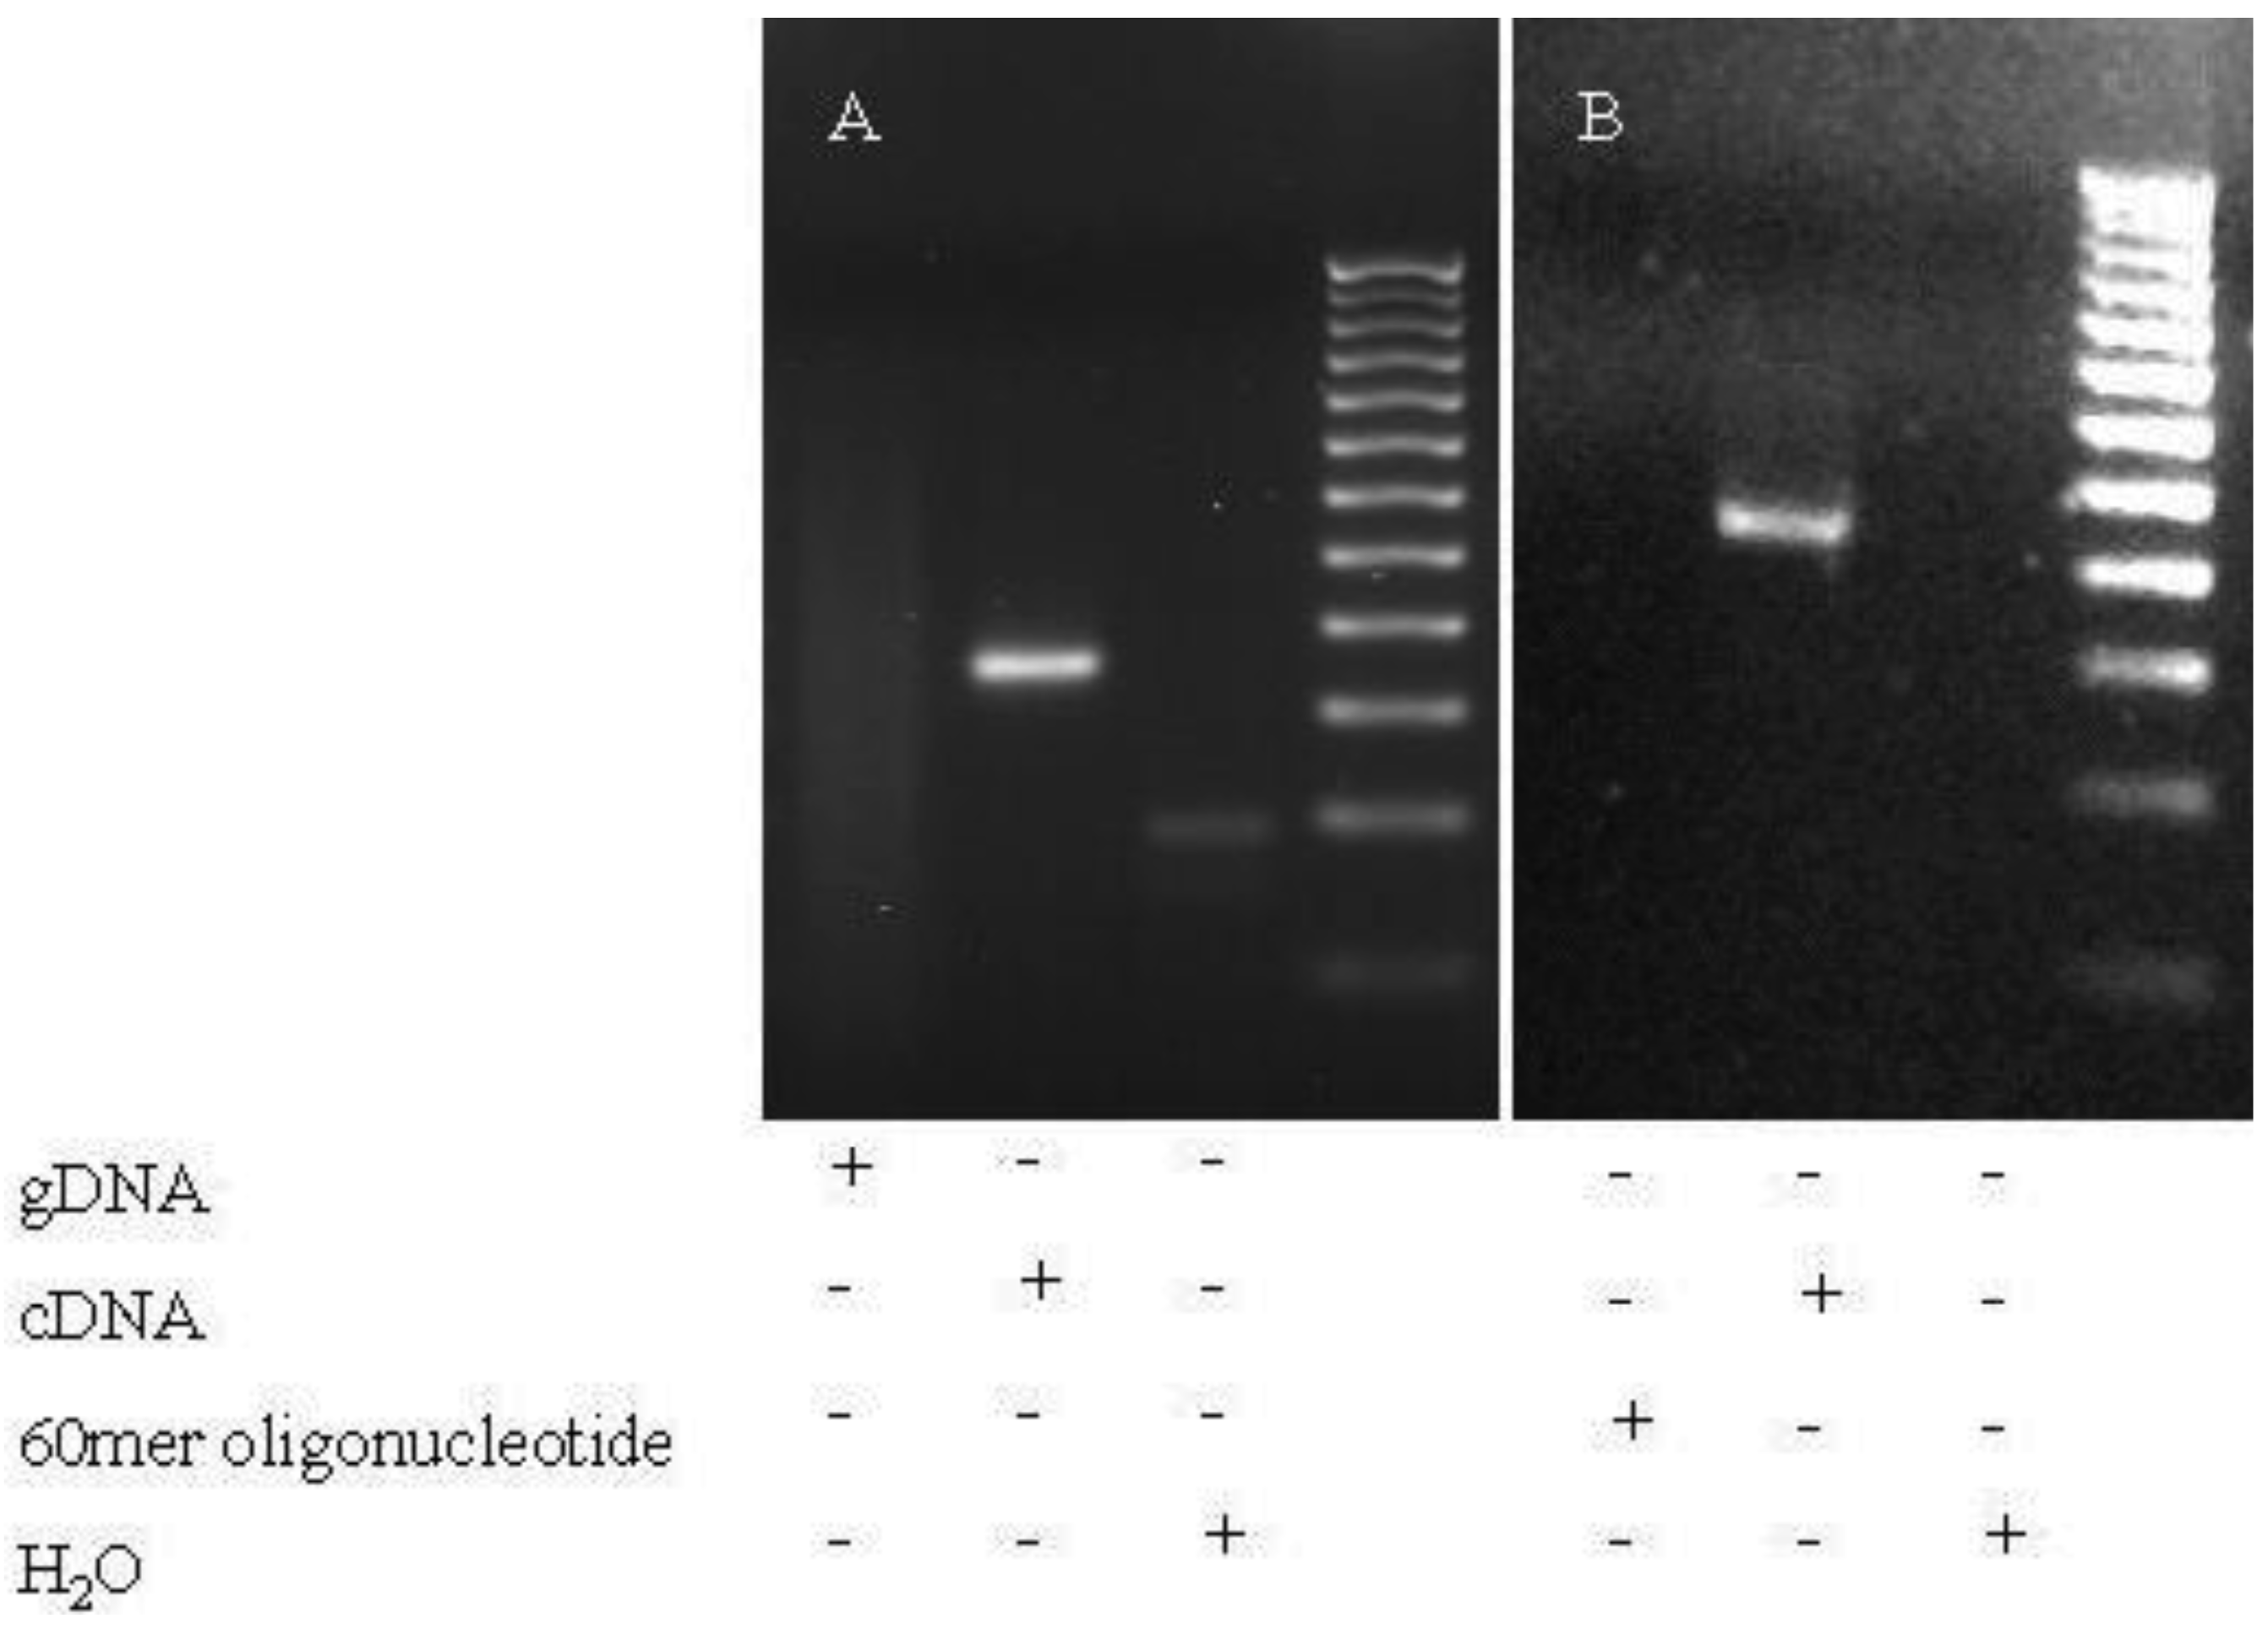
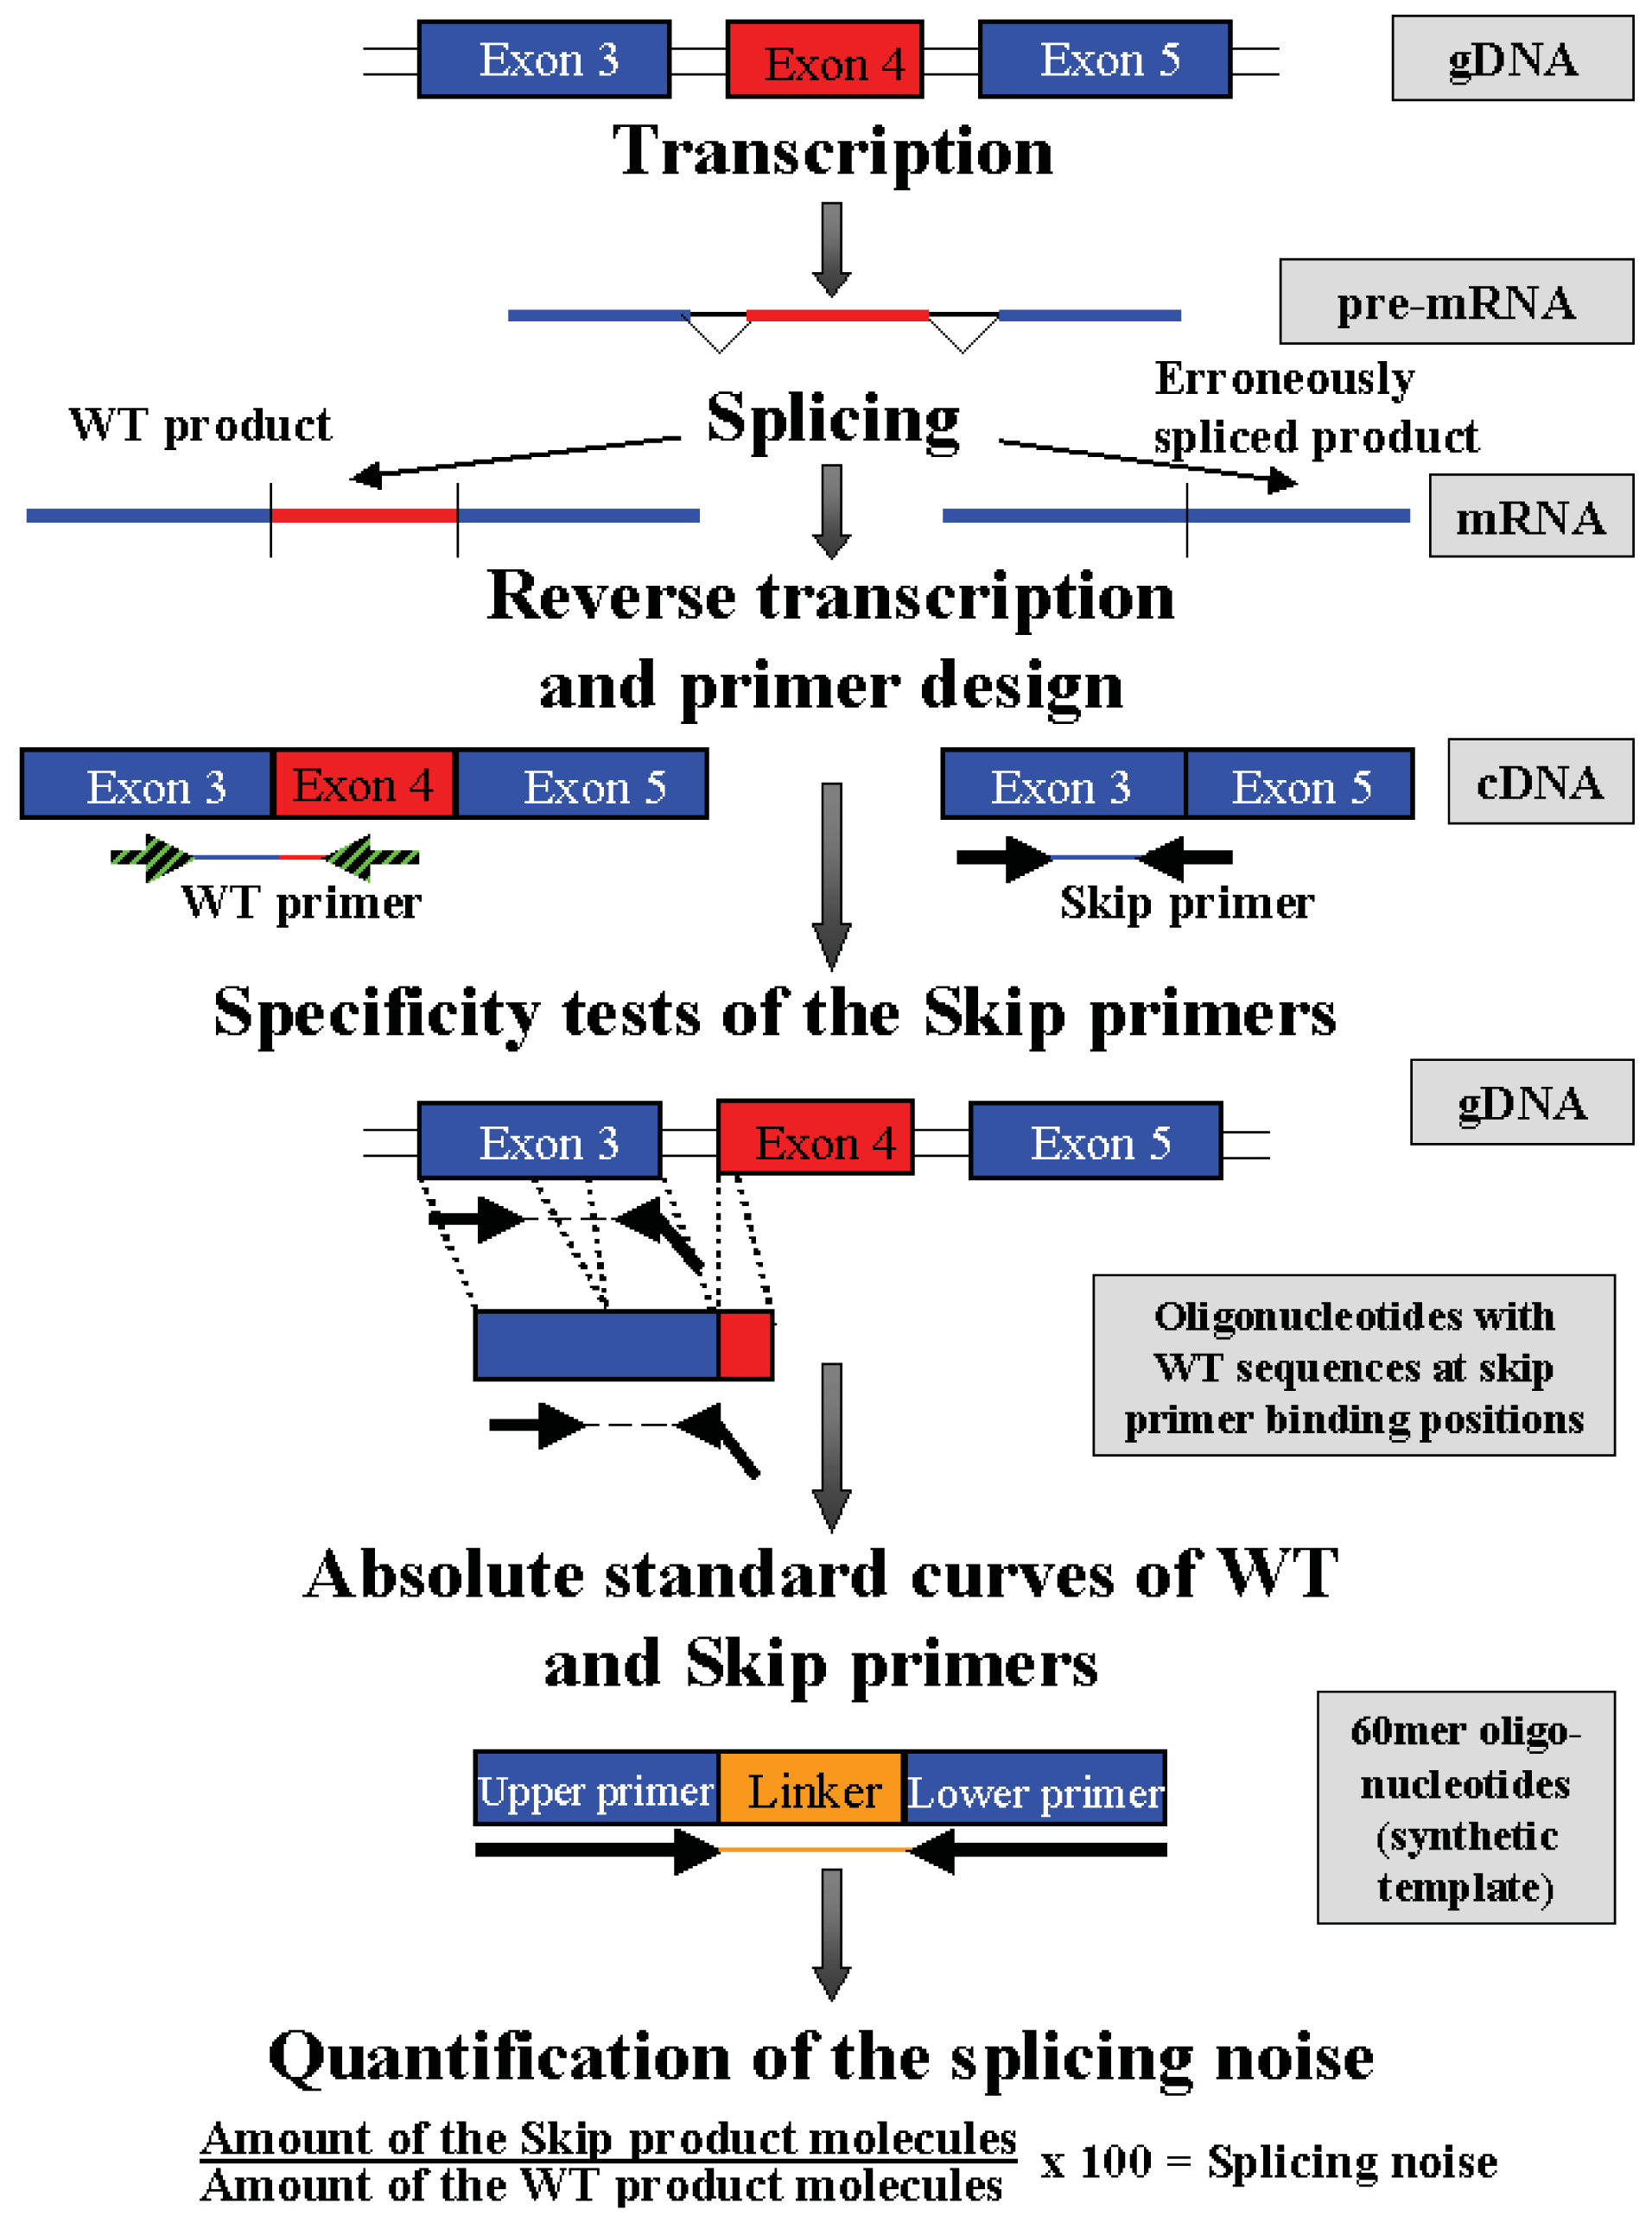
Splicing noise frequencies were measured by RT-qPCR of the regular NF1, PCGF2, RABAC1 and AATF transcripts (wildtype products) in relation to the products without the skipped exons (NF1-Δ38, NF1-Δ39, NF1-Δ46, NF1-Δ52, PCGF2-Δ10, RABAC1-Δ4 and AATF-Δ3). The investigated skipped exons differ in length, in upstream and downstream intron length, splice site strengths (calculated with SplicePort [19]) and in generating a frameshift as consequence of the exon skip (Table 1). The specificity of the skip primers was tested by PCR (60 cycles) on genomic DNA and wildtype 60mer oligonucleotides. The oligonucleotides represent the wildtype sequence at the position of skip primer binding and enable detection of mispriming of the skip primers (Scheme I). The method was tested using published UBA52 and RPL23 primers known to misanneal at low frequency [1]. PCRs using those primers resulted in clear bands on gDNA. In contrast, in experiments using the skip primers used in our measurements, no products were found in PCR on gDNA or oligonucleotides, whereas PCRs on cDNA of fibroblasts resulted in the expected products (Figure 1). This implicates that misannealing with these primers may occur at even lower frequency than that published for the UBA52 and RPL23 primers (found to misanneal <1:1000).

| Exon | Intron | Splice site strength | ||||
|---|---|---|---|---|---|---|
| Upstream | Downstream | Donor | Acceptor | Classification | ||
| NF1 Exon 38 | 341 | 1246 | 2456 | 0.99 | −0.28 | o. f. |
| NF1 Exon 39 | 203 | 2456 | 4339 | 1.50 | 1.39 | o. f. |
| NF1 Exon 46 | 102 | 564 | 1699 | 0.53 | −0.04 | i. f. |
| NF1 Exon 52 | 123 | 4045 | 377 | 0.11 | 0.93 | i. f. |
| PCGF2 Exon 10 | 81 | 2182 | 489 | 1.72 | 2.21 | i. f. |
| RABAC1 Exon 4 | 102 | 1166 | 83 | 0.42 | 0.72 | i. f. |
| AATF Exon 3 | 411 | 2480 | 473 | 1.34 | 2.16 | i. f. |


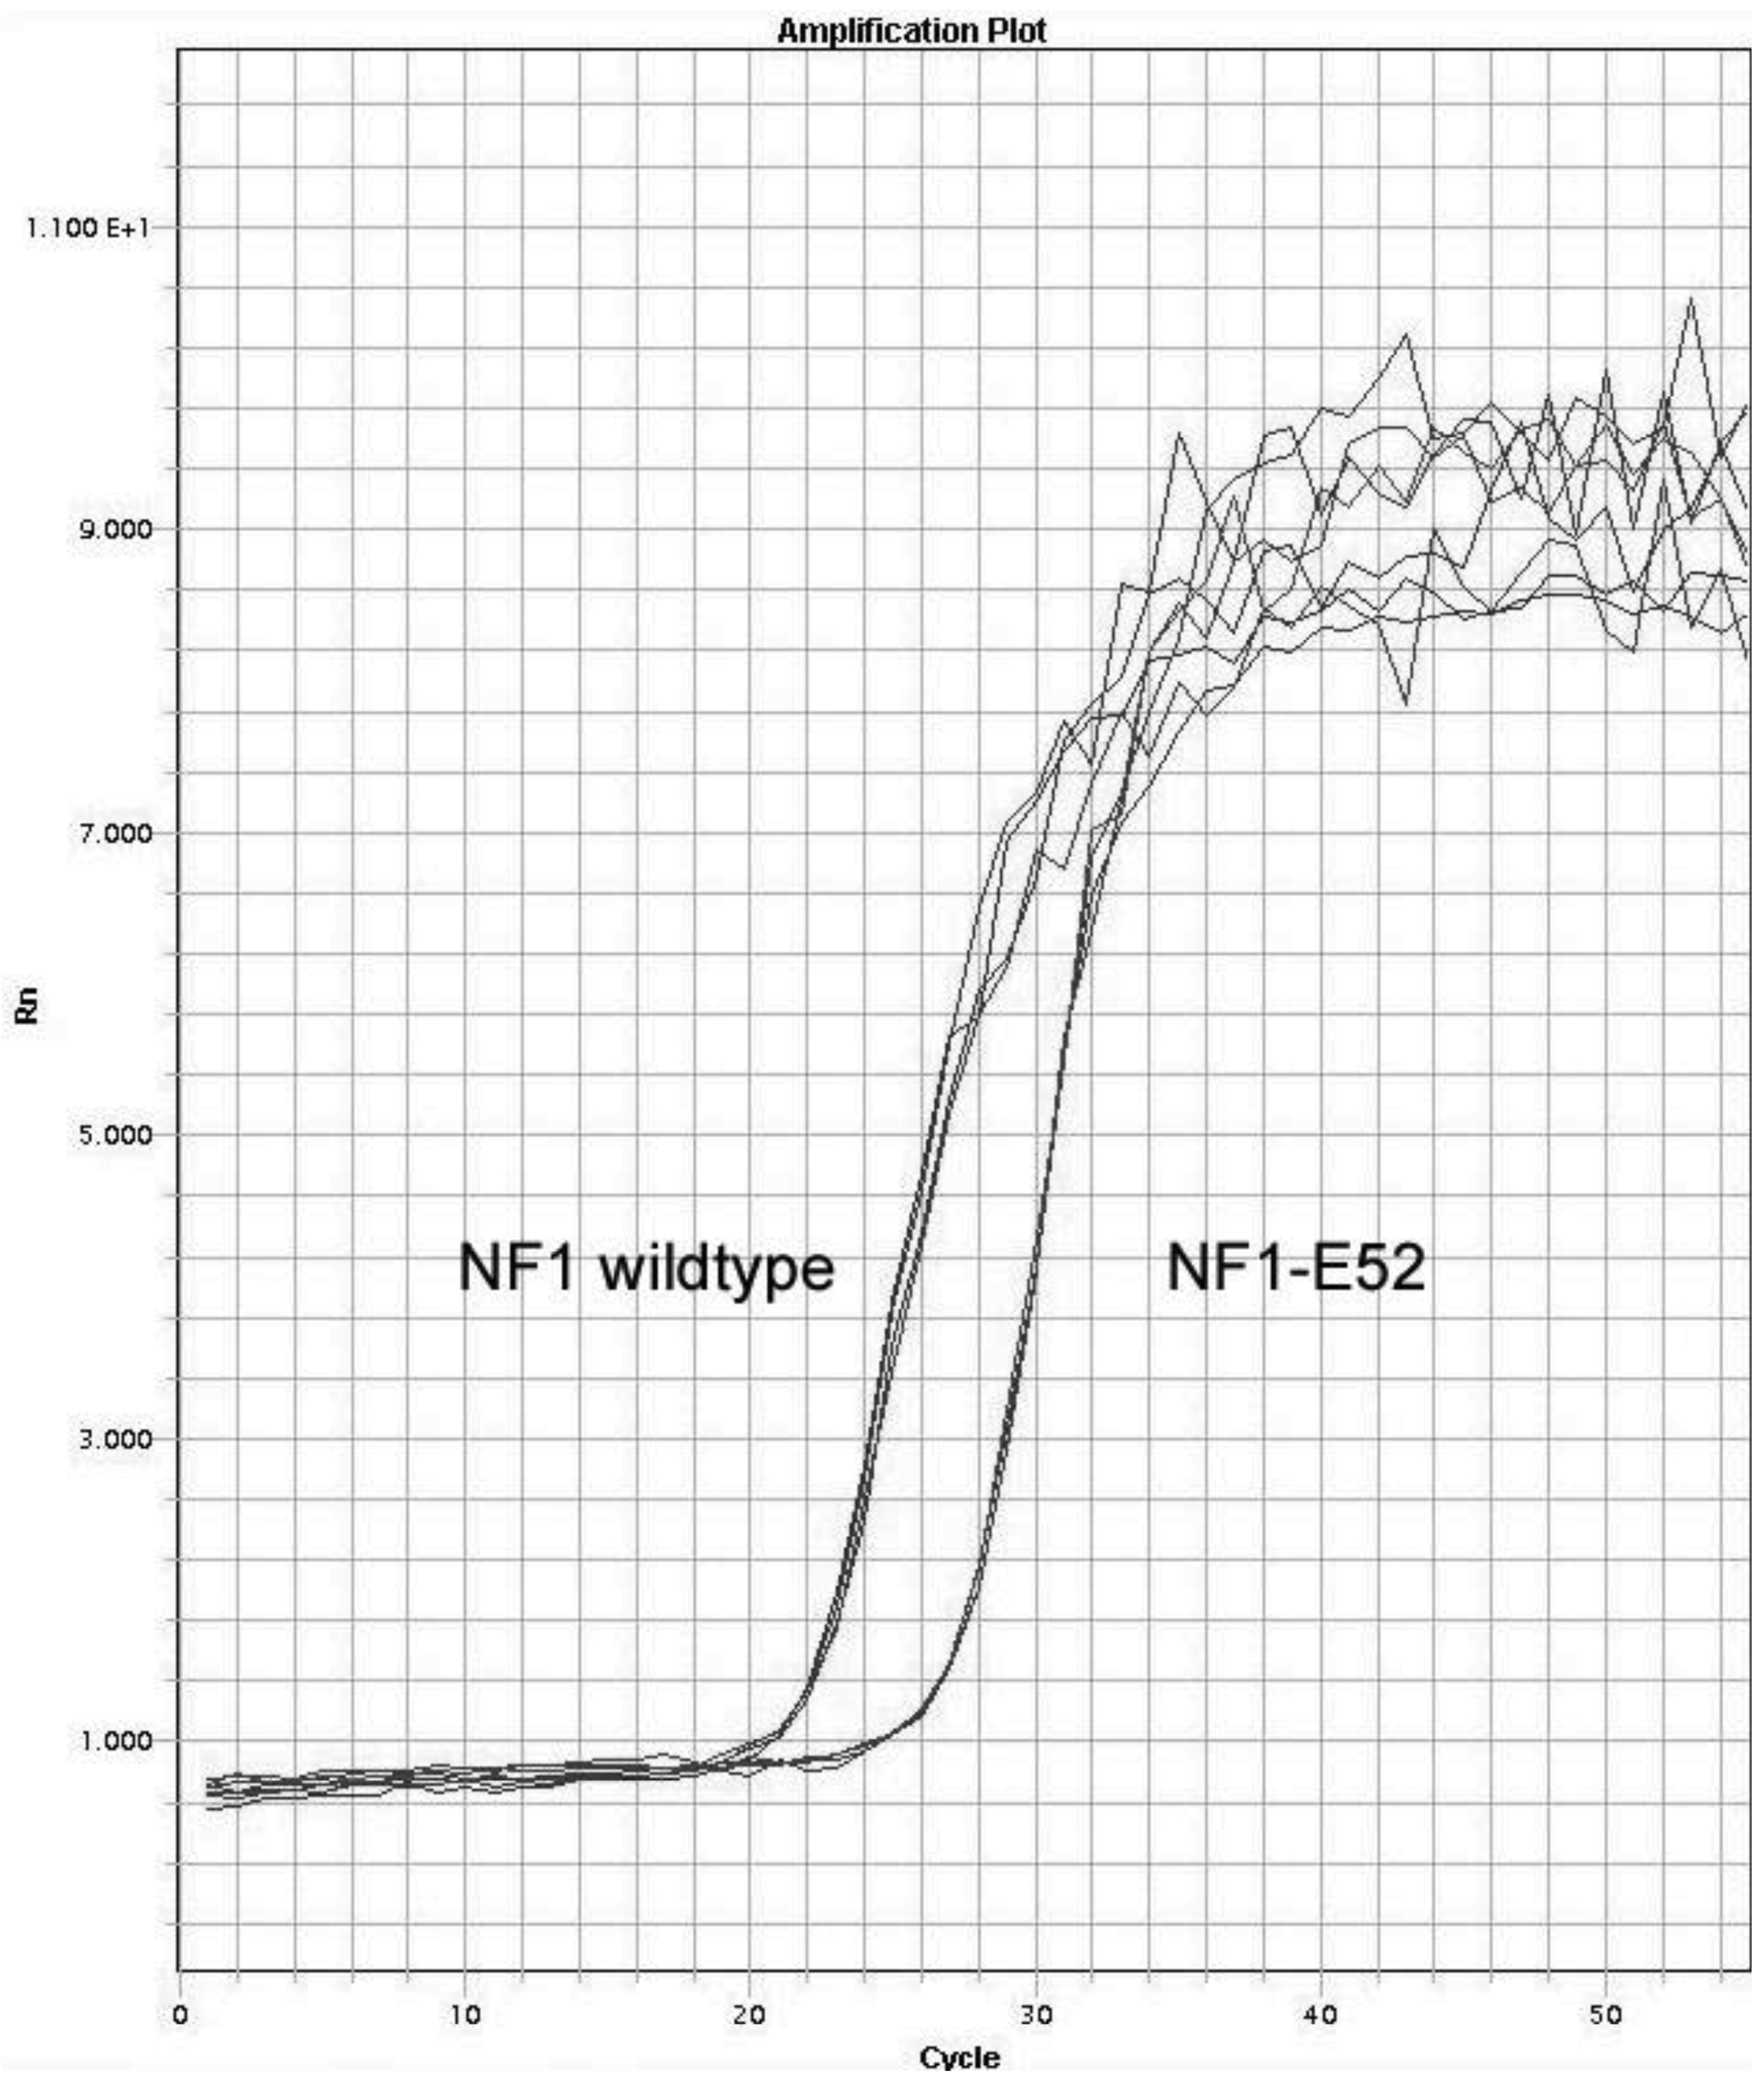
In NF1, the amount of the regular NF1 product was measured by qPCR using three different primer pairs binding to sequences flanking the skipped exons. The differences in the measurements of NF1 expression ranged within the deviation of multiple measurements expected from a single primer pair (Table 2). Therefore, in the following qPCR experiments, regular products were detected by using the WT38-39 primers only. Measurement of the four misspliced NF1 products resulted in low SDs (Figure 2), but the respective CT values differed in the cDNA of peripheral blood cells (Table 3) indicating that not every exon is erroneously spliced at the same frequency.
| Wildtype primer pair | CT value |
|---|---|
| NF1WT38-39 | 23.78 ± 0.05 |
| NF1WT45-46 | 23.66 ± 0.02 |
| NF1WT52-53 | 23.74 ± 0.10 |
| Mean | 23.73 ± 0.06 |

| Product | CT value | Calculated mRNAs | Relative amount (%) |
|---|---|---|---|
| NF1WT38-39 | 21.69 ± 0.07 | 9330 | |
| NF-Δ38 | 32.92 ± 0.47 | 11 | 0.11 |
| NF-Δ39 | 27.81 ± 0.13 | 296 | 3.17 |
| NF1-Δ46 | 33.05 ± 0.14 | 10 | 0.11 |
| NF1-Δ52 | 26.6 ± 0.10 | 634 | 6.79 |
The reliability of splicing noise frequency detection was also investigated in fibroblasts treated by cold shock or puromycin. After treatment with cold shock, a clear increase of splicing errors was detected in three of four investigated NF1 exons and in both PCGF2 and RABAC1 (Table 4). Treating the fibroblasts with puromycin leads to an increase in splice errors in both 3 of the 4 NF1 exons and in the investigated exons of RABAC1 and AATF. These results indicate that the RT-qPCR method is able to detect differences in splicing noise frequency of the NF1 exons. Testing dilutions of cDNAs revealed, that the detection limit of this method is a decrease of about 40% between two samples (data not shown).
| NF1-Δ38 | NF1-Δ39 | NF1-Δ46 | NF1-Δ52 | PCGF2-Δ10 | RABAC1-Δ4 | AATF-Δ3 | |
|---|---|---|---|---|---|---|---|
| untreated | 0.03 | 0.11 | 0.06 | 3.26 | 6.7 × 10⁻¹⁰ | 1.61 | 4.1 × 10⁻⁹ |
| coldshock | 0.08 | 0.35 | 0.08 | 5.76 | 1.8 × 10⁻⁹ | 5.70 | n.d. |
| puromycin | 0.13 | 0.47 | 0.07 | 6.59 | 9.7 × 10⁻¹⁰ | 4.15 | 9.4 × 10⁻⁹ |
No significant correlation of the splicing noise frequency to the exon-specific parameters exon or intron length or the splice site strength could be found in this small sample of exons.
2.1.2. NF1 Splicing Noise Frequencies in Aged Cultured Fibroblasts
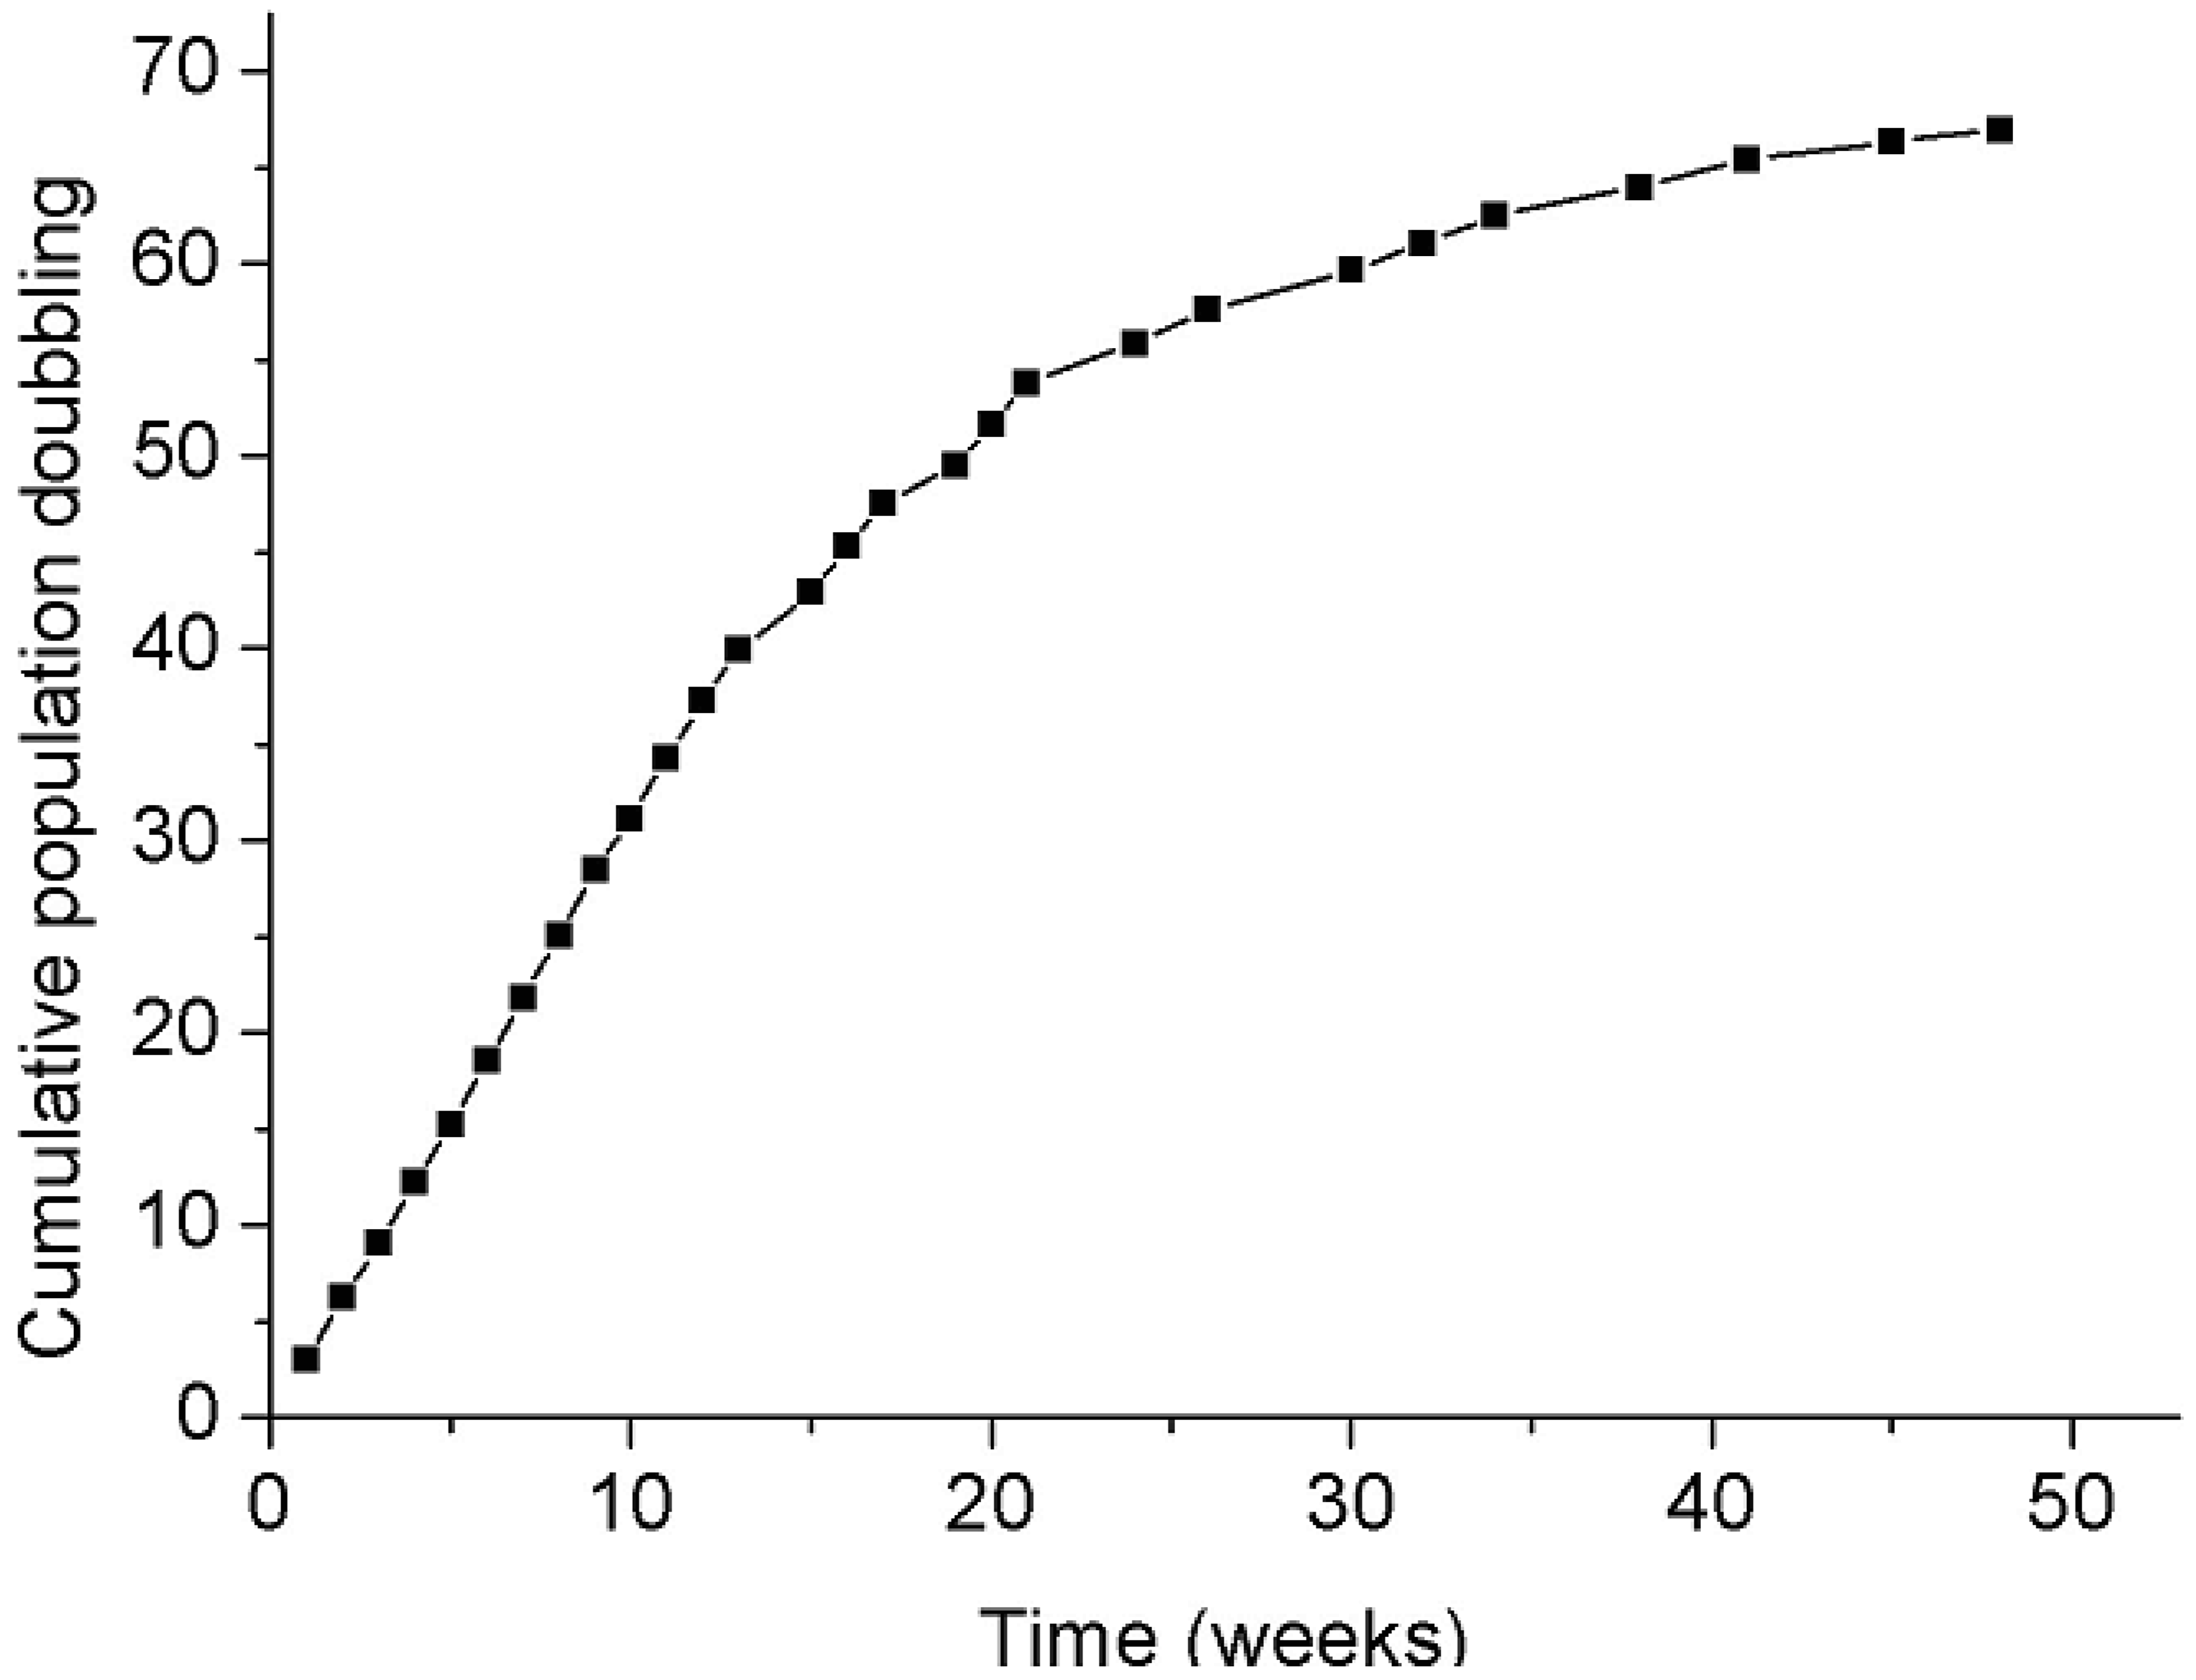
Splicing fidelity may be influenced in vitro by replicative senescence. To test this, cultured fibroblasts from three donors (FP1, FP7 and FP8) were investigated at different passages (3–4 and 24–29), representing respectively 3–4 and more than 40 weeks of culture. The replicative senescence was shown by reduced population doubling (Figure 3), the altered morphology of the cells and the determination of the telomere length. A significant decrease in splicing noise frequency (p < 0.05; paired t-test) could be observed in NF1 exon 39 in in vitro aged fibroblasts of all three donors (FP1, FP7, FP8), but overall no significant change in splicing error frequency correlating with replicative senescence could be found (p = 0.39; sign test of the raw data; Table 5A). In addition, cultured fibroblasts (passages 5–6) from four donors differing in age (3–67 years) were investigated by pairwise testing a culture of a young and elderly donor (Table 5B). A comparison on the basis of four exons in two elderly and two young donors revealed slightly lower noise for the latter. This may however be attributable to chance (p = 0.52, ANOVA) and hence, no correlation between splicing noise frequency and the age of the donors could be detected under our culture conditions in vitro. The mean values ±SD per tested fibroblast pair over all tested NF1 exons point out that there is no significant difference between young and old fibroblasts/donors in our collective regarding the splicing error frequencies.

| A. | |||||||
|---|---|---|---|---|---|---|---|
| Donor | Passages | Source | NF1-Δ38 | NF1-Δ39 | NF1-Δ46 | NF1-Δ52 | Mean |
| FP1 | 4/27 | Prepuce | 1.91 | 0.63 | 0.48 | 1.22 | 1.06 ± 0.65 |
| FP7 | 3/24 | Prepuce | 0.59 | 0.28 | 1.16 | 0.97 | 0.75 ± 0.39 |
| FP8 | 3/29 | Prepuce | 0.89 | 0.43 | 0.53 | 1.14 | 0.75 ± 0.33 |
| B. | |||||||
|---|---|---|---|---|---|---|---|
| Pair | Donor age | Source | NF1-Δ38 | NF1-Δ39 | NF1-Δ46 | NF1-Δ52 | Mean |
| FP3/FP4 | 24/67 | Prepuce | 0.98 | 0.42 | 0.84 | 0.70 | 0.74 ± 0.24 |
| FP2/FP5 | 3/65 | Upper arm | 1.43 | 0.61 | 1.34 | 2.84 | 1.56 ± 0.93 |
2.1.3. Intragenic, but not Age-Dependent Interpersonal Variation in NF1 Splicing Noise Frequencies in Peripheral Blood Cells
In order to investigate splicing noise frequencies in vivo, carefully and rapidly isolated RNA from peripheral blood cells of 11 obviously healthy Caucasian male donors of different ages was tested. The splicing noise frequencies differed substantially between the four tested NF1 exons indicating an intragenic variation in splicing (Table 6). This difference did not depend on the exon classification in-frame or out of frame. Splicing fidelity can be altered by germline mutations in genes of the splicing machinery [20,21] and may also vary interpersonally. There was no evidence that the NF1 splicing noise frequencies are different between young (15–23 years, n = 7) and old donors (61–85 years, n = 4; Table 6). Interpersonal differences regarding the specific exons exist (up to 3.3 fold between the lowest and highest error frequency in NF1-Δ46) but seem to be independent from the age of the donor. Furthermore, there are no donors with exclusively high or low splicing error frequencies in our collective.
| Donor | Age | NF1-Δ38 | NF1-Δ39 | NF1-Δ46 | NF1-52 | RABAC1-Δ4 | AATF-Δ3 |
|---|---|---|---|---|---|---|---|
| BP11 | 15 | 0.11 | 2.33 | 0.09 | 7.49 | 3.43 | 2.6 × 10⁻⁹ |
| BP10 | 16 | 0.08 | 3.68 | 0.09 | 8.77 | 3.17 | 2.0 × 10⁻⁹ |
| BP9 | 16 | 0.08 | 2.23 | 0.03 | 6.28 | 5.55 | 6.7 × 10⁻¹⁰ |
| BP8 | 17 | 0.11 | 2.74 | 0.10 | 6.04 | 4.38 | n.d. |
| BP7 | 17 | 0.08 | 5.35 | 0.09 | 9.69 | 1.91 | n.d. |
| BP6 | 19 | 0.10 | 3.79 | 0.08 | 6.89 | 3.14 | 1.5 × 10⁻⁹ |
| BP5 | 23 | 0.07 | 3.78 | 0.06 | 9.60 | 1.99 | 2.7 × 10⁻¹⁰ |
| Mean | 0.09 | 3.42 | 0.07 | 7.82 | 3.37 | 3.1 × 10⁻⁹ | |
| SD | ±0.02 | ±1.09 | ±0.02 | ±1.53 | ±1.29 | ±2.9 × 10⁻⁹ | |
| BP4 | 61 | 0.09 | 4.59 | 0.07 | 8.15 | 4.60 | 1.6 × 10⁻⁹ |
| BP3 | 66 | 0.11 | 2.76 | 0.07 | 8.90 | 2.65 | 2.5 × 10⁻¹⁰ |
| BP2 | 77 | 0.07 | 4.07 | 0.06 | 7.38 | 3.03 | 1.1 × 10⁻⁹ |
| BP1 | 85 | 0.11 | 3.17 | 0.11 | 6.79 | 4.07 | 7.6 × 10⁻¹⁰ |
| Mean | 0.10 | 3.65 | 0.08 | 7.81 | 3.59 | 9.4 × 10⁻¹⁰ | |
| SD | ±0.02 | ±0.83 | ±0.02 | ±0.92 | ±0.90 | ±5.8 × 10⁻¹⁰ | |
| p-values | 0.66 | 0.72 | 0.98 | 0.98 | 0.77 | 0.43 | |
2.1.4. PCGF2, RABAC1 and AATF Splicing Noise Frequencies in Peripheral Blood Cells
Three housekeeping genes were also investigated for exon skipping. In PCGF2 in the peripheral blood cells of seven young and four elderly donors the skip product PCGF2-Δ10 was not detectable, whereas in the cultured fibroblasts of a young donor (FP6) it could be found at a level of 6.7 × 10⁻¹⁰% and was increased by cold shock to 1.8 × 10⁻⁹%. In RABAC1 and AATF the amounts of the skip products were detectable in cultured fibroblasts and could be increased by cold shock or puromycin treatment (Table 4). In peripheral blood cells of the 11 donors the amount of RABAC1 and AATF erroneously spliced exons varied, but did not seem to be systematically different between young and elderly people (Table 6).
2.2. Discussion
Measurements of splicing noise frequencies and investigations into their cellular and organic consequences are in their infancy [22]. To investigate the interpersonal and age-dependent variation in splicing error frequencies, peripheral blood cells from healthy donors were investigated for exon skipping in NF1, PCGF2, RABAC1 and AATF by RT-qPCR.
There are several pitfalls in the measurement of the very rare products from splicing noise. One is mispriming in qPCR. To solve this problem, all primers were tested on specific oligonucleotides and/or gDNA for mispriming. The second pitfall is an unreliable RNA isolation. Specific protocols were used to avoid disturbances by cold shock induced splicing noise especially in peripheral blood cells. Third are disturbances by variable effects from the RNA surveillance mechanisms. In general, mRNAs with skipped in-frame exons are not a target for the NMD which eliminates targets with premature termination codons [11]. Therefore, in this study the majority of the selected skipped exons are in-frame. However, the inhibition of NMD by puromycin in cultured fibroblasts resulted in increased splicing noise in three of five in-frame exon skips and both tested out of frame exons. In-frame exon skips should not be altered by puromycin treatment for that the NMD should not degrade mRNAs lacking an in-frame exon. The increase of mRNAs with in-frame skips may be due to effects of puromycin treatment independent from NMD inhibition.
In peripheral blood cells, the erroneous exon skipping frequency was found to be 2.49% on average, varying between 1.2 × 10⁻⁹ (AATF-Δ3) and 7.81% (NF-Δ52). his range fits to that found in EST libraries, where irregular splicing products are suggested to vary between 1 and 10% of all cDNAs [23]. Using deep RNA sequencing, Pickrell et al. showed that exons have an average splicing error frequency of approximately 0.7% [9]. This average error percentage is lower than those found in our measurements in peripheral blood cells. This may be due to the small collective of the investigated exons in our study.
Whereas fractions of misspliced products of less than 1% of the wildtype product can be more easily defined as errors, fractions with levels greater than 2% implicate that they might have a dedicated function. The NF1-Δ52 isoform was suggested to be functional [6] but to our knowledge the other investigated exon skips have not yet been described as functional isoforms. In our survey, intragenic and intergenic variations in splicing noise were found in the peripheral blood cells of all 11 donors, but the interpersonal variation was, although being partial higher than expected (up to 3.3 fold between individuals), independent from the age of the donors. The patterns of single donor splicing error frequencies within the whole collective show that there are no exclusively high or low frequencies regarding single donors. This indicates that there are no donors that have a more accurate splicing machinery than others in our collective. The intragenic differences were found not to be related to the exon classification in-frame or out of frame. In particular, no correlation to the age of the donors could be found. Other variants of splicing noise such as multiple exon skipping or alternative splice site usage are said to be altered by aging [2]. Considering this, the consistency of splicing noise frequency based on cassette exon skipping is surprising and indicates that not all types of splicing noise are age-dependent.
Several explanations for the missing alteration with age in cassette exon skipping in these cells can be considered: (1) splicing noise frequencies are not influenced by the aging process; (2) the investigated proliferating peripheral blood cells are selected in vivo for reduced splicing noise frequencies; (3) the RNA surveillance mechanisms are more active in aged peripheral blood cells; or (4) there are age-dependent differences in splicing noise frequencies, but the alteration is too small to be detected by our method. In this case, changes in the noise frequencies would be below our detection limit and would therefore be smaller than about 40%. It was shown that there is an approximately 2-fold splicing error increase in the neurodegenerative disorder spinal muscular atrophy (SMA) [1]. Changes in this range would clearly be detected by our method. Nevertheless, additional experiments are necessary to clarify the significance of splicing noise in aged cells, especially in non-proliferating tissue (e.g., in mice) and cells with knocked down surveillance mechanism genes.
There are several hypotheses as to the reasons for splicing noise. In one, the amount of erroneous splice products is linked directly to the amount of functional products [23]. In NF1, the splicing noise frequencies varied in the different exons, indicating that other variables influence the frequency of splicing noise besides the transcription rate. The observed pattern suggests that NF1 splicing noise frequencies are not correlated to the fidelity of transcription, mutations in splicing regulating sequences or genes in single cells. A crucial factor for the different noise frequencies in different exons may be the strength of the splice sites. This seems to be reasonable since a missing splice acceptor site recognition would lead to the usage of the next possible acceptor site and therefore to a missing exon recognition. In our survey, the splicing noise frequencies do not correlate with the splice site strengths. Nevertheless, the exons with the two highest upstream acceptor splice site strengths showed the lowest skipping frequencies. Other factors may also possibly influence the splicing noise frequency of an exon.
Aside from the sequence of a gene, other cellular variables influence splicing noise frequencies. This is shown by the differences in NF1 splicing noise frequencies between cultured fibroblasts and peripheral blood cells found in this study or between different tissues as reported by others [6]. Additionally, increased splicing noise may be related to symptoms in diseases such as SMA caused by a mutation in splicing regulating genes [20].
3. Experimental
3.1. Culture of Fibroblasts and Obtaining of Blood Samples
The processing of tissue and the preparation of the human fibroblasts was performed as described [7]. Biopsies from eight obviously healthy Caucasian male donors from southern Germany (FP1-FP8) were obtained from the prepuce or the skin of the upper arm. The research carried out was in compliance with the Helsinki Declaration (Ethikkommission Universität Ulm, A 185/09). The fibroblasts were cultured in Dulbecco's modified eagle medium (DMEM) with 10% fetal bovine serum (FBS) at 37 °C and 5% CO2 in 60 cm2 dishes (3.0 × 10⁶ cells) for 3 days. Cumulative population doublings were investigated in fibroblasts of three donors. For cold shock, fibroblasts were cultured additionally for 24 h at 20 °C [7]. To inhibit the NMD, cells were treated by 100 μg puromycin/ml for 12 h [1].
To isolate RNA of peripheral blood cells, 10 ml blood samples were taken from 11 obviously healthy Caucasian male donors from southern Germany of different ages (15–85 years). All donors participating in this study gave informed consent prior to the blood isolation.
Telomere length was determined using telomere primers as described [24]. PCRs were performed (95 °C for 15 seconds, 54 °C for 2 minutes, 25 cycles) and amplified products were run on a 3% agarose gel. Fibroblasts of lower passages showed longer maximal amplicons than fibroblasts of high passages.
3.2. Isolation of RNA of Cultured Fibroblasts and Peripheral Blood Cells
To isolate RNA, cultured fibroblasts were lysed directly on ice on the dishes by covering with lysis buffer (RNeasy Mini Kit, Qiagen, Hilden, Germany) containing 1% mercaptoethanol for 2 minutes, harvested with a cell scraper and disintegrated using a Qiashredder column. The following RNA isolation steps were performed according to the manufacturer's protocol (RNeasy Mini Kit, Qiagen, Hilden, Germany). Total RNA of peripheral blood cells was isolated with the LeukoLock Total RNA Isolation Kit (Ambion, Austin, USA). This method allows RNA stabilization within 10 minutes and complete isolation within less than 90 minutes, ensuring minimal fluctuations in RNA levels. The synthesis of cDNA was performed with the Superscript III kit (Invitrogen, Karlsruhe, Germany) using random hexamers.
3.3. Investigated Exons
The possibility of an erroneous but infrequent skipping of nearly every exon in a gene was demonstrated for UBA52 and RPL23 [1] and in a genome-wide approach for nearly all genes [9]. The detection of the erroneously spliced products of several NF1 exons has already been published [6,7]. Considering the published results in this study, no obvious correlation was found between the position of tested NF1 exons within the gene and the amount of erroneously spliced products. Therefore for this study, the NF1 exons 38, 39, 46 and 52 were randomly selected from the list of published exons. Additionally, in-frame exons of the three housekeeping genes, PCGF2 (exon 10), RABAC1 (exon 4) and AATF (exon 3) were selected. There were three rationales for the selection of these additional exons in our study. First, these genes are expressed in most cell types, especially in cultured fibroblasts and peripheral blood cells. Second, these exons are not spliced alternatively, thus a strict discrimination between alternative and erroneous splicing can be achieved. The finding of a transcript lacking the interesting exon in the Ensembl database excludes this exon. Third, these exons are classified as in-frame exon. Skips of in-frame exons normally do not lead to premature stop codons. Therefore, emerging products lacking in-frame exons are not targets for the NMD.
3.4. qPCR of the Regular Transcripts and the Exon Skip Products
cDNA splicing noise frequencies were measured in NF1 for two in-frame (exon 46 and 52) and two out of frame exons (exon 38 and 39), in PCGF2 for the in-frame exon 10, in RABAC1 for the in-frame exon 4 of and in AATF for the in-frame exon 3 by qPCR (Table 1). The nomenclature of the exons of all four genes was assumed from the Ensembl data base ( http://www.ensembl.org) and may therefore differ from the nomenclatures used in other publications (Ensembl: NF1: E38, E39, E46, E52 match to NF1: E29, E30, E37, E43 in [6]). To detect erroneous splice products, exon boundary primers were used. The 3′-end of all primers overlaps the new exon-exon boundary generated by skipping the investigated exon (Supplementary Table 1, Scheme I). The primers used for the detection of splicing noise in NF1 were established by others [6], including tests on cloned wildtype and exon-skipped products. The specificity of the skip primers was tested on genomic DNA in standard PCR (60 cycles) and in PCGF2, RABAC1 and AATF using 60mer oligonucleotides including the primer binding sequences of the wildtype cDNA (Supplementary Table 2) (expected PCR products were detectable on a cDNA target after 30–45 amplification cycles). The erroneously spliced and the corresponding regular products were amplified in qPCR using the QuantiTect SybrGreen kit (Qiagen, Hilden, Germany) in a 7900 HT Fast Real-time PCR-System (Applied Biosystems, Foster City, USA). The splicing noise frequencies were calculated as relative amounts of the exon skipped products to the wildtype products. Amounts of the mRNAs in 100 ng RNA equivalent cDNA were calculated via absolute standard curves performed with known amounts of synthetic templates (60 mer oligonucleotides representing the primer sequences (WT and skip) and a linker sequence, Supplementary Table 2A). Splicing noise = Amount of the skip product molecules/Amount of the wildtype products molecules * 100%.
3.5. Statistical Analysis
Splicing noise frequencies and other quantitative traits were summarized using their mean value ± standard deviation (SD). Within each exon, comparisons of noise frequencies between young and elderly donors were carried out using the two-sample t-test. In case of comparison of the splicing error frequencies between different passages of the same donor, the paired t-test was used. Splicing noise levels between exons and age categories were compared simultaneously using fixed effects analysis of variance (ANOVA), hereby considering in the underlying model that noise frequencies have remarkably different levels of dispersion in different exons. Associations between quantitative traits were assessed using the Pearson correlation coefficient. All statistical testing was done on a purely explorative basis without adjustment for multiple testing. Occasionally, a p-value ≤ 0.05 is termed “significant”.
4. Conclusions
Our study shows that splicing is a highly controlled process with a continued high fidelity in the course of aging in the investigated exons of the 4 studied genes in peripheral blood cells and cultured fibroblasts. This indicates a high importance of correct splicing in these proliferating aged cells.
Acknowledgments
The technical support of Andrea Schwandt and Heidrun Goetz and redaction assistance of Katherine Kaempchen are gratefully acknowledged.
Support
This research was supported by DFG (Kaufmann, DFG KA 898/6-1).
References
- Fox-Walsh, K.L.; Hertel, K.J. Splice-site pairing is an intrinsically high fidelity process. Proc. Natl. Acad. Sci. U. S. A. 2009, 106, 1766–1771. [Google Scholar]
- Meshorer, E.; Soreq, H. Pre-mRNA splicing modulations in senescence. Aging Cell 2002, 1, 10–16. [Google Scholar]
- Hertel, K.J. Combinatorial control of exon recognition. J. Biol. Chem. 2008, 283, 1211–1215. [Google Scholar]
- Ars, E.; Serra, E.; de la Luna, S.; Estivill, X.; Lázaro, C. Cold shock induces the insertion of a cryptic exon in the neurofibromatosis type 1 (NF1) mRNA. Nucleic Acids. Res. 2000, 28, 1307–1312. [Google Scholar]
- Wimmer, K.; Eckart, M.; Rehder, H.; Fonatsch, C. Illegitimate splicing of the NF1 gene in healthy individuals mimics mutation-induced splicing alterations in NF1 patients. Hum. Genet. 2000, 106, 311–313. [Google Scholar]
- Vandenbroucke, I.; Vandesompele, J.; De Paepe, A.; Messiaen, L. Quantifcation of NF1 transcripts reveals novel highly expressed splice variants. FEBS Lett. 2002, 522, 71–76. [Google Scholar]
- Kaufmann, D.; Leistner, W.; Kruse, P.; Kenner, O.; Hoffmeyer, S.; Hein, C.; Vogel, W.; Messiaen, L.; Bartelt, B. Aberrant splicing in several human tumors in the tumor suppressor genes neurofibromatosis type 1, neurofibromatosis type 2, and tuberous sclerosis 2. Cancer Res. 2002, 62, 1503–1509. [Google Scholar]
- Fox-Walsh, K.L.; Dou, Y.; Lam, B.J.; Hung, S.; Baldi, P.F.; Hertel, K.J. The architecture of pre-mRNAs affects mechanisms of splice-site pairing. Proc. Natl. Acad. Sci. USA 2005, 102, 16176–16181. [Google Scholar]
- Pickrell, J.K.; Pai, A.A.; Gilad, Y.; Pritchard, J.K. Noisy splicing drives mRNA isoform diversity in human cells. PLoS Genet. 2010, 6, e1001236. [Google Scholar]
- Akimitsu, N. Messenger RNA surveillance systems monitoring proper translation termination. J. Biochem. 2008, 143, 1–8. [Google Scholar]
- McGlincy, N.J.; Smith, C.W.J. Alternative splicing resulting in nonsense-mediated mRNA decay: what is the meaning of nonsense? Trends Biochem. Sci. 2008, 33, 385–393. [Google Scholar]
- Asselta, R.; Rimoldi, V.; Guella, I.; Soldà, G.; De Cristofaro, R.; Peyvandi, F.; Duga, S. Molecular characterization of in-frame and out-of-frame alternative splicings in coagulation factor XI pre-mRNA. Blood 2010, 115, 2065–2072. [Google Scholar]
- Vijg, J. The Logic of Aging. In Aging of the Genome, 1st ed.; Oxford University Press: Oxford, UK, 2007; pp. 27–52. [Google Scholar]
- Kenyon, C.J. The genetics of ageing. Nature 2010, 464, 504–512. [Google Scholar]
- Southworth, L.K.; Owen, A.B.; Kim, S.K. Aging mice show a decreasing correlation of gene expression within genetic modules. PLOS Genet. 2009, 5, e1000776. [Google Scholar]
- Bahar, R.; Hartmann, C.H.; Rodriguez, K.A.; Denny, A.D.; Busuttil, R.A.; Dollé, M.E.; Calder, R.B.; Chisholm, G.B.; Pollock, B.H.; Klein, C.A.; et al. Increased cell-to-cell variation in gene expression in ageing mouse heart. Nature 2006, 441, 1011–1024. [Google Scholar]
- Meshorer, E.; Soreq, H. Pre-mRNA splicing modulations in senescence. Aging Cell 2002, 1, 10–16. [Google Scholar]
- Shepard, P.J.; Hertel, K.J. Conserved RNA secondary structures promote alternative splicing. RNA 2008, 14, 1463–1469. [Google Scholar]
- Pros, E.; Gómez, C.; Martín, T.; Fábregas, P.; Serra, E.; Lázaro, C. Nature and mRNA effect of 282 different NF1 point mutations: focus on splicing alterations. Hum. Mutat. 2008, 29, E173–E193. [Google Scholar]
- Dogan, R.I.; Getoor, L.; Wilbur, W.J.; Mount, S.M. Features generated for computational splice-site prediction correspond to functional elements. BMC Bioinformatics 2007, 8, 410. [Google Scholar]
- Moraes, K.C. RNA surveillance: Molecular approaches in transcript quality control and their implications in clinical diseases. Mol. Med. 2010, 16, 53–68. [Google Scholar]
- Mende, Y.; Jakubik, M.; Riessland, M.; Schoenen, F.; Roßbach, K.; Kleinridders, A.; Köhler, C.; Buch, T.; Wirth, B. Deficiency of the splicing factor Sfrs10 results in early embryonic lethality in mice and has no impact on full-length SMN/Smn splicing. Hum. Mol. Genet. 2010, 19, 2154–2167. [Google Scholar]
- Drummond, D.A.; Wilke, C.O. The evolutionary consequences of erroneous protein synthesis. Nat. Rev. Genet. 2009, 10, 715–724. [Google Scholar]
- Melamud, E.; Moult, J. Stochastic noise in splicing machinery. Nucleic Acids. Res. 2009, 37, 4873–4886. [Google Scholar]
- Cawthon, R.M. Telomere measurement by quantitative PCR. Nucleic Acids. Res. 2002, 30, e47. [Google Scholar]
© 2011 by the authors; licensee MDPI, Basel, Switzerland. This article is an Open Access article distributed under the terms and conditions of the Creative Commons Attribution license (http://creativecommons.org/licenses/by/3.0/).
Share and Cite
Mellert, K.; Uhl, M.; Högel, J.; Lamla, M.; Kemkemer, R.; Kaufmann, D. Aberrant Single Exon Skipping is not Altered by Age in Exons of NF1, RABAC1, AATF or PCGF2 in Human Blood Cells and Fibroblasts. Genes 2011, 2, 562-577. https://doi.org/10.3390/genes2030562
Mellert K, Uhl M, Högel J, Lamla M, Kemkemer R, Kaufmann D. Aberrant Single Exon Skipping is not Altered by Age in Exons of NF1, RABAC1, AATF or PCGF2 in Human Blood Cells and Fibroblasts. Genes. 2011; 2(3):562-577. https://doi.org/10.3390/genes2030562
Chicago/Turabian StyleMellert, Kevin, Michael Uhl, Josef Högel, Markus Lamla, Ralf Kemkemer, and Dieter Kaufmann. 2011. "Aberrant Single Exon Skipping is not Altered by Age in Exons of NF1, RABAC1, AATF or PCGF2 in Human Blood Cells and Fibroblasts" Genes 2, no. 3: 562-577. https://doi.org/10.3390/genes2030562