Type Three Secretion System in Pseudomonas savastanoi Pathovars: Does Timing Matter?

 ,
,
Abstract
: Pseudomonas savastanoi pv. savastanoi is the causal agent of Olive knot disease, relying on the Type Three Secretion System (TTSS) for its pathogenicity. In this regard, nothing was known about the two other pathovars belonging to this species, pv. nerii and pv. fraxini, characterized by a different host range. Here we report on the organization of the entire TTSS cluster on the three pathovars, and a phylogenetic analysis including the TTSS of those bacteria belonging to the P. syringae complex sequenced so far, highlighting the evolution of each operon (hrpC, hrpJ, hrpRS, hrpU and hrpZ). Moreover, by Real-Time PCR we analyzed the in vitro expression of four main TTSS genes, revealing different activation patterns in the three pathovars, hypothetically related to their diverse virulence behaviors.1. Introduction
The Type III Secretion System (TTSS) is a multi-molecular device which is essential for the pathogenicity of Gram-negative bacteria infecting plants, animals and humans, which use this system for the one-step delivery of effector proteins from the bacterial cytoplasm into that of the eukaryotic host cells.
It has been widely demonstrated that in plant pathogenic bacteria, both the triggering of the hypersensitive response (HR) in non-host or host resistant cultivars, and the pathogenicity on the susceptible cultivars of the hosts, strictly depends on the correct functionality of their TTSS. For this reason, the genes coding for the TTSS of phytopathogenic bacteria are indicated by the acronym hrp (hypersensitive response and pathogenicity). The additional acronym hrc is used for those hrp genes highly conserved in the TTSSs of bacterial pathogens of plants and animals [1].
According to the most recent model drawn for the bacteria belonging to the Pseudomonas syringae complex, at the beginning of the bacterium-plant interaction, specific effectors secreted via TTSS are involved in the suppression of the plant basal defences, which are elicited by the so called Pathogen or Microbe-Associated Molecular Patterns (PAMPs or MAMPs) and named PAMP-Triggered Immunity (PTI) [2-5]. On the other hand, when injected into the cytoplasm of a resistant cultivar of the host, TTSS effectors can be individually recognized by intracellular Nucleotide-Binding site, Leucine-Rich Repeat (NB-LRR) Resistance proteins (R), activating a second line of defence known as Effector-Triggered Immunity (ETI) [2-5] characterized by the development of HR. Various models have been recently elaborated to explain the molecular mechanisms at the basis of this recognition. As far as the susceptible hosts are concerned, the disease occurs through the activities of those TTSS effectors which are not recognized by host R proteins or able to suppress ETI [2-6]. In several phytopathogenic bacteria belonging to the P. syringae complex, the expression of hrp/hrc genes has been demonstrated to be triggered and regulated by both environmental and host factors [7-12]. In vitro expression of these genes is low or partially repressed when bacteria are grown in nutrient-rich media, whereas it rapidly increases when bacteria are grown in minimal medium, with or without plant cell exudates added, or are infiltrated into host tissues [7-9,11-16].
The regulation of TTSS in bacteria of the P. syringae complex has been described and dynamically modeled. Within this regulatory network HrpRS, HrpA, HrpV play an essential role and HrpL is one of the most important information processing points [11,17,18]. Moreover, critical linkages were found between TTSS transcriptional regulators and several global signal transduction systems [11,14,19-22].
P. savastanoi pv. savastanoi (Psv) was demonstrated to fully rely on the functionality of its TTSS to successfully induce knot formation in Olive trees [23,24]. So far, no information is available on this system for the other two pathovars belonging to this species, nerii (Psn) and fraxini (Psf), which attack woody plants as well, Oleander and Ash respectively. Here, for the first time, we report the whole sequence and organization of the TTSS clusters of Psn and Psf, together with that of a well-known Psv strain. These data were used to determine the phylogenetic position of these pathogens into the P. syringae complex, using the hrp clusters fully sequenced until now in these bacteria. Moreover, for the first time to our knowledge, through Real-Time PCR we analyzed the kinetics of the in vitro expression of TTSS in Psv, Psn and Psf, to investigate if the timing and/or the wiring of TTSS regulation could have any potential concerning the evolution of virulence across these P. savastanoi pathovars.
2. Results and Discussion
2.1. Organization of TTSS Cluster in P. savastanoi Pathovars
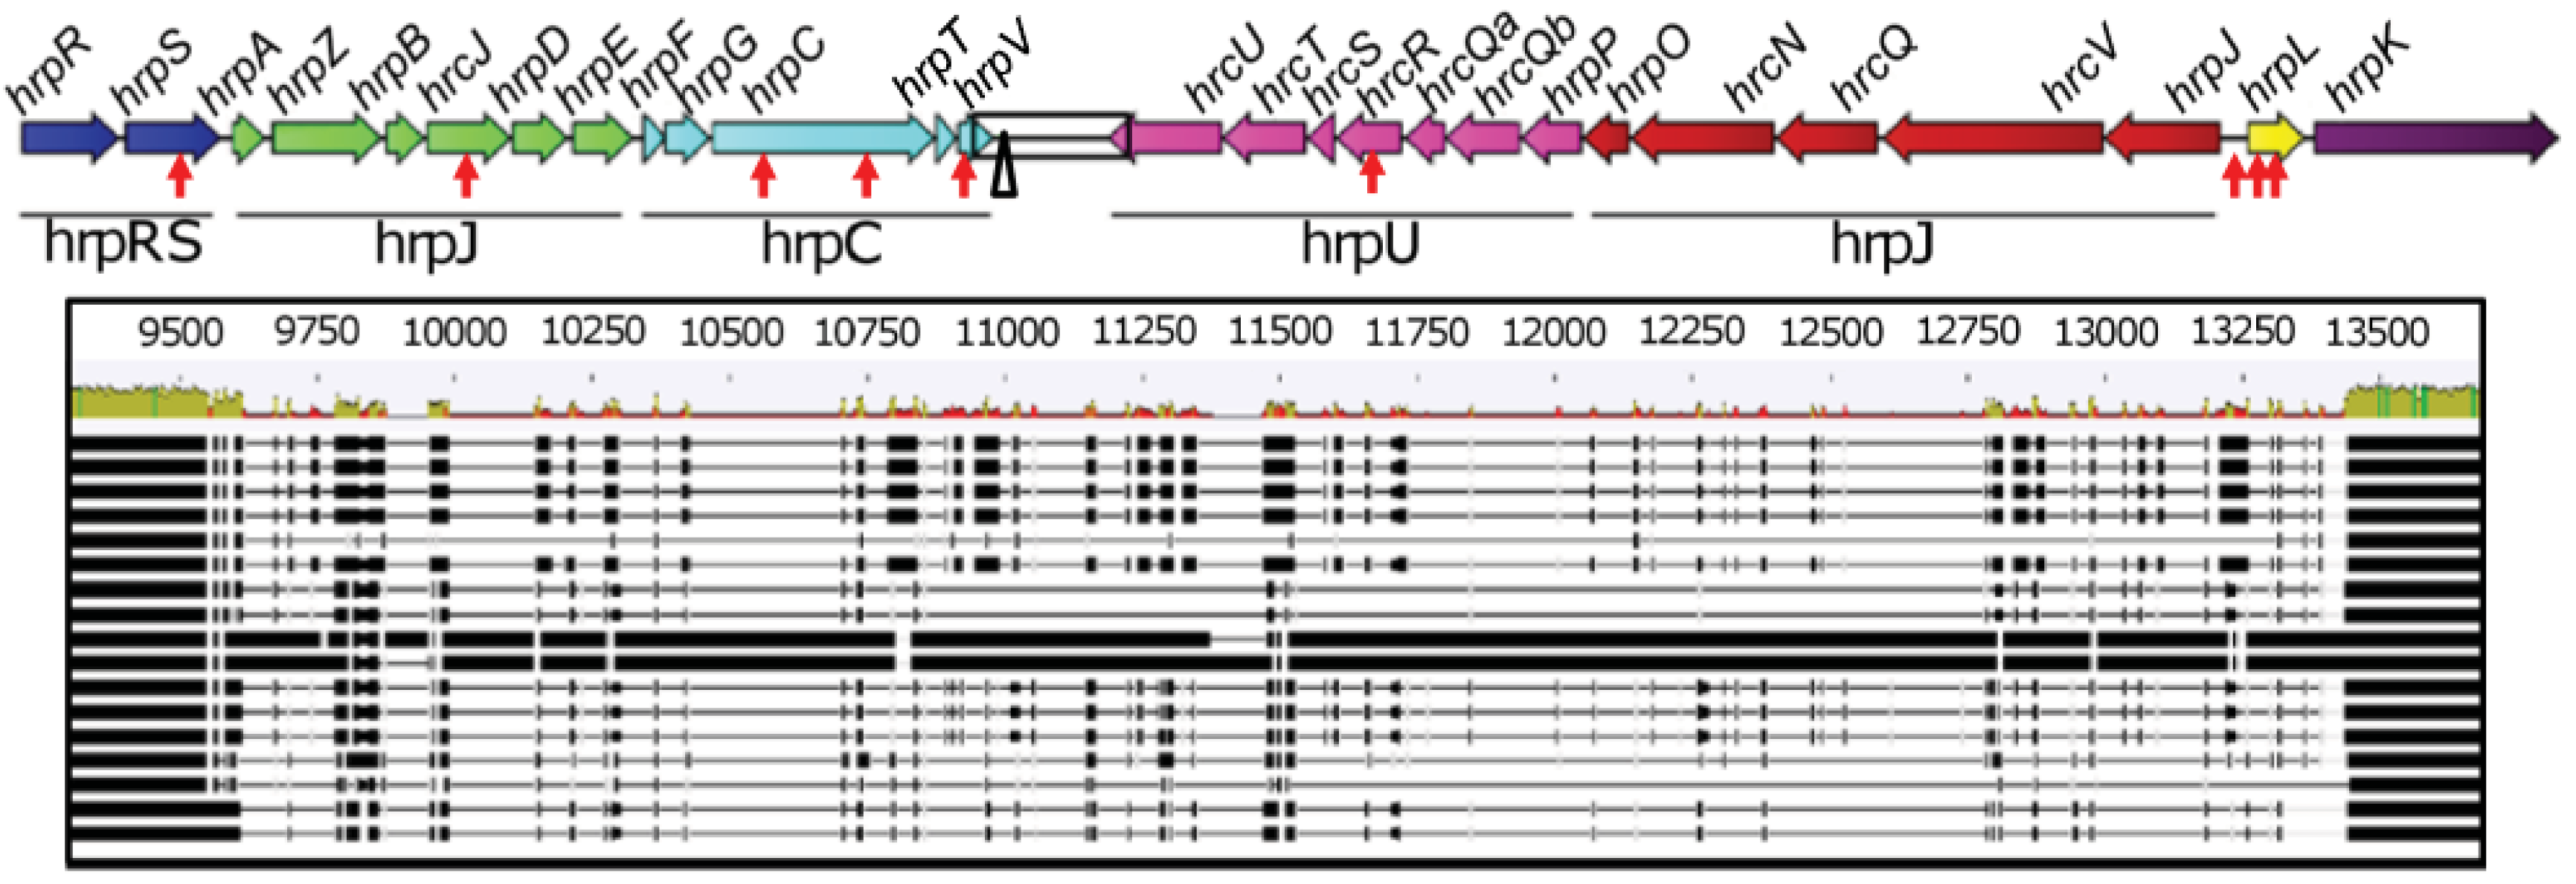
The organization of the TTSS clusters of Psv5 (FR717896), Psn23 (FR717897) and Psf134 (FR717898) was discovered to be identical among these pathovars as shown in Figure 1.

The TTSS cluster is 23,835 bp long, and it is composed of twenty-seven genes, most of which arranged in five operons organized in two main blocks having convergent genes transcription (hrpRS, hrpZ and hrpC on one hand, and hrpU and hrpJ on the other, conventionally reported on the right and left side of the cluster in Figure 1). These two blocks are separated by an hypervariable region, with a very low level of conservation between closely taxonomically related bacteria and containing a remnant of an insertion sequence of the IS66 family [25] (Figure 1). The two genes hrpL and hrpK, coding for a sigma-54 factor [26] and for a protein involved in translocation [27] respectively, are not included in any operon. This kind of organization is known to be shared among other bacterial phytopathogens, like P. syringae, having the so called “Group I Hrp TTSS” [28,29]. The GC content of the entire TTSS cluster of Psv5, Psn23 and Psf134 is 58.8%. The same value was calculated for TTSS cluster of Psv strain NCPPB3335, whose genome was reported to have a GC% content appreciably lower (57.1%) [30]. In all the three P. savastanoi pathovars examined here it was demonstrated that the TTSS cluster is chromosomally located and that each gene is present in a single copy, as assessed by Southern blot and Real-Time PCR, respectively (data not shown).
As far as TTSS sequences of Psv5, Psn23 and Psf134 are concerned, just nine Single Nucleotide Polymorphisms (SNPs) were found to be differentially present in the clusters of these bacteria, eight of which located into an open reading frame (ORF) (Figure 1). In Table S1 and S2 the characteristics of the putative proteins coded by hrp/hrc genes are reported [31-36]. This bioinformatic analysis encourages hypothesizing that these SNPs do not affect the presence of conserved domains on predicted proteins and their subcellular localization, even when non-synonymous mutations were considered. In the same tables, the homologies between Hrp/Hrc predicted proteins of P. savastanoi and of P. syringae pv. phaseolicola 1448A are reported as well. These values range between 97% and 100%, to farther support the close relationship between these bacteria and their Hrp systems.
2.2. Phylogenetic Analysis of TTSS Cluster in P. savastanoi and Other Species of P. syringae Complex
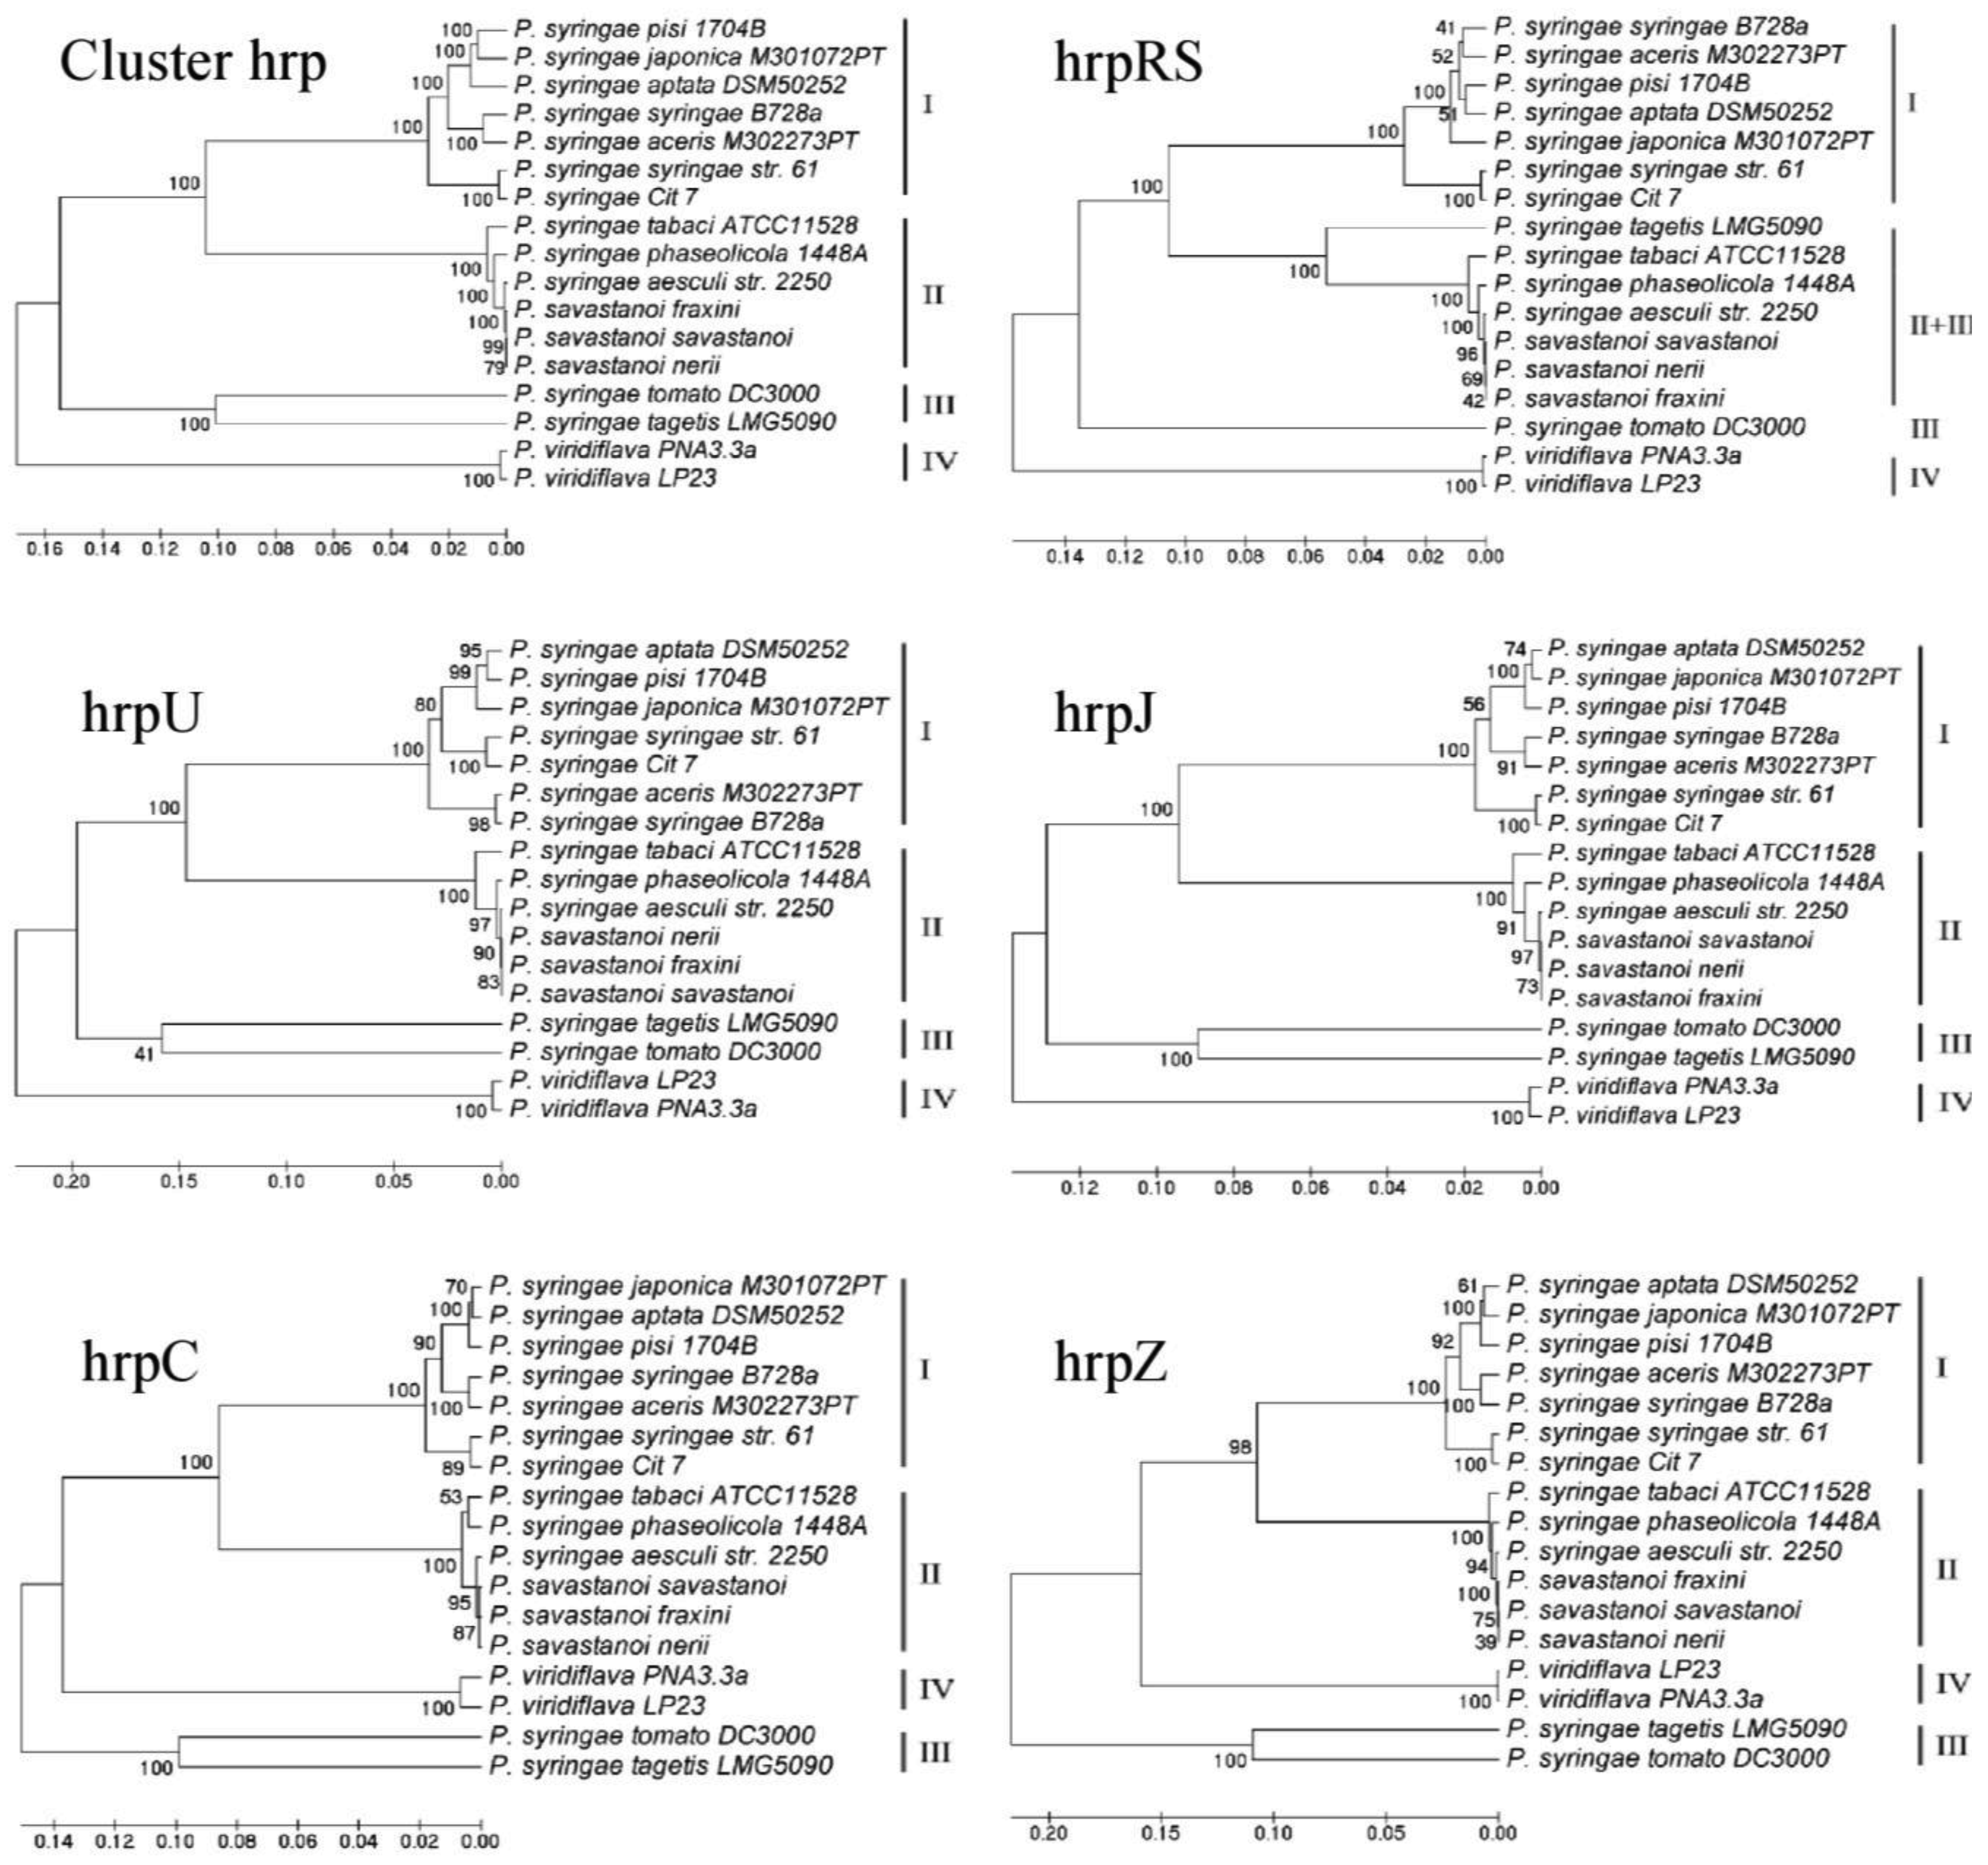
Fourteen different P. syringae pathovars or closely related species, whose TTSS clusters have been completely sequenced, were selected (Table 1) [37-45] to be included in a global phylogenetic sequence analysis together with the three P. savastanoi pathovars previously mentioned. Comparisons were carried out analyzing both the entire TTSS cluster and each operon separately, in order to better understand the fundamental steps driving the evolution of TTSS in these bacteria.
In Figure 2 and in Table 2 the results obtained are shown and statistically evaluated, respectively. The analysis of the entire TTSS cluster and of each operon generated four major branches, with the three P. savastanoi pathovars always in the same minor branch, because of their very small sequence differences. The composition of three of the major branches, corresponding to Groups I, II and III, was coherent with data already obtained using hrpS and hrpL genes [46] or the single hrpZ operon [47]. For the first time the composition of these groups and their organization can be definitely confirmed both analyzing the entire TTSS cluster and using a representative range of species of the P. syringae complex. Here in Group I, only the bacteria belonging to genomospecies 1 were included [48,49]. Similarly, Group IV was exclusive of P. viridiflava, which was the only one in this analysis belonging to genomospecies 6. The three P. savastanoi pathovars examined here were always included in Group II, together with P. syringae pv. aesculi, another phytopathogenic bacterium attacking woody plants. Other bacteria belonging to genomospecies 2 were also clustered in Group II, such as P. syringae pv. tabaci and pv. phaseolicola [48,49]. As far as P. syringae pv. tomato and pv. tagetis are concerned, although belonging to genomospecies 3 and 7 respectively [48,49], here they clustered in Group III. The only exception was the phylogenetic tree derived from the analysis of operon hrpRS, where Group III was split and pv. tagetis was on a minor branch closely related to that of Group II. Moreover, a change occurred in the topology of the phylogenetic trees obtained from hrpZ and hrpC operons towards those referred to the entire TTSS cluster and to hrpJ and hrpU operons, with the inversion of Groups III and IV (Figure 2).


| Strain | Accession Number a | References |
|---|---|---|
| P. savastanoi pv. fraxinii NCPPB1006 b | FR717898 | This work |
| P. savastanoi pv. nerii ESC23 b | FR717897 | This work |
| P. savastanoi pv. savastanoi ITM317 b | FR717896 | Sisto et al., 2004 [23] |
| P. syringae Cit 7 | GL385012 | Baltrus et al., 2011 [37] |
| P. syringae pv. aceris M302273PT | GL385308 | Baltrus et al., 2011 [37] |
| P. syringae pv. aesculi str. 2250 | NZ_ACXT01000080 | Green et al., 2010 [38] |
| P. syringae pv. aptata DSM50252 | GL385257 | Baltrus et al., 2011 [37] |
| P. syringae pv. japonica M301072PT | GL384839 | Baltrus et al., 2011 [37] |
| P. syringae pv. phaseolicola 1448A | CP000058 | Joardar et al., 2005 [39] |
| P. syringae pv. pisi 1704B | GL384897 | Baltrus et al., 2011 [37] |
| P. syringae pv. syringae B728a | CP000075 | Feil et al., 2005 [40] |
| P. syringae pv. syringae str. 61 | EF514224 | Alfano et al., 2000 [41] |
| P. syringae pv. tabaci ATCC11528 | FJ946987 | Studholme et al., 2009 [42] |
| P. syringae pv. tagetis LMG5090 | DQ246442 | Song et al., 2005 [43] |
| P. syringae pv. tomato DC3000 | AE016853 | Buell et al., 2003 [44] |
| P. viridiflava LP23 | AY597277 | Araki et al., 2006 [45] |
| P. viridiflava PNA3.3a | AY597278 | Araki et al., 2006 [45] |
aAccession numbers are referred to their TTSS sequence or, in case of availability, to their complete genome;bCodes used at LPVM for strains ITM317, NCPPB1006 and ESC23 are Psv5, Psf134 and Psn23, respectively.
| Tree | |||||||
|---|---|---|---|---|---|---|---|
| hrpRS | hrpZ | hrpC | hrpU | hrpJ | hrpTOT b | ||
| Data(seq) | hrpRS logL | −8024.7 | −8317.7 | 8258.7 | −8263.5 | −8300.4 | −8259.1 |
| ΔlogL | BEST | −292.9 | −234.0 | −238.7 | −275.7 | −234.3 | |
| P value a | - | 0.000 | 0.000 | 0.000 | 0.000 | 0.000 | |
| hrpZ logL | −20247.2 | −18951.0 | −18968.5 | −18980.4 | −18977.6 | −18983.7 | |
| ΔlogL | −1296.2 | BEST | −17.5 | −29.5 | −26.7 | −32.7 | |
| P value a | 0.000 | - | 0.539 | 0.382 | 0.408 | 0.371 | |
| hrpC logL | −14691.8 | −14011.4 | −13904.6 | −13935.3 | −13926.7 | −13917.5 | |
| ΔlogL | −787.1 | −106.8 | BEST | −30.6 | −22.0 | −12.8 | |
| P value a | 0.000 | 0.053 | - | 0.383 | 0.476 | 0.654 | |
| hrpU logL | −20969.1 | −20475.6 | −20327.7 | −20314.6 | −20324.7 | −20328.3 | |
| ΔlogL | −654.5 | −161.0 | −13.1 | BEST | −10.1 | −13.7 | |
| P value a | 0.000 | 0.005 | 0.644 | - | 0.681 | 0.637 | |
| hrpJ logL | −26050.1 | −25554.7 | −25361.1 | −25387.2 | −25354.8 | −25363.5 | |
| ΔlogL | −695.3 | −199.9 | −6.3 | −32.4 | BEST | −8.7 | |
| P value a | 0.000 | 0.003 | 0.824 | 0.408 | - | 0.755 | |
| hrpTOT b logL | −121132.6 | −117951.1 | −117292.9 | −117348.7 | −117362.0 | −117158.7 | |
| ΔlogL | −3973.9 | −792.4 | −134.2 | −190.0 | −203.3 | BEST | |
| P value a | 0.000 | 0.000 | 0.202 | 0.107 | 0.094 | - | |
aP-value identifies the probability that the data fits the tree. Bolded values indicate trees that fit the data significantly worse than the best tree given the data. Names of operons are not in italics to differentiate from gene names;bhrpTOT refers to the tree or the data obtained from the analysis of the entire TTSS cluster.
More important considerations can be raised following a deeper statistical analysis carried out performing the Shimodaira-Hasegawa (SH) test [50], aimed to determine if the phylogenetic trees obtained by analysing the entire TTSS or any of its operons are as good as the best trees derived from each of the different data sets. In other terms, SH test ascertains if different data sets share the same evolutionary history. Therefore, the significance of the topological differences among hrp operons and the whole cluster was tested and evaluated to understand their contribution to the global phylogenetic variation of TTSS. The results obtained are reported in Table 2. The operon hrpU and hrpJ data were found to be congruent with all but the hrpRS and hrpZ trees. The operon hrpZ and hrpC data were found to be congruent with the tree generated from the whole TTSS cluster and with the trees of all the other operons but hrpRS'. In this regard, a remnant of an insertions sequence was found in the hypervariable region between hrpC and hrpU operons of the three P. savastanoi pathovars here examined, as previously reported in the TTSS clusters of other P. syringae pathovars [41,42,51]. Together these data seem to suggest that an important recombination event has occurred early in the evolution of TTSS cluster in the P. syringae complex, that it was more likely to happen via Horizontal Genetic Transfer (HGT) from an enteric bacterium pathogenic on animals or humans [52,53]. The direction of this hypothetic HGT event is also suggested by the different genomic localization of the TTSS clusters in pathogenic bacteria of animals and plants. Mainly these clusters are located on plasmidic pathogenicity islands (PAI) among the enteric bacteria pathogens for animals and humans, while they are often integrated into the bacterial chromosome in those pathogenic on plants [53,54]. Moreover, it is worth noticing that when the architecture of P. savastanoi TTSS was compared with that of enterobacterial phytopathogens, belonging to Group I Hrp TTSS cluster with P. syringae, genes of hrpC and hrpZ operons appeared to be transposed upstream of hrpL gene, and hrpJ and hrpU operons, though maintaining their orientation [54]. In accordance with all these data, the most widely accepted hypothesis is that a common ancestor of P. syringae and of enterobacterial plant pathogens likely acquired TTSS cluster by a single HGT prior to their speciation [53]. Then multiple interspecific HGT events would have occurred during their evolution, both among P. syringae and the enteric phytopathogens. The acquisition of information essential to allow the adaptation of these pathogens to new hosts were stably maintained in their genomes, thus explaining the incongruences found among the phylogenies of TTSS genes and operons [53].
Another important finding derived from the SH test refers to the operon hrpRS. Here for the first time we demonstrated the complete incongruence between operon hrpRS data and any of the trees obtained except its own. The hrpS and hrpR genes are two of the most important regulators of TTSS physiology. HrpS and HrpR proteins are supposed to act as a dimer to promote the expression of hrpL, coding for a sigma-54 factor [17]. Our data seem to fit the theory recently hypothesized by Jovanovich and colleagues [55] assessing that the operon hrpRS was crucial in the evolution and the expression of pathogenicity/virulence in these bacteria. According to their data, it seems that a co-evolution of hrpR and hrpS genes has occurred, probably following a gene duplication event during the P. syringae adaptive evolution to its different hosts. Besides TTSS regulatory elements, this evolution appears to have been positively driven also by several mutations involving bacterial effectors. This was very recently assessed by profiling the TTSS effectors of bacteria belonging to the P. syringae complex [56], with results highly consistent with those obtained here. Together these data suggest the hypothesis that during the patho-adaptive differentiation of the P. syringae complex, elements of the flexible genome follow an evolution strictly consistent with that of the core genome [57]. To support this hypothesis, a common evolutionary history has already been reported for two TTSS regulatory genes, among which hrpS, and the two housekeeping genes gyrB and rpoD [46]. If this was further confirmed, phylogenetic studies focused on TTSS would make an important contribution in the determination of the evolutionary relationships among bacteria of the P. syringae complex. In this regard, our data confirmed previous findings about hrpZ operon [24,47], that was proved to be the best candidate to unveil the evolutionary shaping of TTSS, together with hrpC operon. Moreover, the potential of hrpRS operon to display the patho-adaptive forces acting on this system was also revealed.
2.3. Time Course Expression Analysis of TTSS in P. savastanoi Pathovars
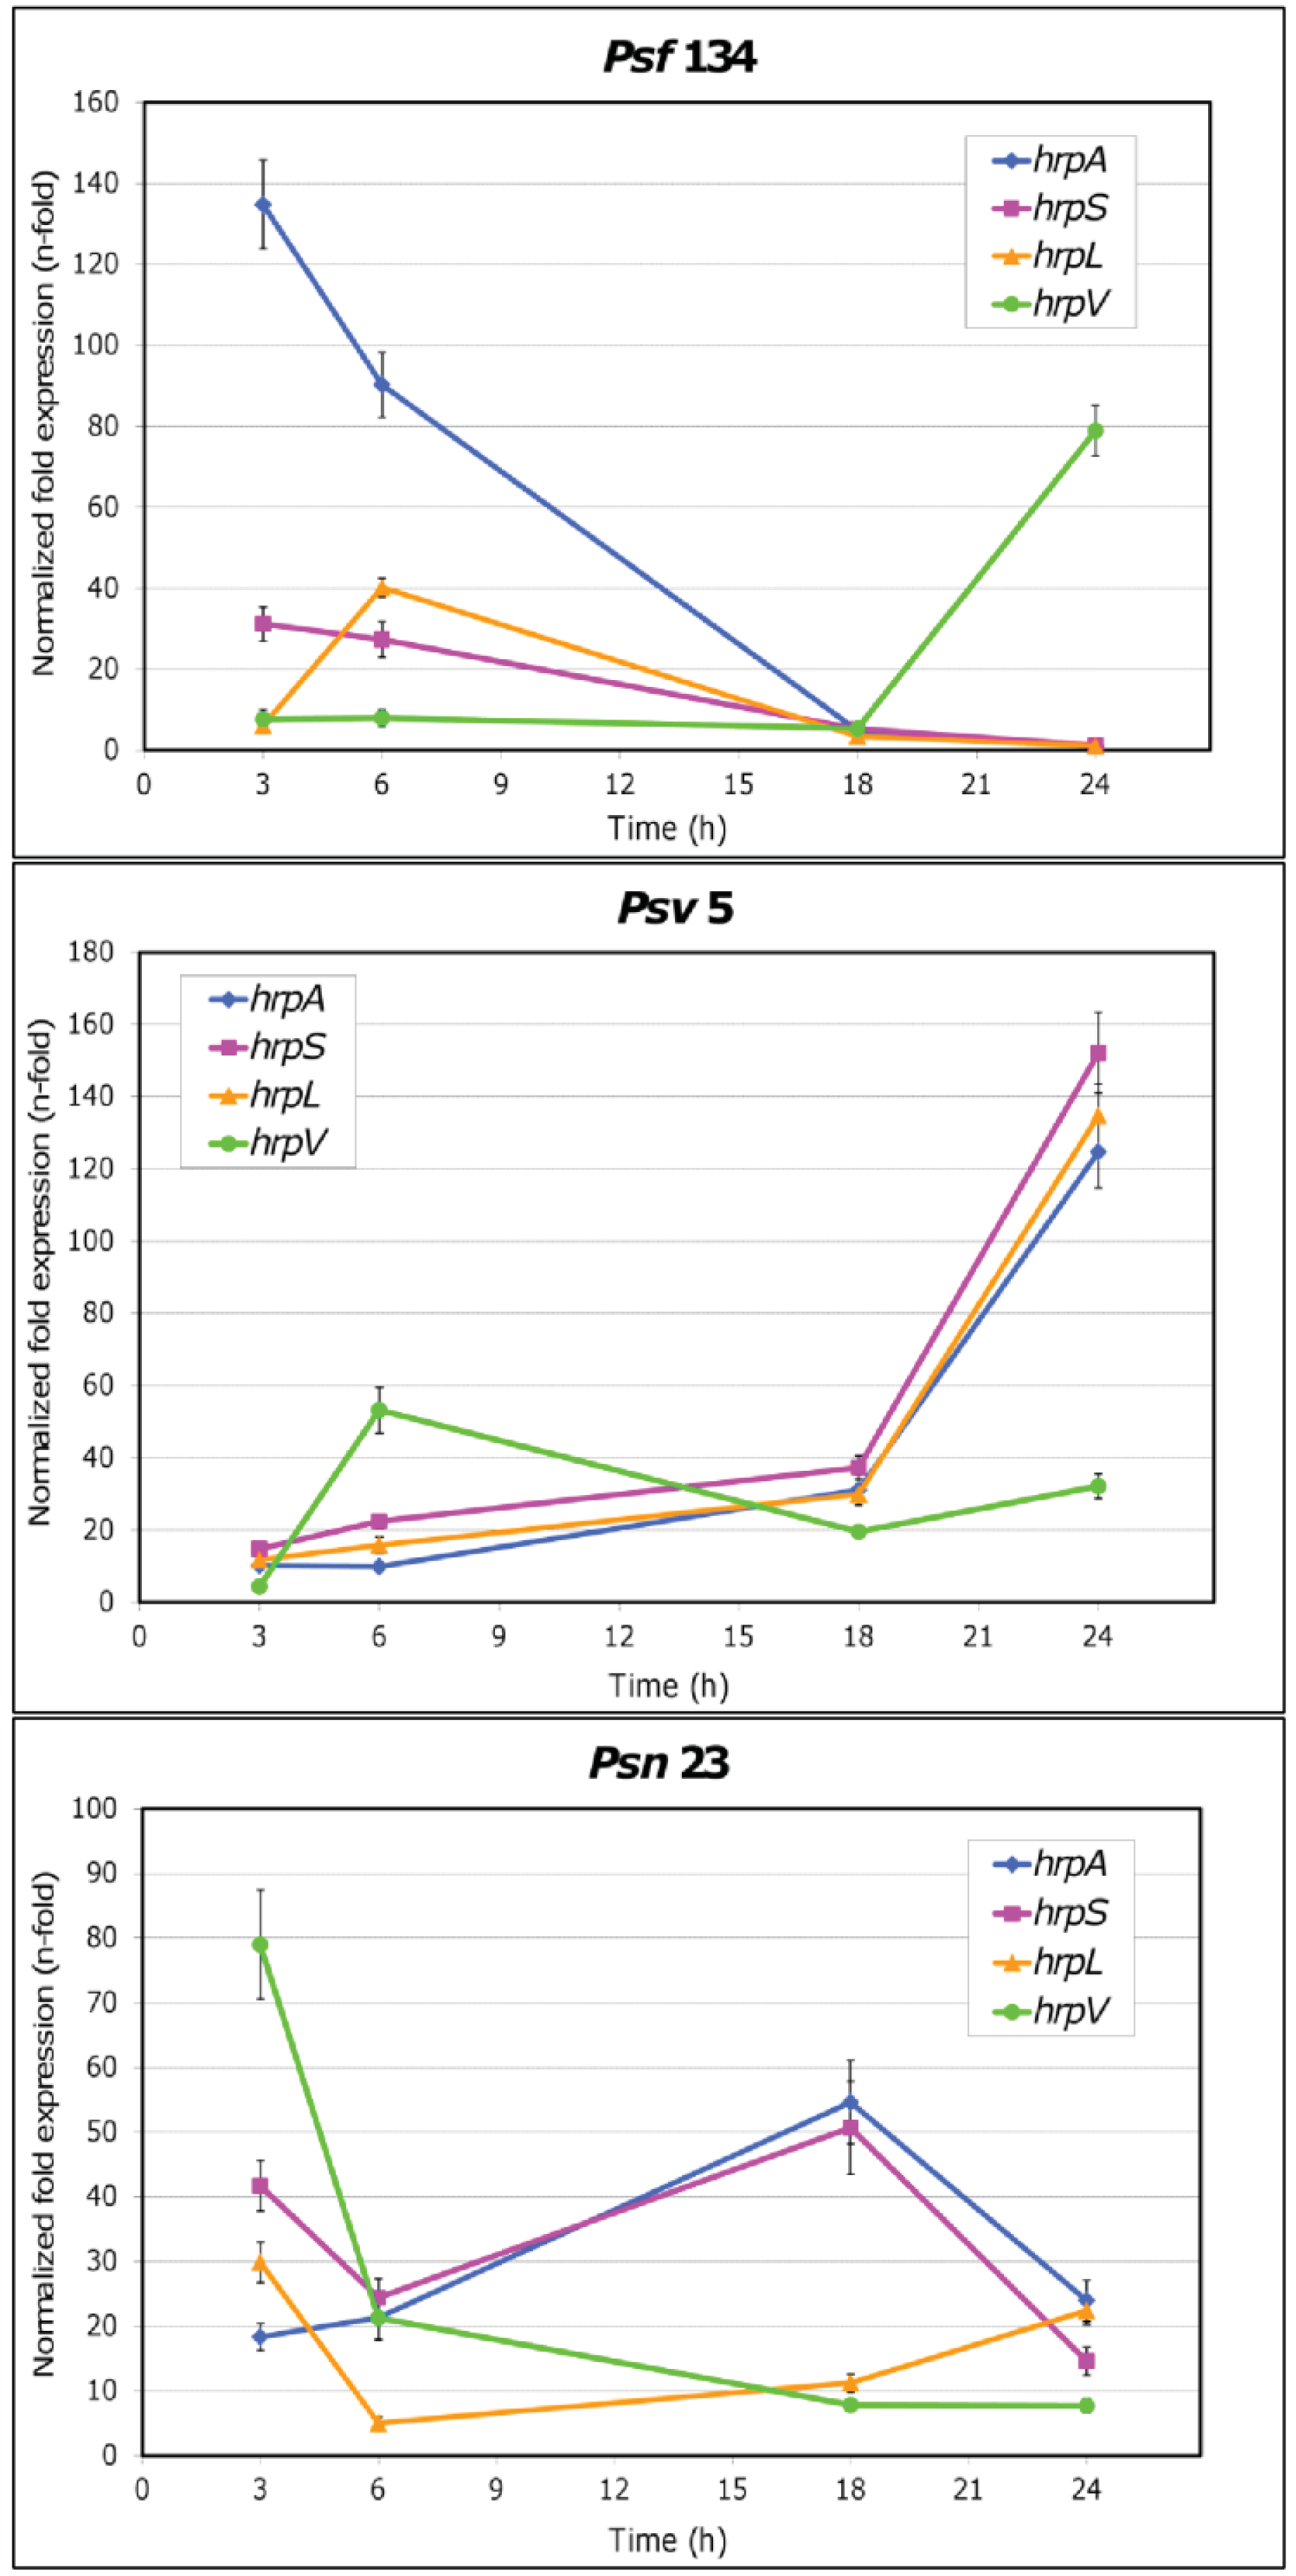
According to the recent findings concerning the importance of TTSS regulatory genes, such as hrpS, in the adaptive evolution of these bacteria to their hosts [55], for the first time we also investigated the time course expression of several TTSS genes of the three P. savastanoi pathovars here examined. This analysis was carried out by Real-Time PCR on cells grown in vitro on hrp-inducing minimal medium (MM) [7] and on nutrient-rich medium King's B medium (KB) [58]. To this purpose, hrpS, hrpL and hrpV genes were selected, the last two coding for a positive and a negative regulator of HrpS-promoted TTSS transcription, respectively [17]. Together with these genes, the structural gene hrpA, coding for the main protein subunit of the TTSS pilus, was also tested [17]. Using the primers reported in Table 3, amplification efficiencies ranged from 95% and 105%. The efficiency of the primer pairs for hrpA, hrpL, hrpS and hrpV genes was less than 5% different from that of the primer pair for the housekeeping gene 16S rDNA, used for data normalization [59]. At an annealing temperature of 60 °C, efficiency values for hrpA, hrpS, hrpL and 16S rDNA were 100.7%, 100.3%, 98.5% and 100.2%, respectively. At an annealing temperature of 62 °C, the values for hrpV and 16S rDNA were 99.6% and 100.2%, respectively. The normalized relative expression of each gene was analyzed in MM vs. KB medium grown cells, at 3, 6, 18 and 24 h after inoculation of a starter culture in the corresponding fresh medium.
| Gene name a | Primer name | Primer sequence (5′ to 3′) | Amplicon size (bp) |
|---|---|---|---|
| hrpA | hrpA RT for | GCAGGGTATCAACAGCGTCAAG | 156 |
| hrpA RT rev | CCGTTCTCTTCGTTCGCAGT | ||
| hrpS | hrpS RT for | AGCGGCACAAGGCGGAAC | 156 |
| hrpS RT rev | TGGGCCGAAGCGATCACG | ||
| hrpL | hrpL RT for | AGCCGCAGACCTGGTTGTG | 159 |
| hrpL RT rev | ATTGCCTGTGCCCGTCTACC | ||
| hrpV | hrpV RT for | CGTCCCGAGCAACTGAGAGAG | 162 |
| hrpV RT rev | ATGTCGCCGTATGTCATCCAGG | ||
| 16S rDNA | 16s RT for | GGAATCTGCCTGGTAGTGGGG | 157 |
| 16s RT rev | GGCTCACCAAGGCGACGAT |
aGene targeted by the corresponding primer pair.
The results obtained are reported in Figure 3 and in Table S3. For the first time it was demonstrated that TTSS genes are overexpressed in cultural conditions mimicking the plant apoplast in each of the three P. savastanoi pathovars here examined. Moreover pathovar-specific expression patterns were observed. In particular, the highest values for the relative expression of both hrpA and hrpS were reached by Psf134 after three hours, while hrpL peaked at six hours (Figure 3). The expression of all genes dropped off after 18 h with the exception of hrpV, supposed to be an inhibitor of HrpS action [12,17], that increased up to a level of 80 fold after one day from the beginning of the simulated infection. Different expression patterns were shown by Psv5 (Figure 3). Relative expression levels of hrpA, hrpL and hrpS remained low for the first 18 h of growth on MM, after which they started to rise and reached levels ranging from 124.7 to 152.1 fold at 24 h. As expected, hrpV followed an opposite trend, since its highest relative expression level was reached after 6 h of bacterial growth on MM (53.2 fold). As far as Psn23 is concerned, the expression pattern of TTSS genes seemed to be more finely tuned (Figure 3). In particular, the highest relative expression levels for hrpA and hrpS were reached after 18 h, and then they started to decrease. The genes hrpV and hrpL peaked at 3 h of growth on MM. While hrpV signals progressively decreased until the end of the experiment, hrpL had a slight but continuous recovery up to 24 h (22.4 fold).
Several models have been proposed to describe the regulatory network for hrp/hrc gene expression in P. syringae and other phytopathogens, according to data collected in experiments mainly carried out in vitro using different hrp-inducing media and less frequently in planta [7-17,19-22,60]. These models are considerably variable among different bacterial phytopathogens even when closely related. However the importance of HrpL as a central point within this network and for the transcription of the other TTSS genes is constantly reported, as confirmed very recently by Boolean model simulating the activity of the hrp regulon in P. syringae [18]. Furthermore this model gave an important although theoretical contribution to clarify some conflicting data concerning the role of GacS/GacA system on the dynamical regulation of TTSS gene expression [12,61]. According to this model, the TTSS appears to be very tightly regulated, following the sequence of events rather than the timing as the most critical regulating factor. This would guarantee a more robust stability to any casual perturbation, such as evolutionary changes in the sequences of any TTSS components involved. In this frame GacS/GacA is here indicated as the only determinant of the expression of hrp regulon, although some important points still need to be elucidated. Among these there are the biotic and abiotic signals perceived by GacS sensor kinase, the production of the response regulator GacA, the mode of interaction between GacS and GacA, and the integration of this system with other regulatory elements known to act on hrp regulon. To this concern, a main role was demonstrated to be played by Lon protease, essential for switching on and off the P. syringae TTSS genes in inducing and repressive conditions, respectively [12,21].
Our results clearly suggest that the in vitro expression of TTSS is differently regulated in the three P. savastanoi pathovars here examined. A pathovar-specific regulation of hrp/hrc genes could be hypothesized to occur also in planta, matching the environmental conditions found by these P. savastanoi pathovars in their respective hosts, and possibly having some role in host-range determination. Intriguingly, in the first hours of growth on hrp-inducing medium the overexpression of the gene coding for the negative regulator HrpV was higher in those pathovars having the broadest host ranges, which are Psn and Psv. In contrast in Psf, which is able to attack just Ash, the early and apparently HrpV-unrestricted overexpression of hrpA could contribute to narrow its host range. Until now there is no clear evidence of any elicitor activity for HrpA. However this protein is the main component of TTSS pilus and its coding gene was demonstrated to be under strong diversifying selection into P. syringae species, presumably to avoid recognition by the host [47].

Nothing is known yet about regulatory systems acting upstream to TTSS, such as GacS/GacA and Lon protease, in none of the P. savastanoi pathovars here studied. Therefore it cannot be ruled out that their pathovar-specific expression patterns for the hrp genes examined could depend on their different abilities to perceive and translate environmental stimuli, such as those given by hrp-inducing medium. Actually differential modes for hrpR and hrpS expression were already found in P. syringae pv. syringae and pv. tomato [62-64], as well as for their regulation by GacS/GacA [61]. Furthermore, some of the SNPs we found in the TTSS sequences of these P. savastanoi pathovars mapped in the regulatory genes hrpS, hrpL and hrpV. It is worth noticing that just in these cases these SNPs gave rise to changes in the coiled-coil regions of the corresponding proteins (Table S1 and Table S2). Coiled-coil regions are known to be essential in several protein-protein interactions, particularly in the formation of multimeric complexes and in molecular recognition events [65,66].
Further experiments need to be carried out to prove if the pathovar-specific expression of hrp/hrc genes in P. savastanoi is dependent on a differential regulation of this system and if coiled-coil interactions are involved.
3. Experimental Section
3.1. Bacterial Strains and Growth Conditions
The P. savastanoi strains used in this study are Psv5, Psn23 and Psf134, belonging to the pathovars savastanoi, nerii, and fraxini respectively (Table 1). They were routinely grown at 26 °C, on KB [58] or on MM [7], in solid or in liquid cultures according to the experimental purposes.
Bacterial growth was monitored by determining the optical density at 600 nm (OD600) at different times during incubation, and bacterial concentration was estimated by serial dilutions and plate counts. For long-term storage, bacteria were maintained at −20 °C and −80 °C on 40% (v/v) glycerol.
The strains were periodically monitored by 16S rDNA amplification followed by enzymatic restriction with AluI [67,68], and by P. savastanoi PCR specific assays [69].
3.2. Molecular Techniques and DNA Sequences Analysis
Standard general recombinant DNA techniques were performed according to Sambrook et al. [70]. Genomic DNA was purified from bacterial liquid cultures (OD600 = 0.8) using Gentra® Puregene kit (Qiagen, Valencia, CA, USA), according to manufacturers' instructions. DNA amplicons were purified from agarose gels with PureLink® Quick Gel Extraction Kit (Invitrogen Inc., Carlsbad, CA, USA), under the conditions recommended by the manufacturer. DNA concentration was evaluated both spectrophotometrically, with NanoDrop™ ND-1000 (NanoDrop Technologies Inc., DE, USA), and visually by standard agarose gel electrophoresis [1% agarose (w:v) in TBE 1X] [70].
Oligonucleotide primers for overlapping amplicons targeting all the hrp/hrc genes were designed according to the data available on the main databases on P. savastanoi and on bacteria taxonomically related, and then used to screen the genomic libraries of strains Psv5, Psn23 and Psf134 by PCR. Primers were designed by using Beacon Designer 8.0 software (Premier Biosoft International, Palo Alto, CA, USA) (Table S4). For each library, those clones giving positive amplification signals with all the primer pairs here used were identified. Among those, one clone for each P. savastanoi pathovar was selected and isolated (clones ST-5-22-4A, ST-23-19-2F and ST-134-31-7G for Psv5, Psn23 and Psf134, respectively).
The nucleotide sequences of the entire TTSS clusters of Psv5, Psn23 and Psf134 were then determined by sub-cloning and double-strand sequencing the library clones (Eurofins MWG Operon Ltd., Ebersberg, Germany).
DNA sequences were annotated with the aid of Basic Local Alignment Search Tool (BLAST) [71], and predicted proteins were analyzed with the online Structure Prediction Suite SOSUI [31-34].
The presence of insertion sequences was assessed through ISfinder database [72,73].
Predicted proteins were analyzed for the presence of conserved domains and for homologies, by BLAST-CD search [35] and by ClustalW2 software [36], respectively.
3.3. Phylogenetic Analysis
A phylogenetic analysis was performed on the complete TTSS cluster of the bacterial strains listed in Table 1 [37-45] and on each of its major operons (hrpRS, hrpZ, hrpC, hrpU and hrpJ). The analysis involved seventeen nucleotide sequences that were aligned using ClustalW2 software [36], with the “Slow” Pairwise Alignment Type, and manually adjusted, if needed. The evolutionary history was inferred by using the Maximum Likelihood method based on the Tamura-Nei model, with the aid of Mega software ver. 5 [74-76]. The congruence of branching order was assessed with 1,000 bootstrap replications. Initial trees for the heuristic search were automatically obtained as follows. If the number of common sites was <100 or less than one fourth of the total number of sites, the maximum parsimony method was used. Otherwise, BIONJ method with MCL distance matrix was used. The tree is drawn to scale, with branch lengths related to the number of substitutions per site. All the positions containing gaps and missing data were eliminated.
Phylogenetic congruence between trees was inferred by SH test [50] with dnaML software contained in the Phylip package (ver 3.69) [77]. This test quantitatively evaluates the likelihood of alternative trees given a data set and basically establishes if the evolutionary histories between different data sets are the same.
3.4. Quantitative Real-Time PCR Analysis
Starter liquid cultures of strains Psv5, Psn23 and Psf134 were grown overnight in 20 mL KB, at 26 °C and under continuous shaking at 100 rpm. Cells were washed in sterile physiological solution (0.85% NaCl in distilled water) twice and used to inoculate 6 mL of fresh KB and MM medium, adjusting the concentration at 0.5 OD600. The cultures were then incubated as above, sampled after 3 h, 6 h, 18 h and 24 h, and used for RNA extraction performed with RNeasy Midi Kit (Qiagen). About 1 μg of RNA for each treatment was reverse transcribed using QuantiTect Reverse Transcription Kit (Qiagen), according to the manufacturer's instructions.
Quantitative Real-Time PCR (RT-qPCR) was carried out on iQ5 Cycler—Real-Time PCR Detection System (Bio-Rad Laboratories, Inc., Hercules, CA, USA), in 96 well PCR plates, with 25 μL reaction mixture volume, using iQ SYBR® Green Supermix (Bio-Rad), according to the manufacturer's instructions. The primers used for Real-Time expression analysis are reported in Table 3. As housekeeping gene, 16S rDNA was used. Each sample was run in triplicate, including standards and negative controls, using three different batches of cDNA obtained from three independent RNA preparations. The PCR protocol was 40 cycles with 95 °C for 20 seconds, 60 °C (or 62 °C exclusively for hrpV gene) for 20 seconds, and 72 °C for 20 seconds, after an initial step of 95 °C for 3 min. The amount of fluorescence given by incorporation of the SYBR Green dye into double-stranded DNA was evaluated for each sample at the end of each cycle, and analyzed to determine the resulting threshold cycle (Ct) values by iQ5 Optical System Software 2.0 (Bio-Rad). Dissociation analysis of amplicons was performed (from 60 to 95 °C, with a 0.5 °C increase every 5 seconds) at the end of each PCR run to check for aspecific amplifications. The comparative Livak (2−ΔΔCT) method [60] was used to analyze the mRNA level. The Ct values of each gene tested were normalized to the Ct values of the housekeeping gene, to obtain relative expression data for each gene examined.
In order to avoid significant measurement inaccuracies, the amplification efficiency of each primer pair was estimated producing Real-Time PCR curves for a ten-fold dilution series of Psn23 genomic DNA (from 50 ng to 0.5 pg) used as template. The slope of the log-linear phase of each curve reflects the amplification efficiency, which should range between 90% and 100%, with slope value between −3.2 and −3.4, and R2 of at least 0.998.
All the data obtained represent the mean of three independent replication ± SD. Statistical analyses were performed using the two-tailed t-test.
4. Conclusions
For the first time here the TTSS clusters of the pathovars nerii and fraxini of the species P. savastanoi were sequenced. Moreover the TTSS sequence of another Psv strain was also obtained, in addition to that of Psv strain NCPPB3335 whose genome was recently published. The availability of these data provided an important opportunity to carry out a more robust phylogenetic and statistical analysis than has occurred in the past on the evolution of this secretion system during the differentiation of the species belonging to the P. syringae complex.
By comparing the congruence among the sequences of the entire TTSS and its five major operons from seventeen species and pathovars of this complex, here we found that operons hrpZ and hrpRS have been the most affected by the dynamical processes occurring in the shaping of this system during the adaptive evolution of these bacteria to their hosts. The positive selection acting on some structural genes belonging to hrpZ operon, such as hrpA, was reasonably functional to avoid recognition by the host defenses. For a phytopathogenic bacterium, it is also important to be able to finely regulate hrp/hrc gene expression to successfully interact with its hosts. The incongruence between hrpRS data, and any of the other trees but its own, supports the hypothesis that the evolution of this operon was crucial for the adaptive process of these bacteria to new hosts. Moreover, according to our results the evolution of TTSS across P. syringae bacteria was quite coherent with that of the core genome and of the rest of the flexible genome.
In this regard, differential patterns were found for the in vitro expression of four hrp/hrc genes under inducing conditions in the three P. savastanoi pathovars examined here. According to our hypothesis, this could be related to a pathovar-specific regulation of TTSS genes. Further studies are needed to ascertain if this occurs also in planta, and has any role in the determination of the host-range of these P. savastanoi pathovars.
Acknowledgments
We gratefully acknowledge Elena Santilli and Francesca Fontana for assistance in experimental design, Camilla Ciolli Mattioli, Stefania Caparrotta and Elena Colombi for technical support, and Marta Bencini and Margaret Gordon for English revision.
We gratefully acknowledge “Ente Cassa di Risparmio di Firenze” for financially supporting this research with grant number 2007.1005-2010.0972.
Conceived and designed the experiments: A.G., A.S., M.C. and S.T. Performed the experiments: A.G. and S.T. Analyzed the data: A.G., A.S., M.C., M.G.C. and S.T. Wrote the paper: A.G., A.S. and S.T. Read and approved the paper: A.G., A.S., M.C., M.G.C. and S.T.
Supplementary Material
| Name | length (aa) | ave. hyd. | TM-Reg | sign | loc | Ccoil reg. | CDDs | Homology (%) | ||
|---|---|---|---|---|---|---|---|---|---|---|
| HrcC | Psf | 699 | −0,326609 | (S) | - | + (1–23) | OM | 307–334 | + | 99.0 |
| Psv | 699 | −0,326609 | (S) | - | + (1–23) | OM | 307–334 | + | 99.0 | |
| Psn | 699 | −0,319456 | (S) | - | + (1–23) | OM | 307–334 | + | 99.0 | |
| HrcJ | Psf | 268 | 0.216418 | (M) | 2 (P1–23 / P220–242) | - | IM | 26–58, 91–127 | + | 98.0 |
| Psv | 268 | 0.211567 | (M) | 2 (P1–23 / P220–242) | - | IM | 26–58, 91–127 | + | 99.0 | |
| Psn | 268 | 0.211567 | (M) | 2 (P1–23 / P220–242) | - | IM | 26–58, 91–127 | + | 99.0 | |
| HrcN | 449 | 0.003341 | (S) | - | - | C | 202–231, 358–406 | + | 99.0 | |
| HrcQa | 238 | −0.123950 | (S) | - | - | C | 121–157, 207–238 | + | 98.0 | |
| HrcQb | 129 | −0.571317 | (S) | - | - | C | - | + | 100.0 | |
| HrcR | Psf | 208 | 0.719712 | (M) | 4 (P8–30 / P44–66 / P150–172 / P179–201) | - | IM | 62–103 | + | 100.0 |
| Psv | 208 | 0.719712 | (M) | 4 (P8–30 / P44–66 / P150–172 / P179–201) | - | IM | 62–103 | + | 100.0 | |
| Psn | 208 | 0.710577 | (M) | 4 (P8–30 / P44–66 / P150–172 / P179–201) | - | IM | 62–103 | + | 99.0 | |
| HrcS | 88 | 1,061364 | (M) | 3 (P10–32 / S42–64 / S67–88) | - | IM | - | + | 100.0 | |
| HrcT | 264 | 0.936364 | (M) | 7 (S12–34 / S43–65 / P76–98 / S134–156 / P186–208 / P217–239 / P243–264) | + (1–37) | IM | - | + | 99.0 | |
| HrcU | 359 | 0.140111 | (M) | 5 (S26–48 / P73–95 / S132–154 / S157–179 / P183–205) | - | IM | 201–248 | + | 99.0 | |
| HrcV | 695 | 0.266475 | (M) | 6 (P31–53 / S71–93 / P108–130 / P203–225 / S237–259 / P296–318) | + (1–17) | IM | 473–563 | + | 99.0 |
Columns, ordered from left to right indicate: (1) Putative protein name; (2) Name of the corresponding pathovar when non synonymous mutations are present; (3) Length of putative protein; (4) Average of hydrophobicity, according to SOSUI [31]; (5) S = Soluble, M = Membrane, as predicted by SOSUI [31]; (6) Presence, number and type (P = Primary, S = Secondary) of Trans-Membrane regions, predicted by SOSUI [31]; (7) Presence of Signal Peptide, predicted by SOSUIsign [32]; (8) Localization of putative protein (EC = Extracellular, C = Cytoplasm, OM = Outer Membrane, P = Periplasm, IM = Inner membrane, U = Unknown), predicted by SOSUIgramN [33]; (9) Presence of Coiled-coil regions, predicted by SOSUIcoil [34]; (10) Presence of Conserved Domains, evaluated using BLAST-CDDs [35]; (11) Percentage of homology with the same predicted protein from P. syringae pv. phaseolicola 1448A, evaluated with ClustalW [36].
| Name | length (aa) | ave. hyd. | TM-Reg | sign | loc | Ccoil reg. | CDDs | Homology (%) | ||
|---|---|---|---|---|---|---|---|---|---|---|
| HrpA | 108 | −0.331482 | (S) | - | - | EC | 59–105 | + | 97.0 | |
| HrpB | 124 | −0.184678 | (S) | - | - | EC | 52–90 | + | 99.0 | |
| HrpD | 176 | −0.253977 | (S) | - | - | C | - | - | 97.0 | |
| HrpE | 193 | −0.180311 | (S) | - | - | C | 34–99 | + | 100.0 | |
| HrpF | 74 | −0.393243 | (S) | - | - | C | - | + | 100.0 | |
| HrpG | 146 | 0.042466 | (S) | - | - | C | - | - | 98.0 | |
| HrpJ | 368 | −0.305978 | (S) | - | + (1–30) | OM | 30–76, 82–157, 197–228, 245–278, 330–368 | + | 99 0 | |
| HrpL | Psf | 184 | −0.438587 | (S) | - | - | C | 152–179 | + | 98.0 |
| Psv | 184 | −0.43858 | (S) | - | - | C | 152–180 | + | 98.0 | |
| Psn | 184 | −0.460870 | (S) | - | - | C | 152–181 | + | 98.0 | |
| HrpO | 148 | −1.135810 | (S) | - | - | C | 10–148 | + | 99.0 | |
| HrpP | 190 | −0.461053 | (S) | - | - | P | 138–165 | + | 98.0 | |
| HrpQ | 324 | −0.169445 | (S) | - | - | C | 220–250 | + | 99.0 | |
| HrpR | 306 | −0.113072 | (S) | - | - | C | 261–304 | + | 99.0 | |
| HrpS | Psf | 302 | −0.106954 | (S) | - | - | C | 105–142, 246–286 | + | 99.0 |
| Psv | 302 | −0.098344 | (S) | - | - | C | 105–132, 246–286 | + | 99.0 | |
| Psn | 302 | −0.106954 | (S) | - | - | C | 105–142, 246–286 | + | 99.0 | |
| HrpT | 67 | −0.167164 | (M) | + (P1–23) | + (1–29) | U | - | - | 100.0 | |
| HrpV | Psf | 115 | −0.217391 | (S) | - | - | C | 40–73 | - | 99.0 |
| Psv | 115 | −0.217391 | (S) | - | - | C | 40–73 | - | 100.0 | |
| Psn | 115 | −0.205218 | (S) | - | - | C | 40–80 | - | 99.0 | |
| HrpZ | 347 | −0.275792 | (S) | - | + (1–23) | EC | 24–62 | + | 98.0 |
Columns, ordered from left to right indicate: (1) Putative protein name; (2) Name of the corresponding pathovar when non synonymous mutations are present; (3) Length of putative protein; (4) Average of hydrophobicity, according to SOSUI [31]; (5) S = Soluble, M = Membrane, as predicted by SOSUI [31]; (6) Presence, number and type (P = Primary, S = Secondary) of Trans-Membrane regions, predicted by SOSUI [31]; (7) Presence of Signal Peptide, predicted by SOSUIsign [32]; (8) Localization of putative protein (EC = Extracellular, C = Cytoplasm, OM = Outer Membrane, P = Periplasm, IM = Inner membrane, U = Unknown), predicted by SOSUIgramN [33]; (9) Presence of Coiled-coil regions, predicted by SOSUIcoil [34]; (10) Presence of Conserved Domains, evaluated using BLAST-CDDs [35]; (11) Percentage of homology with the same predicted protein from P. syringae pv. phaseolicola 1448A, evaluated with ClustalW [36].
| Normalized expression (n-fold) ± sd * | ||||
|---|---|---|---|---|
| Psv 5 | ||||
| 3 h | 6 h | 18 h | 24 h | |
| hrpA | 10.2 ± 1.4 | 9.9 ± 0.8 | 31.1 ± 4.1 | 124.7 ± 9.9 |
| hrpS | 14.8 ± 0.9 | 22.4 ± 2.0 | 37.3 ± 3.3 | 152.1 ± 11.1 |
| hrpL | 11.8 ± 0.9 | 15.8 ± 2.3 | 29.9 ± 2.0 | 134.7 ± 8.7 |
| hrpV | 4.4 ± 0.2 | 53.2 ± 6.3 | 19.5 ± 1.5 | 32.1 ± 3.4 |
| Psn 23 | ||||
| 3 h | 6 h | 18 h | 24 h | |
| hrpA | 18.33 ± 2.1 | 21.34 ± 3.36 | 54.59 ± 6.43 | 23.97 ± 3.2 |
| hrpS | 41.7 ± 3.9 | 24.43 ± 2.9 | 50.65 ± 7.23 | 14.6 ± 2.2 |
| hrpL | 29.87 ± 3.11 | 4.99 ± 0.98 | 11.2 ± 1.4 | 22.4 ± 2.1 |
| hrpV | 78.99 ± 8.45 | 21.3 ± 3.43 | 7.78 ± 0.9 | 7.66 ± 1.1 |
| Psf 134 | ||||
| 3 h | 6 h | 18 h | 24 h | |
| hrpA | 134.78 ± 10.9 | 90.23 ± 7.98 | 4.89 ± 1.1 | 0.98 ± 0.23 |
| hrpS | 31.21 ± 4.22 | 27.33 ± 4.3 | 5.23 ± 1.43 | 1.21 ± 0.4 |
| hrpL | 6.11 ± 1.98 | 40.23 ± 2.34 | 3.5 ± 0.12 | 1.11 ± 0.03 |
| hrpV | 7.68 ± 2.31 | 7.98 ± 2.1 | 5.4 ± 0.45 | 78.92 ± 6.15 |
*Normalized fold increase in the expression of each analyzed gene in Psv5, Psn23 and Psf134 grown in MM vs. KB at 3, 6, 18 and 24 h after bacterial inoculation on fresh medium. Standard deviations (sd) are reported.
| Primer name | Primer sequence (5′–3′) |
|---|---|
| Hrp For1 | ATGAGCACAGACATTGAT |
| Hrp For2 | TCACCCAGGAGATTGCCGC |
| Hrp For3 | CAAATCTGGGGATCGTCG |
| Hrp For4 | ATGTCTGCGTGATCGCTTCG |
| Hrp For5 | ATCAAGGAGTTGCAGATCTG |
| Hrp For6 | ATGGCGCTCGTTGTGATCC |
| Hrp For7 | TCGGCACTCGACATCATCG |
| Hrp For8 | TATCTTCACCGCCGCAAC |
| Hrp For9 | TGAACTGCGGCCTGACACTC |
| Hrp For10 | CAAAATAACCTCGACAGCAC |
| Hrp For11 | TCAGGAATACCACTTCCAGT |
| Hrp For12 | AACCCATCCATTCTTACCC |
| Hrp For13 | AAGAGAGCGAGGTGTATATCG |
| Hrp For14 | GCGAACCACTTTGTAGATGT |
| Hrp For15 | CCAGGGTGATTTCACTGAC |
| Hrp For16 | CATGCCCAGCATGAATTG |
| Hrp For17 | AGACTGCTCTGCAGCTTGT |
| Hrp For18 | ACCAGGACTCGTCCACAG |
| Hrp For19 | GAACGGTTTTGTGCGAAG |
| Hrp For20 | GGTGACATTGCTGAGGATCC |
| Hrp For21 | GCGTACATTCCTGAGTGAAA |
| Hrp For22 | GCACTGAAGGCCACTCAT |
| Hrp For23 | GTGAGCACTCGCTGTATCTC |
| Hrp For24 | ACACGCCGATGGAAATAC |
| Hrp For25 | GGTCTGGTTCACGTTCATT |
| Hrp For26 | TTTTCATAGGACGGTTCTGA |
| Hrp For27 | CAACCATGCGTATATCCAGT |
| Hrp For28 | CTCAAACAGTCGTCCAACAT |
| Hrp For29 | AGGCGGGCTTCCTCAGCCAG |
| Hrp For30 | CTTGCAAACCGACCTGGC |
| Hrp For31 | TATCCACCATGCTCGCCAAC |
| Hrp Rev1 | GAGTTGCAGATCTGATTT |
| Hrp Rev2 | GCACCGCTTTCCGAGCAT |
| Hrp Rev3 | GGATTGACCGGGCGCATTGA |
| Hrp Rev4 | GATAGCCAGTCGTCACAGCGT |
| Hrp Rev5 | CCTCGACAGCACGCTGAAT |
| Hrp Rev6 | GATGTAGGCCTGCTGGATA |
| Hrp Rev7 | AATATCGAGCCCATCACCGCCGGG |
| Hrp Rev8 | GCTGTTCGCTACCCTGTCG |
| Hrp Rev9 | CTTGTCAGCCAGATGCTCT |
| Hrp Rev10 | CGTATCTGTTTGGGGGTAGC |
| Hrp Rev11 | CATATTGATGAACTGAATCAGCTC |
| Hrp Rev12 | ACCTGCTGAACGCCAATT |
| Hrp Rev13 | ACCACGCCGTATCTGAAC |
| Hrp Rev14 | CGGTGTGGCATGCACTAC |
| Hrp Rev15 | GAGTCCTGCTCGATCAGC |
| Hrp Rev16 | ATCTTGCATTCCAGCAGAAT |
| Hrp Rev17 | CCTTCTTCAGCGTTCAGT |
| Hrp Rev18 | CGAACAACTGACTTTCCTTG |
| Hrp Rev19 | CAACAACGTCGTCACGTG |
| Hrp Rev20 | TGTAGTGATAAAAACGGCGT |
| Hrp Rev21 | GTGGTGATCAGGCCTTTGTGC |
| Hrp Rev22 | CCAATATGAGCGAGTGGAT |
Conflict of Interests
The authors declare no competing interests.
References
- Tampakaki, A.P.; Skandalis, N.; Gazi, A.D.; Bastaki, M.N.; Sarris, P.F.; Charova, S.N.; Kokkinidis, M.; Panopoulos, N.J. Playing the “Harp”: Evolution of our understanding of hrp/hrc genes. Annu. Rev. Phytopathol. 2010, 48, 347–370. [Google Scholar]
- Jones, J.D.; Dangl, J.L. The plant immune system. Nature 2006, 444, 323–329. [Google Scholar]
- Grant, S.R.; Fisher, E.J.; Chang, J.H.; Mole, B.M.; Dangl, J.L. Subterfuge and manipulation: Type III effector proteins of phytopathogenic bacteria. Annu. Rev. Microbiol. 2006, 60, 425–449. [Google Scholar]
- Block, A.; Li, G.; Fu, Z.Q.; Alfano, J.R. Phytopathogen type III effector weaponry and their plant targets. Curr. Opin. Plant Biol. 2008, 11, 396–403. [Google Scholar]
- Zhou, J.M.; Chai, J. Plant pathogenic bacterial type III effectors subdue host responses. Curr. Opin. Plant Biol. 2008, 11, 179–185. [Google Scholar]
- Guo, M.; Tian, F.; Wamboldt, Y.; Alfano, J.R. The majority of the type III effector inventory of Pseudomonas syringae pv. tomato DC3000 can suppress plant immunity. Mol. Plant Microbe Interact. 2009, 22, 1069–1080. [Google Scholar]
- Huynh, T.V.; Dahlbeck, D.; Staskawicz, B.J. Bacterial blight of soybean: Regulation of a pathogen gene determining host cultivar specificity. Science 1989, 245, 1374–1377. [Google Scholar]
- Rahme, L.G.; Mindrinos, M.N.; Panopoulos, N.J. Plant and environmental sensory signals control the expression of hrp genes in Pseudomonas syringae pv. phaseolicola. J. Bacteriol. 1992, 174, 3499–3507. [Google Scholar]
- Xiao, Y.; Lu, Y.; Heu, S.; Hutcheson, S.W. Organization and environmental regulation of the Pseudomonas syringae pv. syringae 61 hrp cluster. J. Bacteriol. 1992, 174, 1734–1741. [Google Scholar]
- Xiao, F.; Goodwin, S.M.; Xiao, Y.; Sun, Z.; Baker, D.; Tang, X.; Jenks, M.A.; Zhou, J.M. Arabidopsis CYP86A2 represses Pseudomonas syringae type III genes and is required for cuticle development. EMBO J. 2004, 23, 2903–2913. [Google Scholar]
- Ortiz-Martín, I.; Thwaites, R.; Macho, A.P.; Mansfield, J.W.; Beuzón, C.R. Positive regulation of the Hrp type III secretion system in Pseudomonas syringae pv. phaseolicola. Mol. Plant Microbe Interact. 2010, 23, 665–681. [Google Scholar]
- Ortiz-Martín, I.; Thwaites, R.; Mansfield, J.W.; Beuzón, C.R. Negative regulation of the Hrp type III secretion system in Pseudomonas syringae pv. phaseolicola. Mol. Plant Microbe Interact. 2010, 23, 682–701. [Google Scholar]
- Taira, S.; Tuimala, J.; Roine, E.; Nurmiaho-Lassila, E.L.; Savilahti, H.; Romantschuk, M. Mutational analysis of the Pseudomonas syringae pv. tomato hrpA gene encoding Hrp pilus subunit. Mol. Microbiol. 1999, 34, 737–744. [Google Scholar]
- Bretz, J.; Losada, L.; Lisboa, K.; Hutcheson, S.W. Lon protease functions as a negative regulator of type III protein secretion in Pseudomonas syringae. Mol. Microbiol. 2002, 45, 397–409. [Google Scholar]
- Thwaites, R.; Spanu, P.D.; Panopoulos, N.J.; Stevens, C.; Mansfield, J.W. Transcriptional regulation of components of the type III secretion system and effectors in Pseudomonas syringae pv. phaseolicola. Mol. Plant Microbe Interact. 2004, 17, 1250–1258. [Google Scholar]
- Haapalainen, M.; van Gestel, K.; Pirhonen, M.; Taira, S. Soluble plant cell signals induce the expression of the Type III Secretion System of Pseudomonas syringae and upregulate the production of pilus protein HrpA. Mol. Plant Microbe Interact. 2009, 22, 282–290. [Google Scholar]
- Tang, X.; Xiao, Y.; Zhou, J.M. Regulation of the Type III Secretion System in phytopathogenic bacteria. Mol. Plant Microbe Interact. 2006, 19, 1159–1166. [Google Scholar]
- MacLean, D.; Studholme, D.J. A Boolean model of the Pseudomonas syringae hrp regulon predicts a tightly regulated system. PLoS ONE 2010, 5, e9101. [Google Scholar]
- Preston, G.; Deng, W.L.; Huang, H.C.; Collmer, A. Negative regulation of hrp genes in Pseudomonas syringae by HrpV. J. Bacteriol. 1998, 17, 4532–4537. [Google Scholar]
- Hendrickson, E.L.; Guevera, P.; Ausubel, F.M. The alternative sigma factor RpoN is required for hrp activity in Pseudomonas syringae pv. maculicola and acts at the level of hrpL transcription. J. Bacteriol. 2000, 12, 3508–3516. [Google Scholar]
- Lan, L.; Deng, X.; Xiao, Y.; Zhou, J.M.; Tang, X. Mutation of Lon protease differentially affects the expression of Pseudomonas syringae Type III Secretion System genes in rich and minimal media and reduces pathogenicity. Mol. Plant Microbe Interact. 2007, 6, 682–696. [Google Scholar]
- Mole, B.M.; Baltrus, D.A.; Dangl, J.L.; Grant, S.R. Global virulence regulation networks in phytopathogenic bacteria. Trends Microbiol. 2007, 15, 363–371. [Google Scholar]
- Sisto, A.; Cipriani, M.G.; Morea, M. Knot formation caused by Pseudomonas syringae subsp. savastanoi on Olive plants is hrp-dependent. Phytopathology 2004, 94, 484–489. [Google Scholar]
- Pérez-Martínez, I.; Rodríguez-Moreno, L.; Lambertsen, L.; Matas, I.M.; Murillo, J.; Tegli, S.; Jiménez, A.J.; Ramos, C. Fate of a Pseudomonas savastanoi pv. savastanoi Type III Secretion System mutant in Olive plants (Olea europaea L.). Appl. Environ. Microbiol. 2010, 76, 3611–3619. [Google Scholar]
- Han, C.G.; Shiga, Y.; Tobe, T.; Sasakawa, C.; Ohtsubo, E. Structural and functional characterization of IS679 and IS66-family elements. J. Bacteriol. 2001, 183, 4296–4304. [Google Scholar]
- Xiao, Y.; Hutcheson, S.W. A single promoter sequence recognized by a newly identified alternate sigma factor directs expression of pathogenicity and host range determinants in Pseudomonas syringae. J. Bacteriol. 1994, 176, 3089–3091. [Google Scholar]
- Petnicki-Ocwieja, T.; van Dijk, K.; Alfano, J.R. The hrpK operon of Pseudomonas syringae pv. tomato DC3000 encodes two proteins secreted by the type III (Hrp) protein secretion system: HopB1 and HrpK, a putative type III translocator. J. Bacteriol. 2005, 187, 649–663. [Google Scholar]
- Alfano, J.R.; Collmer, A. The type III (Hrp) secretion pathway of plant pathogenic bacteria: Trafficking harpins, Avr proteins, and death. J. Bacteriol. 1997, 179, 5655–5662. [Google Scholar]
- He, S.Y.; Nomuraa, K.; Whittam, T.S. Type III protein secretion mechanism in mammalian and plant pathogens. Biochim. Biophys. Acta 2004, 1694, 181–206. [Google Scholar]
- Rodríguez-Palenzuela, P.; Matas, I.M.; Murillo, J.; López-Solanilla, E.; Bardaji, L.; Pérez-Martinez, I.; Rodríguez-Moskera, M.E.; Penyalver, R.; López, M.M.; Quesada, J.M.; et al. Annotation and overview of the Pseudomonas savastanoi pv. savastanoi NCPPB 3335 draft genome reveals the virulence gene complement of a tumour-inducing pathogen of woody hosts. Environ. Microbiol. 2010, 12, 1604–1620. [Google Scholar]
- Hirokawa, T.; Boon-Chieng, S.; Mitaku, S. SOSUI: Classification and secondary structure prediction system for membrane proteins. Bioinformatics 1998, 14, 378–379. [Google Scholar]
- Gomi, M.; Sonoyama, M.; Mitaku, S. High performance system for signal peptide prediction: SOSUIsignal. Chem-Bio Inform. J. 2004, 4, 142–147. [Google Scholar]
- Imai, K.; Asakawa, N.; Tsuji, T.; Akazawa, F.; Ino, A.; Sonoyama, M.; Mitaku, S. SOSUI-GramN: High performance prediction for subcellular localization of proteins in Gram-negative bacteria. Bioinformation 2008, 2, 417–421. [Google Scholar]
- Tanizawa, H.; Taniguchi, M.; Ghimire, G.D.; Mitaku, S. Prediction of fragile points of coiled coils. Chem-Bio Inform J. 2009, 9, 12–29. [Google Scholar]
- Marchler-Bauer, A.; Lu, S.; Anderson, J.B.; Chitsaz, F.; Derbyshire, M.K.; DeWeese-Scott, C.; Fong, J.H.; Geer, L.Y.; Geer, R.C.; Gonzales, N.R.; et al. CDD: A Conserved Domain Database for the functional annotation of proteins. Nucleic Acids Res. 2011, 39, 225–229. [Google Scholar]
- Thompson, J.D.; Higgins, D.G.; Gibson, T.J. CLUSTALW: Improving the sensitivity of progressive multiple sequence alignment through sequence weighting, position-specific gap penalties and weight matrix choice. Nucleic Acids Res. 1994, 22, 4673–4680. [Google Scholar]
- Baltrus, D.A.; Nishimura, M.T.; Romanchuk, A.; Chang, J.H.; Mukhtar, M.S.; Cherkis, K.; Roach, J.; Grant, S.R.; Jones, C.D.; Dangl, J.L. Dynamic evolution of pathogenicity revealed by sequencing and comparative genomics of 19 Pseudomonas syringae isolates. PLoS Pathog. 2011, 7, e1002132. [Google Scholar]
- Green, S.; Studholme, D.J.; Laue, B.E.; Dorati, F.; Lovell, H.; Arnold, D.; Cottrell, J.E.; Bridgett, S.; Blaxter, M.; Huitema, E.; et al. Comparative genome analysis provides insights into the evolution and adaptation of Pseudomonas syringae pv. aesculi on Aesculus hippocastanum. PLoS ONE 2010, 5, e10224. [Google Scholar]
- Joardar, V.; Lindeberg, M.; Jackson, R.W.; Selengut, J.; Dodson, R.; Brinkac, L.M.; Daugherty, S.C.; Deboy, R.; Durkin, A.S.; Giglio, M.G.; et al. Whole-genome sequence analysis of Pseudomonas syringae pv. phaseolicola 1448A reveals divergence among pathovars in genes involved in virulence and transposition. J. Bacteriol. 2005, 187, 6488–6498. [Google Scholar]
- Feil, H.; Feil, W.S.; Chain, P.; Larimer, F.; DiBartolo, G.; Copeland, A.; Lykidis, A.; Trong, S.; Nolan, M.; Goltsman, E.; et al. Comparison of the complete genome sequences of Pseudomonas syringae pv. syringae B728a and pv. tomato DC3000. Proc. Natl. Acad. Sci. USA 2005, 102, 11064–11069. [Google Scholar]
- Alfano, J.R.; Charkowski, A.O.; Deng, W.L.; Badel, J.L.; Petnicki-Ocwieja, T.; van Dijk, K.; Collmer, A. The Pseudomonas syringae Hrp pathogenicity island has a tripartite mosaic structure composed of a cluster of type III secretion genes bounded by exchangeable effector and conserved effector loci that contribute to parasitic fitness and pathogenicity in plants. Proc. Natl. Acad. Sci. USA 2000, 97, 4856–4861. [Google Scholar]
- Studholme, D.J.; Ibanez, S.G.; MacLean, D.; Dangl, J.L.; Chang, J.H.; Rathjen, J.P. A draft genome sequence and functional screen reveals the repertoire of type III secreted proteins of Pseudomonas syringae pathovar tabaci 11528. BMC Genomics 2009, 10, 395. [Google Scholar]
- Song, E.S.; Park, Y.J.; Chae, S.C.; Kim, J.G.; Cho, H.J.; Lee, G.B.; Lee, B.M. Construction of a bacterial artificial chromosome library and characterization of hrp/hrc gene cluster of Pseudomonas syringae pathovar tagetis LMG5090. Biotechnol. Lett. 2006, 28, 969–977. [Google Scholar]
- Buell, C.R.; Joardar, V.; Lindeberg, M.; Selengut, J.; Paulsen, I.T.; Gwinn, M.L.; Dodson, R.J.; Deboy, R.T.; Durkin, A.S.; Kolonay, J.F.; et al. The complete genome sequence of the Arabidopsis and tomato pathogen Pseudomonas syringae pv. tomato DC3000. Proc. Natl. Acad. Sci. USA 2003, 100, 10181–10186. [Google Scholar]
- Araki, H.; Tian, D.; Goss, E.M.; Jakob, K.; Halldorsdottir, S.S.; Kreitman, M.; Bergelson, J. Presence/absence polymorphism for alternative pathogenicity islands in Pseudomonas viridiflava, a pathogen of Arabidopsis. Proc. Natl. Acad. Sci. USA 2006, 103, 5887–5892. [Google Scholar]
- Sawada, H.; Suzuki, F.; Matsuda, I.; Saitou, N. Phylogenetic Analysis of Pseudomonas syringae pathovars suggests the horizontal gene transfer of argK and the evolutionary stability of hrp gene cluster. J. Mol. Evol. 1999, 49, 627–644. [Google Scholar]
- Guttman, D.S.; Gropp, S.J.; Morgan, R.L.; Wang, P.W. Diversifying selection drives the evolution of the type III secretion system pilus of Pseudomonas syringae. Mol. Biol. Evol. 2006, 23, 2342–2354. [Google Scholar]
- Gardan, L.; Shafik, H.; Belouin, S.; Broch, R.; Grimont, F.; Grimont, P.D. DNA relatedness among the pathovars of Pseudomonas syringae and description of Pseudomonas tremae sp. nov. and Pseudomonas cannabina sp. nov. (ex Sutic and Dowson 1959). Int. J. Syst. Bacteriol. 1999, 49, 469–478. [Google Scholar]
- Bull, C.T.; Manceau, C.; Lydon, J.; Kong, H.; Vinatzer, B.A.; Fischer-Le Saux, M. Pseudomonas cannabina pv. cannabina pv. nov., and Pseudomonas cannabina pv. alisalensis (Cintas Koike and Bull, 2000) comb. nov., are members of the emended species Pseudomonas cannabina (ex Sutic & Dowson 1959) Gardan, Shafik, Belouin, Brosch, Grimont & Grimont 1999. Syst. Appl. Microbiol. 2010, 33, 105–115. [Google Scholar]
- Shimodaira, H.; Hasegawa, M. Multiple comparisons of log-likelihoods with applications to phylogenetic inference. Mol. Biol. Evol. 1999, 16, 1114–1116. [Google Scholar]
- Gropp, S.; Guttman, D. The PCR amplification and characterization of entire Pseudomonas syringae hrp/hrc clusters. Mol. Plant Pathol. 2004, 5, 137–140. [Google Scholar]
- Brown, E.W.; Allard, M.W.; van der Zwet, T. Phylogenetic characterization of the eubacterial lcrD gene family: Molecular evolutionary aspects of pathogen-induced hypersensitivity in plants. Cladistics 1998, 14, 45–62. [Google Scholar]
- Naum, M.; Brown, E.W.; Mason-Gamer, R.J. Phylogenetic evidence for extensive horizontal gene transfer of type III secretion system genes among enterobacterial plant pathogens. Microbiology 2008, 155, 3187–3199. [Google Scholar]
- Oh, C.H.; Beer, S.V. Molecular genetics of Erwinia amylovora involved in the development of fire blight. FEMS Microbiol. Lett. 2005, 253, 185–192. [Google Scholar]
- Jovanovic, M.; James, E.H.; Burrows, P.C.; Rego, F.G.M.; Buck, M.; Schumacher, J. Regulation of the co-evolved HrpR and HrpS AAA+ proteins required for Pseudomonas syringae pathogenicity. Nat. Commun. 2011, 2, 177. [Google Scholar]
- O'Brien, H.E.; Thakur, S.; Guttman, D.S. Evolution of plant pathogenesis in Pseudomonas syringae: A genomics perspective. Annu. Rev. Phytopathol. 2011, 49, 269–289. [Google Scholar]
- Sarkar, S.F.; Guttman, D.S. Evolution of the core genome of Pseudomonas syringae, a highly clonal, endemic plant pathogen. Appl. Environ. Microbiol. 2004, 70, 1999–2012. [Google Scholar]
- King, E.O.; Ward, M.K.; Raney, D.E. Two simple media for the demonstration of pyocyanin and fluorescein. J. Lab. Clin. Med. 1954, 44, 301–307. [Google Scholar]
- Livak, K.J.; Schmittgen, T.D. Analysis of relative gene expression data using real-time quantitative PCR and the 2−ΔΔCT method. Methods 2001, 25, 402–408. [Google Scholar]
- Büttner, D.; Bonas, U. Who comes first? How plant pathogenic bacteria orchestrate type III secretion. Curr. Opin. Microbiol. 2006, 9, 193–200. [Google Scholar]
- Chatterjee, A.; Cui, Y.; Yang, H.; Collmer, A.; Alfano, J.R.; Chatterjee, A.K. GacA, the response regulator of a two-component system, acts as a master regulator in Pseudomonas syringae pv. tomato DC3000 by controlling regulatory RNA, transcriptional activators, and alternate sigma factors. Mol. Plant Microbe Interact. 2003, 16, 1106–1117. [Google Scholar]
- Grimm, C.; Aufsatz, W.; Panopoulos, N.J. The hrpRS locus of Pseudomonas syringae pv. phaseolicola constitutes a complex regulatory unit. Mol. Microbiol. 1995, 15, 155–165. [Google Scholar]
- Schuster, M.; Grimm, C. Molecular Domain switching between hrpR and hrpS affects the regulatory function of the hybrid genes in Pseudomonas syringae pv. phaseolicola. Plant Pathol. 2000, 4, 233–241. [Google Scholar]
- Hutcheson, S.W.; Bretz, J.; Sussan, T.; Jin, S.; Pak, K. Enhancer-binding proteins HrpR and HrpS interact to regulate hrp-encoded type III protein secretion in Pseudomonas syringae strains. J. Bacteriol. 2001, 183, 5589–5598. [Google Scholar]
- Daniell, S.J.; Delahay, R.M.; Shaw, R.K.; Hartland, E.L.; Pallen, M.J.; Booy, F.; Ebel, F.; Knutton, S.; Frankel, G. Coiled-coil domain of enteropathogenic Escherichia coli type III secreted protein EspD is involved in EspA filament-mediated cell attachment and hemolysis. Infect. Immun. 2001, 69, 4055–4064. [Google Scholar]
- Delahay, R.M.; Frankel, G. Coiled-coil proteins associated with type III secretion systems: A versatile domain revisited. Mol. Microbiol. 2002, 45, 905–916. [Google Scholar]
- Caccamo, D.; di Cello, F.; Fani, R.; Gugliandolo, C.; Maugeri, T.L. Polyphasic approach to the characterisation of marine luminous bacteria. Res. Microbiol. 1999, 150, 221–230. [Google Scholar]
- Sisto, A.; Cipriani, M.G.; Tegli, S.; Cerboneschi, M.; Stea, G.; Santilli, E. Genetic characterization by fluorescent AFLP of Pseudomonas savastanoi pv. savastanoi strains isolated from different host species. Plant Pathol. 2007, 56, 366–372. [Google Scholar]
- Tegli, S.; Cerboneschi, M.; Marsili Libelli, I.; Santilli, E. Development of a versatile tool for the simultaneous differential detection of Pseudomonas savastanoi pathovars by End Point and Real-Time PCR. BMC Microbiol. 2010, 10, 156. [Google Scholar]
- Sambrook, J.; Fritsch, E.F.; Maniatis, T.A. Molecular Cloning: A Laboratory Manual, 2nd ed.; Cold Spring Harbor Laboratory Press: New York, NY, USA, 1989. [Google Scholar]
- Altschul, S.F.; Gish, W.; Miller, W.; Myers, E.W.; Lipman, D.J. Basic local alignment search tool. J. Mol. Biol. 1990, 215, 403–410. [Google Scholar]
- Altschul, S.F.; Madden, T.L.; Schäffer, A.A.; Zhang, J.; Zhang, Z.; Miller, W.; Lipman, D.J. Gapped BLAST and PSI-BLAST: A new generation of protein database search programs. Nucleic Acids Res. 1997, 25, 3389–3402. [Google Scholar]
- Siguier, P.; Perochon, J.; Lestrade, L.; Mahillon, J.; Chandler, M. ISfinder: The reference centre for bacterial insertion sequences. Nucleic Acids Res. 2006, 34, D32–D36. [Google Scholar]
- Tamura, K.; Peterson, D.; Peterson, N.; Stecher, G.; Nei, M.; Kumar, S. MEGA5: Molecular evolutionary genetics analysis using maximum likelihood, evolutionary distance, and maximum parsimony methods. Mol. Biol. Evol. 2011. [Google Scholar] [CrossRef]
- Tamura, K.; Nei, M. Estimation of the number of nucleotide substitutions in the control region of mitochondrial DNA in humans and chimpanzees. Mol. Biol. Evol. 1993, 10, 512–526. [Google Scholar]
- Sneath, P.H.A.; Sokal, R.R. Numerical Taxonomy; Freeman: San Francisco, CA, USA, 1963. [Google Scholar]
- Felsenstein, J. PHYLIP-phylogeny inference package (Version 3.2). Cladistics 1989, 5, 164–166. [Google Scholar]
© 2011 by the authors; licensee MDPI, Basel, Switzerland. This article is an open access article distributed under the terms and conditions of the Creative Commons Attribution license (http://creativecommons.org/licenses/by/3.0/).
Share and Cite
Tegli, S.; Gori, A.; Cerboneschi, M.; Cipriani, M.G.; Sisto, A. Type Three Secretion System in Pseudomonas savastanoi Pathovars: Does Timing Matter? Genes 2011, 2, 957-979. https://doi.org/10.3390/genes2040957
Tegli S, Gori A, Cerboneschi M, Cipriani MG, Sisto A. Type Three Secretion System in Pseudomonas savastanoi Pathovars: Does Timing Matter? Genes. 2011; 2(4):957-979. https://doi.org/10.3390/genes2040957
Chicago/Turabian StyleTegli, Stefania, Andrea Gori, Matteo Cerboneschi, Maria Grazia Cipriani, and Angelo Sisto. 2011. "Type Three Secretion System in Pseudomonas savastanoi Pathovars: Does Timing Matter?" Genes 2, no. 4: 957-979. https://doi.org/10.3390/genes2040957