Article

Divergent Expression Patterns in Two Vernicia Species Revealed the Potential Role of the Hub Gene VmAP2/ERF036 in Resistance to Fusarium oxysporum in Vernicia montana

1
State Key Laboratory of Tree Genetics and Breeding, Chinese Academy of Forestry, Beijing 100091, China
2
Institute of Subtropical Forestry, Chinese Academy of Forestry, Hangzhou 311400, China
*
Authors to whom correspondence should be addressed.
Genes 2016, 7(12), 109; https://doi.org/10.3390/genes7120109
Submission received: 11 September 2016 / Revised: 9 November 2016 / Accepted: 14 November 2016 / Published: 1 December 2016
(This article belongs to the Section Molecular Genetics and Genomics)

Abstract

:
Tung oil tree (Vernicia fordii) is a promising industrial oil crop; however, this tree is highly susceptible to Fusarium wilt disease. Conversely, Vernicia montana is resistant to the pathogen. The APETALA2/ethylene-responsive element binding factor (AP2/ERF) transcription factor superfamily has been reported to play a significant role in resistance to Fusarium oxysporum. In this study, comprehensive analysis identified 75 and 81 putative Vf/VmAP2/ERF transcription factor-encoding genes in V. fordii and V. montana, respectively, which were divided into AP2, ERF, related to ABI3 and VP1 (RAV) and Soloist families. After F. oxysporum infection, a majority of AP2/ERF superfamily genes showed strong patterns of repression in both V. fordii and V. montana. We then identified 53 pairs of one-to-one orthologs in V. fordii and V. montana, with most pairs of orthologous genes exhibiting similar expression in response to the pathogen. Further investigation of Vf/VmAP2/ERF gene expression in plant tissues indicated that the pairs of genes with different expression patterns in response to F. oxysporum tended to exhibit different tissue profiles in the two species. In addition, VmAP2/ERF036, showing the strongest interactions with 666 genes, was identified as a core hub gene mediating resistance. Moreover, qRT-PCR results indicated VmAP2/ERF036 showed repressed expression while its orthologous gene VfAP2/ERF036 had the opposite expression pattern during pathogen infection. Overall, comparative analysis of the Vf/VmAP2/ERF superfamily and indication of a potential hub resistance gene in resistant and susceptible Vernicia species provides valuable information for understanding the molecular basis and selection of essential functional genes for V. fordii genetic engineering to control Fusarium wilt disease.

1. Introduction

Plant growth, development and productivity are strongly affected by fungal pathogen-caused diseases. It is hypothesized that plants have evolved complex signaling pathways and various response mechanisms for overcoming disease via modulation of the expression of defense response genes. Transcription factors are believed to play crucial roles in the transmission of pathogen-derived defense signals to either activate or suppress downstream defense gene expression and also in the regulation of cross-talk among different signaling pathways [1]. The APETALA2/ethylene-responsive element binding factor (AP2/ERF) superfamily is one such transcription factor family that has been reported to a play significant role in resistance to fungal pathogens [2,3].
The AP2/ERF superfamily, one of the largest transcription factor families in plants, is characterized by the AP2 domain, a conserved 60–70 amino acid DNA-binding domain (DBD) that was initially identified in homeotic genes regulating flower development in Arabidopsis thaliana [4]. The AP2/ERF superfamily can be divided into ERF, AP2, related to ABI3 and VP1 (RAV) and Soloist families according to the number of AP2 domains and the presence of other conserved motifs [5]. Members with tandem duplicated AP2 domains as well as a single AP2 domain that differs from the ERF AP2 domain are classified as the AP2 family [6], which can be further subdivided into the AP2 and AINTEGUMENTA (ANT) groups [2]. Genes in this family participate in organ-specific growth and developmental regulation [7,8,9,10]. RAV family genes carry a single AP2/ERF domain and an additional B3 DNA-binding domain, which is conserved in other plant-specific transcription factors [5,11]. This family has been shown to mediate gene expression in response to abiotic and biotic stresses [12,13], brassinosteroids [14] and ethylene [15]. Genes with a highly variable gene structure and encoding divergent single AP2 domains are considered members of the Soloist family [5]. ERF family proteins contain a single AP2 domain and are further subdivided into ERF and dehydration-responsive element-binding (DREB) subfamilies [5,16]. Based on their gene structure and phylogeny, members of this gene family have also been further subdivided into ten groups [5,6]. DREB subfamily members typically bind to the dehydration-responsive element/C-repeat element (DRE/CRT, A/GCCGAC) in the promoter region of their target genes [17], and play a crucial role in resistance to abiotic stresses [4]. The ERF subfamily, first discovered in Nicotiana tabacum [17], modulates the expression of abiotic stress-responsive genes and pathogenesis-related (PR) genes in disease resistance [18] and in ethylene signaling pathways by recognizing the GCC-box in promoter regions [19]. Many ERF subfamily members also bind to DRE/CRT elements [18,20].
Based on the essential role of the AP2/ERF superfamily in regulating stress responses and developmental processes in plants, various studies have been performed to identify and investigate this family in plants, including Arabidopsis [5], rice [5], castor bean [21], Chinese cabbage [22], grape [23], poplar [24], physic nut [25], Medicago truncatula [26], Moso bamboo [27], banana [6] and chickpea and pigeonpea [28]. ERF proteins involved in defense against pathogen infection have also been extensively documented [1,2,18]. Overall, ERF1 overexpression enhances resistance to necrotrophic pathogens such as Fusarium oxysporum, Botrytis cinerea, and Plectosphaerella cucumerina in Arabidopsis [29,30]. Indeed, AtERF14 overexpression had dramatic effects on defense gene expression [31]. It was also found that overexpression of AtERF5 [32], AtERF6 [33], AtERF15 [34], and ORA59 [35] resulted in increased resistance, whereas the erf5 erf6 double mutant and AtERF15-RNAi and ORA59-silenced plants exhibited decreased resistance to B. cinerea. In contrast, Arabidopsis plants overexpressing ERF4, a negative regulator of transcription belonging to group VIII, are more susceptible to F. oxysporum than wild type plants [1,30].
Vernicia fordii is an important woody non-edible oilseed plant in China. Its seed oil is widely used in industry, such as in inks, lubricants, biodiesel, paints and coatings [36]. However, the wilt disease caused by F. oxysporum has greatly adverse effects on its growth and yield. In comparison, Vernicia montana is sturdy and shows notable resistance to wilt disease, despite its relatively lower oil production and quality. Given that the ERF family is reported to play significant roles in resistance to F. oxysporum [1,29,31] and that V. montana is resistant while V. fordii is susceptible, it is possible that the AP2/ERF gene family might have undergone divergence with regard to disease tolerance during the evolution of V. fordii and V. montana to acquire specific functions. Accordingly, a study on the functional divergence between these resistant and susceptible species may help to clarify the molecular mechanism involved and why one species is more resistant than the other.
To comparatively analyze AP2/ERF superfamily genes in V. fordii and V. montana, and identify putative key functional genes in response to F. oxysporum, we analyzed the identification, classification, phylogeny and conserved motif distribution among the Vf/VmAP2/ERF superfamily in both Vernicia species. Moreover, comparative analysis of expression patterns after F. oxysporum infection and tissue-specific expression patterns between the two species as well as interaction networks were performed. The data obtained from this study will help select appropriate genes for further functional characterization and understand the molecular mechanisms of pathogen response of the Vf/VmAP2/ERF superfamily.

2. Materials and Methods

2.1. Identification of AP2/ERF Superfamily in Vernicia Species

AP2/ERF protein sequences of A. thaliana were downloaded from the plant TFDB database [37]. An extensive search was performed to identify members of the AP2/ERF transcription factor superfamily based on transcriptome data for V. fordii and V. montana. AP2/ERF superfamily protein sequences were analyzed by annotation and the conserved AP2/ERF domains of AP2/ERF protein sequences from A. thaliana were used as query sequences to search the transcriptome database. The search was based on BLASTP with a cutoff value of 1 × 10⁻⁵. Redundant sequences with the same scaffold were removed. The amino acid sequences, corresponding gene sequences, and annotations were retrieved for further analyses. All obtained protein sequences were analyzed to confirm the presence of the characterized AP2/ERF domain using Simple Modular Architecture Research Tool (SMART) [38,39]. The results were reconfirmed using Conserved Domain Database of the National Center for Biotechnology Information (NCBI) [40]. Protein sequences without or with partial AP2/ERF domain were rejected.

2.2. Multiple Sequence Alignment of AP2/ERF Superfamily

Multiple sequence alignment of amino acid sequences of the AP2/ERF domain of all putative AP2/ERF superfamily members was generated using BioEdit 7.2.0.0 [41] with its default settings. DNAMAN software (Lynnon BioSoft, San Ramon, CA, USA) was used as a secondary method for sequence alignment and results rechecking. In addition, to compare the evolutionary relationships of AP2/ERF superfamily members in Vernicia species and A. thaliana, multiple sequence alignment was applied on obtained proteins and A. thaliana AP2/ERF superfamily members predicted by Nakano et al. [5].

2.3. Phylogenetic Analysis of the AP2/ERF Superfamily

An unrooted phylogenetic tree was constructed with the aligned AP2/ERF superfamily protein sequences of V. fordii and V. montana using MEGA5.0 [42] and the maximum likelihood (ML) method, with Poisson correction, pairwise deletion and 1000 bootstrap replicates as parameters. A combined phylogenetic tree between Vernicia species and Arabidopsis was then constructed, also with MEGA5.0, the ML method and a bootstrap of 1000 replicates.

2.4. Motif Recognition of the ERF Family

The conserved motifs outside the AP2/ERF domain in ERF family proteins of V. fordii and V. montana were identified using a motif based sequence analysis tool, MEME Suite version 4.10.0 [43], with the following parameters: any number of repetitions of a motif, maximum number of motifs set at 25 and optimum width 6–50 amino acids.

2.5. Evolution and Selection of the AP2/ERF Superfamily in Vernicia Species

One-to-one orthologous genes of identified AP2/ERF genes between V. fordii and V. montana were predicted using reciprocal-best BLAST-hits (RBH) methods with expected (E)-value threshold of 1 × 10⁻⁵. The selective pressure on duplicated genes was estimated by calculating the ratio of non-synonymous substitutions (Ka) to synonymous substitutions (Ks) per site using Calculator [44].

2.6. Plant Materials and Pathogen Inoculation

F. oxysporum was isolated from diseased V. fordii in Tianlin County, Guangxi Zhuang Autonomous Region, China, and the strain was routinely cultivated on potato dextrose agar (PDA). Seeding plantlets of the F. oxysporum-susceptible cultivar V. fordii and the highly resistant cultivar V. montana were used. Two-month-old plantlets containing two or three leaves and a healthy root system were selected for these experiments. The sterile roots of chosen plantlets were drilled with a needle and then dipped in the F. oxysporum spore suspension of 1 × 10⁶ spores per mL for 30 min. All plantlets infected with the pathogen were replanted in a growth room at 26 °C with a 16 h light/8 h dark photoperiod and 95% relative humidity. The entire root system was harvested and immediately frozen in liquid nitrogen at time points 0, 2, 8 and 13 days post-infection (DPI) for the extraction of total RNA. The drilled roots harvested from the uninfected plants at day 0 as described above were maintained as control. According to the symptoms of wilt disease caused by F. oxysporum, the samples from V. fordii (F) and V. montana (M) were marked as uninfected stage (F0, M0), early stage of infection (F1, M1), middle stage of infection (F2, M2) and late stage of infection (F3, M3). Three independent biological replicates were carried out for the F. oxysporum qRT-PCR time course analyses.

2.7. RNA Isolation and Expression Analysis

Total RNA was isolated from each sample respectively in V. fordii and V. montana using the RN38-EASY Spin Plus Plant RNA kit (Aidlab Biotech, Beijing, China) following the manufacturer’s protocol. The quality and concentration of the purified RNA samples were initially evaluated with a 1% agarose gel and a NanoDrop 5000 spectrophotometer (Thermo Fisher Scientific, Waltham, MA, USA) and then the integrity of RNA samples was further confirmed using Agilent 2100 Bioanalyzer (Agilent Technologies, Santa Clara, CA, USA). Samples that had a minimum RNA integrity number (RIN) value of 7.0 were taken for RNA sequencing and qRT-PCR assay. Total RNA (3 µg) was used to synthesize the first strand of cDNA with superscript III reverse transcriptase (Invitrogen, Grand Island, NY, USA) according to the manufacturer’s recommendations.

2.8. Quantitative Real-Time PCR Assay

Specific primers of the AP2/ERF genes were designed based on the non-conserved regions of corresponding sequence using Primer Premier 5.0 (Premier Biosoft, Palo Alto, CA, USA) with a melting temperature of 58–60 °C, a product size of 150 to 200 bp, and a GC content of 40% to 60%. The primer sequences are listed in Table S4. Three biological replicates from each tissue were pooled into one sample and every sample was analyzed in technical triplicates. The qRT-PCR analysis was performed using the SYBR® Premix Ex Taq TM Kit (TaKaRa, Tokyo, Japan), and all reactions were carried out with an ABI7300 Real-Time quantitative instrument (Applied Biosystems, Foster City, CA, USA). The reaction mixture for qRT-PCR was performed in 20 μL volumes comprised of 2 μL first-strand cDNA, 10 μL 2× SYBR® Premix Ex Taq, 0.4 μL × 10 μM forward primer, 0.4 μL × 10 μM reverse primer, 0.4 μL 50× ROX Reference Dye and 6.8 μL dH2O. The amplification conditions were 95 °C for 30 s, followed by 40 cycles at 95 °C for 5 s and then annealing at 60 °C for 31 s. The specificity of the amplifications of each target gene was verified by melting curve analysis. The constitutive gene ERF1a was used as an internal control to normalize the gene expression of the chosen transcripts. The relative expression levels of selected genes compared to control were calculated using the 2△△Ct method.

2.9. Transcriptome Analysis and Expression Patterns of the ERF Family during Infection

Purified RNA samples were sent to LC-Bio Co., Ltd. (Hangzhou, China) for ribosomal RNA removing, cDNA libraries construction and Illumina sequencing. Transcriptome sequencing libraries were prepared using TruSeqTM RNA Sample Prep Kit (Illumina, San Diego, CA, USA). After all the 24 libraries were constructed, high-throughput sequencing was performed on the IlluminaHiSeqTM 2000 platform. Raw data generated from Illumina sequencing were preprocessed to remove nonsense sequences by discarding the reads with adaptor contamination, masking low-quality reads and removing the reads containing too many unknown bases to produce clean read data. Then, the resulting clean reads were assembled into contigs using the Trinity platform [45]. The contigs were then connected into transcripts according to paired-end information of the sequences. The longest transcriptions from the potential assembled component alternative splicing transcripts were regarded as unigene sequences of our samples. The gene expression levels were normalized to the values of reads per kilobase per million mapped reads (RPKM) using RSEM software [46]. To identify differential expression level and explore AP2/ERF genes related to disease resistance in V. fordii and V. montana, expression patterns of each ERF and DREB subfamily genes were analyzed at different infection stages using transformed RPKM values. A heat map was generated using Multi Experiment Viewer (MeV4) software package [47], with the log2-transformed counts of fold-change values compared with the control (day 0).

2.10. Network Analysis of Vf/VmAP2/ERF Superfamily Genes in Response to F. oxysporum

A weighted gene coexpression network analysis (WGCNA) with the weighted cut-off value >0.50 was used to identify hub genes highly connected with other genes. The interaction network between ERF hub gene and connective genes was constructed with the Cytoscape [48] software. The functional analysis and classification of the connective genes involved in the network were conducted according to orthologous groups (COG) annotation.

3. Results

3.1. Detection of AP2/ERF Transcription Factors in Two Vernicia Species

To study Fusarium wilt disease-induced expression of AP2/ERF transcription factors in Vernicia species, we identified and characterized AP2/ERF genes in the V. fordii and V. montana transcriptomes using annotation and BLAST with a conserved AP2 domain as the query. After retrieval of redundant genes and analysis for the presence of a characteristic AP2/ERF domain, 92 and 96 candidate Vf/VmAP2/ERF genes encoding full-length and partial AP2/ERF domains were identified in V. fordii and V. montana, respectively (Table S1). Among them, 75 and 81 putative transcription factors contained the full-length AP2 domain ranging from 531 to 2520 bp and 341 to 2623 bp in length, respectively (Table S1). In V. montana, AP2/ERF superfamily proteins were divided into four families, AP2, ERF, and RAV and Soloist (Table 1), according to structural characteristics and the number of AP2/ERF domains. Fourteen VmAP2/ERF genes were classified into the AP2 family based on the presence of a tandem repeated double AP2/ERF domain; eight of them possessing an extra amino acid in the first AP2 domain were assigned to the ANT subfamily, and other six were assigned to the AP2 subfamily. Two genes predicted to encode one AP2/ERF domain together with one B3 domain were assigned to the RAV family. One gene encoding one AP2/ERF domain was regarded as a member of the Soloist family due to its rather low homology to other AP2/ERF factors. This Soloist family protein shares high similarity with At4g13040, another Soloist protein in A. thaliana [5]. The remaining 64 genes encode a single AP2/ERF domain, and these were assigned to the ERF family.
Of the 75 genes identified in V. fordii, one and two genes were classified as members of the Soloist and RAV families, respectively. Twelve genes were classified as belonging to the AP2 family, of which six were assigned to the ANT subfamily and the other six to the AP2 subfamily. In addition, 60 genes containing one typical single domain were assigned to the ERF family. Similar to V. montana, ERF genes are the most dominant family in V. fordii; indeed, at 60 and 64 genes, the ERF family represents 80% and 79.01% of the entire AP2/ERF superfamily in V. fordii and V. montana, respectively.

3.2. Structure and Group-Specific Residues of the AP2 Domains of Vf/VmERF Genes

To determine sequence similarities and phylogenetic relationships among ERF family proteins between V. fordii and V. montana, multiple sequence alignments were generated using the amino acid sequences of the AP2/ERF domain (Figure S1). Compared to the GCC box-binding domain of Arabidopsis ERF1, 25 consensus residues exhibited more than 75% conservation among the 124 ERF proteins from the two species. The alignments showed that residues E16, R26, W28, L29, G30, A38, and A39 are completely conserved among all 124 ERF proteins from the two species. Additionally, another three residues, G4, R6 and R8, are unique to V. fordii. In particular, all members of the ERF family in both species contain the WLG motif within the AP2/ERF domain region. Previous studies have shown that A38 in the α-helix, and conserved arginine and tryptophan residues in the β-sheet are essential for AP2/ERF domain DNA binding [49]. All members of the DREB subfamily have a valine residue at position 14, which is crucial for binding to the DRE cis-element [50]. Other multiple sequence alignment analyses were performed for the AP2 family between V. fordii and V. montana (Figure S2). The alignment indicated that residues are more conserved in the first AP2 domain. Compared to the AP2 subfamily, the ANT subfamily contains 11 additional residues in the first AP2 domain.

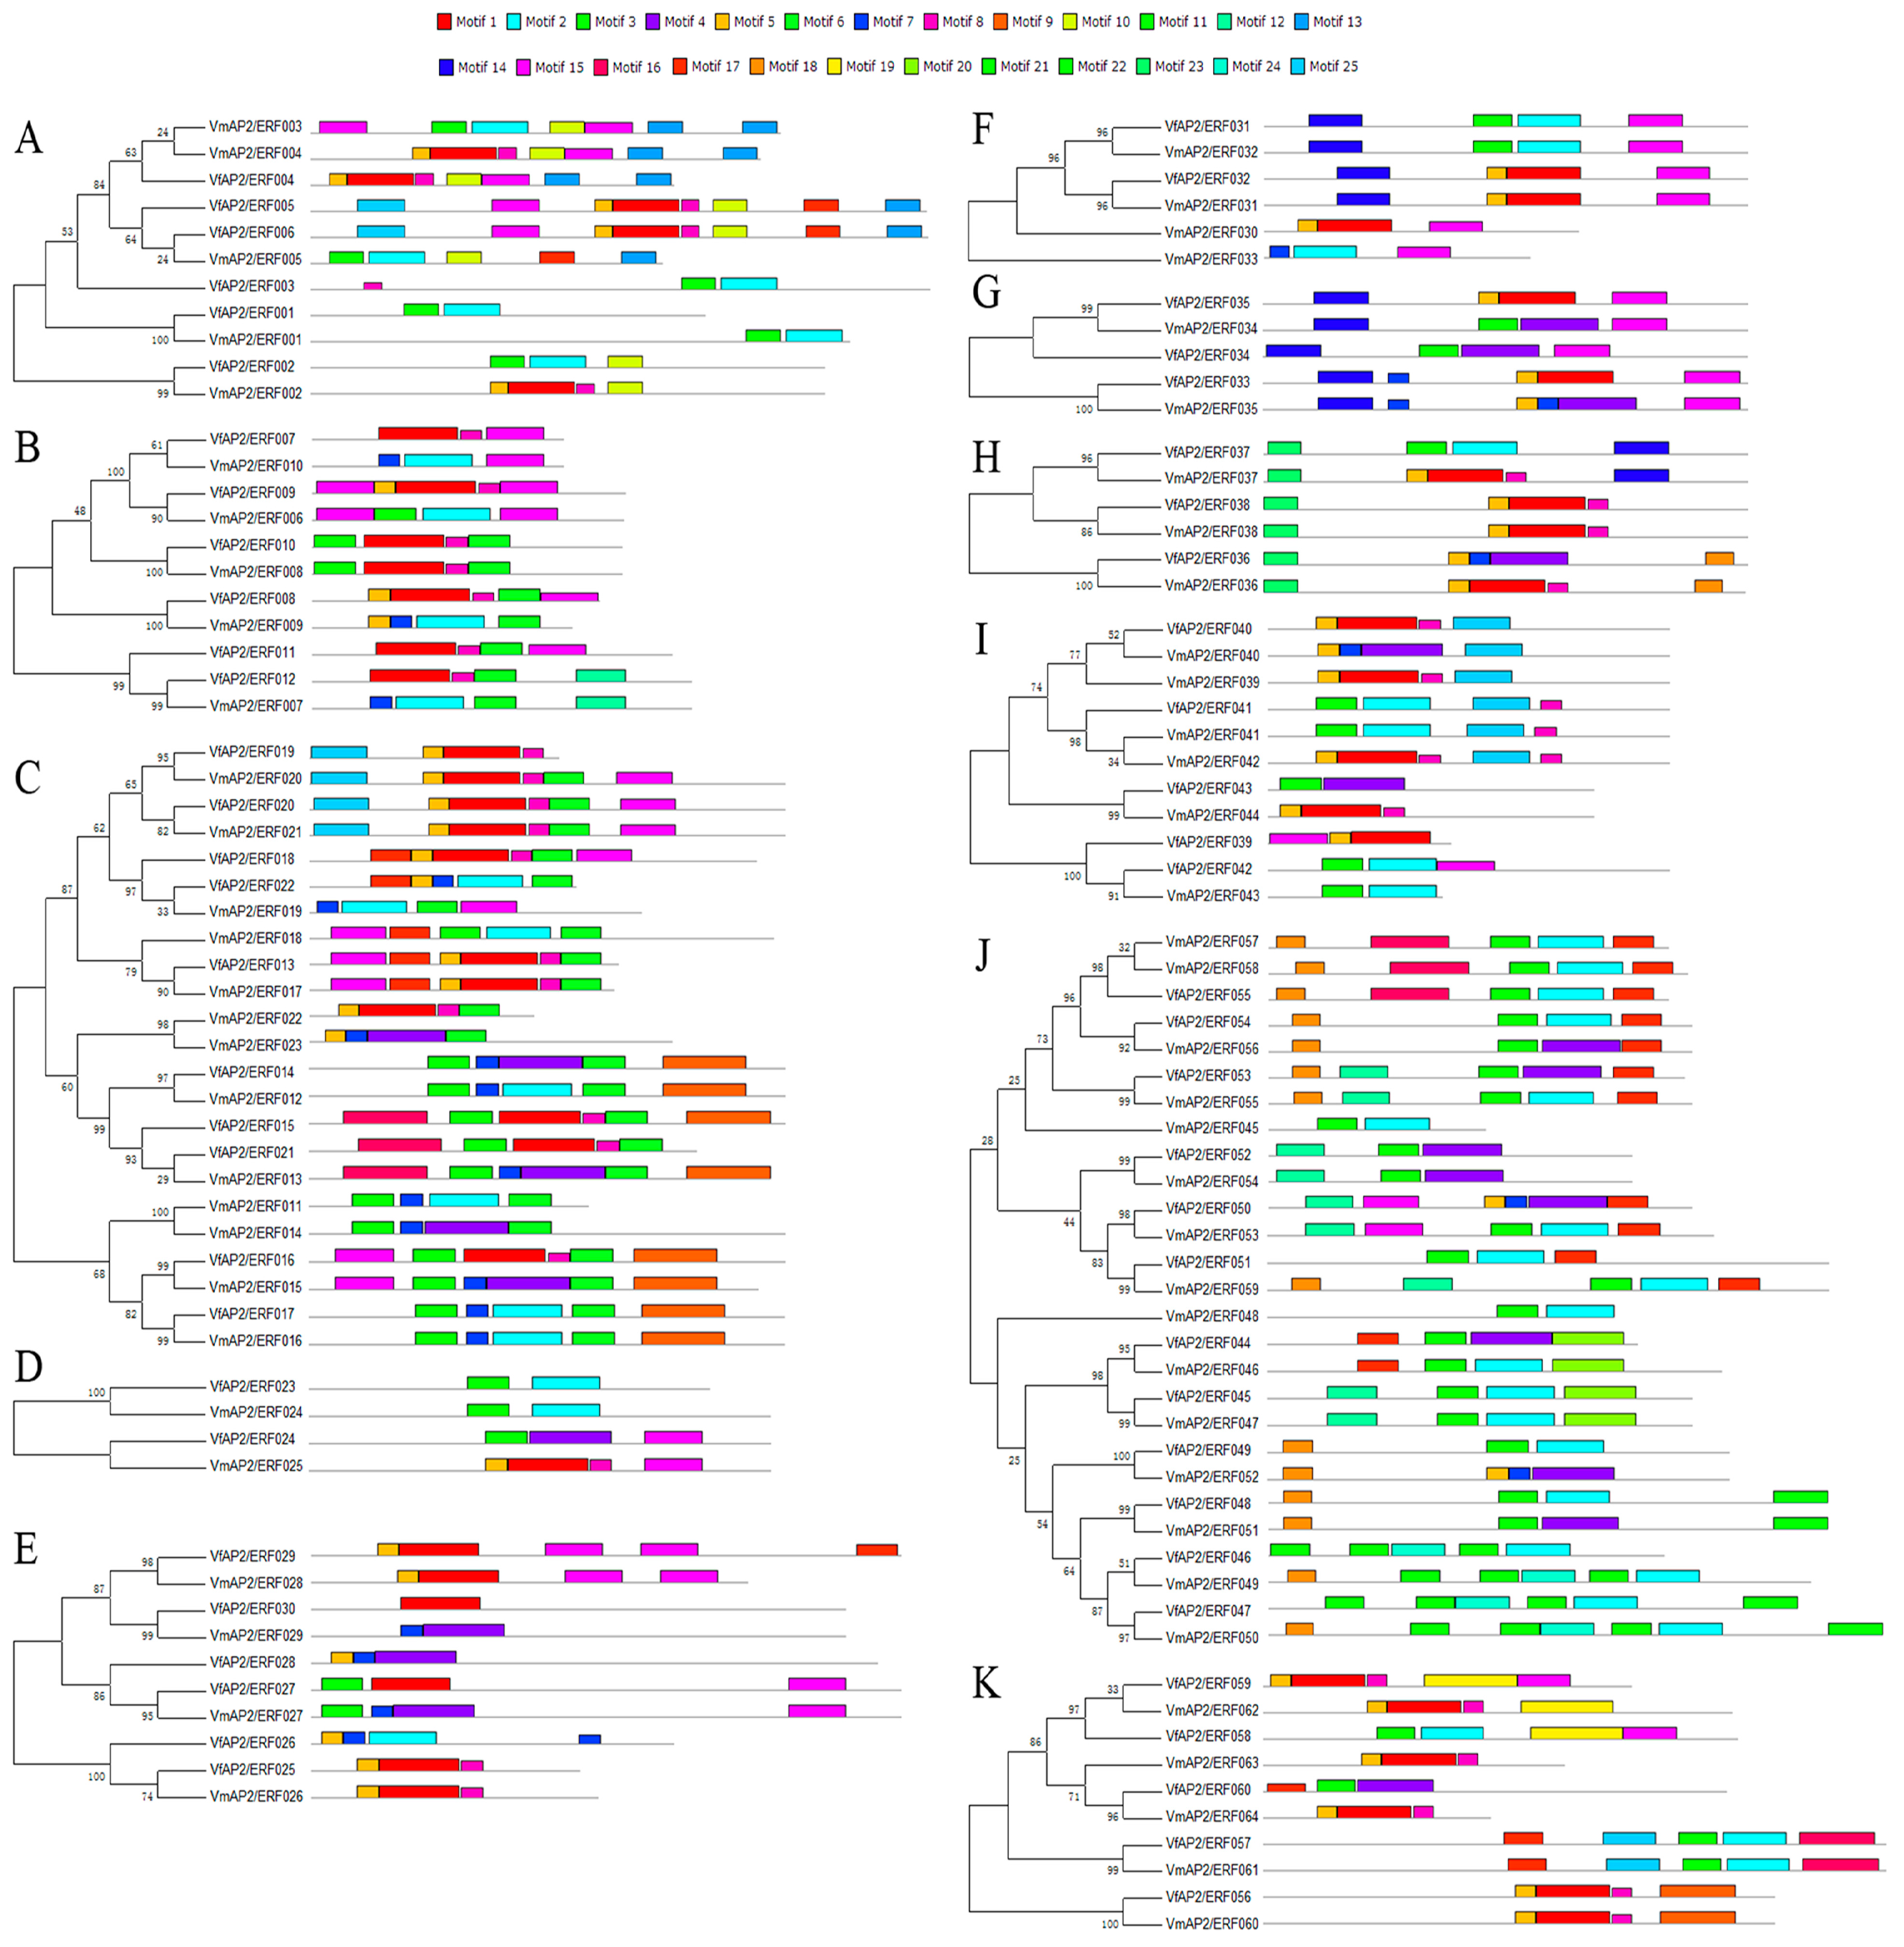
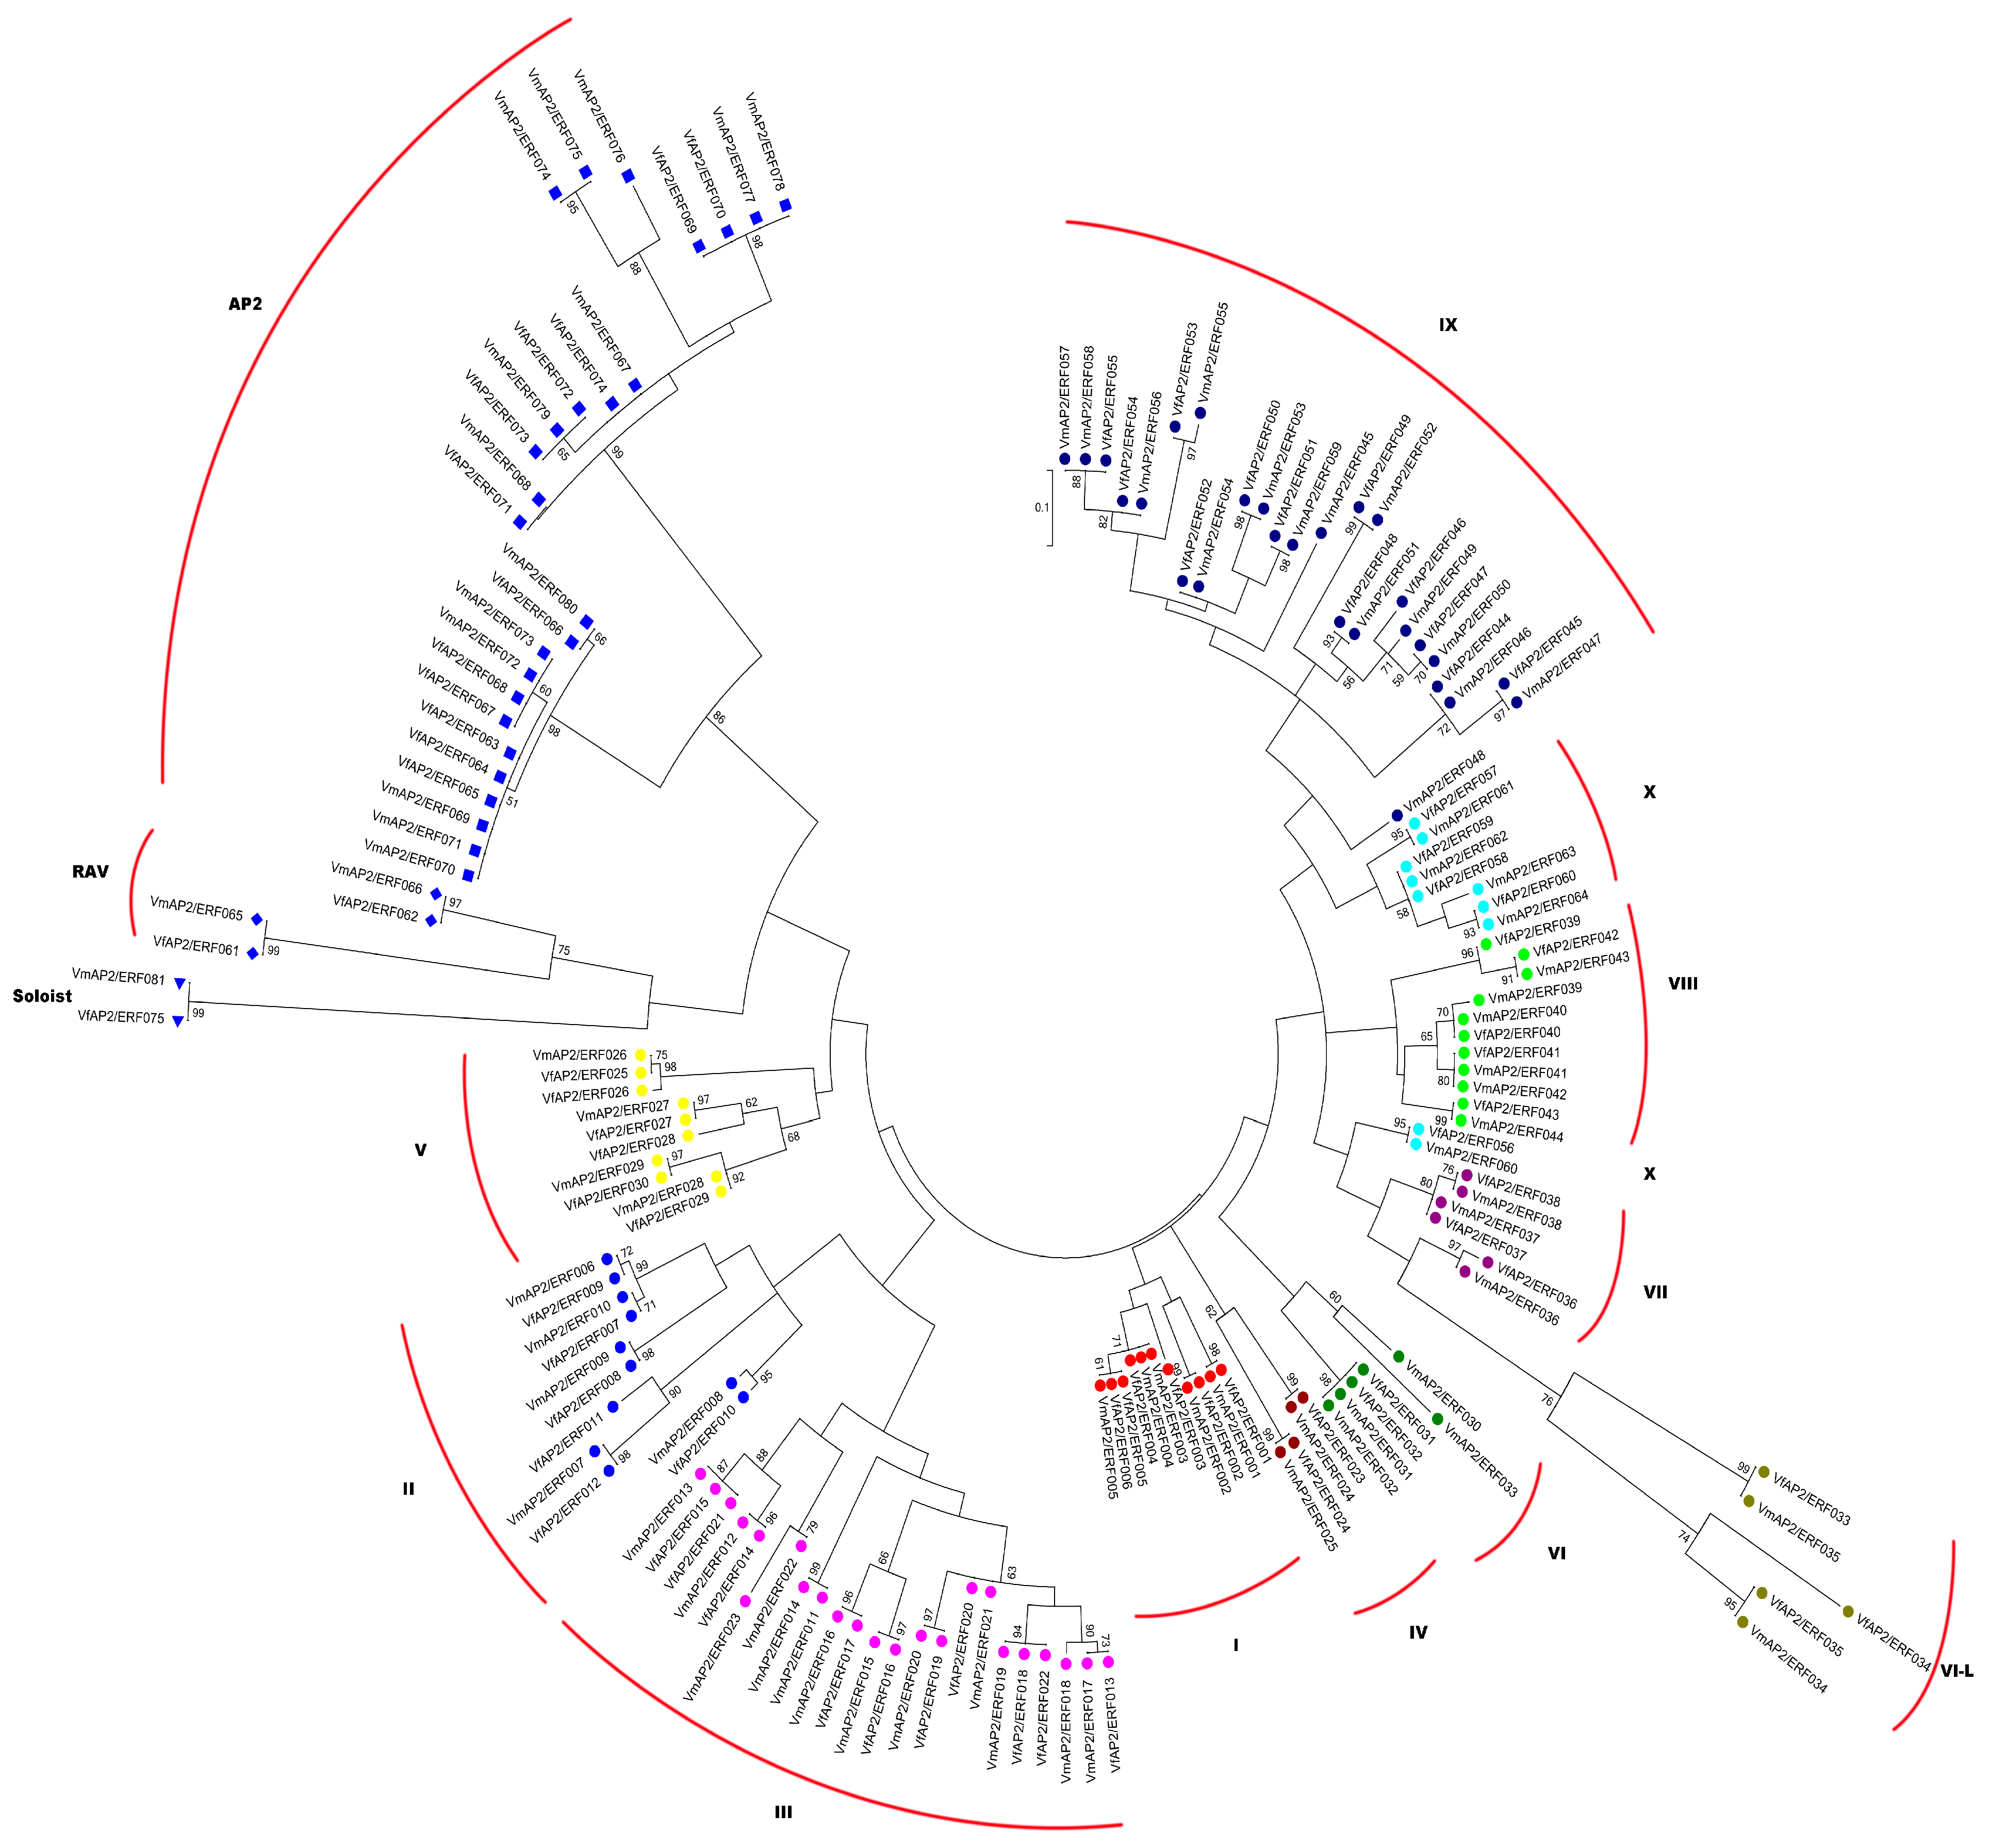
3.3. Phylogenetic Relationships between AP2/ERF Superfamily Transcription Factors

To determine the evolutionary relationship of AP2/ERF superfamily transcription factors between V. fordii and V. montana, an unrooted ML phylogenetic tree was constructed based on multiple sequence alignments of the 75 VfAP2/ERF and 81 VmAP2/ERF proteins (Figure 1). According to the phylogenetic tree generated, the 75 and 81 AP2/ERF transcription factors can be divided into 14 distinct clades with well-supported bootstrap values corresponding to the ERF, AP2, RAV and Soloist families. This phylogenetic analysis revealed that members of the RAV family group were classified into separate clades and that ANT subfamily and AP2 subfamily members of the AP2 family group should go separately. Although the Soloist transcription factor contains a single AP2 domain, it clusters together with the AP2 and RAV family. In accordance with the classification of the Arabidopsis ERF gene family described by Nakano et al. [5], the 64 ERF family genes with one full AP2 domain from V. montana were subdivided into eleven major groups:I through X. No Xb-like gene was found in V. montana. Specifically, based on the amino acid similarity of AP2/ERF domains described by Sakuma et al. [16], 39 members containing a conserved alanine at position 14 and an aspartic acid at position 19 were assigned to the ERF subfamily; the 25 remaining genes with a valine and aspartic at the positions 14 and 19, respectively, were identified as possible members of the DREB subfamily. Of these groups, I to IV belong to the DREB subfamily, whereas V to X belong to the ERF subfamily.
Similar to V. montana, 60 ERF family genes in V. fordii were allocated to groups I through X, though the additional Xb-L group was not found in this species. In addition, 24 genes (groups I–IV) were assigned to the DREB subfamily, and the remaining 36 genes (groups V–X) were assigned to the ERF subfamily. A higher proportion of group IX and a lower proportion of group IV genes were identified in both species, and it is possible that the function of one group can overlap with that of other groups [19]. In comparison to V. montana, V. fordii has a lower number of ERF genes, and this decrease is observed in almost all the groups.

3.4.Distribution of Conserved Motifs outside of the AP2/ERF Domain

The regions outside the DNA-binding domain in transcription factors generally contain functionally important domains involved in transcriptional activity, protein–protein interactions, and nuclear localization [51]. Such functional sequence motifs are often conserved among members of a subgroup in large families of transcription factors in plants, and proteins with these motifs are likely to have similar functions [52]. To characterize the presence of potential conserved motifs in the ERF family in V. fordii and V. montana, 124 complete ERF family protein sequences were analyzed using MEME suite version 4.11.1. Overall, 25 conserved motifs were identified and named 1–25 in both species (Table S2). The distribution of these conserved motifs of relevant clades in ERF proteins between V. fordii and V. montana is illustrated in Figure 2.
The first five motifs and motif 7, as well as motif 11, correspond to the AP2/ERF domain region. The remaining 18 motifs correspond to the conserved region outside of the AP2/ERF domain, and a significant proportion of them are present in specific groups of both species (Figure 2). For the DREB subfamily, motif 10 and motif 13 are specifically distributed in group I. For the ERF subfamily, motif 19 is particularly shared by members of group X, whereas motifs 20, 21, 22 and 24 are specific to group IX. Motif 23 at the N-terminal region is found only in group VII, in each member of this group. Regarding the other motifs, each is shared by members of at least two groups. Overall, motif 15 is present with the highest frequency, in 49 members in all ERF proteins, followed by motif 17 and motif 25. Moreover, ERF proteins clustering in the same clade share one or more similar conserved motifs. Some differences were also identified in conserved motifs between the two species. Motif 15 in groups VIII and X of V. fordii was not found in the corresponding groups of V. montana. In addition to the common motifs 23 and 14 of group VII in these two species, an extra conserved motif (18) is represented in V. montana. This variability might be caused by functional divergences in the ERF genes of these species.

3.5. Evolution and Selection of the Vf/VmAP2/ERF Superfamily in Vernicia Species

To investigate the evolutionary mechanism of the identified AP2/ERF superfamily in Vernicia, phylogeny-based and RBH methods were used to identify possible one-to-one orthologous genes. A total of 53 pairs of putative orthologous genes were found between V. fordii and V. montana (Table S3).
To verify whether potential selective forces were involved in the divergence of orthologous genes, the ratio of non-synonymous (Ka) and synonymous (Ks) substitution rates was calculated for each pair of orthologous genes (Table S3). In general, Ka/Ks < 1 indicates negative or purifying selection, whereas Ka/Ks > 1 indicates positive or adaptive selection. Ka/Ks = 1 indicates neutral evolution. In total, 15 orthologous genes between V. fordii and V. montana have exactly the same sequence, with zero Ka and Ks values. With regard to the calculated Ka/Ks ratios of other orthologous genes, 18.42% (7 out of 38 genes) showed Ka/Ks > 1 and 81.58% (31 out of 38 genes) Ka/Ks < 1. Notably, the average value of Ka/Ks was 0.49.

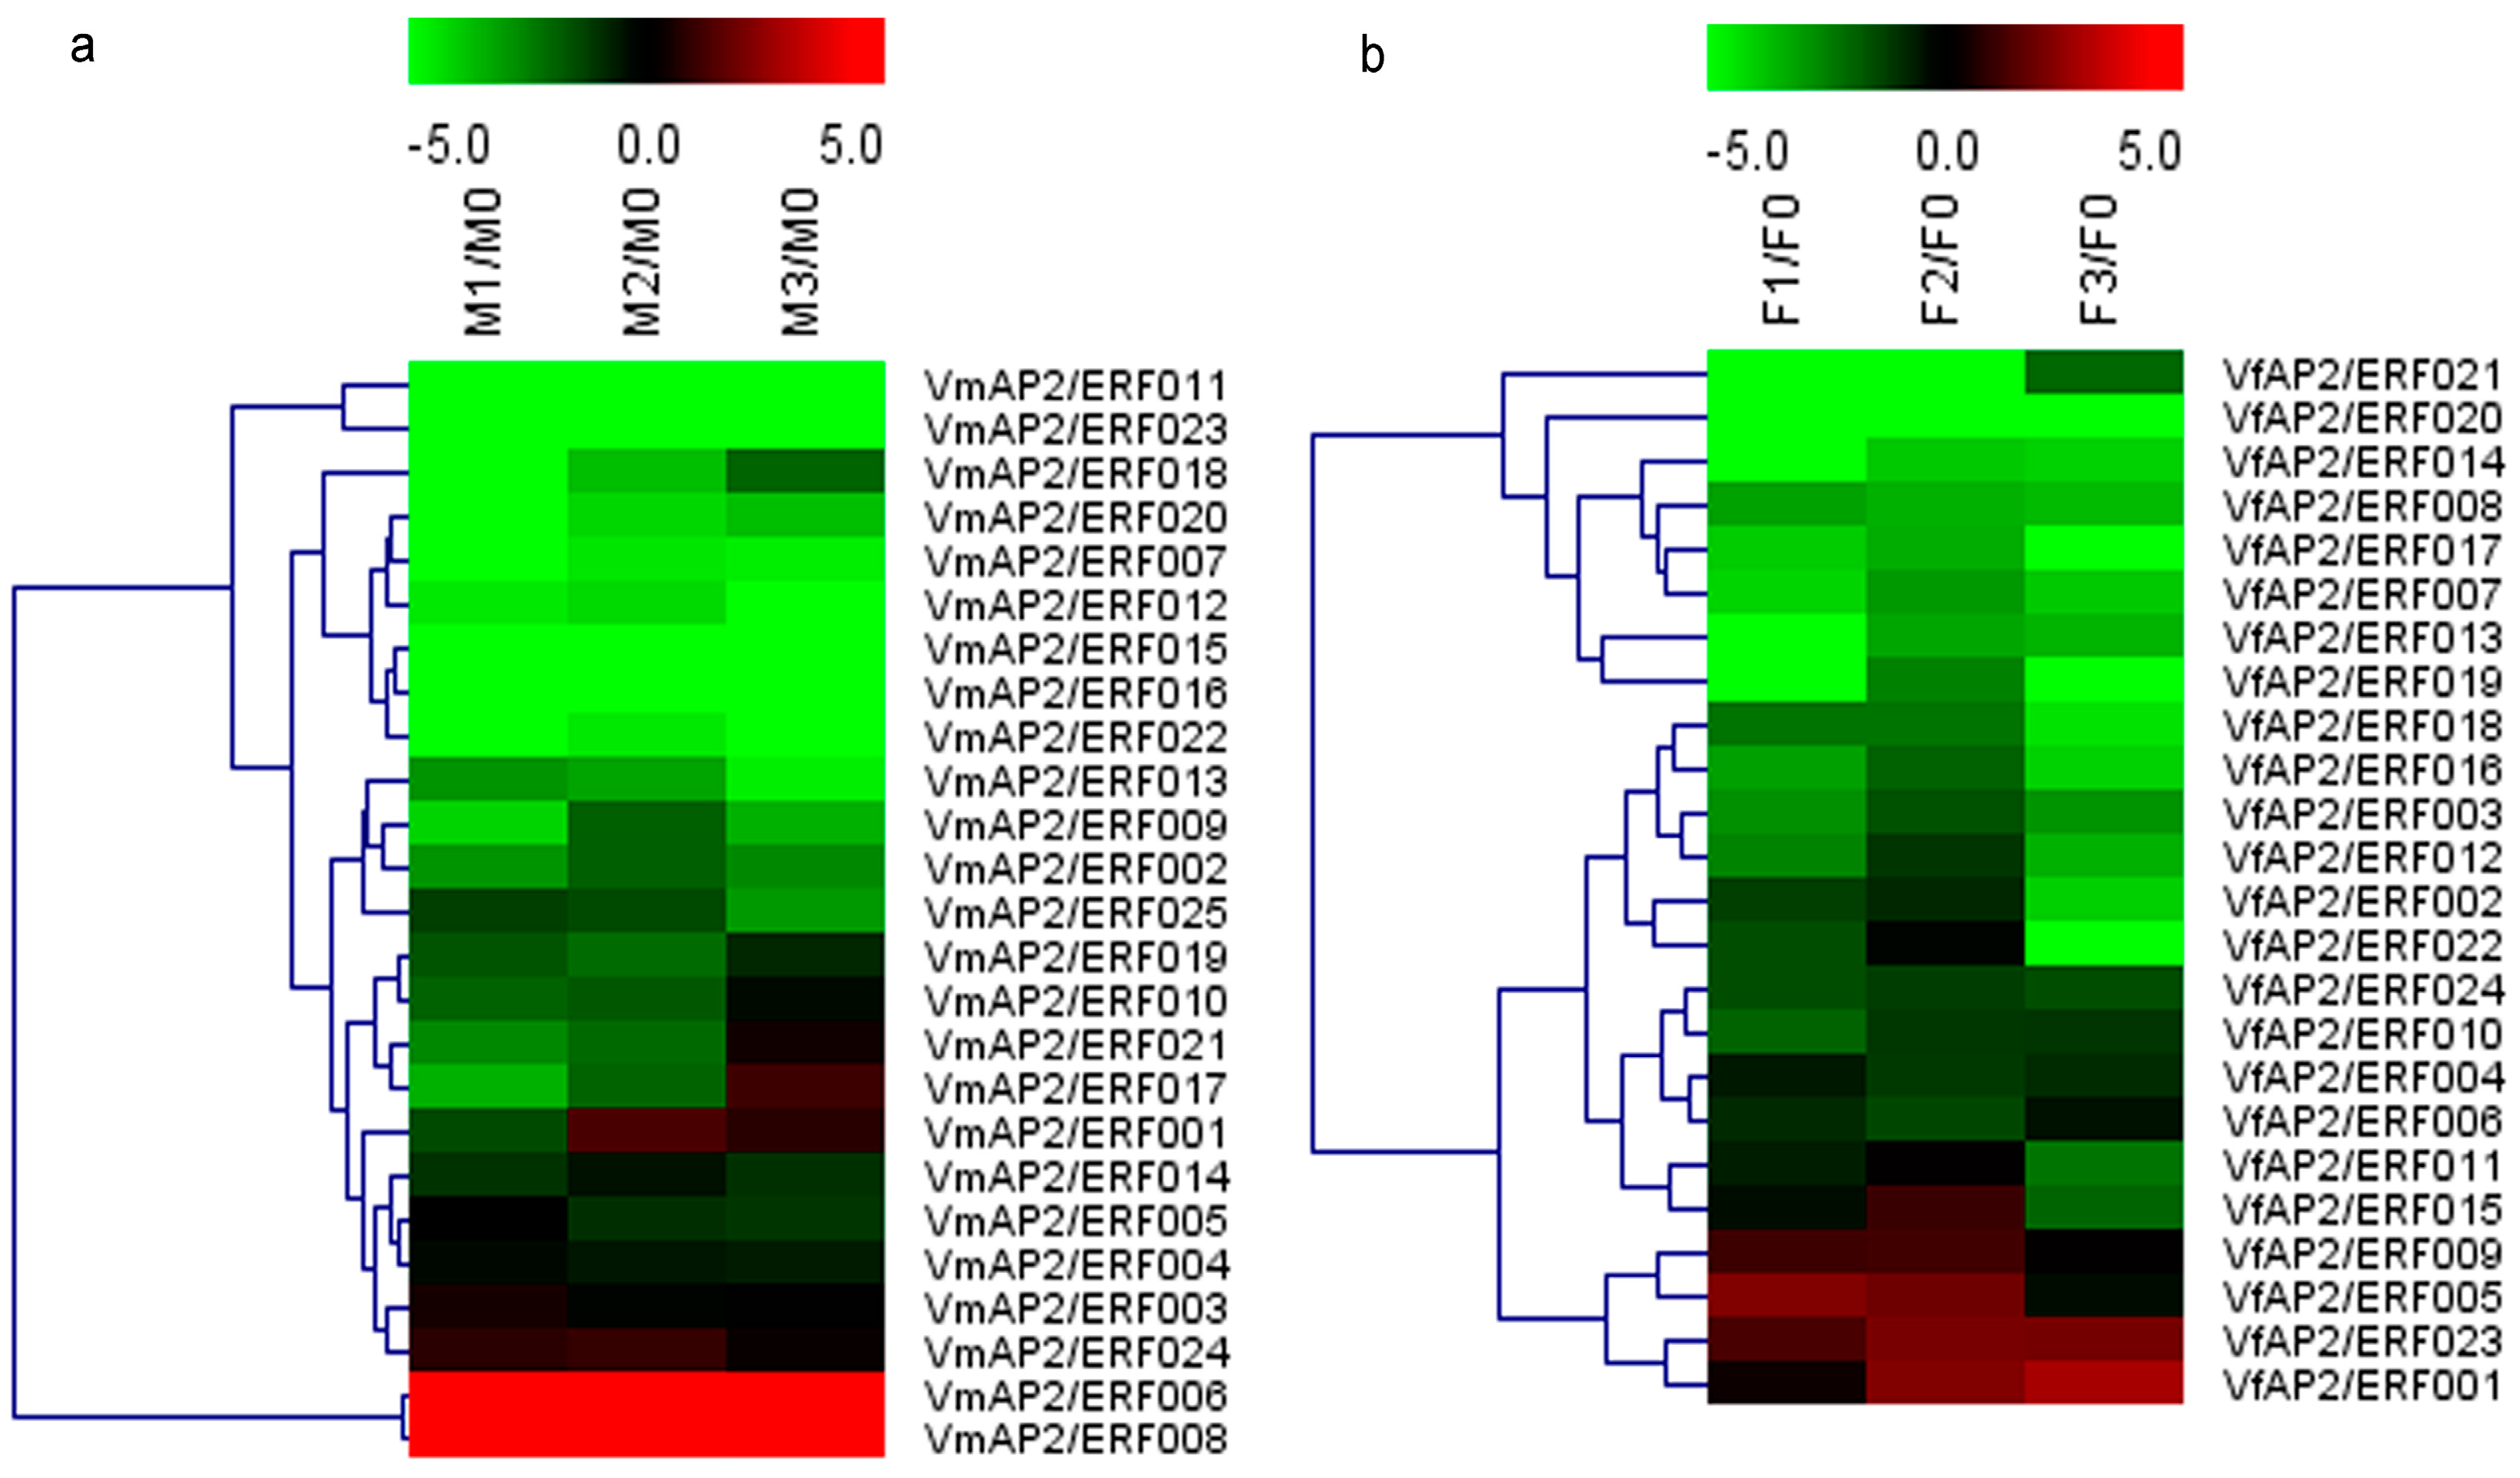
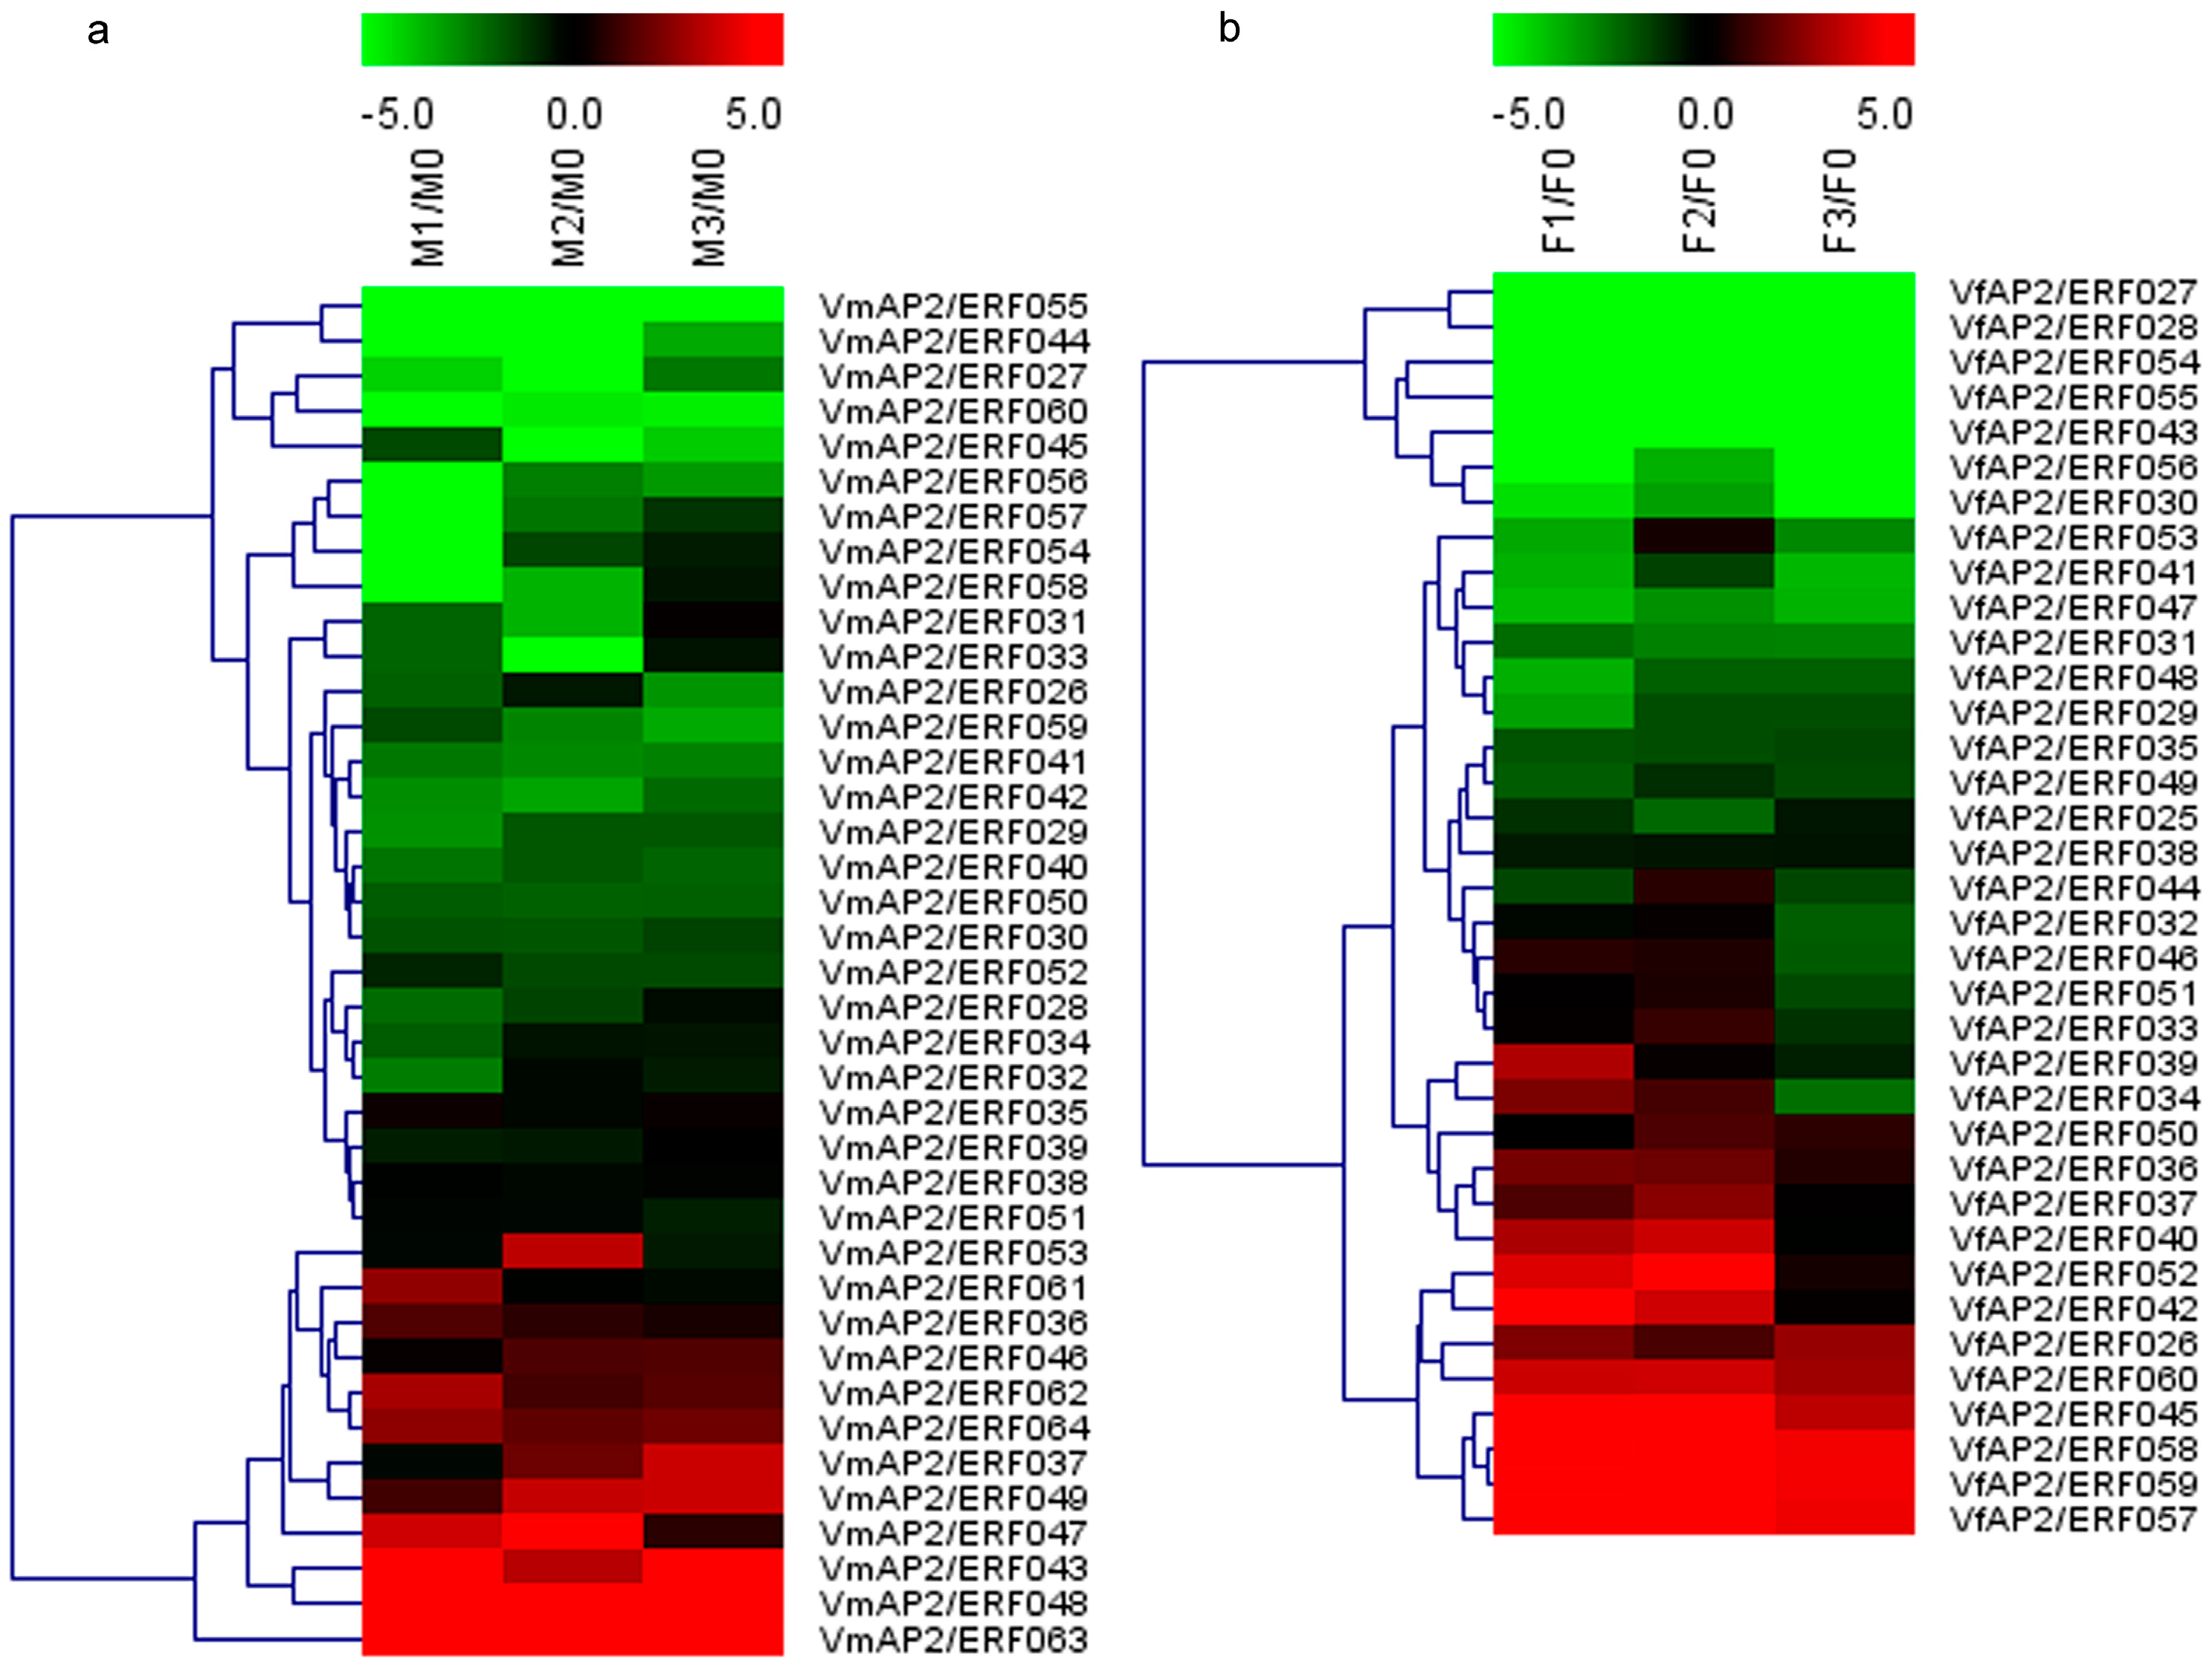
3.6. Expression Patterns of Vf/VmERF Genes in V. fordii and V. montana

To compare the expression trend of ERF genes between V. fordii and V. montana and to identify candidate ERFs involved in pathogen resistance, expression patterns of DREB and ERF subfamily genes were examined following pathogen inoculation (Figure 3 and Figure 4). The heat maps were generated based on the normalized RPKM values of the transcriptome data. Compared with the transcript abundance in the control, in general, 59 of 60 ERF genes in V. fordii responded with more than twofold change in at least one of the three treated stages, and 35 genes showed more than twofold change in expression in all three treatments; of these, 27 (77.14%) ERFs exhibited completely decreased expression but only 7 (20%) increased expression. Similarly, in V. montana, 57 of 64 ERF genes responded with more than twofold change in at least one of the three infected stages compared to the uninfected sample, and 36 genes showed more than twofold change in expression in all three treatments. Of these, 26 (72.22%) ERFs exhibited completely decreased expression but only 9 (25%) increased expression. In addition, some ERF family members were present at significant levels in noninduced roots and were repressed to low abundance by pathogen infection in both species. ERFs displaying more than twofold change were present in all phylogenetic groups (Figure S3).
Our analysis also suggested that some ERF genes have diverse expression patterns in response to pathogen attack in these two species. With regard to the DREB subfamily (Figure 3), although the number of genes with upregulated or downregulated expression in all the three treatment experiments did not differ greatly in V. fordii and V. montana, the number of genes displaying transient downregulated expression was different. Compared to the transcript abundance of the control, the expression level of some members in V. montana initially dropped and then increased, whereas no gene with this typical expression pattern was found in V. fordii. For the ERF subfamily (Figure 4), although the number of ERF genes in V. montana with sustained decreased expression in the three treatments was higher than in V. fordii, the number with sustained increased expression was lower. Regarding transient regulation, family members with initially up- and then downregulated expression were more common in V. fordii, with only one member (VmAP2/ERF061) showing this pattern in V. montana.
To compare the expression trends of the 53 pairs of orthologous genes identified between V. fordii and V. montana, another heat map was generated based on the log2-transformed RPKM values during four infection stages (Figure S4). Our comparative analysis revealed that 34 pairs of orthologous genes exhibited similar expression patterns (r > 0.6, p < 0.05) in all the four infection stages. Of these, compared to the expression levels of control, 25 pairs of genes exhibited downregulated expression after F. oxysporum infection. A small number of orthologous genes showed divergent expression patterns and only five pairs of genes performed completely opposite expression trends (r < −0.6, p < 0.05) in response to F. oxysporum.

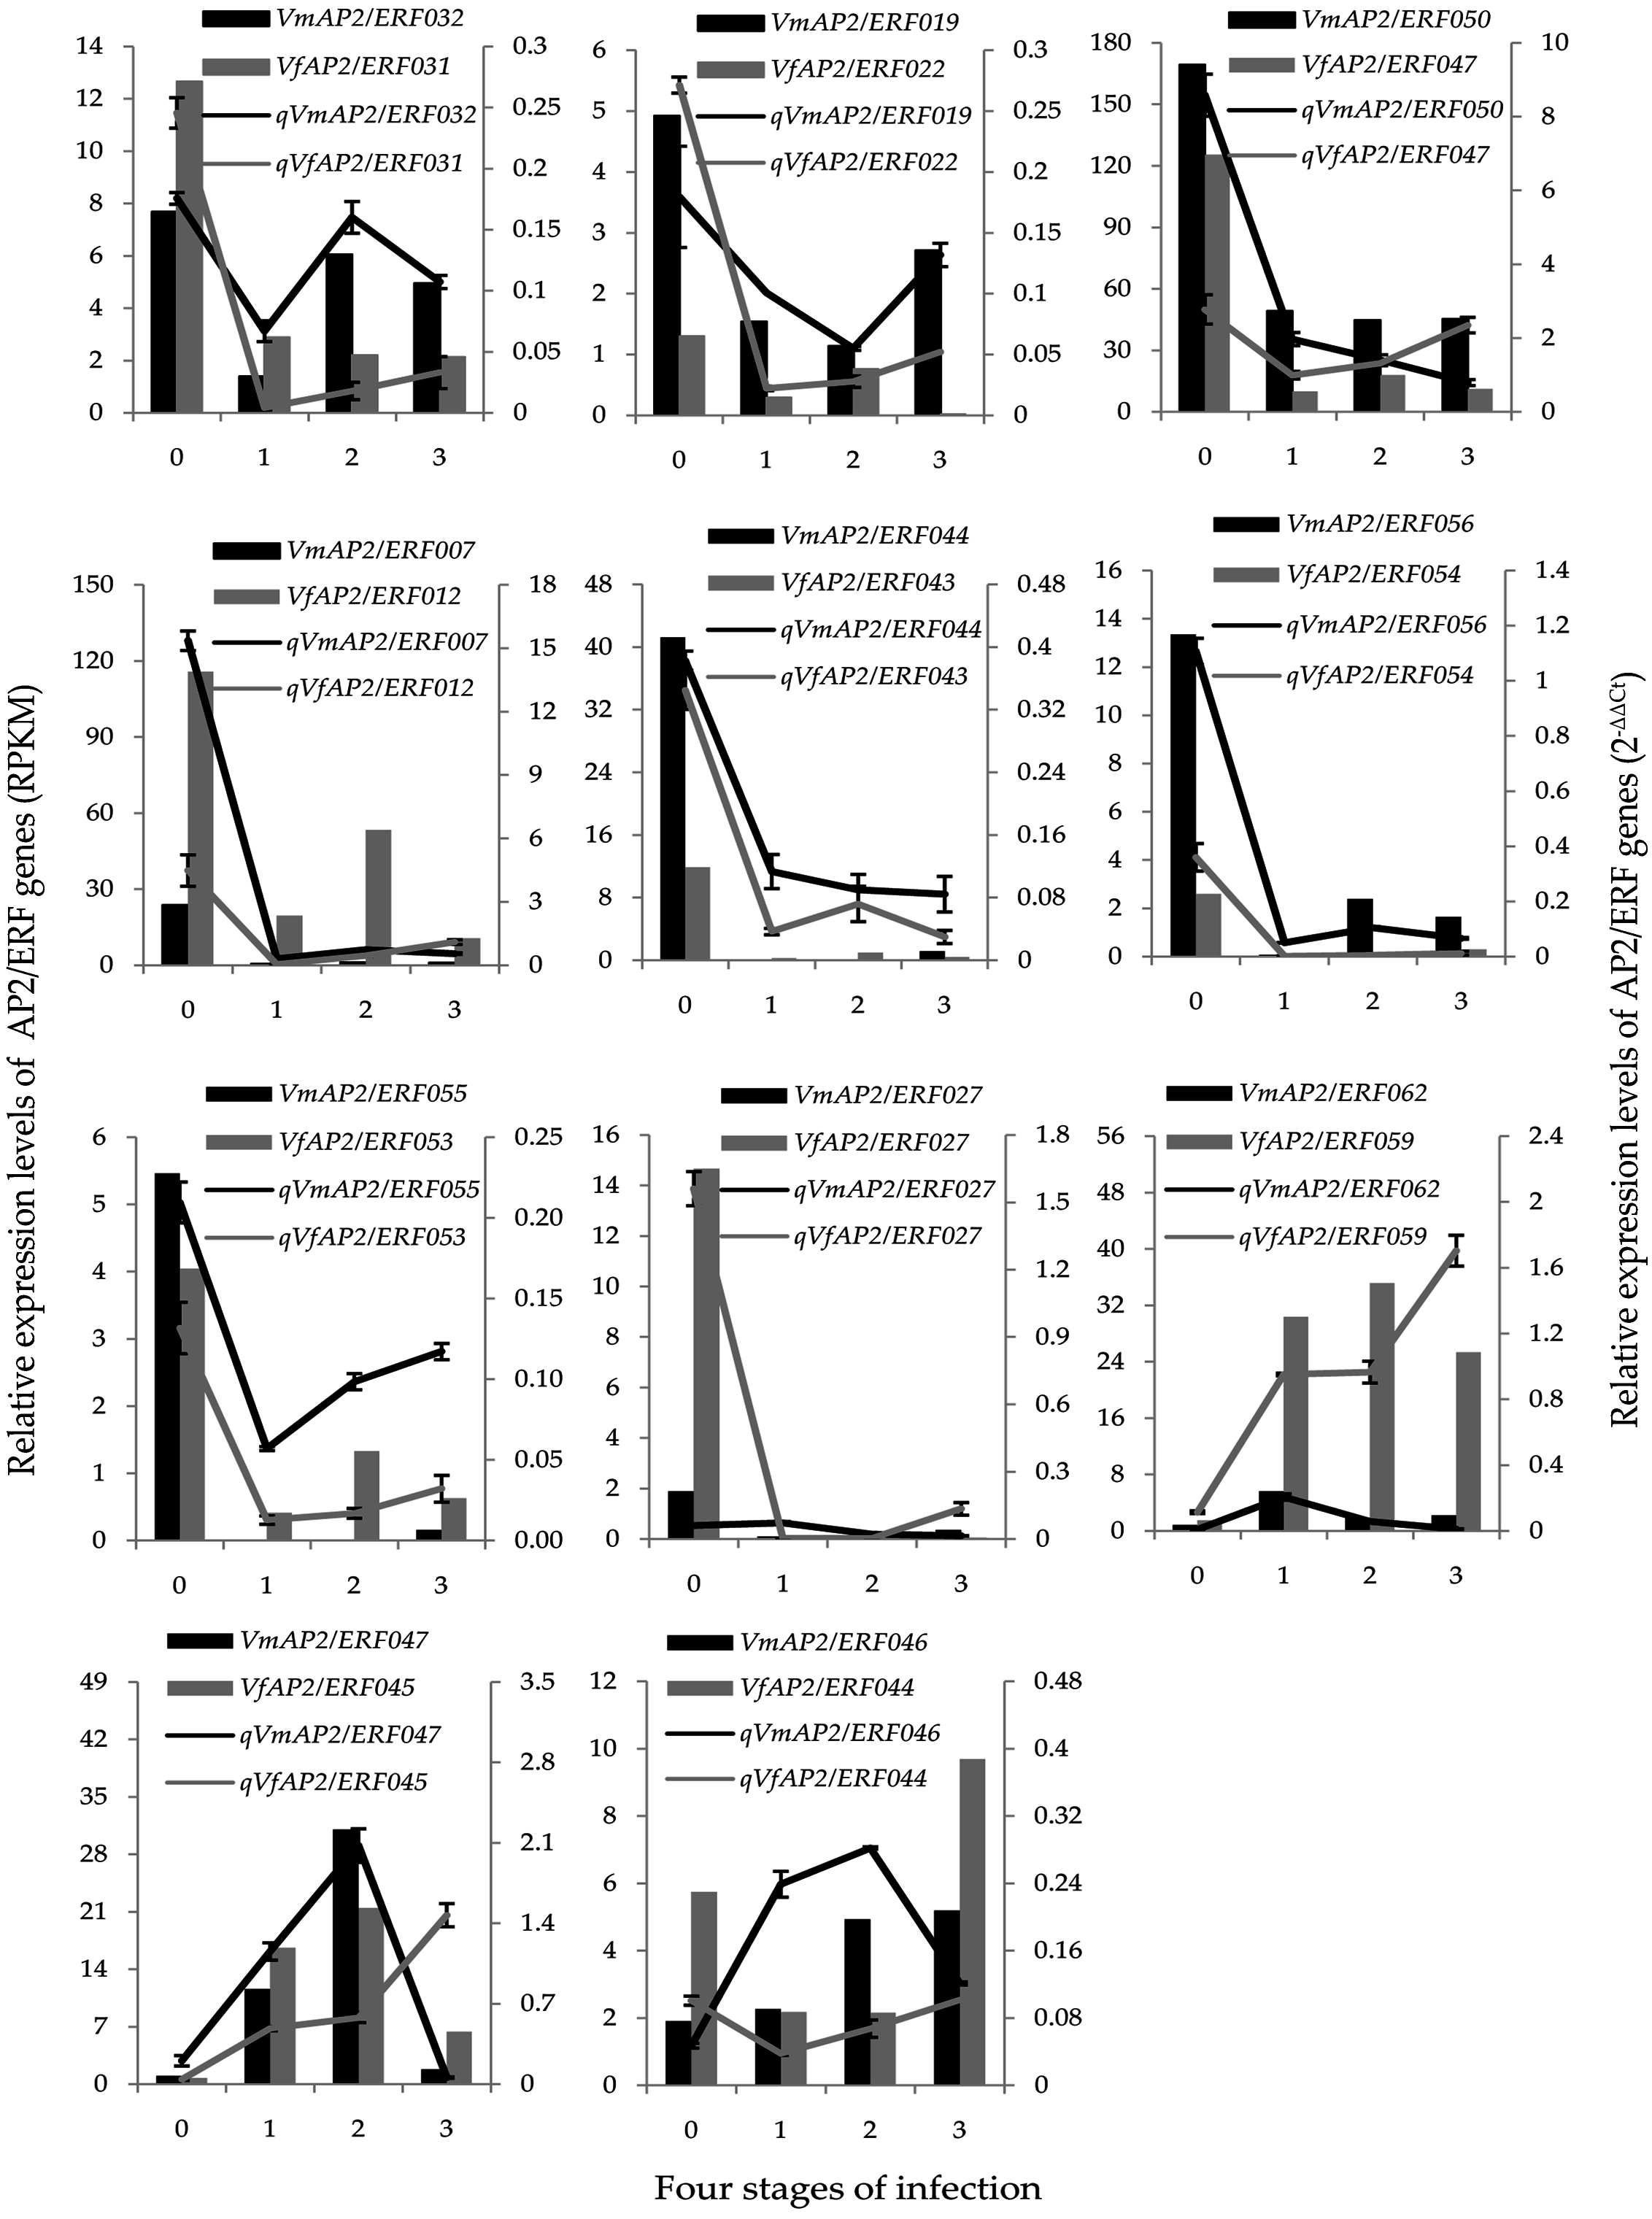
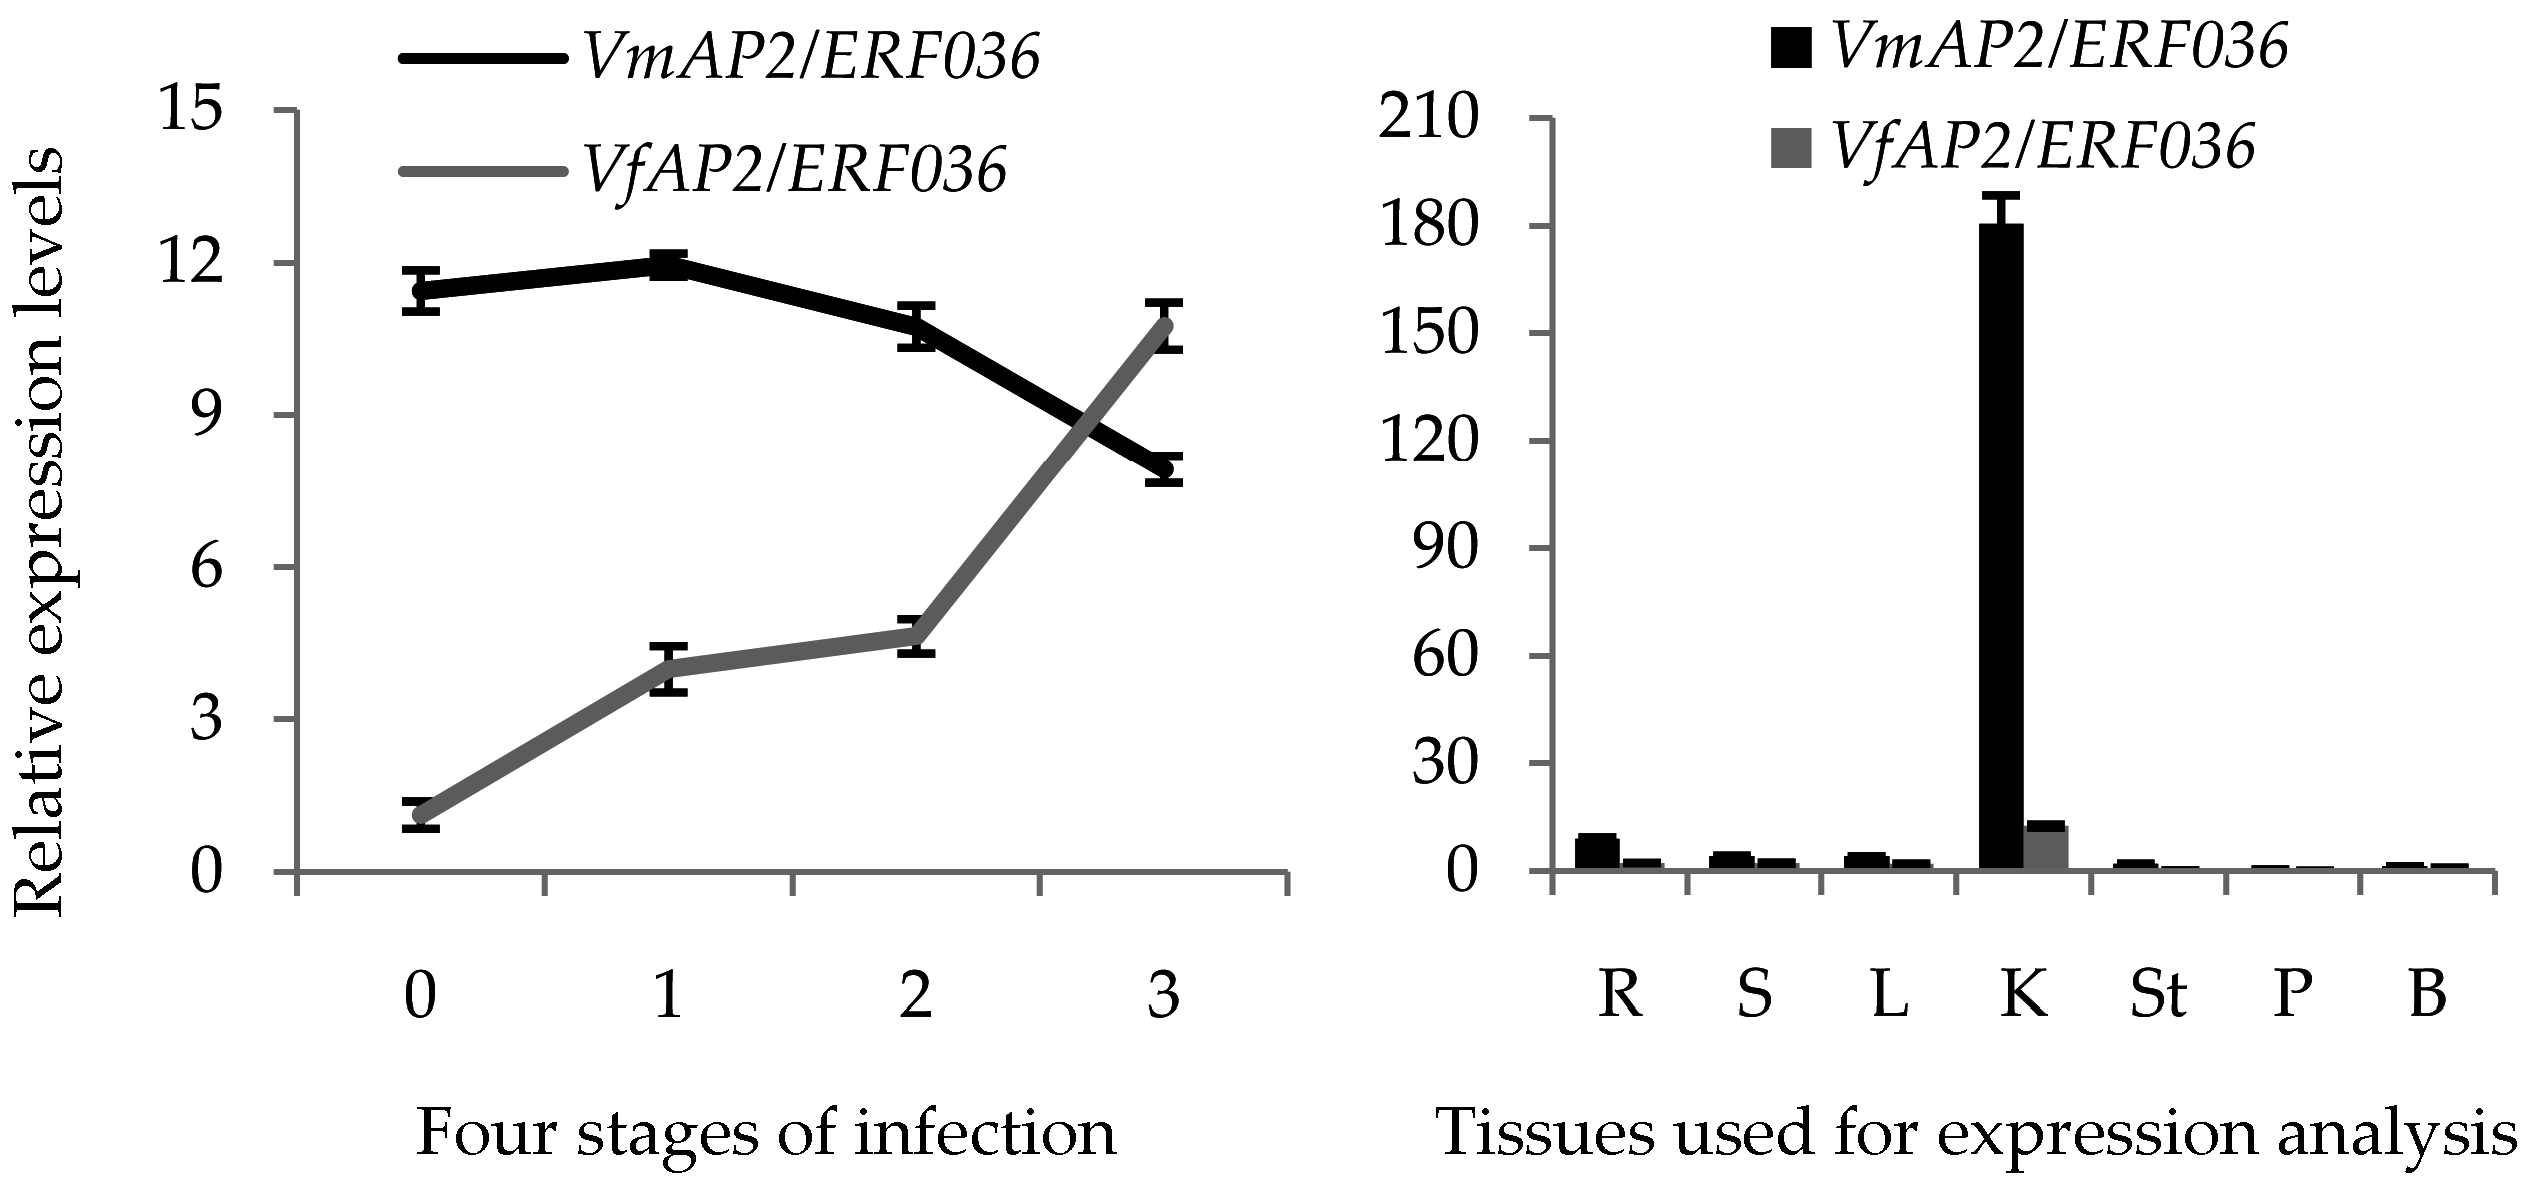
3.7. Validation of Vf/VmAP2/ERF Gene Expression by qRT-PCR

To validate our transcriptome results, 11 pairs of orthologous ERF genes were randomly chosen from the transcriptome data of V. fordii and V. montana for expression analysis. Specific primers were designed, and qRT-PCR was used to detect ERF abundance (Table S4). In general, the expression patterns obtained by the qRT-PCR assay and the transcriptome analysis data were well correlated for these selected genes (Table S5). Although fold changes compared with the control were not similar [6], trends in up- and downregulation of the selected 21 genes (except for VfAP2/ERF045) were similar, with 12 (r > 0.95, p < 0.05) having highly similar or even the exact same expression trends in the four infection stages, with nearly identical fold changes.
The expression profiles of the 22 validated orthologous genes in V. fordii and V. montana were also evaluated (Figure 5). No obvious regularity was observed for VmAP2/ERF032 expression trend after F. oxysporum infection. Analysis of the other 10 pairs of ERF genes demonstrated that six pairs of ERF genes (VfAP2/ERF012/VmAP2/ERF007, VfAP2/ERF022/VmAP2/ERF019, VfAP2/ERF043/VmAP2/ERF044, VfAP2/ERF047/VmAP2/ERF050, VfAP2/ERF054/VmAP2/ERF056, VfAP2/ERF053/VmAP2/ERF055) exhibited similar transcription patterns in response to pathogen attack. Interestingly, compared with the control, the randomly selected orthologous genes with similar expression trends were all downregulated after infection, which further supported our findings, suggesting that suppressed regulation was more common than activated regulation [53]. The other four pairs of ERF genes were differentially and specifically expressed in response to Fusarium wilt disease in these two species.

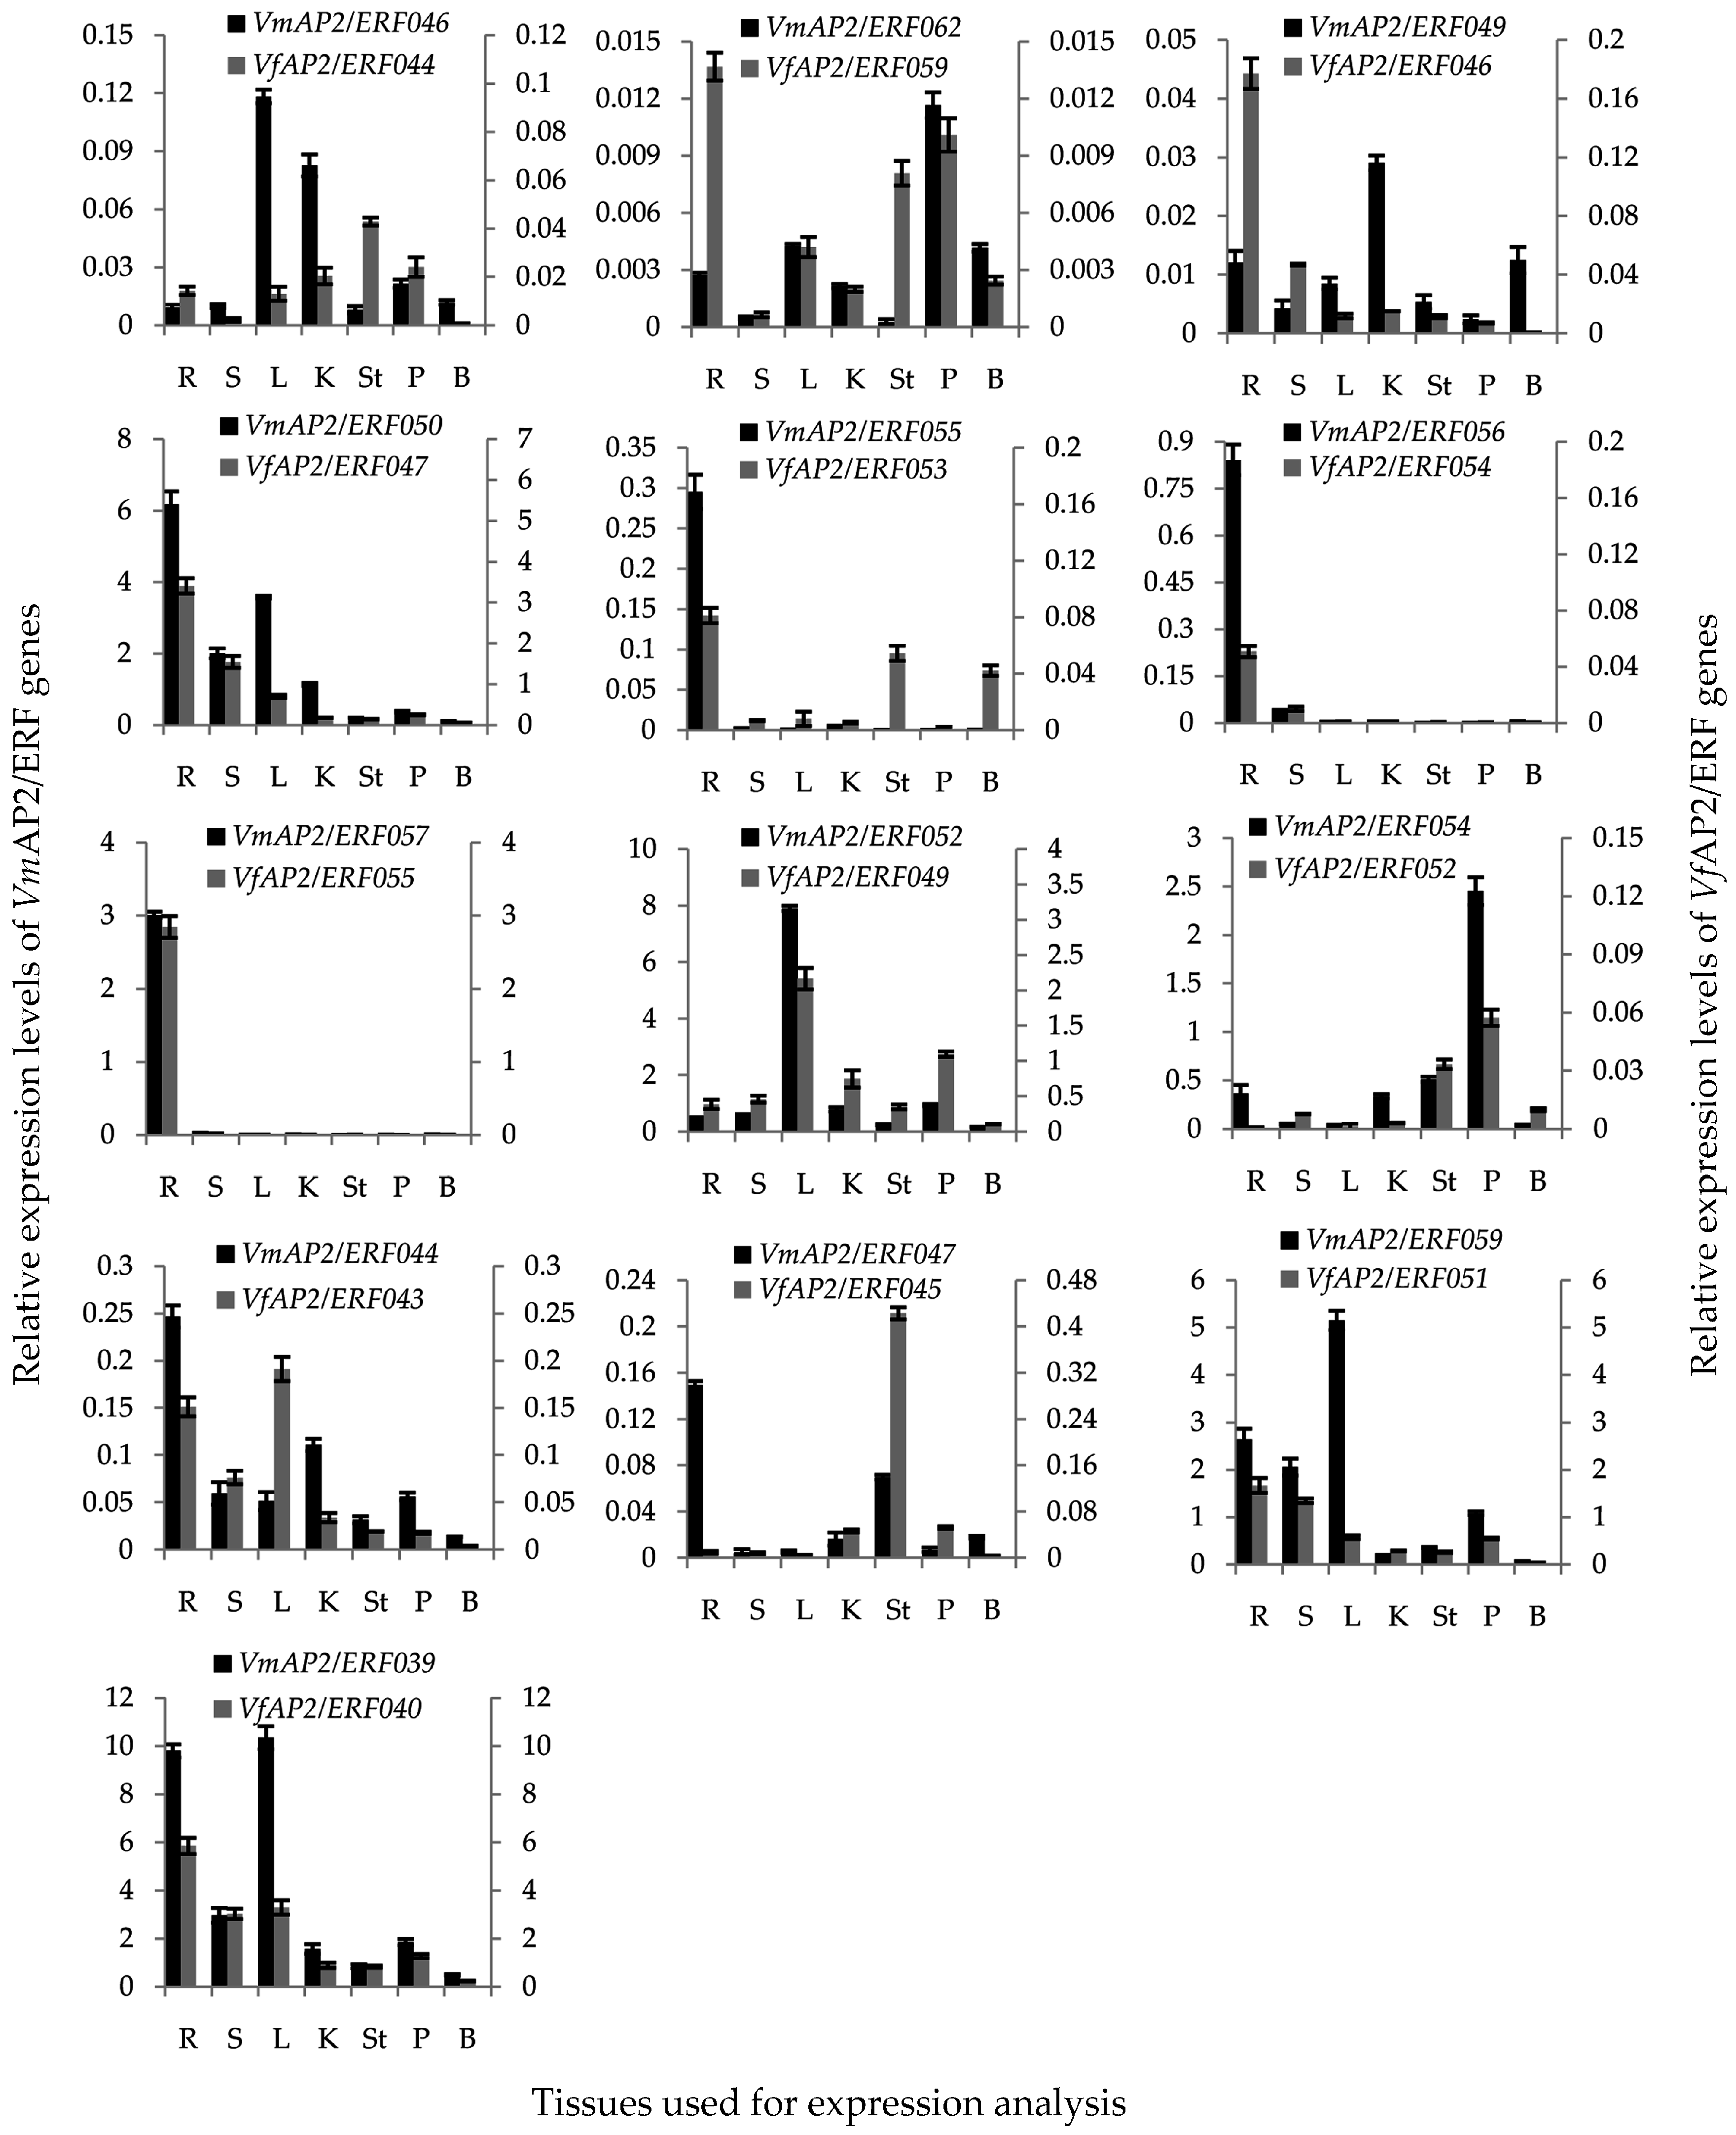
3.8. Tissue-Specific Expression Pattern of Vf/VmERF Genes

To investigate the tissue-specific expression pattern of ERF genes and to further discover genes related to pathogen resistance between V. fordii and V. montana, qRT-PCR assays were performed on 10 pairs of orthologous genes in group IX and another randomly selected three pairs of genes from the remaining groups. Root, stem, leaf and kernel tissues as well as stamen, petal and bud tissues were used for the expression analysis of these 13 pairs of ERFs (Figure 6).
The expression levels of the selected genes in root tissue revealed that four pairs of ERF genes (VfAP2/ERF040/VmAP2/ERF039, VfAP2/ERF047/VmAP2/ERF050, VfAP2/ERF051/VmAP2/ERF059 and VfAP2/ERF055/VmAP2/ERF057) are expressed to a greater degree between the two Vernicia species than the remaining gene pairs (Figure S5). Except for VfAP2/ERF044/VmAP2/ERF046, VfAP2/ERF046/VmAP2/ERF049 and VfAP2/ERF059/VmAP2/ERF062, 10 out of 13 pairs of ERFs showed higher transcript levels in root tissue in V. montana compared to their corresponding orthologous genes in V. fordii. Thus, ERFs in V. montana may have higher basal root expression levels than V. fordii.
For the 10 pairs of ERFs with higher expression in V. montana than V. fordii, six showed similar expression patterns in various tissues, and the other four showed different tissue expression patterns between the two species. For the six pairs of genes with similar expression patterns in various tissues, four (VfAP2/ERF047/VmAP2/ERF050, VfAP2/ERF053/VmAP2/ERF055, VfAP2/ERF054/VmAP2/ERF056 and VfAP2/ERF055/VmAP2/ERF057) were highly expressed in the root compared to other tissues in both species. Moreover, expression of VfAP2/ERF054/VmAP2/ERF056, VfAP2/ERF055/VmAP2/ERF057 and VmAP2/ERF055 was observed only in the root. Together with the similar expression patterns (except for VfAP2/ERF055/VmAP2/ERF057), it is possible that these genes share the same function and have a significant role in root development processes or in disease resistance in both species (Figure 5 and Figure 6). VfAP2/ERF055/VmAP2/ERF057 exhibited similar expression patterns at the first infection stage but divergent patterns at the last two stages. This finding indicates that this pair of orthologous genes may share the same function during initial pathogen infection but that their function begins to differentiate at the last two infection stages via regulation of different signaling pathways and gene interactions (Figure 6, Figure S6).
Other two pairs of ERFs (VfAP2/ERF049/VmAP2/ERF052, and VfAP2/ERF052/VmAP2/ERF054) showed the highest expression in tissues other than the root in both V. fordii and V. montana. VfAP2/ERF052/VmAP2/ERF054 showed specific transcript abundance in petal tissue, and VfAP2/ERF049/VmAP2/ERF052 were most strongly expressed in leaf tissue. These findings suggest that these genes may have a specific function during floral and leaf development, respectively.
Analysis of the expression level of four pairs of orthologous genes with different tissue expression patterns revealed that VmAP2/ERF044 and VmAP2/ERF047 had the highest transcript abundance in root tissue (0.246 ± 0.011 and 0.150 ± 0.003, respectively) compared to other tissues, though their corresponding orthologous genes VfAP2/ERF043 and VfAP2/ERF045 were specifically expressed in the leaf (0.191 ± 0.012) and stamen (0.423 ± 0.010), respectively. It is possible that VmAP2/ERF044 and VmAP2/ERF047 function in root development and pathogen resistance, but VfAP2/ERF043 and VfAP2/ERF045 are more likely to be involved in the growth and metabolism of other tissues (Figure 5 and Figure 6). Although VfAP2/ERF040 and VfAP2/ERF051 showed the highest expression in root tissue, their corresponding orthologous genes VmAP2/ERF039 and VmAP2/ERF059 were significantly expressed in the leaf in addition to the root. This indicates that these two genes in V. montana may control diverse developmental processes in tissues including leaves and roots (Figure 6). Moreover, three out of the four orthologous genes displayed relatively different expression patterns (Figure 6, Figure S6), suggesting their functional divergence in response to wilt disease.
Regarding the three pairs of ERFs with higher expression in V. fordii than V. montana, all of these genes exhibited tissue-specific expression and different trend patterns in response to Fusarium infection (Figure 5 and Figure 6, Figure S6). VfAP2/ERF044 was highly expressed in stamen tissue(0.043 ± 0.001), though the corresponding orthologous gene VmAP2/ERF046 was not significantly expressed in other tissues except leaf (0.118 ± 0.003) and kernel (0.083 ± 0.003). VfAP2/ERF046 and VfAP2/ERF059 were most strongly expressed in root tissue, whereas their corresponding orthologous genes VmAP2/ERF049 and VmAP2/ERF062 showed the highest expression levels in kernel and petal tissues, respectively. Comparing the stable expression level of VmAP2/ERF049 and VmAP2/ERF062 at the four infection stages, VfAP2/ERF046 and VfAP2/ERF059 showed dramatic changes. This result indicates that VfAP2/ERF046 and VfAP2/ERF059 might be essential factors for the response to wilt disease pathogen but that their orthologous genes may primarily participate in kernel and petal development processes, respectively.

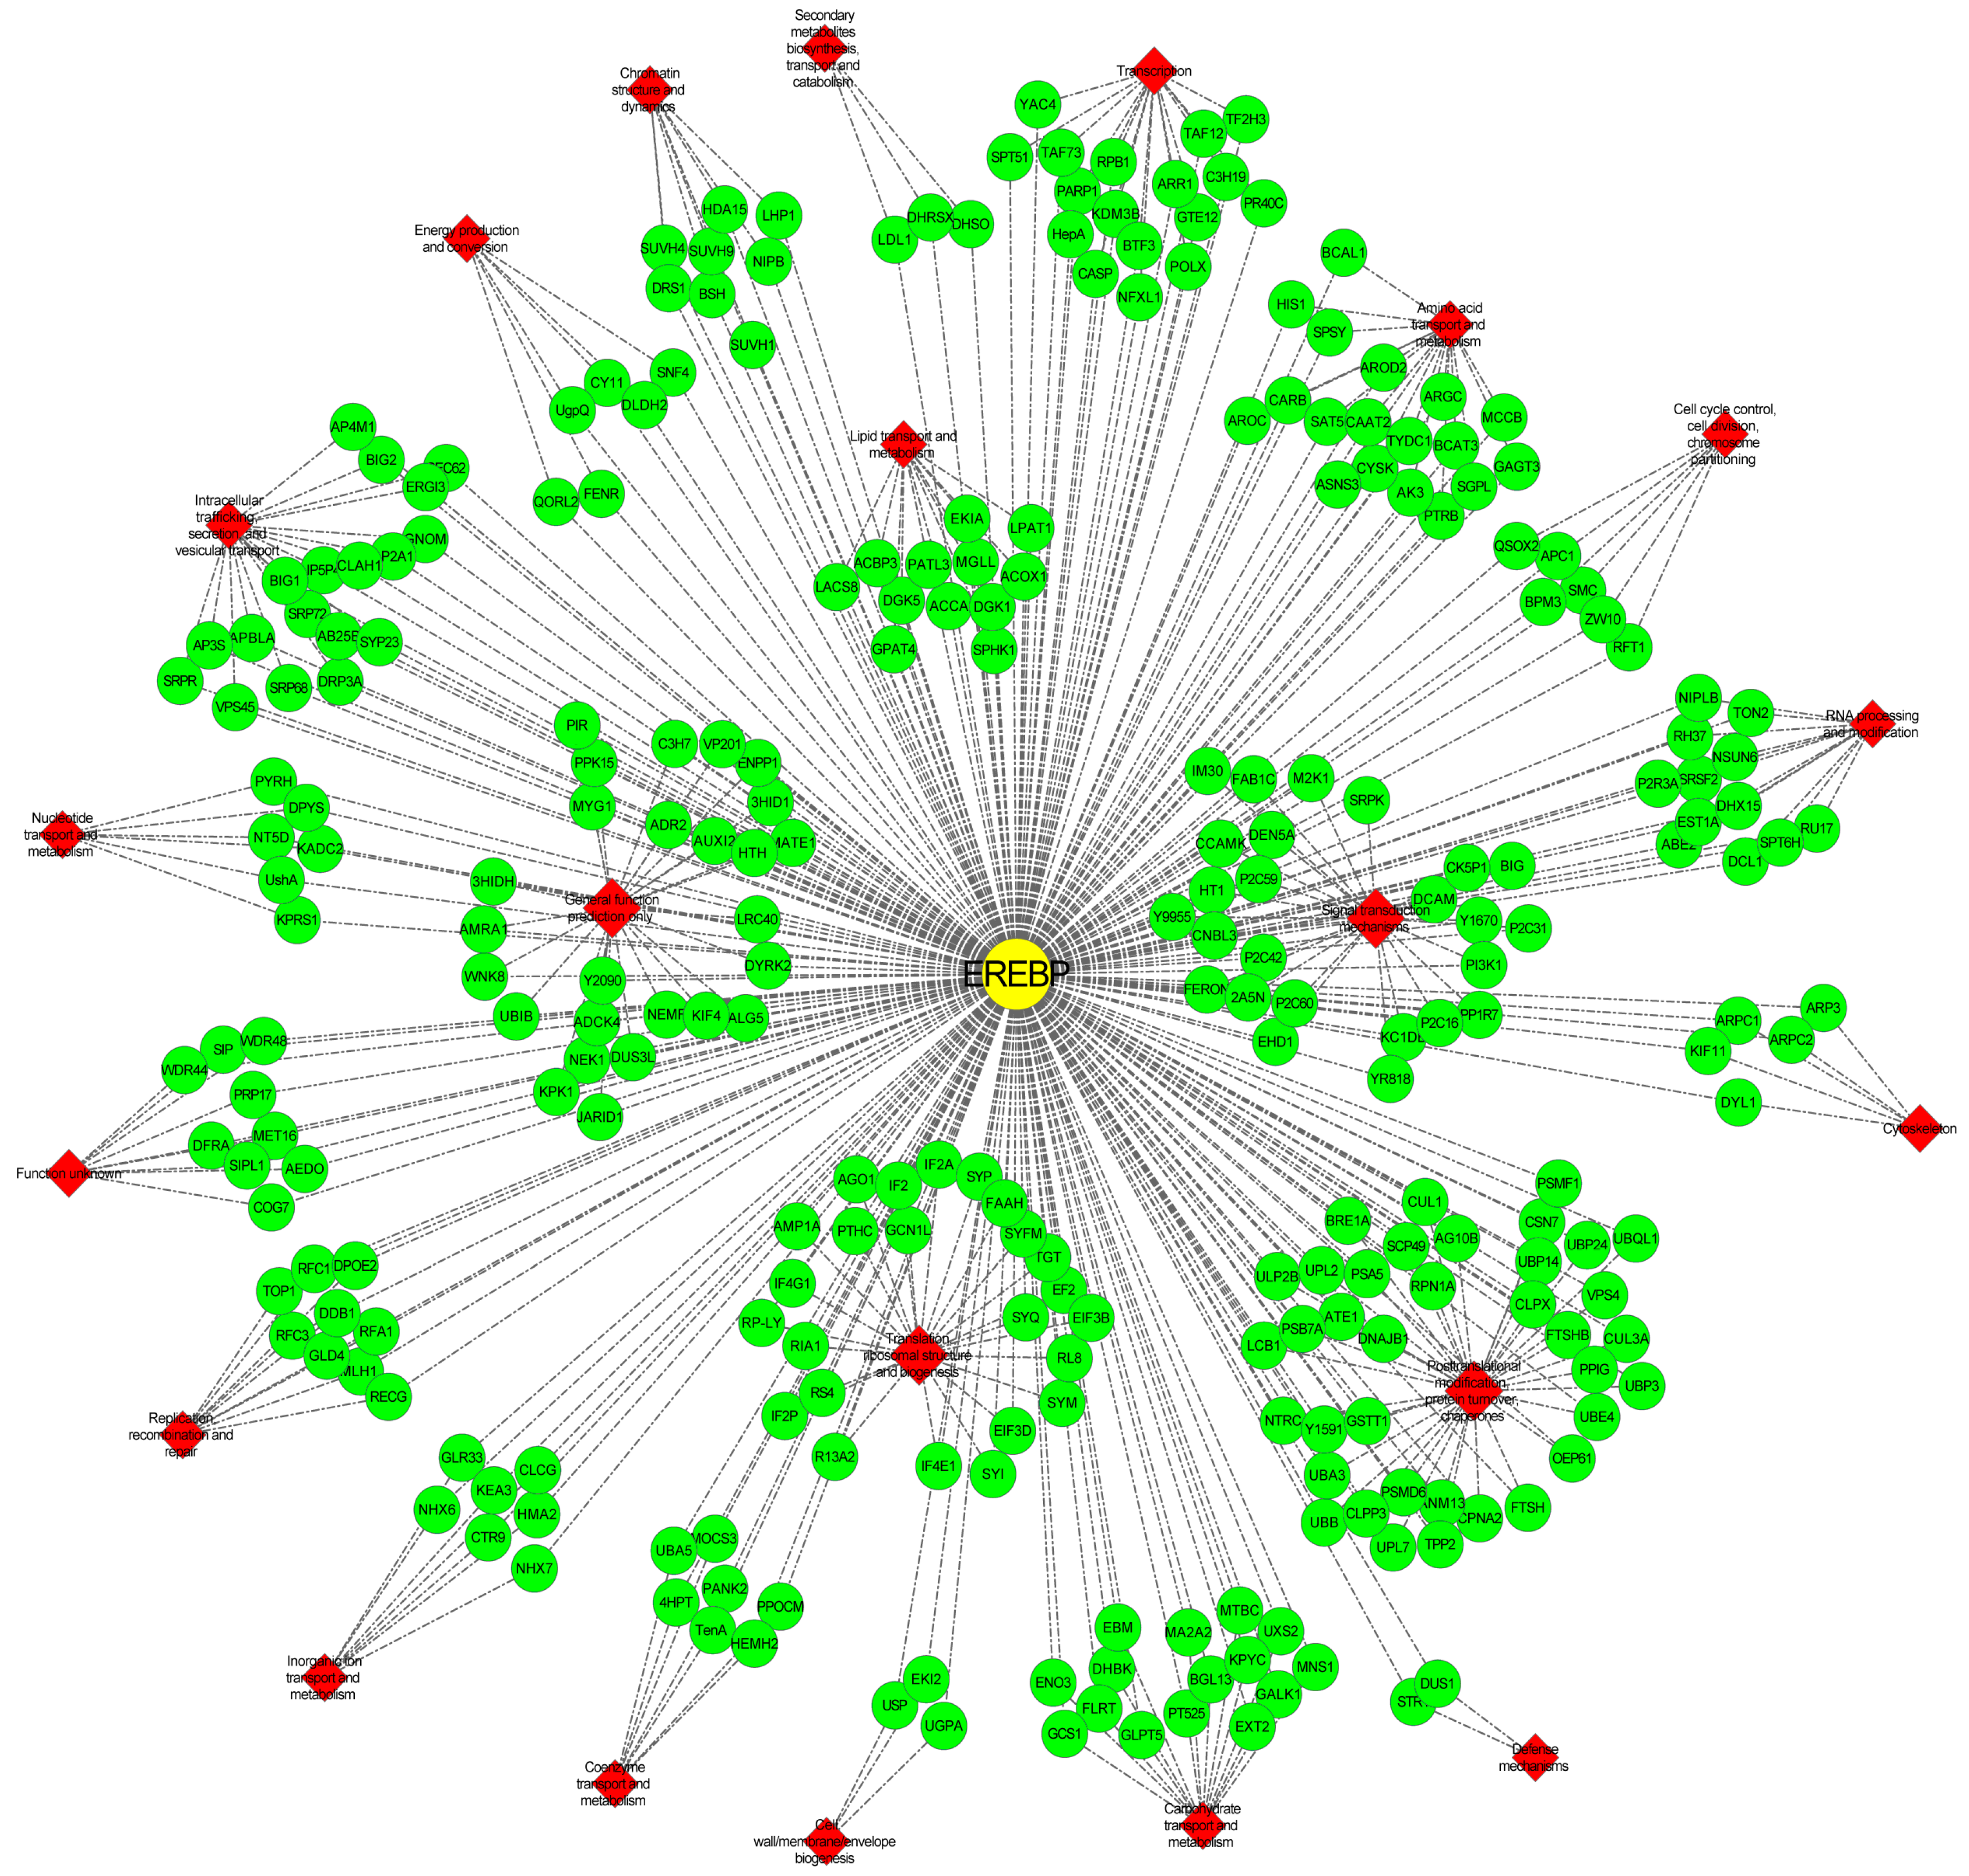
3.9. Hub Gene VmAP2/ERF036 Mediates Resistance to F. oxysporum in V. montana

To further understand the interaction between AP2/ERF superfamily genes and other genes in Vernicia species, hub genes highly connected with other genes were identified using a WGCNA. Using a weighted cut-off value >0.50, VmAP2/ERF036, a member of group VII in V. montana and having the strongest interactions with 666 genes, was identified as a hub gene. The interaction network between VmAP2/ERF036 and its connected genes was constructed using Cytoscape software (Figure 7). In detail, 316 of the 666 genes were functionally annotated, and their possible functions were predicted and classified (Figure S7). According to COG functional annotations, 278 genes were classified into 22 different clusters involved in RNA processing and modification, amino acid transport and metabolism, carbohydrate transport and metabolism, lipid transport and metabolism, and transcription. The cluster of post-translational modification, protein turnover and chaperones (37; 13.31%) accounted for the largest proportion of the 278 genes, followed by general function (26; 9.35%) and signal transduction mechanisms (26; 9.35%). Of the total, two genes were classified into defense mechanisms, but no genes were assigned to extracellular structures, cell motility and nuclear structure.
To further confirm that VmAP2/ERF036 is a putative key gene involved in pathogen resistance, the expression trend in response to F. oxysporum and tissue-specific expression pattern were analyzed (Figure 8). After F. oxysporum inoculation, VmAP2/ERF036 showed sustained decreased expression at three stages of infection and exhibited half of the noninduced expression level. Compared to this, its corresponding orthologous genes VfAP2/ERF036 displayed sustained increased expression levels and overtook VmAP2/ERF036 at the third infection stage. Expression patterns in various tissues revealed that both VfAP2/ERF036 and VmAP2/ERF036 showed the highest transcript levels in kernel instead of root tissue. Furthermore, the expression level of VmAP2/ERF036 in kernel tissue is higher than any selected genes in any tissues. However, VmAP2/ERF036 exhibited relative higher expression level in root tissue compared with other selected genes (Figure S6).

4. Discussion

In this study, 75 and 81 putative Vf/VmAP2/ERF genes containing a full-length AP2 domain were identified in V. fordii and V. montana, respectively (Table S1). Compared with other plant species, the number of AP2/ERF genes in Vernicia species appears to be lower than that in Arabidopsis (147) and physic nut (119) (Table 1). The AP2, RAV and Soloist families are of similar sizes and share a highly-conserved sequence with other species, with differences largely induced by changes in the number of ERF family genes. Compared with the 98 ERF genes in physic nut, some orthologous genes were not identified in the Vernicia transcriptome data. This suggests that these absent ERFs might be expressed in response to stresses other than Fusarium wilt disease.
To investigate the evolutionary relationships of AP2/ERF transcription factors between the two Vernicia species and Arabidopsis, we constructed another unrooted phylogenetic tree of 75 and 81 AP2/ERF family members from V. fordii and V. montana and 147 AP2/ERF family members from Arabidopsis using the conserved AP2 domain (File S1). Most of the AP2/ERF transcription factor members group together with their homologous Arabidopsis AP2/ERF gene. In contrast, several ERF groups and subgroups, such as group Xb-L and subgroups IIc, IVb and Xc in Arabidopsis, were not found in V. fordii and V. montana, results that correspond to the study by Hevea [54].
Motif analysis revealed that motif 8, which is specific to group VIII, is identical to the ERF-associated amphiphilic repression (EAR) motif L/FDLNL/F(X)P, which is essential for repression [55]. A previous report has suggested that transcription factors carrying this EAR motif form a complex with co-repressors and histone deacetylases (HDAs), favoring a closed chromatin structure to repress transcription [56]. Motif 15, containing the SP(T/V)SVL sequence, is found in group VI. The SP(T/V)SVL motif was identified as a potential phosphorylation site of mitogen-activated protein (MAP) kinase and/or casein kinase I [5]. Motif 23 is found in the N-terminal region of group VII members, and small blocks of conserved MCCGAI sequences play a role in ethylene transcriptional activation [5,57]. The EDLL motif of ERF family group 9 is necessary for interaction with the activator interaction domain (ACID) of MEDIATOR25 (MED25), which is to date the only co-activator demonstrated to directly interact with ERFs in Arabidopsis [30]. It is reported that ERF98 without a functional EDLL motif fails to interact with MED25 and to transactivate reporter genes [58]. In Vernicia species, the VmAP2/ERF048 protein was identified as harboring the EDLL motif, indicating that this gene may play a significant role in transactivational activity.
During evolution, gene duplication plays a critical role in the expansion of gene families [59]. Our results about evolution and selection of the 53 pairs of putative one-to-one orthologous genes between V. fordii and V. montana suggest that a significant proportion of AP2/ERF genes have undergone strong purifying selection and that only a small proportion of AP2/ERF genes have undergone positive selection. It should be mentioned that VmAP2/ERF036, with a maximum Ka/Ks ratio of 1.58, shows the most interaction with other genes, as described below (Figure 7).
The global expression analysis of ERFs in Vernicia species demonstrated that many ERF genes respond to F. oxysporum treatment, with decreased transcript abundance being more commonly observed than increased abundance (Figure 3 and Figure 4). This is consistent with the results of Chen et al. [53]. In general, analysis of expression trends revealed that orthologous ERFs largely show rather similar expression patterns in response to wilt disease, though some genes varied between the Vernicia species. The differential trends of these ERFs might be due to specific responses to pathogen stress in these species [6]. Combining the differently expressed members of the AP2 family between the two species, it appears that AP2/ERF genes mainly exhibit initially up- and finally downregulated expression in V. fordii, whereas the opposite trend was more common in V. montana after F. oxysporum infection (Figure S8).
Disease resistance is a complex biological process involving a series of response genes and signal transduction pathways. Given that genes in group IX have often been linked to defense against pathogen infection (Table 2), tissue-specific expression pattern analysis was performed on 10 pairs of orthologous genes in group IX and another randomly selected three pairs of genes. It suggested that, except for VfAP2/ERF055/VmAP2/ERF057, all orthologous genes with similar tissue expression patterns exhibited similar expression trends in response to wilt disease in V. fordii and V. montana. Orthologous genes with different expression trends in response to wilt disease were more likely to exhibit different tissue expression patterns between the two species (Figure 5 and Figure 6, Figure S6). This difference in expression patterns may have resulted from function differentiation with regard to F. oxysporum resistance. Given that V. montana is resistant and V. fordii susceptible and that F. oxysporum invades the roots, it can be concluded that genes having more important functions in V. montana roots compared to V. fordii are more likely to be critical for controlling the pathogen response.
Among all the interacting genes shown in Figure 7, leucine-rich repeat (LRR) receptor-like serine/threonine-protein kinases (RLPs), which play significant roles in inducing the primary immune response via interaction with fungal effectors such as chitin and xylanase [65], were noteworthy. In addition, components of mitogen-activated protein kinase (MAPK) signal cascades, MAPK and WRKY transcription factor genes were identified in this network. Combined with previously described perspectives [30], it can be hypothesized that RLPs recognize F. oxysporum infection and then trigger the MAPK defense signaling pathway. Upon infection, WRKY transcription factors are activated via phosphorylation by MAPKs and induce the expression of VmAP2/ERF036 by promoter binding. However, putative downstream target genes PDF1.2 and PR possessing GCC boxes in their promoters were not identified as interacting genes. It is possible that VmAP2/ERF036 is not directly involved in activating PR genes, but may function by inducing the expression of other genes such as VmAP2/ERF035 of this network, which may in turn lead to signal amplification and activation of expression of multiple pathogen resistance genes. It has been suggested that VmAP2/ERF036 is a crucial component of MAPK cascades. Cell wall modifications are vital to plant pathogen resistance, and network analysis also revealed that VmAP2/ERF036 may function together with cell wall alteration genes such as monooxygenase and β-glucosidase. Acyl-CoA-binding protein 4 (ACBP4) identified in the network, which participates in the biosynthesis of membrane lipids, had been shown to bind to RAP2.3 in the cytosol and at the periphery of the nucleus via an ankyrin domain [66]. It is also possible that interaction with ACBP4 determines the stability, localization and transcriptional activity of VmAP2/ERF036. Diacylglycerol kinase (DGK), another hub gene of the transcriptome reported to be important for resistance to Magnaporthe grisea [67] and involved in other signal transduction mechanisms, was also detected in this network. The results indicate that VmAP2/ERF036 may be the intersection point of a variety of signaling pathways. Overall, although the exact pathway and functional relevance of VmAP2/ERF036 to pathogen resistance and its interactive genes remain to be determined, these data will serve as a valuable resource for candidate gene discovery and molecular mechanism elucidation related to pathogen response and signaling pathway regulation.
Comprehensive expression patterns analysis in various tissues indicates that, in addition to playing a vital role in fruit development and ripening, VfAP2/ERF036 and VmAP2/ERF036 are also involved in root defense and developmental processes. In addition, the orthologous genes VfAP2/ERF036/VmAP2/ERF036 showed opposite expression patterns in V. fordii and V. montana after F. oxysporum inoculation. This finding indicates that this pair of orthologous genes may exert different functions via divergent signaling pathways and gene interactions. In view of the hub gene identity of VmAP2/ERF036, it is quite possible that VmAP2/ERF036 is a putative key functional gene in response to F. oxysporum. Through genetic modification of V. fordii using the VmAP2/ERF036 found in V. montana, it may be possible to enhance the disease-resistance capacity and productivity of the former.
In conclusion, a comprehensive investigation of a very important gene family, the AP2/ERF superfamily, was performed between susceptible V. fordii and resistant V. montana. This is the first comprehensive report on a transcriptome-wide survey and evolutionary analysis of AP2/ERF transcription factors in Vernicia. Our comparative analyses of the Vf/VmAP2/ERF superfamily will act as a first step toward disease-resistance breeding. Further comprehensive functional characterization of putative candidate Vf/mAP2/ERF genes identified in our study may contribute to revealing the mechanisms of resistance and controlling the Fusarium wilt disease, which will provide additional information for genetic engineering of V. fordii and possibly other beneficial plant species.

Supplementary Materials

Supplementary materials can be found at https://www.mdpi.com/2073-4425/7/12/109/s1. File S1: Phylogenetic analysis of AP2/ERF superfamily proteins between V. fordii, V. montana and Arabidopsis thaliana, Figure S1: Alignment of APETALA2/ethylene-responsive element binding factor (AP2/ERF) domains of 124 ERF family proteins identified from Vernicia fordii and Vernicia montana, Figure S2: Alignment of AP2/ERF domains of 26 AP2 family proteins identified from V. fordii and V. montana, Figure S3: Frequency of ERFs in response to Fusarium oxysporum in phylogenetic groups, Figure S4: Comparative analysis of the expression trends of 53 pairs of orthologous genes in response to F. oxysporum, Figure S5: Comparative analysis of the expression levels of the selected AP2/ERF genes in root tissue, Figure S6: Expression trends of AP2/ERF genes for tissue specific expression analysis in Vernicia during the four infection stages, Figure S7: Clusters of orthologous groups (COG) classification, Figure S8: Expression profiles of AP2 genes in response to F. oxysporum in the root of V. fordii and V. montana, Table S1: The individual APETALA2/ethylene-responsive element binding factor (AP2/ERF) genes identified in Vernicia fordii and Vernicia montana transcriptome database, Table S2: Conserved motifs identified from the ERF family in V. fordii and V. montana, Table S3: The one to one orthologous gene pairs and their corresponding Ka/Ks ratios, Table S4: List of specific primer sequences used for real-time PCR analysis, Table S5: Pearson correlation r between transcriptome data and qRT-PCR result of selected orthologous genes in V. fordii and V. montana.

Acknowledgments

The work has been financially supported by the Special Fund for Forestry-Scientific Research in the Public Interest (201304102).

Author Contributions

Y.C. and Q.Z. designed the experiments and analyzed the data; Q.Z. performed most of the experiments; M.G., L.W. and Y.W. provided technical assistance; Q.Z. and Y.C. wrote the article with contributions of all the authors; Y.C. and Y.W. conceived the project, supervised the analysis and critically complemented the manuscript. All authors read and approved the final manuscript.

Conflicts of Interest

The authors have no conflicts of interest to declare.

References

  1. McGrath, K.C.; Dombrecht, B.; Manners, J.M.; Schenk, P.M.; Edgar, C.I.; Maclean, D.J.; Scheible, W.R.; Udvardi, M.K.; Kazan, K. Repressor- and activator-type ethylene response factors functioning in jasmonate signaling and disease resistance identified via a genome-wide screen of Arabidopsis transcription factor gene expression. Plant Physiol. 2005, 139, 949–959. [Google Scholar] [CrossRef] [PubMed]
  2. Licausi, F.; Ohme-Takagi, M.; Perata, P. APETALA2/Ethylene Responsive Factor (AP2/ERF) transcription factors: Mediators of stress responses and developmental programs. New Phytol. 2013, 199, 639–649. [Google Scholar] [CrossRef] [PubMed]
  3. Gutterson, N.; Reuber, T.L. Regulation of disease resistance pathways by AP2/ERF transcription factors. Curr. Opin. Plant Biol. 2004, 7, 465–471. [Google Scholar] [CrossRef] [PubMed]
  4. Dey, S.; Corina Vlot, A. Ethylene responsive factors in the orchestration of stress responses in monocotyledonous plants. Front. Plant Sci. 2015, 6, 640. [Google Scholar] [CrossRef] [PubMed]
  5. Nakano, T.; Suzuki, K.; Fujimura, T.; Shinshi, H. Genome-wide analysis of the ERF gene family in Arabidopsis and rice. Plant Physiol. 2006, 140, 411–432. [Google Scholar] [CrossRef] [PubMed]
  6. Lakhwani, D.; Pandey, A.; Dhar, Y.V.; Bag, S.K.; Trivedi, P.K.; Asif, M.H. Genome-wide analysis of the AP2/ERF family in Musa species reveals divergence and neofunctionalisation during evolution. Sci. Rep. 2016, 6, 18878. [Google Scholar] [CrossRef] [PubMed]
  7. Aukerman, M.J.; Sakai, H. Regulation of flowering time and floral organ identity by a microRNA and its APETALA2-like target genes. Plant Cell 2003, 15, 2730–2741. [Google Scholar] [CrossRef] [PubMed]
  8. El Ouakfaoui, S.; Schnell, J.; Abdeen, A.; Colville, A.; Labbé, H.; Han, S.; Baum, B.; Laberge, S.; Miki, B. Control of somatic embryogenesis and embryo development by AP2 transcription factors. Plant Mol. Biol. 2010, 74, 313–326. [Google Scholar] [CrossRef] [PubMed]
  9. Imin, N.; Nizamidin, M.; Wu, T.; Rolfe, B.G. Factors involved in root formation in Medicago truncatula. J. Exp. Bot. 2007, 58, 439–451. [Google Scholar] [CrossRef] [PubMed]
  10. Jofuku, K.D.; Omidyar, P.K.; Gee, Z.; Okamuro, J.K. Control of seed mass and seed yield by the floral homeotic gene APETALA2. Proc. Natl. Acad. Sci. USA 2005, 102, 3117–3122. [Google Scholar] [CrossRef] [PubMed]
  11. Hu, L.; Liu, S. Genome-wide identification and phylogenetic analysis of the ERF gene family in cucumbers. Genet. Mol. Biol. 2011, 34, 624–633. [Google Scholar] [CrossRef] [PubMed]
  12. Sohn, K.H.; Lee, S.C.; Jung, H.W.; Hong, J.K.; Hwang, B.K. Expression and functional roles of the pepper pathogen-induced transcription factor RAV1 in bacterial disease resistance, and drought and salt stress tolerance. Plant Mol. Biol. 2006, 61, 897–915. [Google Scholar] [CrossRef] [PubMed]
  13. Li, C.W.; Su, R.C.; Cheng, C.P.; Sanjaya; You, S.J.; Hsieh, T.H.; Chao, T.C.; Chan, M.T. Tomato RAV transcription factor is a pivotal modulator involved in the AP2/EREBP-mediated defense pathway. Plant Physiol. 2011, 156, 213–227. [Google Scholar] [CrossRef] [PubMed]
  14. Hu, Y.X.; Wang, Y.X.; Liu, X.F.; Li, J.Y. Arabidopsis RAV1 is down-regulated by brassinosteroid and may act as a negative regulator during plant development. Cell Res. 2004, 14, 8–15. [Google Scholar] [CrossRef] [PubMed]
  15. Alonso, J.M.; Stepanova, A.N.; Leisse, T.J.; Kim, C.J.; Chen, H.; Shinn, P.; Stevenson, D.K.; Zimmerman, J.; Barajas, P.; Cheuk, R.; et al. Genome-wide insertional mutagenesis of Arabidopsis thaliana. Science 2003, 301, 653–657. [Google Scholar] [CrossRef] [PubMed]
  16. Sakuma, Y.; Liu, Q.; Dubouzet, J.G.; Abe, H.; Shinozaki, K.; Yamaguchi-Shinozaki, K. DNA-binding specificity of the ERF/AP2 domain of Arabidopsis DREBs, transcription factors involved in dehydration- and cold-inducible gene expression. Biochem. Biophys. Res. Commun. 2002, 290, 998–1009. [Google Scholar] [CrossRef] [PubMed]
  17. Ohme-Takagi, M.; Shinshi, H. Ethylene-inducible DNA binding proteins that interact with an ethylene-responsive element. Plant Cell 1995, 7, 173–182. [Google Scholar] [CrossRef] [PubMed]
  18. Zhang, G.; Chen, M.; Li, L.; Xu, Z.; Chen, X.; Guo, J.; Ma, Y. Overexpression of the soybean GmERF3 gene, an AP2/ERF type transcription factor for increased tolerances to salt, drought, and diseases in transgenic tobacco. J. Exp. Bot. 2009, 60, 3781–3796. [Google Scholar] [CrossRef] [PubMed]
  19. Hao, D.; Ohme-Takagi, M.; Sarai, A. Unique mode of GCC box recognition by the DNA-binding domain of ethylene responsive element-binding factor (ERF domain) in plants. J. Biol. Chem. 1998, 273, 26857–26861. [Google Scholar] [CrossRef] [PubMed]
  20. Sun, S.; Yu, J.P.; Chen, F.; Zhao, T.J.; Fang, X.H.; Li, Y.Q.; Sui, S.F. TINY, a dehydration-responsive element (DRE)-binding protein-like transcription factor connecting the DRE and ethylene-responsive element-mediated signaling pathways in Arabidopsis. J. Biol. Chem. 2008, 283, 6261–6271. [Google Scholar] [CrossRef] [PubMed]
  21. Xu, W.; Li, F.; Ling, L.; Liu, A. Genome-wide survey and expression profiles of the AP2/ERF family in castor bean (Ricinus communis L.). BMC Genom. 2013, 14, 785. [Google Scholar] [CrossRef] [PubMed]
  22. Song, X.; Li, Y.; Hou, X. Genome-wide analysis of the AP2/ERF transcription factor superfamily in Chinese cabbage (Brassica rapa ssp. pekinensis). BMC Genom. 2013, 14, 573. [Google Scholar] [CrossRef] [PubMed]
  23. Licausi, F.; Giorgi, F.M.; Zenoni, S.; Osti, F.; Pezzotti, M.; Perata, P. Genomic and transcriptomic analysis of the AP2/ERF superfamily in Vitis vinifera. BMC Genom. 2010, 11, 719. [Google Scholar] [CrossRef] [PubMed]
  24. Zhuang, J.; Cai, B.; Peng, R.H.; Zhu, B.; Jin, X.F.; Xue, Y.; Gao, F.; Fu, X.Y.; Tian, Y.S.; Zhao, W.; et al. Genome-wide analysis of the AP2/ERF gene family in Populus trichocarpa. Biochem. Biophys. Res. Commun. 2008, 371, 468–474. [Google Scholar] [CrossRef] [PubMed]
  25. Tang, Y.; Qin, S.; Guo, Y.; Chen, Y.; Wu, P.; Chen, Y.; Li, M.; Jiang, H.; Wu, G. Genome-wide analysis of the AP2/ERF gene family in physic nut and overexpression of the JcERF011 gene in rice increased its sensitivity to salinity stress. PLoS ONE 2016, 11, e0150879. [Google Scholar] [CrossRef] [PubMed]
  26. Shu, Y.; Liu, Y.; Zhang, J.; Song, L.; Guo, C. Genome-Wide Analysis of the AP2/ERF Superfamily Genes and their Responses to Abiotic Stress in Medicago truncatula. Front. Plant Sci. 2016, 6, 1247. [Google Scholar] [CrossRef] [PubMed]
  27. Wu, H.; Lv, H.; Li, L.; Liu, J.; Mu, S.; Li, X.; Gao, J. Genome-Wide Analysis of the AP2/ERF Transcription Factors Family and the Expression Patterns of DREB Genes in Moso Bamboo (Phyllostachys edulis). PLoS ONE 2015, 10, e0126657. [Google Scholar] [CrossRef] [PubMed]
  28. Agarwal, G.; Garg, V.; Kudapa, H.; Doddamani, D.; Pazhamala, L.T.; Khan, A.W.; Thudi, M.; Lee, S.H.; Varshney, R.K. Genome-wide dissection of AP2/ERF and HSP90 gene families in five legumes and expression profiles in chickpea and pigeonpea. Plant Biotechnol. J. 2016, 14, 1562–1577. [Google Scholar] [CrossRef] [PubMed] [Green Version]
  29. Berrocal-Lobo, M.; Molina, A. Ethylene response factor 1 mediates Arabidopsis resistance to the soilborne fungus Fusarium oxysporum. Mol. Plant Microbe Interact. 2004, 17, 763–770. [Google Scholar] [CrossRef] [PubMed]
  30. Huang, P.Y.; Catinot, J.; Zimmerli, L. Ethylene response factors in Arabidopsis immunity. J. Exp. Bot. 2016, 67, 1231–1241. [Google Scholar] [CrossRef] [PubMed]
  31. Oñate-Sánchez, L.; Anderson, J.P.; Young, J.; Singh, K.B. AtERF14, a member of the ERF family of transcription factors, plays a nonredundant role in plant defense. Plant Physiol. 2007, 143, 400–409. [Google Scholar] [CrossRef] [PubMed]
  32. Moffat, C.S.; Ingle, R.A.; Wathugala, D.L.; Saunders, N.J.; Knight, H.; Knight, M.R. ERF5 and ERF6 play redundant roles as positive regulators of JA/Et-mediated defense against Botrytis cinereal in Arabidopsis. PLoS ONE 2012, 7, e35995. [Google Scholar] [CrossRef] [PubMed] [Green Version]
  33. Meng, X.; Xu, J.; He, Y.; Yang, K.Y.; Mordorski, B.; Liu, Y.; Zhang, S. Phosphorylation of an ERF transcription factor by Arabidopsis MPK3/MPK6 regulates plant defense gene induction and fungal resistance. Plant Cell 2013, 25, 1126–1142. [Google Scholar] [CrossRef] [PubMed]
  34. Zhang, H.; Huang, L.; Dai, Y.; Liu, S.; Hong, Y.; Tian, L.; Huang, L.; Cao, Z.; Li, D.; Song, F. Arabidopsis AtERF15 positively regulates immunity against Pseudomonas syringae pv. tomato DC3000 and Botrytis cinerea. Front. Plant Sci. 2015, 6, 686. [Google Scholar] [PubMed]
  35. Pré, M.; Atallah, M.; Champion, A.; De Vos, M.; Pieterse, C.M.; Memelink, J. The AP2/ERF domain transcription factor ORA59 integrates jasmonic acid and ethylene signals in plant defense. Plant Physiol. 2008, 147, 1347–1357. [Google Scholar] [CrossRef] [PubMed]
  36. Chen, Y.H.; Chen, J.H.; Chang, C.Y.; Chang, C.C. Biodiesel production from tung Vernicia montana oil and its blending properties in different fatty acid compositions. Bioresour. Technol. 2010, 101, 9521–9526. [Google Scholar] [CrossRef] [PubMed]
  37. PlantTFDB: Plant Transcription Factor Database. Available online: http://planttfdb.cbi.pku.edu.cn (accessed on 9 November 2016).
  38. Simple Modular Architecture Research Tool (SMART). Available online: http://smart.embl-heidelberg.de/ (accessed on 9 November 2016).
  39. Letunic, I.; Doerks, T.; Bork, P. SMART 7: Recent updates to the protein domain annotation resource. Nucleic Acids Res. 2012, 40, D302–D305. [Google Scholar] [CrossRef] [PubMed]
  40. Marchler-Bauer, A.; Lu, S.; Anderson, J.B.; Chitsaz, F.; Derbyshire, M.K.; DeWeese-Scott, C.; Fong, J.H.; Geer, L.Y.; Geer, R.C.; Gonzales, N.R.; et al. CDD: A conserved domain database for the functional annotation of proteins. Nucleic Acids Res. 2011, 39, D225–D229. [Google Scholar] [CrossRef] [PubMed]
  41. Hall, T. BioEdit: An important software for molecular biology. GERF Bull. Biosci. 2011, 2, 60–61. [Google Scholar]
  42. Tamura, K.; Peterson, D.; Peterson, N.; Stecher, G.; Nei, M.; Kumar, S. MEGA5: Molecular evolutionary genetics analysis using maximum likelihood, evolutionary distance, and maximum parsimony methods. Mol. Biol. Evol. 2011, 28, 2731–2739. [Google Scholar] [CrossRef] [PubMed]
  43. Bailey, T.L.; Boden, M.; Buske, F.A.; Frith, M.; Grant, C.E.; Clementi, L.; Ren, J.; Li, W.W.; Noble, W.S. MEME SUITE: Tools for motif discovery and searching. Nucleic Acids Res. 2009, 37, W202–W208. [Google Scholar] [CrossRef] [PubMed]
  44. Zhang, Z.; Li, J.; Zhao, X.Q.; Wang, J.; Wong, G.K.; Yu, J. KaKs_Calculator: Calculating Ka and Ks through model selection and model averaging. Genom. Proteom. Bioinform. 2006, 4, 259–263. [Google Scholar] [CrossRef]
  45. Trinity. Available online: http://trinityrnaseq.sourceforge.net/ (accessed on 9 November 2016).
  46. Li, B.; Dewey, C.N. RSEM: Accurate transcript quantification from RNA-Seq data with or without a reference genome. BMC Bioinform. 2011, 12, 323. [Google Scholar] [CrossRef] [PubMed]
  47. Saeed, A.I.; Sharov, V.; White, J.; Li, J.; Liang, W.; Bhagabati, N.; Braisted, J.; Klapa, M.; Currier, T.; Thiagarajan, M.; et al. TM4: A free, open-source system for microarray data management and analysis. Biotechniques 2003, 34, 374–378. [Google Scholar] [PubMed]
  48. Shannon, P.; Markiel, A.; Ozier, O.; Baliga, N.S.; Wang, J.T.; Ramage, D.; Amin, N.; Schwikowski, B.; Ideker, T. Cytoscape: A software environment for integrated models of biomolecular interaction networks. Genome Res. 2003, 13, 2498–2504. [Google Scholar] [CrossRef] [PubMed]
  49. Allen, M.D.; Yamasaki, K.; Ohme-Takagi, M.; Tateno, M.; Suzuki, M. A novel mode of DNA recognition by a β-sheet revealed by the solution structure of the GCC-box binding domain in complex with DNA. EMBO J. 1998, 17, 5484–5496. [Google Scholar] [CrossRef] [PubMed]
  50. Cao, Z.F.; Li, J.; Chen, F.; Li, Y.Q.; Zhou, H.M.; Liu, Q. Effect of two conserved amino acid residues on DREB1A function. Biochemistry 2001, 66, 623–627. [Google Scholar] [PubMed]
  51. Liu, L.; White, M.J.; MacRae, T.H. Transcription factors and their genes in higher plants functional domains, evolution and regulation. Eur. J. Biochem. 1999, 262, 247–257. [Google Scholar] [CrossRef] [PubMed]
  52. Reyes, J.C.; Muro-Pastor, M.I.; Florencio, F.J. The GATA family of transcription factors in Arabidopsis and rice. Plant Physiol. 2004, 134, 1718–1732. [Google Scholar] [CrossRef] [PubMed]
  53. Chen, Y.C.; Wong, C.L.; Muzzi, F.; Vlaardingerbroek, I.; Kidd, B.N.; Schenk, P.M. Root defense analysis against Fusarium oxysporum reveals new regulators to confer resistance. Sci. Rep. 2014, 4, 5584. [Google Scholar] [CrossRef] [PubMed]
  54. Duan, C.; Argout, X.; Gébelin, V.; Summo, M.; Dufayard, J.F.; Leclercq, J.; Piyatrakul, P.; Pirrello, J.; Rio, M.; Champion, A.; et al. Identification of the Hevea brasiliensis AP2/ERF superfamily by RNA sequencing. BMC Genom. 2013, 14, 30. [Google Scholar] [CrossRef] [PubMed] [Green Version]
  55. Ohta, M.; Matsui, K.; Hiratsu, K.; Shinshi, H.; Ohme-Takagi, M. Repression domains of class II ERF transcriptional repressors share an essential motif for active repression. Plant Cell 2001, 13, 1959–1968. [Google Scholar] [CrossRef] [PubMed]
  56. Kagale, S.; Rozwadowski, K. EAR motif-mediated transcriptional repression in plants: An underlying mechanism for epigenetic regulation of gene expression. Epigenetics 2011, 6, 141–146. [Google Scholar] [CrossRef] [PubMed]
  57. Rashid, M.; Guangyuan, H.; Guangxiao, Y.; Hussain, J.; Xu, Y. AP2/ERF transcription factor in rice: Genome-wide canvas and syntenic relationships between monocots and eudicots. Evol. Bioinform. Online 2012, 8, 321–355. [Google Scholar] [CrossRef] [PubMed]
  58. Çevik, V.; Kidd, B.N.; Zhang, P.; Hill, C.; Kiddle, S.; Denby, K.J.; Holub, E.B.; Cahill, D.M.; Manners, J.M.; Schenk, P.M.; et al. MEDIATOR25 acts as an integrative hub for the regulation of jasmonate-responsive gene expression in Arabidopsis. Plant Physiol. 2012, 160, 541–555. [Google Scholar] [CrossRef] [PubMed]
  59. Zhang, J.; Li, Y.; Jia, H.X.; Li, J.B.; Huang, J.; Lu, M.Z.; Hu, J.J. The heat shock factor gene family in Salix suchowensis: A genome-wide survey and expression profiling during development and abiotic stresses. Front. Plant Sci. 2015, 6, 748. [Google Scholar] [CrossRef] [PubMed]
  60. Maruyama, Y.; Yamoto, N.; Suzuki, Y.; Chiba, Y.; Yamazaki, K.; Sato, T.; Yamaguchi, J. The Arabidopsis transcriptional repressor ERF9 participates in resistance against necrotrophic fungi. Plant Sci. 2013, 213, 79–87. [Google Scholar] [CrossRef] [PubMed]
  61. Zhu, Z.; Shi, J.; Xu, W.; Li, H.; He, M.; Xu, Y.; Xu, T.; Yang, Y.; Cao, J.; Wang, Y. Three ERF transcription factors from Chinese wild grapevine Vitis pseudoreticulata participate in different biotic and abiotic stress-responsive pathways. J. Plant Physiol. 2013, 170, 923–933. [Google Scholar] [CrossRef] [PubMed]
  62. Liu, D.; Chen, X.; Liu, J.; Ye, J.; Guo, Z. The rice ERF transcription factor OsERF922 negatively regulates resistance to Magnaporthe oryzae and salt tolerance. J. Exp. Bot. 2012, 63, 3899–3911. [Google Scholar] [CrossRef] [PubMed]
  63. Zhu, X.; Qi, L.; Liu, X.; Cai, S.; Xu, H.; Huang, R.; Li, J.; Wei, X.; Zhang, Z. The wheat ethylene response factor transcription factor pathogen induced ERF1 mediates host responses to both the necrotrophic pathogen Rhizoctonia cerealis and freezing stresses. Plant Physiol. 2014, 164, 1499–1514. [Google Scholar] [CrossRef] [PubMed]
  64. Chen, X.; Guo, Z. Tobacco OPBP1 enhances salt tolerance and disease resistance of transgenic rice. Int. J. Mol. Sci. 2008, 9, 2601–2613. [Google Scholar] [CrossRef] [PubMed]
  65. De Wit, P.J. How plants recognize pathogens and defend themselves. Cell. Mol. Life Sci. 2007, 64, 2726–2732. [Google Scholar] [CrossRef] [PubMed]
  66. Li, H.Y.; Xiao, S.; Chye, M.L. Ethylene- and pathogen-inducible Arabidopsis acyl-CoA-binding protein 4 interacts with an ethylene-responsive element binding protein. J. Exp. Bot. 2008, 59, 3997–4006. [Google Scholar] [CrossRef] [PubMed]
  67. Zhang, W.; Chen, J.; Zhang, H.; Song, F. Overexpression of a rice diacylglycerol kinase gene OsBIDK1 enhances disease resistance in transgenic tobacco. Mol. Cell 2008, 26, 258–264. [Google Scholar]
Figure 1. Phylogenetic analysis of APETALA2/ethylene-responsive element binding factor (AP2/ERF) superfamily proteins between Vernicia fordii and Vernicia montana. An unrooted maximum-likelihood (ML) phylogenetic tree was constructed using MEGA5. Bootstrap value >50% was shown in phylogenetic tree. AP2/ERF proteins were classified into different families and groups.
Genes 07 00109 g001
Figure 2. Phylogenetic relationships (left) and distribution of conserved motifs (right) among the V. fordii and V. montana ERF proteins from groups I (A); II (B); III (C); IV (D); V (E); VI (F); VI-L (G); VII (H); VIII (I); IX (J); and X (K). The phylogenetic tree was generated using MEGA5. The motifs (1–25) were identified by MEME, and different motifs are indicated by different colors.
Genes 07 00109 g002
Figure 3. Expression profiles of dehydration-responsive element-binding (DREB) subfamily genes in response to Fusarium oxysporum in Vernicia, namely (a) VmDREB subfamily; and (b) VfDREB subfamily. The heat map depicts expression patterns of DREB subfamily genes in V. fordii and V. montana in response to F. oxysporum at four infection stages: 0, uninfected stage; 1, early stage of infection; 2, middle stage of infection; 3, late stage of infection. Color scores were normalized by log2-transformed fold-change values in the treated sample when compared with control sample. The data were generated by averaging the fold change from each of the three biological replicates’ reads per kilobase per million mapped reads (RPKM) values. The color scale is shown at the top. Red represents upregulation and green represents downregulation.
Genes 07 00109 g003
Figure 4. Expression profiles of ERF subfamily genes in response to F. oxysporum in Vernicia, namely (a) VmERF subfamily; and (b) VfERF subfamily. The heat map depicts expression patterns of ERF subfamily genes in V. fordii and V. montana in response to F. oxysporum at four infection stages: 0, uninfected stage; 1, early stage of infection; 2, middle stage of infection; 3, late stage of infection. The heat map was generated based on the transformed counts of log2-transformed fold change values in the infected sample compared with the control. The color scale is shown at the top. Red represents upregulation and green represents downregulation.
Genes 07 00109 g004
Figure 5. Expression patterns validation of 22 selected AP2/ERF genes in root tissue of Vernicia during the four infection stages. The y-axis represents relative expression level. Primary y-axis represents averaged RPKM values from three biological experiments; secondary y-axis represents the expression levels calculated from qRT-PCR analysis. Each sample was analyzed by real-time PCR in triplicate. The numbers in the x-axis represent the four stages of infection, as follows: 0, uninfected stage; 1, early stage of infection; 2, middle stage of infection; 3, late stage of infection.
Genes 07 00109 g005
Figure 6. Tissue specific expression analyses of 26 Vf/VmAP2/ERF genes in Vernicia. Root (R), stem (S), leaf (L), kernel (K), stamen (St), petal (P) and bud (B) tissues were used for the expression analysis. The y-axis represents relative expression level. Primary y-axis indicates transcript levels of VmAP2/ERFs; secondary y-axis indicates transcript levels of VfAP2/ERFs. Expression level was analyzed using qRT-PCR in triplicate.
Genes 07 00109 g006
Figure 7. Network analysis of VmAP2/ERF036 gene in response to F. oxysporum. The network involves 279 genes exhibiting 550 interactions. The yellow node named ethylene-responsive element binding protein (EREBP) represents the hub gene VmAP2/ERF036. Green nodes represent the interactive genes with the hub gene. Red diamond nodes represent different clusters corresponding to the putative function of the genes based on clusters of orthologous groups (COG) annotation.
Genes 07 00109 g007
Figure 8. (left) Expression trend in response to F. oxysporum. The numbers in the x-axis represent the four stages of infection, as follows: 0, uninfected stage; 1, early stage of infection; 2, middle stage of infection; 3, late stage of infection. (right) Tissue specific expression pattern analysis of VfAP2/ERF036/VmAP2/ERF036 in root (R), stem (S), leaf (L), kernel (K), stamen (St), petal (P) and bud (B) tissues. The y-axis represents relative expression level. Expression level was analyzed using qRT-PCR in triplicate.
Genes 07 00109 g008
Table 1. Summary of the classification and number of genes in the APETALA2/ethylene-responsive element binding factor (AP2/ERF) superfamily in Vernicia montana, Vernicia fordii, Arabidopsis thaliana and physic nut.
FamilySubfamilyGroupVerniciaArabidopsis thalianaJatropha curcas
V. montanaV. fordii
AP2 Total14121816
ERF Total646012298
DREBTotal25245735
I56105
II56158
III13102316
IV2296
ERFTotal39366563
V46512
VI4284
VII3353
VIII651512
IX15121721
X5588
VI-L2343
Xb-L0030
RAV 2264
Soloist 1111
Total 8175147119
The number of genes in the AP2/ERF family from A. thaliana and physic nut was reported by Nakano et al. [5] and Tang et al. [25]. DREB: dehydration-responsive element-binding; RAV: related to abscisic acid insensitive 3 (ABI3)/ VP1.
Table 2. Role of ERFs in response to fungal pathogens encountered by plants.
Candidate GeneGroupRegulationSource PlantFungal PathogenReferences
ERF1IXactivatorA. thalianaF. oxysporum[29]
AtERF2IXactivatorA. thalianaF. oxysporum[1]
AtERF4VIIIrepressorA. thalianaF. oxysporum[1]
AtERF14IXactivatorA. thalianaF. oxysporum[31]
ERF5IXactivatorA. thalianaBotrytis cinerea[32]
ERF6IXactivatorA. thalianaB. cinerea[2,32]
ERF9VIIIrepressorA. thalianaB. cinerea[60]
AtERF15IXactivatorA. thalianaB. cinerea[34]
ORA59IXactivatorA. thalianaB. cinerea[35]
VpERF3IXactivatorVitis pseudoreticulataPhytophtora parasitica[61]
OsERF922IXrepressorOryza sativaMagnaporthe oryzae[62]
TaPIE1IXactivatorTriticum aestivumRhizoctonia cerealis[63]
GmERF3IVactivatorGlycine maxAlternaria alternate[18]
OPBP1IXactivatorNicotiana tabacumRhizoctonia solani[64]

