
Characterization of the Transcriptome and Gene Expression of Brain Tissue in Sevenband Grouper (Hyporthodus septemfasciatus) in Response to NNV Infection

Abstract
:1. Introduction
2. Materials and Methods
2.1. Ethics Statment
2.2. Experimental Fish and Virus
2.3. Virus Challenge
2.4. Next Generation Sequencing of Transcriptome
2.5. Transcriptome Assembly and Functional Annotation
2.6. Differentially Expressed Genes Analysis
2.7. GO Enrichment of Differentially Expressed Genes
2.8. Data Deposition
3. Results
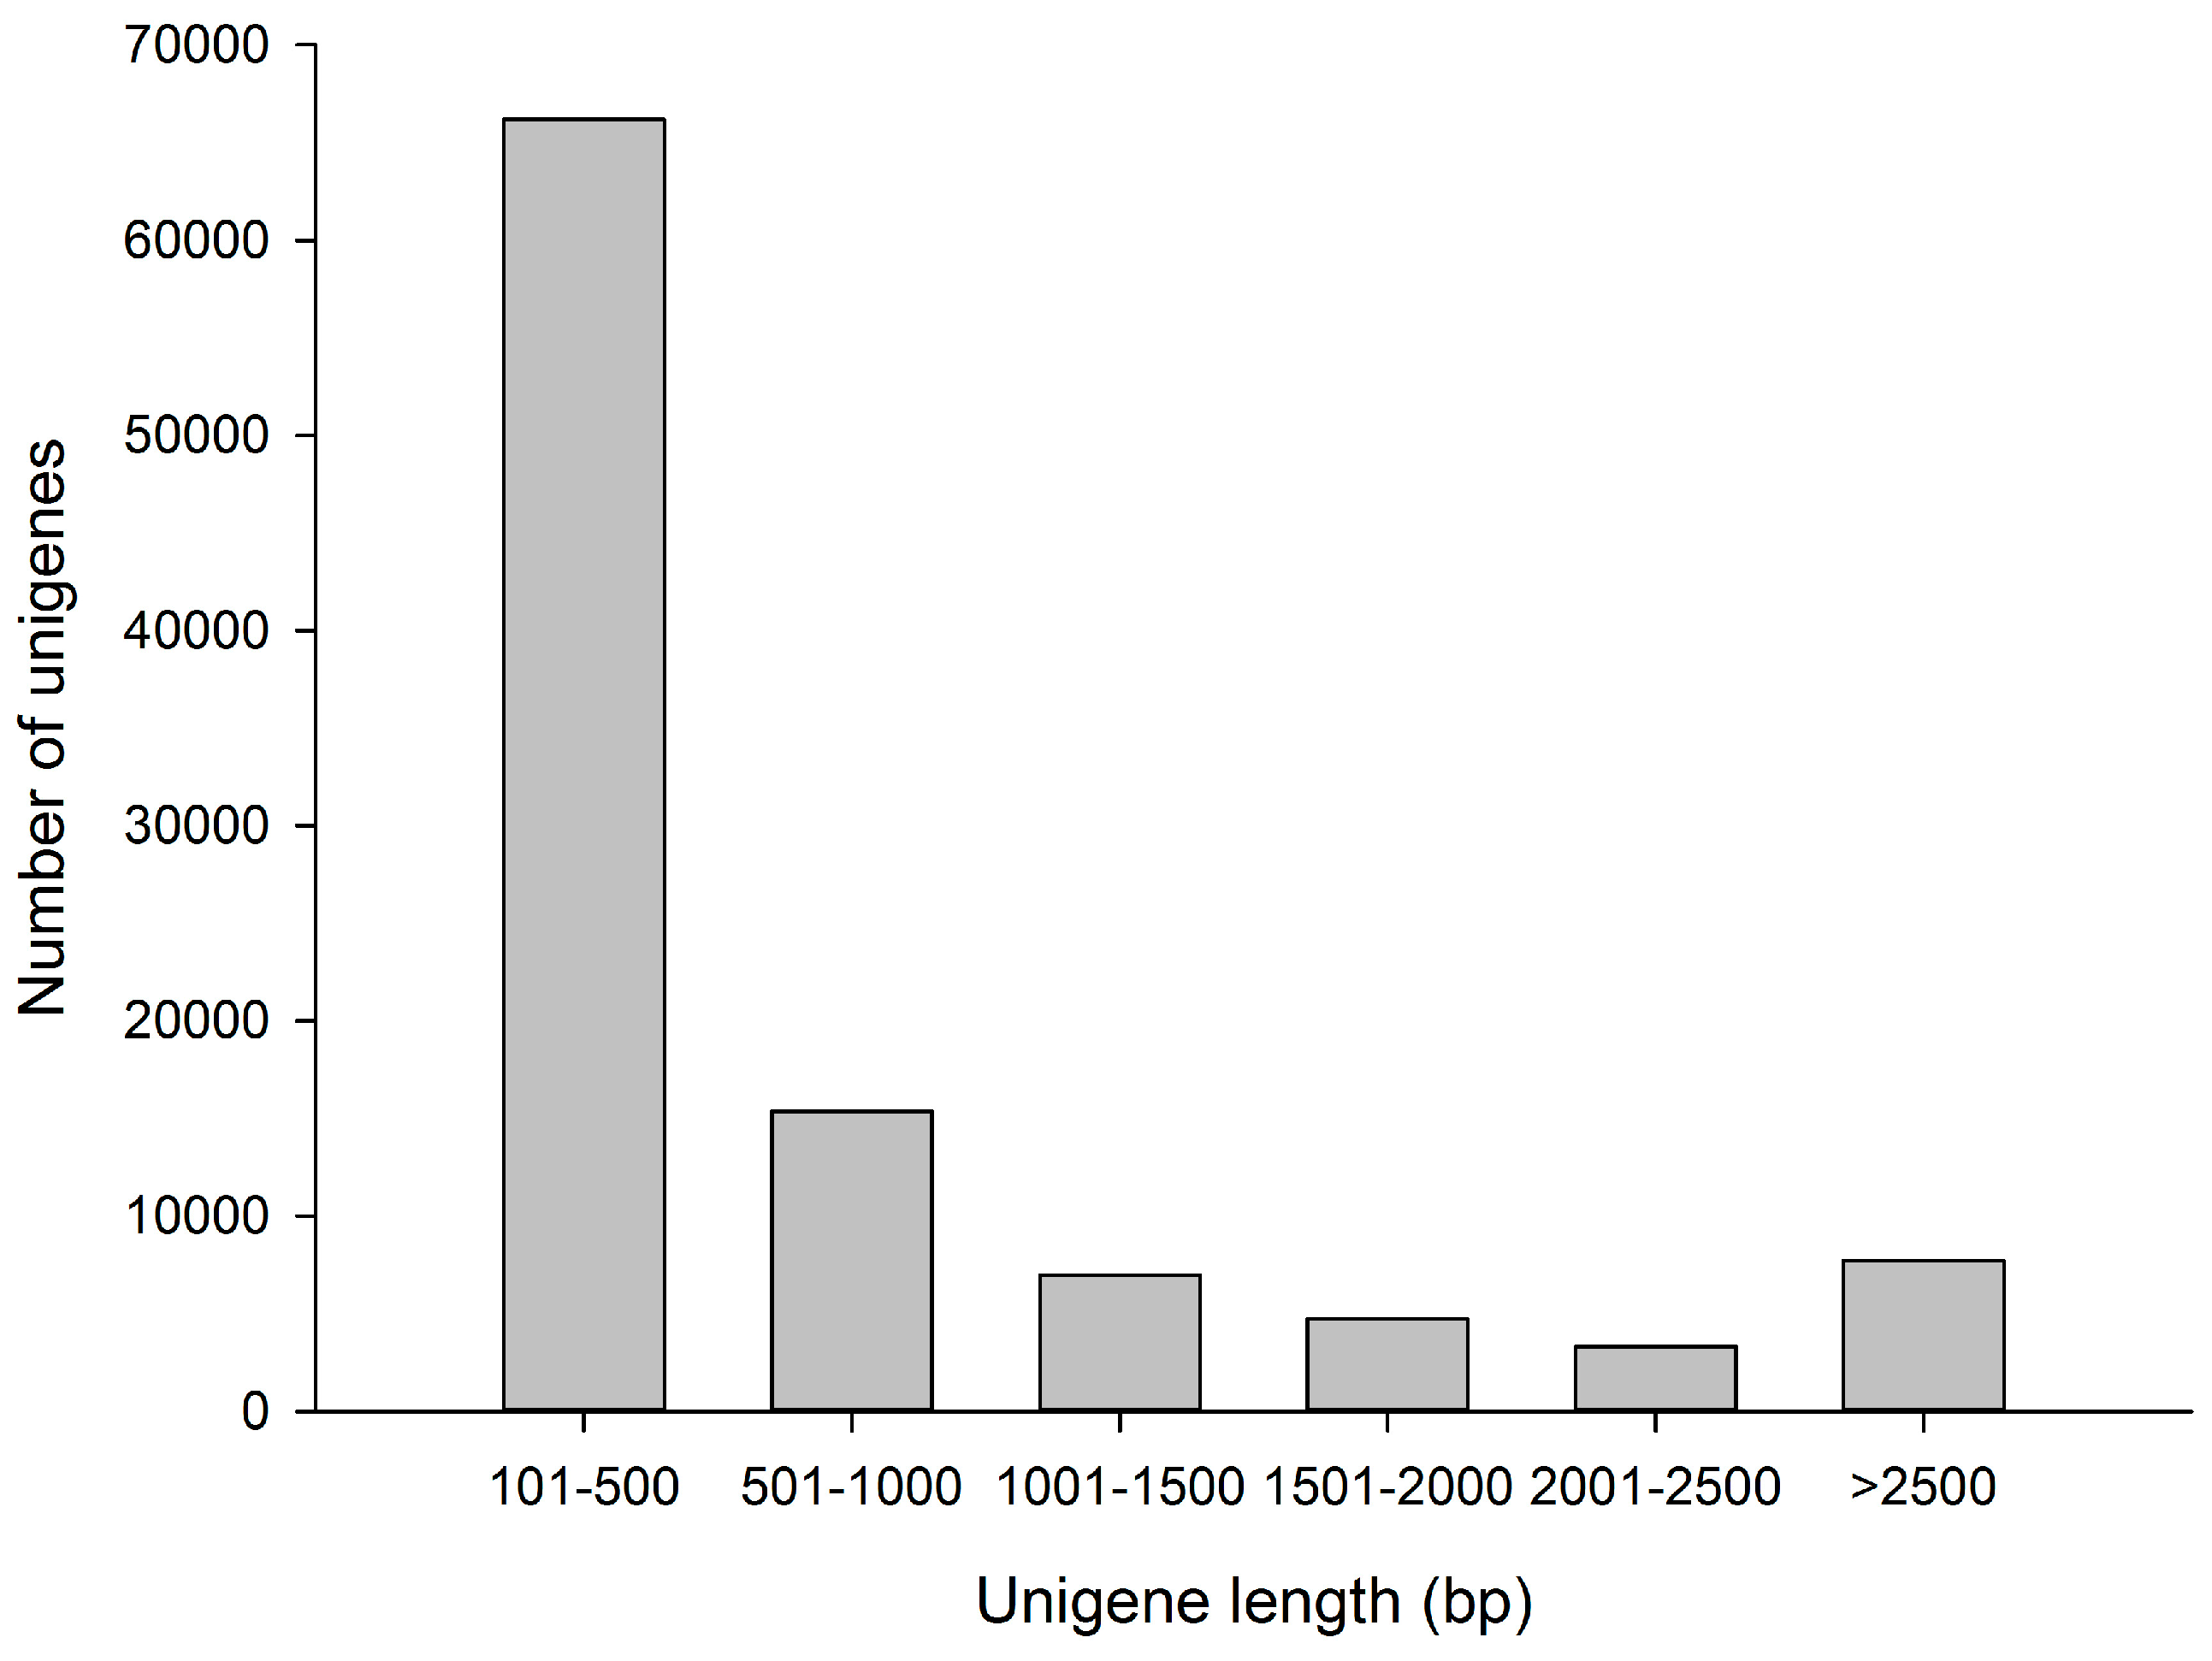
3.1. Sequence Analysis of the Transcriptome
3.2. The Most Abundantly Expressed Gene in the Transcriptome Profile
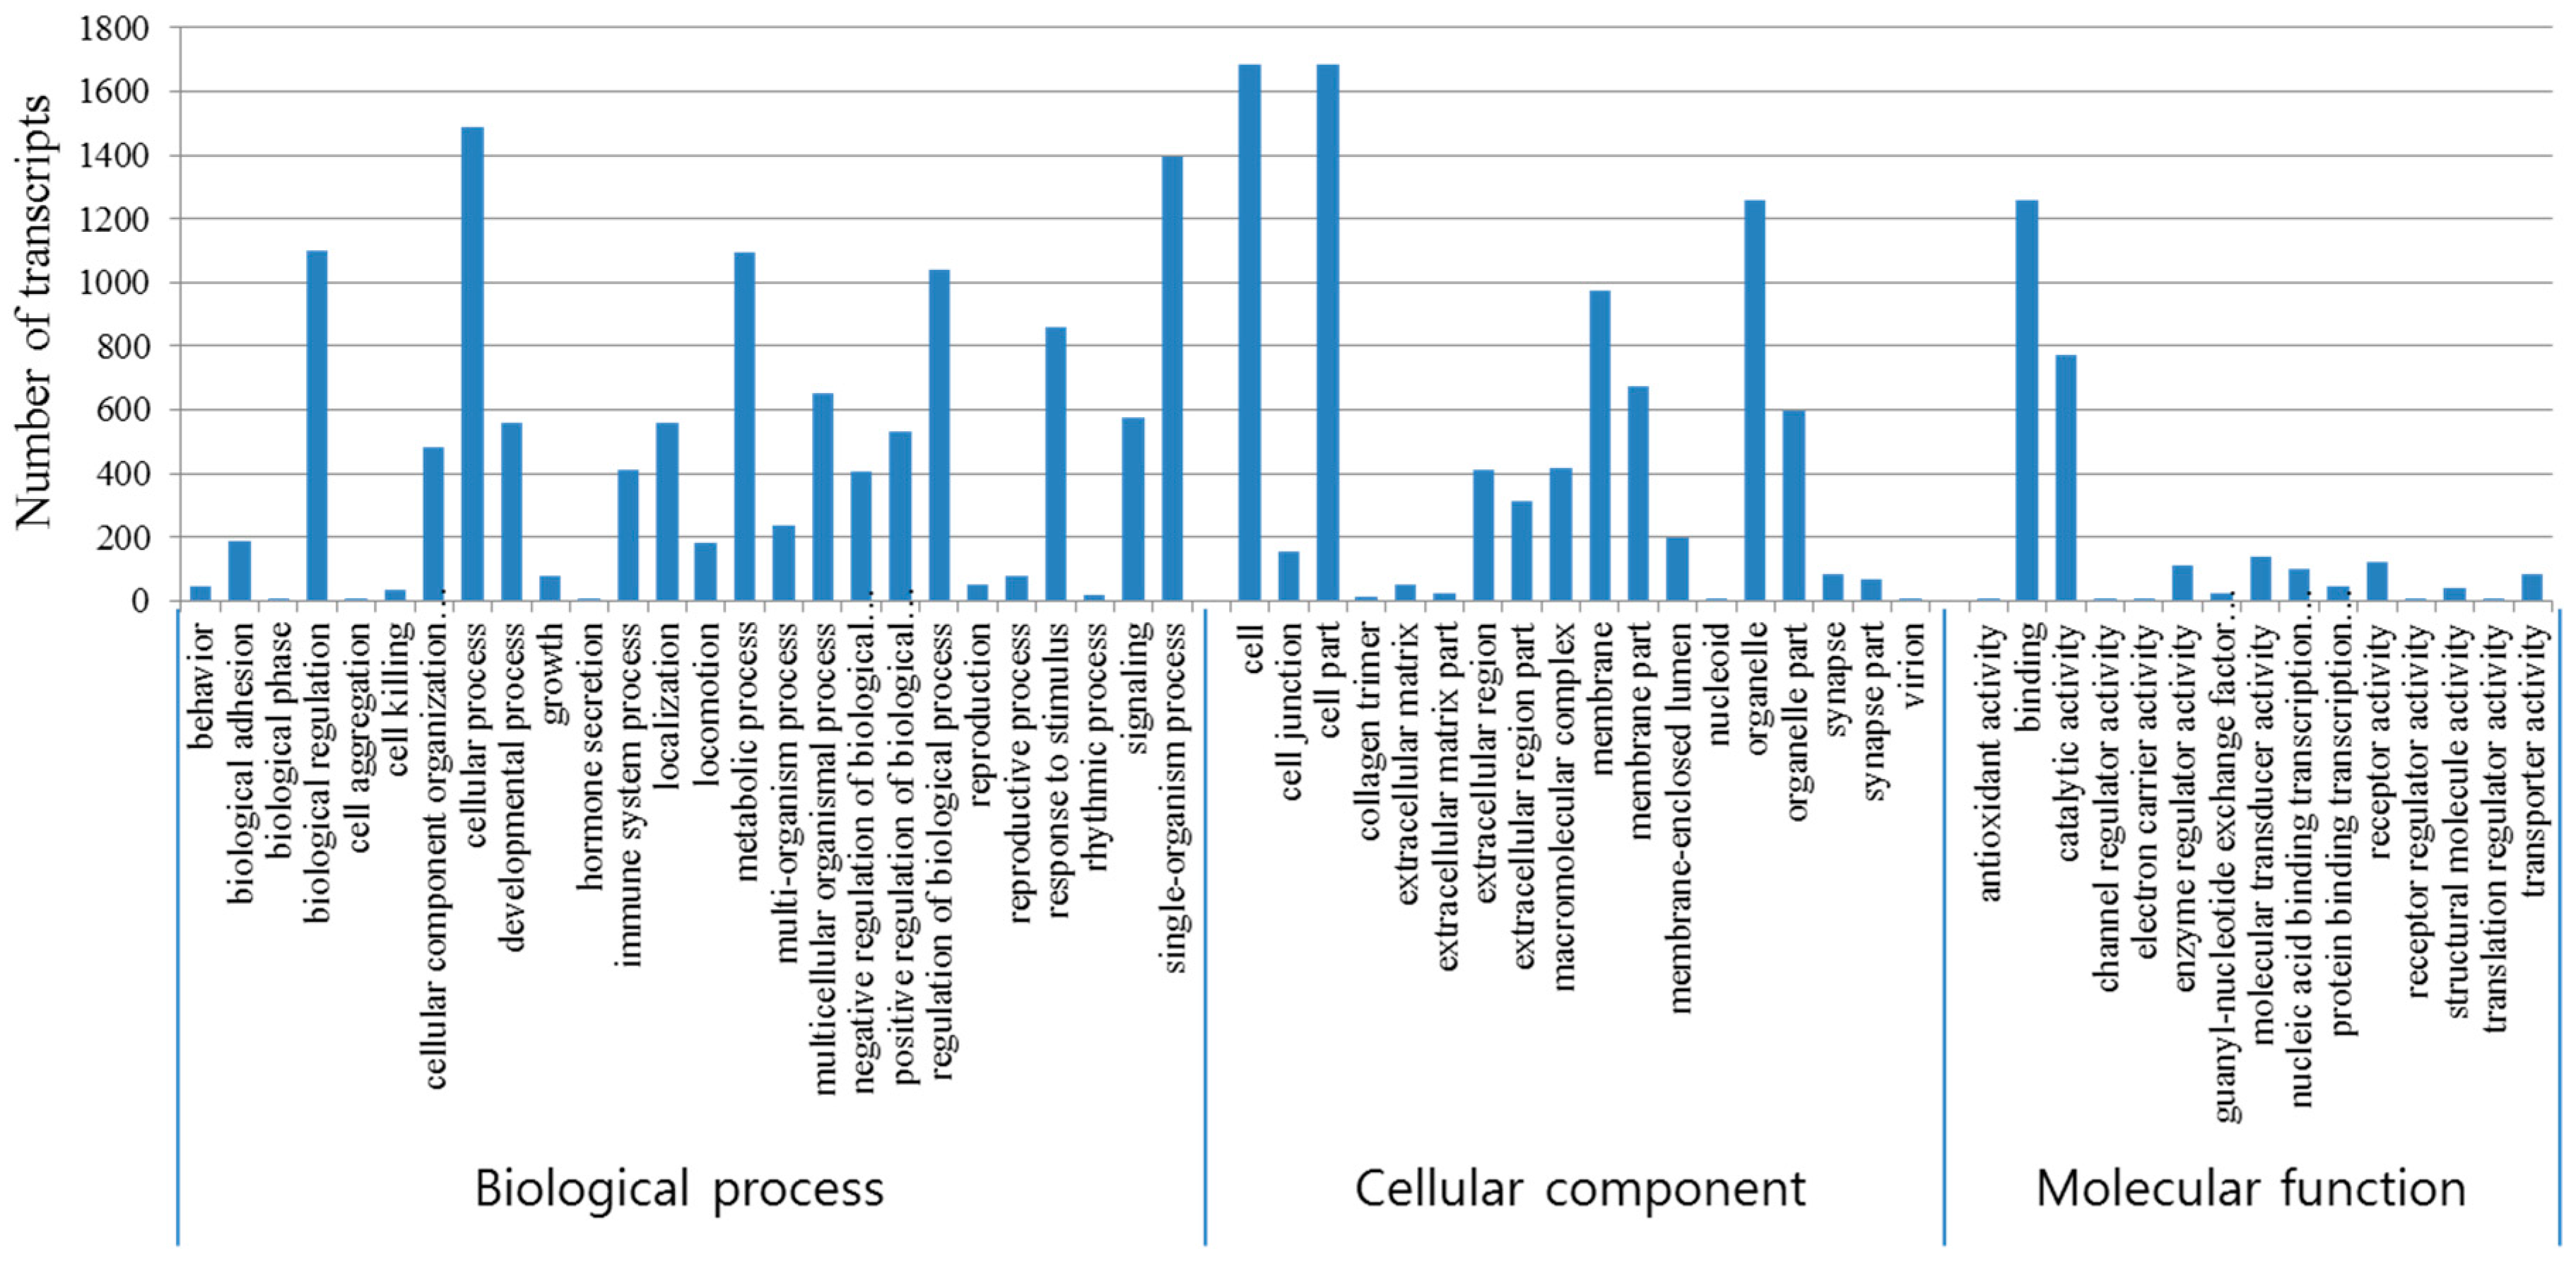
3.3. Functional Annotations
3.4. Immune Relevant DEGs Involved in NNV Infection
3.5. GO Enrichment of Differentially Expressed Genes
4. Discussion
5. Conclusions
Supplementary Materials
Acknowledgments
Author Contributions
Conflicts of Interest
References
- Kim, C.S.; Kim, W.S.; Nishizawa, T.; Oh, M.J. Prevalence of viral nervous necrosis (VNN) in sevenband grouper, Epinephelus septemfasciatus farms. J. Fish Pathol. 2012, 25, 111–116. [Google Scholar] [CrossRef]
- Munday, B.L.; Kwang, J.; Moody, N. Betanodavirus infections of teleost fish: A review. J. Fish Dis. 2002, 25, 127–142. [Google Scholar] [CrossRef]
- Munday, B.L.; Nakai, T. Special topic review: Nodaviruses as pathogens in larval and juvenile marine finfish. World J. Microbiol. Biotechnol. 1997, 13, 375–381. [Google Scholar] [CrossRef]
- Muroga, K. Viral and bacterial diseases of marine fish and shellfish in Japanese hatcheries. Aquaculture 2001, 202, 23–44. [Google Scholar] [CrossRef]
- Cha, S.J.; Do, J.W.; Lee, N.S.; An, E.J.; Kim, Y.C.; Kim, J.W.; Park, J.W. Phylogenetic analysis of betanodaviruses isolated from cultured fish in Korea. Dis. Aquat. Org. 2007, 77, 181–189. [Google Scholar] [CrossRef] [PubMed]
- Oh, M.J.; Jung, S.J.; Kitamura, S.I. Comparison of the coat protein gene of nervous necrosis virus (NNV) detected from marine fishes in Korea. J. World Auqac. Soc. 2005, 36, 223–227. [Google Scholar] [CrossRef]
- Sohn, S.G.; Park, M.A.; Oh, M.J.; Chun, S.K. A fish nodavirus isolated from cultured sevenband grouper, Epinephelus septemfasciatus. J. Fish Pathol. 1998, 11, 97–104. [Google Scholar]
- Huang, Y.; Huang, X.; Yan, Y.; Cai, J.; Ouyang, Z.; Cui, H.; Wang, P.; Qin, Q. Transcriptome analysis of orange-spotted grouper (Epinephelus coioides) spleen in response to Singapore grouper iridovirus. BMC Genom. 2011, 12, 556. [Google Scholar] [CrossRef] [PubMed]
- Nishizawa, T.; Mori, K.; Furuhashi, M.; Nakai, T.; Furusawa, I.; Muroga, K. Comparison of the coat protein genes of five fish nodaviruses, the causative agents of viral nervous necrosis in marine fish. J. Gen. Virol. 1995, 76, 1563–1569. [Google Scholar] [CrossRef] [PubMed]
- Johansen, R.; Sommerset, I.; Torud, B.; Korsnes, K.; Hjortaas, M.J.; Nilsen, F.; Nerland, A.H.; Dannevig, B.H. Characterization of nodavirus and viral encephalophathy and retinopathy in farmed turbot, Scophthalumus maximus (L.). J. Fish Dis. 2004, 27, 591–601. [Google Scholar] [CrossRef] [PubMed]
- Jones, S.I.; Vodkin, L.O. Using RNA-Seq to profile soybean seed development from fertilization to maturity. PLoS ONE 2013, 8, e59270. [Google Scholar] [CrossRef] [PubMed]
- Tan, M.H.; Au, K.F.; Yablonovitch, A.L.; Wills, A.E.; Chuang, J.; Baker, J.C.; Wong, W.H.; Li, J.B. RNA sequencing reveals a diverse and dynamic repertoire of the Xenopus tropicalis transcriptome over development. Genome Res. 2013, 23, 201–216. [Google Scholar] [CrossRef] [PubMed]
- Zhang, H.; Fei, C.; Wu, H.; Yang, M.; Liu, Q.; Wang, Q.; Zhang, Y. Transcriptome profiling reveals Th17-like immune responses induced in zebrafish bath-vaccinated with a live attenuated Vibrio anguillarum. PLoS ONE 2013, 8, e73871. [Google Scholar] [CrossRef] [PubMed]
- Iwamoto, T.; Mise, K.; Takeda, A.; Okinaka, Y.; Mori, K.I.; Arimoto, M.; Okuno, T.; Nakai, T. Characterization of Striped jack nervous necrosis virus subgenomic RNA3 and biological activities of its encoded protein B2. J. Gen. Virol. 2005, 86, 2807–2816. [Google Scholar] [CrossRef] [PubMed]
- Mu, Y.; Li, M.; Ding, F.; Ding, Y.; Ao, J.; Hu, S.; Chen, X. De novo characterization of the spleen transcriptome of the large yellow croaker (Pseudosciaena crocea) and analysis of the immune relevant genes and pathways involved in the antiviral response. PLoS ONE 2014, 9, e97471. [Google Scholar] [CrossRef] [PubMed]
- Pereiro, P.; Balseiro, P.; Romero, A.; Dios, S.; Forn-Cuni, G.; Fuste, B.; Planas, J.V.; Beltran, S.; Nova, B.; Figueras, A. High- throughput sequence analysis of turbot (Scophthalmus maximus) transcriptome using 454-pyrosequencing for the discovery of antiviral immune genes. PLoS ONE 2012, 7, e35369. [Google Scholar] [CrossRef] [PubMed] [Green Version]
- Xiang, L.X.; He, D.; Dong, W.R.; Zhang, Y.W.; Shao, J.Z. Deep sequencing- based transcriptome profiling analysis of bacteria-challenged Lateolabrax japonicus reveals insight into the immune-relevant genes in marine fish. BMC Genom. 2010, 11, 472. [Google Scholar] [CrossRef] [PubMed]
- Li, G.; Zhao, Y.; Liu, Z.; Gao, C.; Yan, F.; Liu, B.; Feng, J. De novo assembly and characterization of the spleen transcriptome of common carp (Cyprinus carpio) using Illumina paired-end sequencing. Fish Shellfish Immunol. 2015, 44, 420–429. [Google Scholar] [CrossRef] [PubMed]
- Kim, J.O.; Kim, J.O.; Kim, W.S.; Oh, M.J. Development and application of quantitative detection method for nervous necrosis virus (NNV) isolated from sevenband grouper Hyporthodus septemfasciatus. Asian Pac. J. Trop. Med. 2016, 9, 742–748. [Google Scholar] [CrossRef] [PubMed]
- Reed, L.J.; Muench, H. A simple method of estimating fifty percent end points. Am. J. Hyg. 1938, 27, 493–497. [Google Scholar]
- Andrews, S. FastQC a Quality Control Tool for High Throughput Sequence Data [Online]. 2010. Available online: http://www.bioinformatics.babraham.ac.uk/projects/fastqc/ (accessed on 3 March 2016).
- Martin, J.A.; Wang, Z. Next-generation transcriptome assembly. Nat. Rev. Genet. 2011, 12, 671–682. [Google Scholar] [CrossRef] [PubMed]
- Hass, B.J.; Papanicolaou, A.; Yassour, M.; Grabherr, M.; Blood, P.D.; Bowden, J.; Couger, M.B.; Eccles, D.; Li, B.; Lieber, M.; et al. De novo transcript sequence reconstruction from RNA-seq using the Trinity platform for reference generation and analysis. Nat. Protoc. 2013, 8, 1494–1512. [Google Scholar] [CrossRef] [PubMed]
- Fu, L.; Niu, B.; Zhu, Z.; Wu, S.; Li, W. CD-HIT: Accelerated for clustering the next-generation sequencing data. Bioinformatics 2012, 28, 3150–3152. [Google Scholar] [CrossRef] [PubMed]
- Li, B.; Dewey, C.N. RSEM: Accurate transcript quantification from RNA-Seq data with or without a reference genome. BMC Bioinform. 2011, 4, 323. [Google Scholar] [CrossRef] [PubMed]
- Sun, J.; Nishiyama, T.; Shimizu, K.; Kadota, K. TCC: An R package for comparing tag count data with robust normalization strategies. BMC Bioinform. 2013, 14, 219. [Google Scholar] [CrossRef] [PubMed]
- Kadota, K.; Nishiyama, T.; Shimizu, K. A normalization strategy for comparing tag count data. Algorithms Mol. Biol. 2012, 7, 5. [Google Scholar] [CrossRef] [PubMed]
- Gerard, C.; Rollins, B.J. Chemokines and disease. Nat. Immunol. 2001, 2, 108–115. [Google Scholar] [CrossRef] [PubMed]
- Choi, K.M.; Shim, S.H.; An, C.M.; Nam, B.H.; Kim, Y.O.; Kim, J.W.; Park, C.I. Cloning, characterisation, and expression analysis of the cathepsin D gene from rock bream (Oplegnathus fasciatus). Fish Shellfish Immunol. 2014, 40, 253–258. [Google Scholar] [CrossRef] [PubMed]
- Smith, S.; Bernatchez, L.; Beheregaray, L.B. RNA-seq analysis reveals extensive transcriptional plasticity to temperature stress in a freshwater fish species. BMC Genom. 2013, 14, 375. [Google Scholar] [CrossRef] [PubMed]
- Tran, N.T.; Gao, Z.X.; Zhao, H.H.; Yi, S.K.; Chen, B.X.; Zhao, Y.H.; Lin, L.; Liu, X.Q.; Wang, W.M. Transcriptome analysis and microsatellite discovery in the blunt snout bream (Megalobrama amblycephala) after challenge with Aeromonas hydrophila. Fish Shellfish Immunol. 2015, 45, 72–82. [Google Scholar] [CrossRef] [PubMed]
- Wang, Y.D.; Huang, S.J.; Chou, H.N.; Liao, W.L.; Gong, H.Y.; Chen, J.Y. Transcriptome analysis of the effect of Vibrio alginolyticus infection on the innate immunity-related complement pathway in Epinephelus coioides. BMC Genom. 2014, 15, 1102. [Google Scholar] [CrossRef] [PubMed]
- Liu, P.; Wang, L.; Kwang, J.; Yue, G.H.; Wong, S.M. Transcriptome analysis of genes responding to NNV infection in Asian seabass epithelial cells. Fish Shellfish Immunol. 2016, 54, 342–352. [Google Scholar] [CrossRef] [PubMed]
- Koyama, S.; Ishii, K.J.; Coban, C.; Akira, S. Innate immune response to viral infection. Cytokine 2008, 43, 336–341. [Google Scholar] [CrossRef] [PubMed]
- Takeuchi, O.; Akira, S. Innate immunity to virus infection. Immunol. Rev. 2009, 227, 75–86. [Google Scholar] [CrossRef] [PubMed]
- Thompson, M.R.; Kaminski, J.J.; Kurt-Jones, E.A.; Fitzgerald, K.A. Pattern Recognition Receptors and the Innate Immune Response to Viral Infection. Viruses 2011, 3, 920–940. [Google Scholar] [CrossRef] [PubMed]
- Abdul, W.A.; Heiken, H.; Meyer-Olson, D.; Schmidt, R.E. CCL2: A potential prognostic marker and target of anti-inflammatory strategy in HIV/AIDS pathogenesis. Eur. J. Immunol. 2011, 41, 3412–3418. [Google Scholar]
- Rollins, B.J. Chemokines. Blood 1997, 90, 909–928. [Google Scholar] [PubMed]
- Weiss, J.M.; Nath, A.; Major, E.O.; Berman, J.W. HIV-1 Tat induces monocyte chemoattractant protein-1-mediated monocyte transmigration across a model of the human blood-brain barrier and up-regulates CCR5 expression on human monocytes. J. Immunol. 1999, 163, 2953–2959. [Google Scholar] [PubMed]
- Fisher, N.C.; Neil, D.A.; Williams, A.; Adams, D.H. Serum concentrations and peripheral secretion of the beta chemokines monocyte chemoattractant protein 1 and macrophage inflammatory protein 1α in alcoholic liver disease. Gut 1999, 45, 416–420. [Google Scholar] [CrossRef] [PubMed]
- Gaudreault, E.; Fiola, S.; Olivier, M.; Gosselin, J. Epstein-Barr virus induces MCP-1 secretion by human monocytes via TLR2. J. Virol. 2007, 81, 8016–8024. [Google Scholar] [CrossRef] [PubMed]
- Culley, F.J.; Pennycook, A.M.; Tregoning, J.S.; Hussell, T.; Openshaw, P.J. Differential chemokine expression following respiratory virus infection reflects Th1- or Th2-biased immunopathology. J. Virol. 2006, 80, 4521–4527. [Google Scholar] [CrossRef] [PubMed]
- Yen, Y.T.; Liao, F.; Hsiao, C.H.; Kao, C.L.; Chen, Y.C.; Wu-Hsieh, B.A. Modeling the early events of severe acute respiratory syndrome coronavirus infection in vitro. J. Virol. 2006, 80, 2684–2693. [Google Scholar] [CrossRef] [PubMed]
- Kurt-Jones, E.A.; Chan, M.; Zhou, S.; Wang, J.; Reed, G.; Bronson, R.; Arnold, M.; Knipe, D.M.; Finberg, R.W. Herpes simplex virus 1 interaction with Toll-like receptor 2 contributes to lethal encephalitis. Proc. Natl. Acad. Sci. USA 2004, 101, 1315–1320. [Google Scholar] [CrossRef] [PubMed]
- Mishra, M.K.; Kumawat, K.L.; Basu, A. Japanese encephalitis virus differentially modulates the induction of multiple pro-inflammatory mediators in human astrocytoma and astroglioma cell-lines. Cell Biol. Int. 2008, 32, 1506–1513. [Google Scholar] [CrossRef] [PubMed]
- Dixit, A.K.; Dixit, P.; Sharma, R.L. Sharma Immunodiagnostic/protective role of Cathepsin L cysteine proteinases secreted by Fasciolaspecies. Vet. Parasitol. 2008, 154, 177–184. [Google Scholar] [CrossRef] [PubMed]
- Hsing, L.C.; Rudensky, A.Y. The lysosomal cysteine proteases in MHC class II antigen presentation. Immunol. Rev. 2005, 207, 229–241. [Google Scholar] [CrossRef] [PubMed]
- Yasothornsrikul, S.; Greenbaum, D.; Medzihradszky, K.F.; Toneff, T.; Bundey, R.; Miller, R.; Schilling, B.; Petermann, I.; Dehnert, J.; Logvinova, A.; et al. Cathepsin L in secretory vesicles functions as a prohormone-processing enzyme for production of the enkephalin peptide neurotransmitter. Proc. Natl. Acad. Sci. USA 2003, 100, 9590–9595. [Google Scholar] [CrossRef] [PubMed]
- Chandran, K.; Sullivan, N.J.; Felbor, U.; Whelan, S.P.; Cunningham, J.M. Endosomal proteolysis of the Ebola virus glycoprotein is necessary for infection. Science 2005, 308, 1643–1645. [Google Scholar] [CrossRef] [PubMed]
- Ebert, D.H.; Deussing, J.; Peters, C.; Dermody, T.S. Cathepsin L and cathepsin B mediate reovirus disassembly in murine fibroblast cells. J. Biol. Chem. 2002, 277, 24609–24617. [Google Scholar] [CrossRef] [PubMed]
- Simmons, G.; Gosalia, D.N.; Rennekamp, A.J.; Reeves, J.D.; Diamond, S.L.; Bates, P. Inhibitors of cathepsin L prevent severe acute respiratory syndrome coronavirus entry. Proc. Natl. Acad. Sci. USA 2005, 102, 11876–11881. [Google Scholar] [CrossRef] [PubMed]
- Pager, C.T.; Dutch, R.E. Cathepsin L is involved in proteolytic processing of the Hendra virus fusion protein. J. Virol. 2005, 79, 12714–12720. [Google Scholar] [CrossRef] [PubMed]
- Bartenschlager, R.; Sparacio, S. Hepatitis C virus molecular clones and their replication capacity in vivo and in cell culture. Virus Res. 2007, 127, 195–207. [Google Scholar] [CrossRef] [PubMed]
- Zhou, Z.J.; Sun, L. CsCTL1, a teleost C-type lectin that promotes antibacterial and antiviral immune defense in a manner that depends on the conserved EPN motif. Dev. Comp. Immunol. 2015, 50, 69–77. [Google Scholar] [CrossRef] [PubMed]
- Power, D.; Santoso, N.; Dieringer, M.; Yu, J.; Huang, H.; Simpson, S.; Seth, I.; Miao, H.; Zhu, J. IFI44 suppresses HIV-1 LTR promoter activity and facilitates its latency. Virology 2015, 481, 142–150. [Google Scholar] [CrossRef] [PubMed]
- Carlton-Smith, C.; Elliott, R.M. Viperin, MTAP44, and protein kinase R contribute to the interferon-induced inhibition of Bunyamwera Orthobunyavirus replication. J. Virol. 2012, 86, 11548–11557. [Google Scholar] [CrossRef] [PubMed]
- Hartl, F.U. Molecular chaperones in cellular protein folding. Nature 1996, 381, 571–579. [Google Scholar] [CrossRef] [PubMed]
- Kim, M.Y.; Oglesbee, M. Virus-heat shock protein interaction and a novel axis for innate antiviral immunity. Cells 2012, 1, 646–666. [Google Scholar] [CrossRef] [PubMed]
- Krasnov, A.; Kileng, O.; Skugor, S.; Jorgensena, S.M.; Afanasyev, S.; Timmerhaus, G.; Sommer, A.I.; Jensen, I. Genomic analysis of the host response to nervous necrosis virus in Atlantic cod (Gadus morhua) brain. Mol. Immunol. 2013, 54, 443–452. [Google Scholar] [CrossRef] [PubMed]

| A. Sequencing and Preprocessing | ||
| Sample Type | Not Infected (Mock) | NNV Infected |
| Number of raw reads | 45,101,102 | 34,715,846 |
| Total number of raw bases | 5,682,738,852 | 4,374,196,596 |
| Number of clean reads | 39,932,160 (88.5%) | 31,353,144 (90.3%) |
| Total number of clean bases | 5,006,434,933 (88.1%) | 3,932,946,324 (89.9%) |
| B. De novo Assembly and Annotation | ||
| Number of unigenes | 104,348 | |
| Total bases | 88,123,224 | |
| Average length of unigenes | 845 bases | |
| Annotation by BLAST | 43,280 (41.5%) | |
| No | Mock | Infected | ||||
|---|---|---|---|---|---|---|
| ID | Name | Description | ID | Name | Description | |
| 1 | SGU067144 | - | Hypothetical protein | SGU020577 | UBL4a | Ubiquitin-like protein 4a |
| 2 | SGU067145 | - | Hypothetical protein | SGU005369 | - | Hyphothetical protein |
| 3 | SGU004764 | EPD1 | Ependymin-1 | SGU067144 | - | Hyphothetical protein |
| 4 | SGU023233 | MT-CO1 | Cytochrome c oxidase subunit 1 | SGU067145 | - | Hyphothetical protein |
| 5 | SGU005369 | - | Hypothetical protein | SGU051992 | RPS15a | 40S ribosomal protein S15a |
| 6 | SGU023234 | MT-ND5 | NADH dehydrogenase subunit 5 | SGU028675 | RPL38 | 60S ribosomal protein L38 |
| 7 | SGU051992 | RPS15a | 40S ribosomal protein S15a | SGU004764 | EPD1 | Ependymin-1 |
| 8 | SGU028388 | CD59 | CD59 glycoprotein | SGU035083 | RPL39 | 60S ribosomal protein L39 |
| 9 | SGU025576 | HBA | Hemoglobin subunit alpha | SGU023233 | MT-CO1 | Cytochrome c oxidase subunit 1 |
| 10 | SGU035083 | RPL39 | 60S ribosomal protein L39 | SGU036307 | CCL2 | C-C motif chemokine 2 |
| 11 | SGU021087 | UBIQP_XENLA | Polyubiquitin | SGU053409 | LYG_EPICO | Lysozyme g |
| 12 | SGU002473 | RPS28 | 40S ribosomal protein S28 | SGU002473 | RPS28 | 40S ribosomal protein S28 |
| 13 | SGU002418 | FABP7 | Fatty acid-binding protein, brain | SGU021087 | UBIQP_XENLA | Polyubiquitin |
| 14 | SGU028675 | RPL38 | 60S ribosomal protein L38 | SGU037323 | RPL29 | 60S ribosomal protein L29 |
| 15 | SGU040127 | RPS14 | 40S ribosomal protein S14 | SGU003425 | RPS27a | 40S ribosomal protein S27a |
| 16 | SGU028033 | RPLP2 | 60S acidic ribosomal protein P2 | SGU016297 | - | - |
| 17 | SGU026642 | HBB2 | Hemoglobin subunit beta-2 | SGU005492 | UBA52 | Ubiquitin-60S ribosomal protein L40 |
| 18 | SGU003425 | RPS27a | 40S ribosomal protein S27a | SGU034075 | RPL21 | 60S ribosomal protein L21 |
| 19 | SGU034075 | RPL21 | 60S ribosomal protein L21 | SGU040127 | RPS14 | 40S ribosomal protein S14 |
| 20 | SGU003965 | RPL32 | 60S ribosomal protein L32 | SGU008676 | - | - |
| Name | Description | Expression Level (FPKM) | Log FC | p-Value | FDR | |
|---|---|---|---|---|---|---|
| Mock | Infected | |||||
| Cytokine | ||||||
| CCL2 | C-C Motif Chemokine 2 | 51.7 | 83,844.2 | 10.66 | 2.3 × 10⁻⁶. | 6.0 × 10⁻³ |
| IL12B | Interleukin-12 Subunit Beta | 12.5 | 14,158.0 | 10.15 | 5.6 × 10⁻⁶ | 7.1 × 10⁻³ |
| CCL34A.4 | Chemokine (C-C Motif) Ligand 34a, Duplicate 4 | 5.8 | 7038.8 | 10.24 | 6.2 × 10⁻⁶ | 7.4 × 10⁻³ |
| CXCL13 | C-X-C Motif Chemokine Ligand 13 | 10.0 | 7500.3 | 9.55 | 1.4 × 10⁻⁵ | 1.3 × 10⁻² |
| CCL19 | C-C Motif Chemokine 19 | 15.0 | 4523.8 | 8.24 | 8.2 × 10⁻⁵ | 3.0 × 10⁻² |
| CXCL6 | C-X-C Motif Chemokine Ligand 6 | 60.8 | 11,405.2 | 7.55 | 1.8 × 10⁻⁴ | 5.3 × 10⁻² |
| IL18R1 | Interleukin-18 Receptor 1 | 9.2 | 1814.2 | 7.63 | 2.3 × 10⁻⁴ | 6.0 × 10⁻² |
| CXCL8 | C-X-C Motif Chemokine Ligand 8 (Interleukin-8) | 6.7 | 1307.0 | 7.61 | 2.7 × 10⁻⁴ | 6.4 × 10⁻² |
| EBI3 | Interleukin-27 Subunit Beta | 9.2 | 1506.8 | 7.36 | 3.4 × 10⁻⁴ | 7.5 × 10⁻² |
| CXCL9 | C-X-C Motif Chemokine Ligand 9 | 12.5 | 1438.8 | 6.85 | 6.4 × 10⁻⁴ | 1.2 × 10⁻¹ |
| CCL4 | C-C Motif Chemokine 4 | 11.7 | 1328.8 | 6.83 | 6.7 × 10⁻⁴ | 1.2 × 10⁻¹ |
| IL1R2 | Interleukin-1 Receptor Type 2 | 6.7 | 458.6 | 6.10 | 2.7 × 10⁻³ | 2.9× 10⁻¹ |
| CXCR4 | C-X-C Chemokine Receptor Type 4 | 35.0 | 1016.3 | 4.86 | 8.4 × 10⁻³ | 6.1 × 10⁻¹ |
| CRLF1 | Cytokine Receptor-like Factor 1 | 9.2 | 326.3 | 5.15 | 9.1 × 10⁻³ | 6.5× 10⁻¹ |
| XCR1 | Chemokine Xc Receptor 1 | 0.8 | 97.5 | 6.88 | 1.0 × 10⁻² | 7.0 × 10⁻¹ |
| IL13RA1A | Il-13 Receptor-alpha-1-a Precursor | 117.5 | 2426.3 | 4.37 | 1.4 × 10⁻² | 8.6 × 10⁻¹ |
| CXCR3 | C-X-C Chemokine Receptor Type 3 | 56.7 | 1140.0 | 4.33 | 1.6 × 10⁻² | 9.3 × 10⁻¹ |
| IL12A | Interleukin-12 Subunit Alpha | 3.5 | 128.3 | 5.20 | 1.8 × 10⁻² | 9.9 × 10⁻¹ |
| Cathepsin | ||||||
| CTSL | Cathepsin L | 7.5 | 2370.0 | 8.30 | 9.2 × 10⁻⁵ | 3.2 × 10⁻² |
| CTSH | Cathepsin H | 418.3 | 9396.3 | 4.49 | 1.1 × 10⁻² | 7.5 × 10⁻¹ |
| CTSK | Cathepsin K | 170.0 | 8802.5 | 5.69 | 2.3 × 10⁻³ | 2.7 × 10⁻¹ |
| CTSO | Cathepsin O | 20.0 | 485.0 | 4.60 | 1.4 × 10⁻² | 8.6 × 10⁻¹ |
| CTSS | Cathepsin S | 388.3 | 20,089.4 | 5.69 | 2.2 × 10⁻³ | 2.7 × 10⁻¹ |
| CTSZ | Cathepsin Z | 604.2 | 10,606.8 | 4.13 | 1.8 × 10⁻² | 9.8 × 10⁻¹ |
| Cluster of differentiation | ||||||
| CD274 | Programmed Cell Death 1 Ligand 1 | 5.8 | 2255.0 | 8.60 | 6.7 × 10⁻⁵ | 2.8 × 10⁻² |
| CD4 | T-cell Surface Glycoprotein CD4 | 3.3 | 256.9 | 6.27 | 3.7 × 10⁻³ | 3.6 × 10⁻¹ |
| CD209A | CD209 Antigen-like Protein A | 3.3 | 251.6 | 6.24 | 3.9 × 10⁻³ | 3.8 × 10⁻¹ |
| CD48 | CD48 Antigen | 30.8 | 1969.6 | 6.00 | 1.7 × 10⁻³ | 2.3 × 10⁻¹ |
| CD209D | CD209 Antigen-like Protein D | 68.3 | 3346.3 | 5.61 | 2.7 × 10⁻³ | 3.0 × 10⁻¹ |
| TSPAN6 | Tetraspanin-6 | 9.7 | 387.8 | 5.32 | 7.2 × 10⁻³ | 5.6 × 10⁻¹ |
| Complement | ||||||
| C4A | Complement C4-a | 9.6 | 2062.4 | 7.74 | 2.0 × 10⁻⁴ | 5.6 × 10⁻² |
| C1QA | Complement C1q Subcomponent Subunit A | 74.2 | 5517.8 | 6.22 | 1.1 × 10⁻³ | 1.8 × 10⁻¹ |
| C4 | Complement C4 | 1.2 | 220.1 | 7.53 | 1.3 × 10⁻³ | 1.9 × 10⁻¹ |
| C1QC | Complement C1q Subcomponent Subunit C | 61.7 | 4210.0 | 6.09 | 1.4 × 10⁻³ | 2.0 × 10⁻¹ |
| C1S | Complement C1s Subcomponent | 126.4 | 8272.5 | 6.03 | 1.4 × 10⁻³ | 2.0 × 10⁻¹ |
| C1QB | Complement C1q Subcomponent Subunit B | 116.7 | 7135.2 | 5.93 | 1.7 × 10⁻³ | 2.2 × 10⁻¹ |
| C7 | Complement Component C7 | 30.0 | 1288.2 | 5.42 | 3.9 × 10⁻³ | 3.8 × 10⁻¹ |
| CFB | Complement Factor B | 144.2 | 4880.0 | 5.08 | 5.3 × 10⁻³ | 4.6 × 10⁻¹ |
| Lectin | ||||||
| CLEC4M | C-type Lectin Domain Family 4 Member M | 10.0 | 5250.0 | 9.04 | 2.9 × 10⁻⁵ | 1.9 × 10⁻² |
| LGALS9 | Galectin-9 | 89.2 | 8098.8 | 6.50 | 7.6 × 10⁻⁴ | 1.3 × 10⁻¹ |
| FUCL4_ANGJA | Fucolectin-4 | 32.5 | 1838.8 | 5.82 | 2.2 × 10⁻³ | 2.7 × 10⁻¹ |
| CLEC10A | C-type Lectin Domain Family 10 Member A | 12.5 | 603.8 | 5.59 | 4.1 × 10⁻³ | 3.9 × 10⁻¹ |
| MBL | Mannose-binding Lectin | 1.7 | 175.0 | 6.71 | 4.2× 10⁻³ | 4.0 × 10⁻¹ |
| LGALS3 | Galectin-3 | 10.8 | 415.0 | 5.26 | 7.1× 10⁻³ | 5.5 × 10⁻¹ |
| LGALS3BPA | Galectin-3-binding Protein A | 1083.3 | 27,214.6 | 4.65 | 8.9 × 10⁻³ | 6.5 × 10⁻¹ |
| Ubiquitination | ||||||
| UBL4A | Ubiquitin-like Protein 4a | 31.7 | 87,332.8 | 11.43 | 8.0 × 10⁻⁷ | 6.0 × 10⁻³ |
| HERC5 | E3 Ubiquitin-protein Ligase Herc5 | 3.1 | 4851.1 | 10.61 | 5.6 × 10⁻⁶ | 7.1 × 10⁻³ |
| HERC6 | E3 Ubiquitin-protein Ligase Herc6 | 65.0 | 34,045.8 | 9.03 | 2.2 × 10⁻⁵ | 1.6 × 10⁻² |
| USP18 | Ubiquitin Carboxyl-terminal Hydrolase 18 | 14.2 | 4250.9 | 8.23 | 8.4 × 10⁻⁵ | 3.0 × 10⁻² |
| USP12 | Ubiquitin Carboxyl-terminal Hydrolase 12 | 9.2 | 1986.2 | 7.76 | 1.9 × 10⁻⁴ | 5.4 × 10⁻² |
| UBR1 | E3 Ubiquitin-protein Ligase Ubr1 | 18.4 | 2933.8 | 7.32 | 2.9 × 10⁻⁴ | 6.6 × 10⁻² |
| TRIM21 | Tripartite Motif-containing Protein 21 | 6.7 | 1061.3 | 7.31 | 4.2 × 10⁻⁴ | 8.7 × 10⁻² |
| TRIM47 | Tripartite Motif-containing Protein 47 | 9.2 | 1332.5 | 7.18 | 4.4 × 10⁻⁴ | 8.8 × 10⁻² |
| RNF213 | E3 Ubiquitin-protein Ligase Rnf213 | 40.8 | 4928.8 | 6.92 | 4.6 × 10⁻⁴ | 8.9 × 10⁻² |
| TRIM29 | Tripartite Motif-containing Protein 29 | 58.0 | 2261.1 | 5.29 | 4.3 × 10⁻³ | 4.0 × 10⁻¹ |
| TRIM39 | Tripartite Motif-containing Protein 39 | 7.0 | 354.2 | 5.67 | 4.7 × 10⁻³ | 4.2 × 10⁻¹ |
| TRIM25 | Tripartite Motif-containing Protein 25 | 2.5 | 182.5 | 6.19 | 5.8 × 10⁻³ | 4.8 × 10⁻¹ |
| HERC4 | E3 Ubiquitin-protein Ligase Herc4 | 788.6 | 17,971.6 | 4.51 | 1.1 × 10⁻² | 7.3 × 10⁻¹ |
| TRIM16 | Tripartite Motif-containing Protein 16 | 17.5 | 476.7 | 4.77 | 1.2 × 10⁻² | 7.7 × 10⁻¹ |
| TRIM14 | Tripartite Motif-containing Protein 14 | 85.7 | 1728.9 | 4.33 | 1.5 × 10⁻² | 8.9 × 10⁻¹ |
| Others | ||||||
| RSAD2 | Radical S-adenosyl Methionine Domain-containing Protein 2 | 30.8 | 41,672.6 | 10.40 | 3.4 × 10⁻⁶ | 7.1 × 10⁻³ |
| IFI44 | Interferon-induced Protein 44 | 62.8 | 73,980.2 | 10.20 | 4.3 × 10⁻⁶ | 7.1 × 10⁻³ |
| IFIT5 | Interferon-induced Protein With Tetratricopeptide Repeats 5 | 4.2 | 3119.8 | 9.55 | 2.0 × 10⁻⁵ | 1.6 × 10⁻² |
| SOCS1 | Suppressor Of Cytokine Signaling 1 | 25.8 | 13,362.6 | 9.01 | 2.5 × 10⁻⁵ | 1.7 × 10⁻² |
| MX | Interferon-induced GTP-binding Protein Mx | 49.2 | 19,664.4 | 8.64 | 3.9 × 10⁻⁵ | 2.3 × 10⁻² |
| NKL | Antimicrobial Peptide Nk-lysin | 8.3 | 3838.8 | 8.85 | 4.0 × 10⁻⁵ | 2.3 × 10⁻² |
| FCGR1A | High Affinity Immunoglobulin Gamma Fc Receptor I | 33.3 | 12,632.2 | 8.57 | 4.5 × 10⁻⁵ | 2.5 × 10⁻² |
| FCER1A | High Affinity Immunoglobulin Epsilon Receptor Subunit Alpha | 13.4 | 5255.2 | 8.62 | 4.8 × 10⁻⁵ | 2.5 × 10⁻² |
| PIGR | Polymeric Immunoglobulin Receptor | 5.0 | 2332.5 | 8.87 | 4.9 × 10⁻⁵ | 2.5 × 10⁻² |
| LYG_EPICO | Lysozyme G | 352.5 | 120,945.0 | 8.42 | 5.0 × 10⁻⁵ | 2.5 × 10⁻² |
| SAMD9 | Sterile Alpha Motif Domain-containing Protein 9 | 2.5 | 1271.2 | 8.99 | 6.5 × 10⁻⁵ | 2.8 × 10⁻² |
| IRF4 | Interferon Regulatory Factor 4 | 10.0 | 2811.3 | 8.14 | 1.1 × 10⁻⁴ | 3.6 × 10⁻² |
| GVINP1 | Interferon-induced Very Large GTPase 1 | 53.3 | 11,420.6 | 7.74 | 1.4 × 10⁻⁴ | 4.5 × 10⁻² |
| TMEM173 | Stimulator of Interferon Genes Protein | 23.3 | 4917.5 | 7.72 | 1.6 × 10⁻⁴ | 4.8 × 10⁻² |
| MPEG1 | Macrophage-expressed Gene 1 Protein | 13.3 | 2433.8 | 7.51 | 2.4 × 10⁻⁴ | 6.0 × 10⁻² |
| HSP30 | Heat Shock Protein 30 | 1.7 | 572.5 | 8.42 | 2.4 × 10⁻⁴ | 6.0 × 10⁻² |
| GZMA | Granzyme A | 9.2 | 1761.4 | 7.57 | 2.4 × 10⁻⁴ | 6.0 × 10⁻² |
| IRF3 | Interferon Regulatory Factor 3 | 5.8 | 1155.6 | 7.63 | 2.8 × 10⁻⁴ | 6.6 × 10⁻² |
| EIF2AK2 | Interferon-induced, Double-stranded RNA-activated Protein Kinase | 15.6 | 2438.5 | 7.29 | 3.3 × 10⁻⁴ | 7.3 × 10⁻² |
| IRF1 | Interferon Regulatory Factor 1 | 349.2 | 22,350.8 | 6.00 | 1.5 × 10⁻³ | 2.0 × 10⁻¹ |
| PSMB6L-B | Proteasome Subunit Beta Type-6-b Like Protein | 131.7 | 8506.1 | 6.01 | 1.5× 10⁻³ | 2.0 × 10⁻¹ |
| CASP3 | Caspase-3 | 24.2 | 1688.8 | 6.13 | 1.5 × 10⁻³ | 2.1 × 10⁻¹ |
| PSME1 | Proteasome Activator Complex Subunit 1 | 220.8 | 12,675.8 | 5.84 | 1.8 × 10⁻³ | 2.4 × 10⁻¹ |
| IFIH1 | Interferon-induced Helicase C Domain-containing Protein 1 | 96.7 | 5280.5 | 5.77 | 2.1 × 10⁻³ | 2.6 × 10⁻¹ |
| PSMB8 | Proteasome Subunit Beta Type-8 | 86.7 | 3997.5 | 5.53 | 3.0 × 10⁻³ | 3.2 × 10⁻¹ |
| GRN | Granulins | 275.0 | 11,720.0 | 5.41 | 3.3 × 10⁻³ | 3.3 × 10⁻¹ |
| MR1 | Major Histocompatibility Complex Class I-related Gene Protein | 153.6 | 6162.8 | 5.33 | 3.8 × 10⁻³ | 3.6 × 10⁻¹ |
| SOCS3 | Suppressor Of Cytokine Signaling 3 | 125.7 | 4607.5 | 5.20 | 4.6 × 10⁻³ | 4.2 × 10⁻¹ |
| IGSF3 | Immunoglobulin Superfamily Member 3 | 11.7 | 408.0 | 5.13 | 8.3 × 10⁻³ | 6.1 × 10⁻¹ |
| IRGC | Interferon-inducible GTPase 5 | 11.9 | 346.9 | 4.86 | 1.2 × 10⁻² | 7.7 × 10⁻¹ |
© 2017 by the authors; licensee MDPI, Basel, Switzerland. This article is an open access article distributed under the terms and conditions of the Creative Commons Attribution (CC-BY) license (http://creativecommons.org/licenses/by/4.0/).
Share and Cite
Kim, J.-O.; Kim, J.-O.; Kim, W.-S.; Oh, M.-J. Characterization of the Transcriptome and Gene Expression of Brain Tissue in Sevenband Grouper (Hyporthodus septemfasciatus) in Response to NNV Infection. Genes 2017, 8, 31. https://doi.org/10.3390/genes8010031
Kim J-O, Kim J-O, Kim W-S, Oh M-J. Characterization of the Transcriptome and Gene Expression of Brain Tissue in Sevenband Grouper (Hyporthodus septemfasciatus) in Response to NNV Infection. Genes. 2017; 8(1):31. https://doi.org/10.3390/genes8010031
Chicago/Turabian StyleKim, Jong-Oh, Jae-Ok Kim, Wi-Sik Kim, and Myung-Joo Oh. 2017. "Characterization of the Transcriptome and Gene Expression of Brain Tissue in Sevenband Grouper (Hyporthodus septemfasciatus) in Response to NNV Infection" Genes 8, no. 1: 31. https://doi.org/10.3390/genes8010031