1. Introduction
Occupational allergic disease is a significant health burden. A variety of diseases can be caused by workplace chemical exposures, including asthma, conjunctivitis, dermatitis, rhinitis, and urticaria [
1]. Diisocyanates are a group of highly reactive chemicals characterized by the presence of double isocyanate functional groups; many of these chemicals are potent sensitizers and major causative agents of occupational allergic disease [
2,
3,
4]. Toluene diisocyanate (TDI) is frequently utilized in the automobile industry and in the manufacture of polyurethane foams, paints, and coatings [
5,
6,
7,
8]. TDI is widely used throughout the U.S. and around the globe; the U.S. Environmental Protection Agency reports that U.S. production and importation of 2–4 and 2–6 TDI isomers rose above one billion pounds in 2006 [
6]. While TDI has generally been classified as a T-helper type 2 (Th2) sensitizer, the immune response following exposure is more accurately characterized as a mixed Th1/Th2 response in both rodents and humans [
1,
2,
9]. The principal routes of human exposure to TDI are inhalation and dermal contact [
6] and sensitization leading to allergic disease has been documented for both routes [
7,
10]. Once the induction threshold has been reached, skin sensitization is thought to be sufficient for subsequent allergic disease of the respiratory tract [
7], illustrating the systemic nature of TDI sensitization. Although TDI-induced allergic disease is an extremely relevant occupational health concern the pathogenic mechanisms of diisocyanate-induced allergic disease are not fully understood [
5]. The identification of novel mediators of allergic disease may be necessary to obtain a full and complete understanding of the disease. Because of the occupational significance of and lack of validated identification strategies for chemical respiratory sensitizers like TDI [
4,
11], it is necessary to investigate and identify functional pathways and mechanisms that are involved in TDI sensitization. Specific understanding of disease mechanism may have direct implications in risk assessment, hazard communication and guidance used in the selection of safe products, work place interventions and training programs to warn workers about potential risks, the identification of safer alternatives, and the selection of proper personal protective equipment (PPE).
An emerging class of epigenetic regulatory elements that have been the subject of recent scientific focus are microRNAs (miRNAs). These molecules are single stranded, noncoding RNA molecules that are approximately 19–23 nucleotides long [
12]. miRNAs exhibit functional significance though posttranscriptional gene regulation due to their ability to bind to the target mRNA and destabilize and inhibit protein translation when in complex with Argonaute proteins and the RNA-induced silencing complex (RISC). The seed sequence of a mature miRNA interacts with the 3′ untranslated region of target mRNA and leads to the translational repression or degradation of the target mRNA, influencing gene expression. Recently, it has been shown that miRNAs play a major role in a variety of immune responses [
13,
14,
15,
16]. These regulatory factors have not been functionally investigated in the context of chemical sensitization, with the exception of recent work by our group that profiled the general expression kinetics of miRNAs involved in TDI sensitization [
1] and research profiling miRNA expression in both human and murine diphenylcyclopropenone-induced dermatitis [
17].
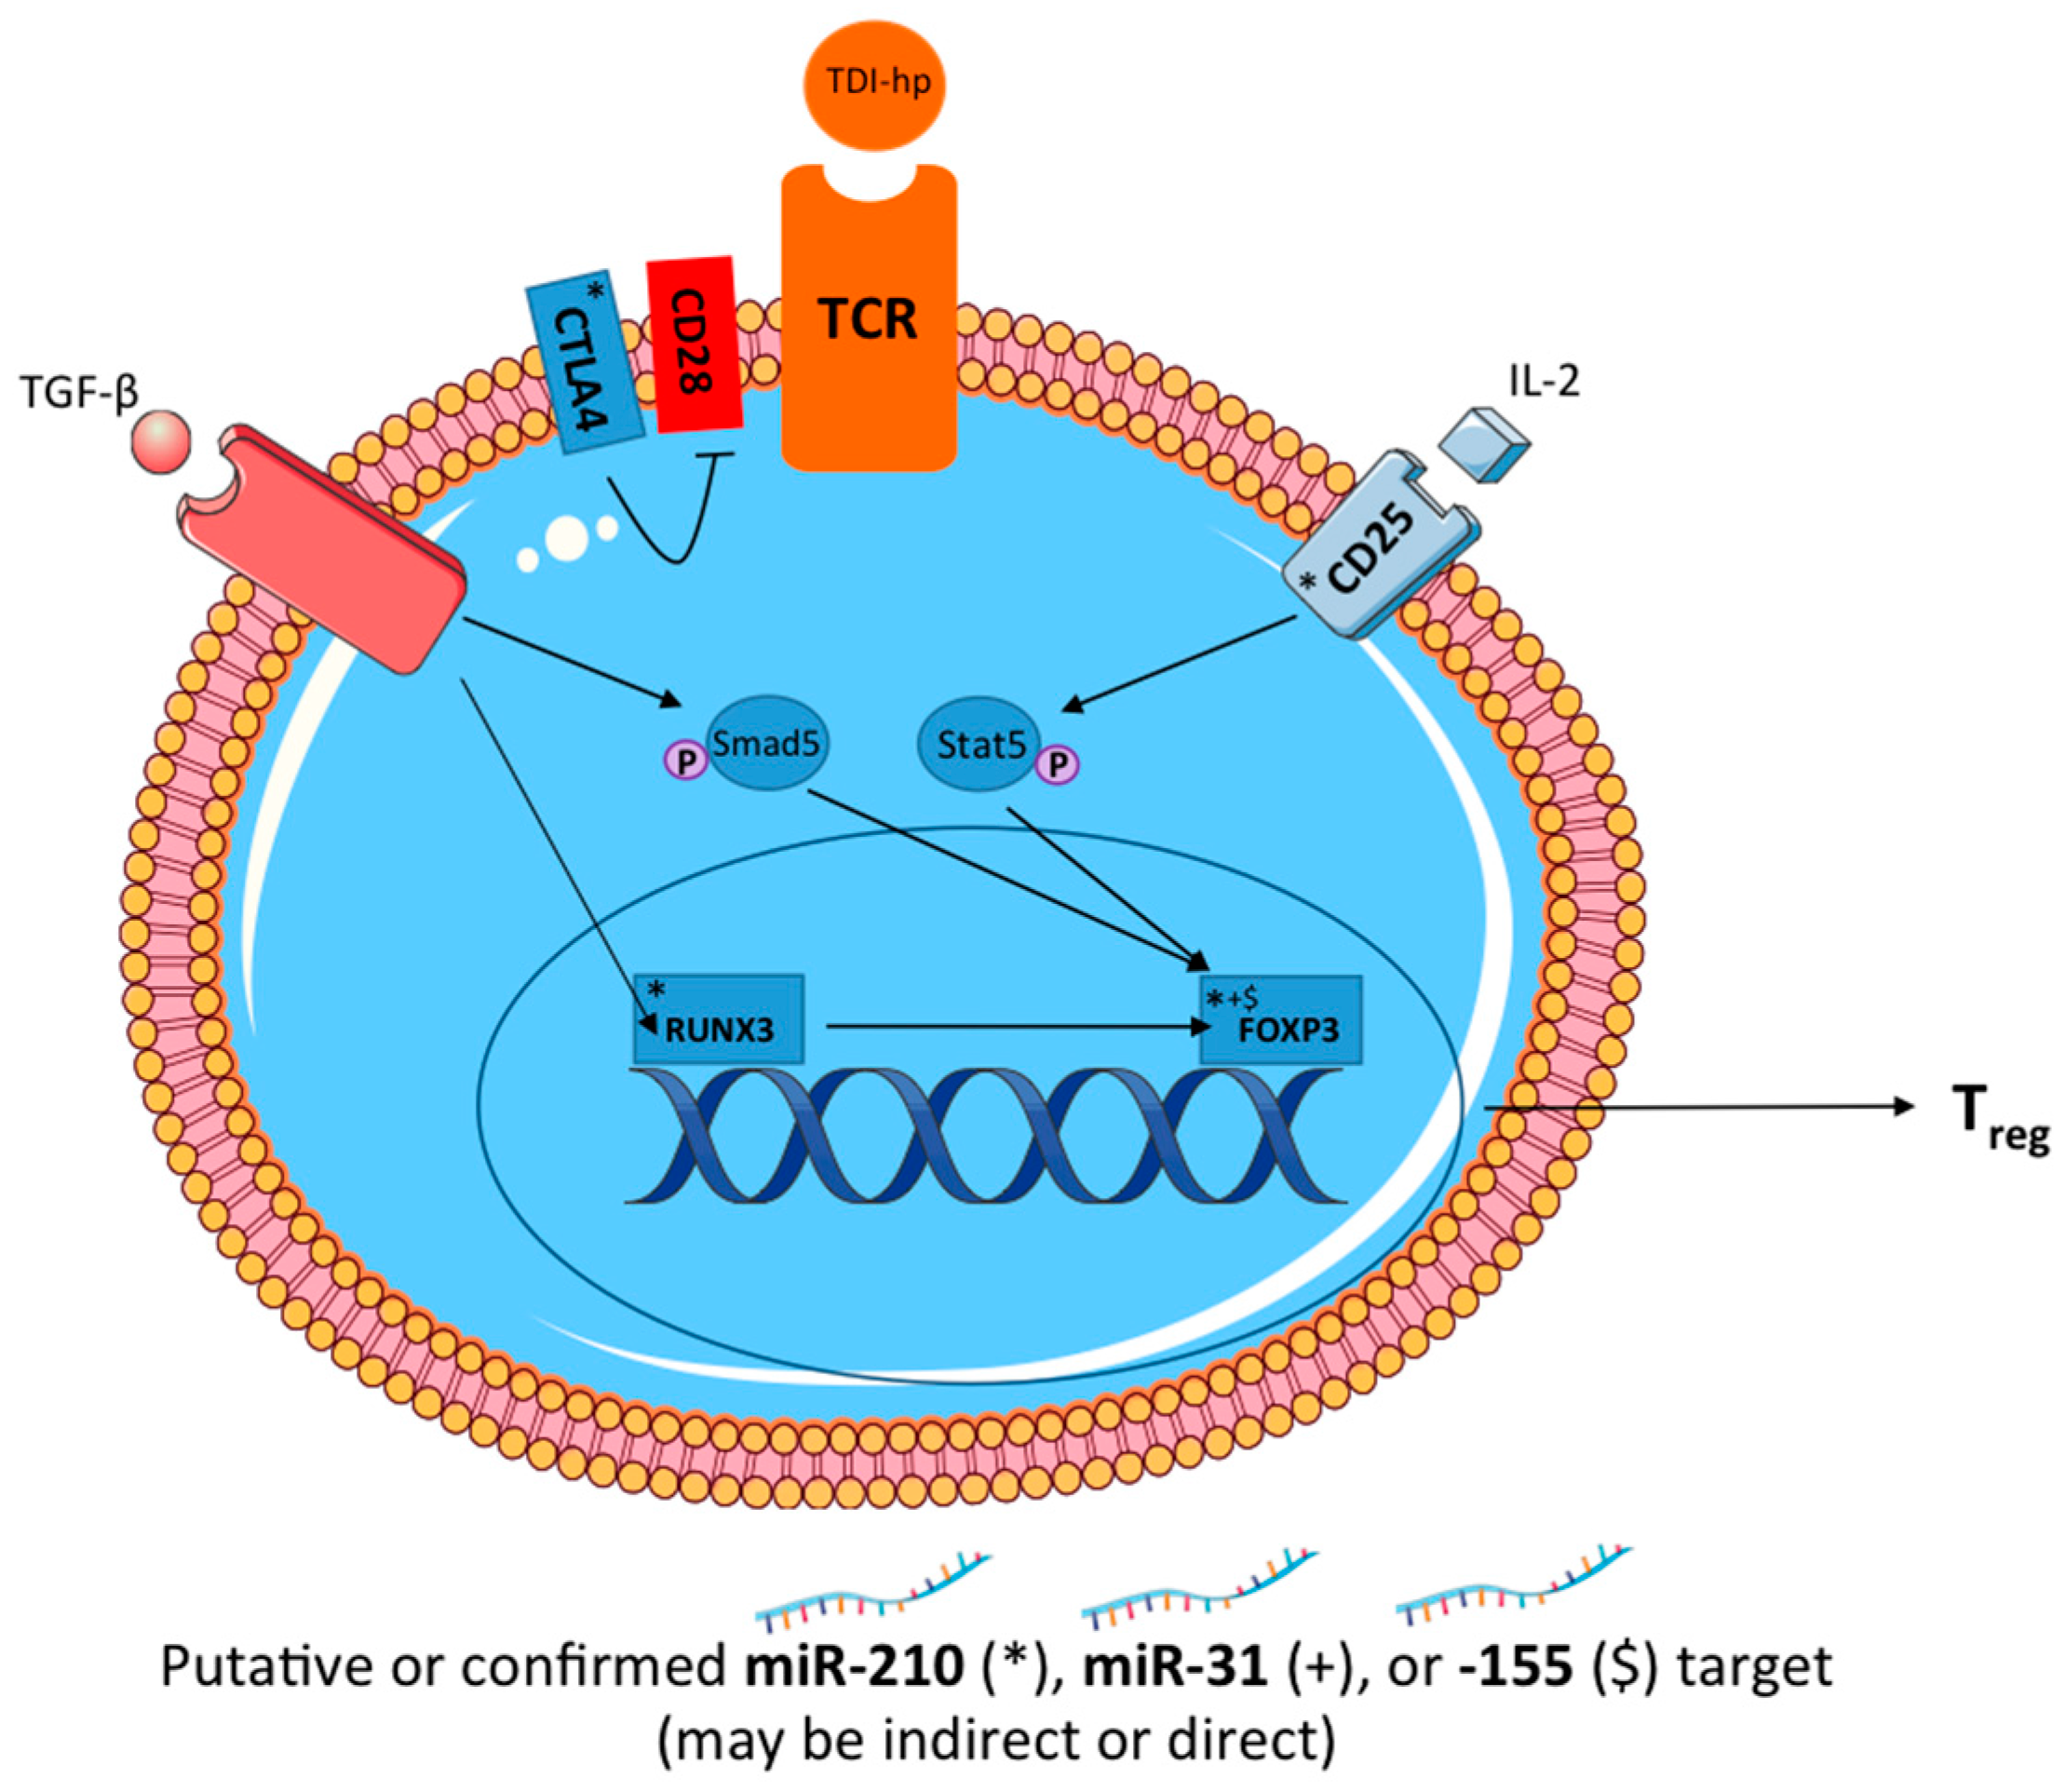
The identification of increased expression of several miRNAs in the draining lymph nodes (dLN) of mice during epicutaneous TDI sensitization prompted further investigation into the potential functional roles of these molecules in the allergic response. Target analysis for upregulated miRNAs (miR-210, -31, and -155) revealed several putative and confirmed regulatory T cell (T
reg)-related targets including
foxp3 and
runx3 in murine and human genomes [
1]. These transcription factors and the signaling molecules CD25 and CTLA4 are integral to T
reg differentiation and function. The expression of these molecules allows T
reg to differentiate in response to allergens and exert immunoregulatory functions, dampening inappropriate inflammatory and adaptive immune responses. In addition, miR-31 and -155 have been implicated as regulators of T
reg in a variety of contexts [
18,
19]. A role for T
regs has been suggested in models of chemical-induced contact hypersensitivity [
20,
21] and, in a recent manuscript, Long et al. demonstrated the increased expression and functional capability of T
regs during TDI sensitization [
21]. While the collection of data regarding roles for T
regs and miRNAs in chemical allergy is growing, it is still limited. Recently published data suggests an important role for T
regs in dermal TDI sensitization, yet the interaction between these cells and selected miRNAs has not been investigated. While miR-210 is well characterized in the hypoxia response, its specific role in allergic disease has not yet been defined. In the present study, we utilized a murine model of epicutaneous TDI sensitization in order to elucidate the expression kinetics and role of miR-210 and its putative mRNA targets in a murine model of epicutaneous TDI sensitization, specifically in relation to the T
reg subset.
2. Materials and Methods
2.1. Mice
Female BALB/c mice (6–8 weeks of age) were obtained from Taconic (Germantown, NY, USA), acclimated for 5 days, and then randomly assigned to treatment group; homogenous weight distribution was ensured across treatment groups. Mice were housed in ventilated plastic shoebox cages with hardwood chip bedding at a maximum of five animals per cage. A NIH-31 modified 6% irradiated rodent diet (Harlan Teklad, Frederick, MD, USA) and tap water were administered ad libitum. Housing facilities were maintained at 68–72°F and 36%–57% relative humidity, and a 12 h light–dark cycle was maintained. All animal experiments were performed in the Association for Assessment and Accreditation of Laboratory Animal Care (AAALAC) accredited National Institute for Occupational Safety and Health (NIOSH) animal facility in accordance with an Institutional Animal Care and Use Committee-approved protocol (protocol number 15-SA-M-004, date of approval 1 August 2015).
2.2. TDI Sensitization Model
Toluene 2,4-diisocyanate (TDI, CAS# 584-84-9) was obtained from Sigma-Aldrich (Milwaukee, WI, USA). Animals were exposed to a single dose of 0%, 0.5%, and 4% TDI (
v/
v) on the dorsal surface of each ear (25 µL per ear). The chosen TDI concentrations (0.5% and 4%
v/
v) and dosing regimen was previously shown to induce sensitization [
1,
21] and 4% TDI (1000 μg TDI/cm
2) was previously reported as the minimum single dose concentration of TDI that could induce maximum sensitization in the absence of systemic toxicity [
1]. Acetone was selected as the vehicle control and has been historically utilized in our laboratory to evaluate chemical sensitization [
21,
22,
23]. It is important to note that due to hydrolysis, slight variations in the concentration of TDI dosing solutions may have occurred between preparation and application. However, animals were exposed within 30 min of TDI preparation and no visualization of hydrolysis was observed subsequent to exposures.
2.3. Euthanasia, Tissue Collection, and Processing
Animals were weighed, euthanized via CO2 asphyxiation at time points ranging from 1 to 11 days post chemical exposure, and examined for gross pathology. Left and right auricular draining lymph nodes (dLNs; drain the site of chemical application) were collected in 4 mL sterile phosphate-buffered saline (PBS, pH 7.4) and manually dissociated using the frosted ends of two microscope slides. Cells were counted using a Cellometer (Nexcelom Bioscience, Lawrence, MA, USA) and size exclusion parameters (3.5 to 36 µm) with a combined acridine orange/propidium iodide solution to identify viable cells. For isolation of specific cellular subsets Stemcell magnetic isolation kits (Vancouver, BC, Canada) were utilized, including the Treg isolation kit (CD4 negative and CD25 positive selection).
2.4. Ex Vivo miRNA Transfection Assays
Following dLN processing and counting, miR-31, -155, and -210 mimics (25 pmol in Lipofectamine transfection reagent, ThermoFisher, Waltham, MA, USA) were reverse transfected in flat-bottom 24-well plates for 24 h. Then, 1.5 × 10⁶ naïve or acetone-treated dLN cells/mL (in RPMI-1640 media) were added to plates followed by general T cell stimulation (2 µg/mL α-CD3, 1 µg/mL α-CD28 and incubated in fresh media at 37 °C and 5% CO2. Following a 72 h incubation, cells were washed with RPMI-1640 and RNA was isolated as described in the following section. RNA was assayed for intracellular miRNA expression to conform the intracellular uptake of miRNA mimics as well as Treg-related gene expression via RT-PCR.
2.5. RNA Isolation, Reverse Transcription, and RT-PCR
Total RNA was isolated from the dLN using the miRNeasy kit (Qiagen, Hilden, Germany) according to the manufacturer’s directions. A QiaCube (Qiagen) automated RNA isolation machine was utilized in conjunction with the specified RNA isolation kit. The concentration and purity of the RNA was determined using a ND-1000 spectrophotometer (Thermo Scientific Nanodrop, Wilmington, DE, USA). For gene and primary miRNA expression analysis, first strand cDNA synthesis was performed using a High-Capacity cDNA Synthesis Kit (Applied Biosystems, Carlsbad, CA, USA) according to the manufacturer’s recommendations. For mature miRNA, reverse transcription TaqMan MicroRNA Assays (looped-primer RT-PCR; Applied Biosystems) were utilized according to manufacturer’s recommendations (both multiplex and singleplex protocols were utilized).
For analysis of mRNA and primary miRNA expression, TaqMan Universal Fast master mix (Life Technologies, Carlsbad, CA, USA), cDNA, and mouse-specific mRNA primers (TaqMan Custom PCR Arrays, Carlsbad, CA, USA) were combined and PCR was performed according to the manufacturer’s protocol (TaqMan Gene Expression Analysis). For analysis of miRNA expression, TaqMan Universal 2× master mix, No AmpErase UNG (Life Technologies), cDNA, and mouse-specific miRNA primers (TaqMan Custom PCR Arrays) were combined and PCR was performed according to manufacturer protocol (TaqMan miRNA Assays both Single- and Multi-Plex). Primers used include: β-actin, cd25 (il2rα), ctla4, foxp3, mature miR-210, -31, -155, primary miR-210, runx3, and sno234. MicroAmp Fast Optical 96-well reaction plates were analyzed on an Applied Biosystems 7500 Fast Real Time PCR system using cycling conditions as specified by the manufacturer. β-actin (mRNA and primary miRNA) and snoRNA234 (miRNA) were used as the endogenous reference control gene as expression was determined to be stable following chemical exposure (data not shown). RT-PCR data were collected and represented as relative fold change over vehicle control, calculated by the following formula: 2−ΔΔCt = ΔCtSample − ΔCtControl. ΔCt = CtTarget − Ctβ-ACTIN, where Ct = cycle threshold as defined by manufacturer.
2.6. Flow Cytometric Analysis and Treg Phenotyping
Single cell suspensions were prepared from tissues and a minimum of 150,000 dLN cells were aliquoted into 96-well U-bottom plates and washed in fluorescence-activated cell sorting (FACS) staining buffer (PBS + 1% bovine serum albumin + 0.1% sodium azide). Cells were resuspended in staining buffer containing anti-mouse CD16/32 antibody (clone 2.4G2; BD Biosciences, San Jose, CA, USA) for blocking of Fc receptors to minimize nonspecific binding. Cells were resuspended in staining buffer containing a cocktail of fluorochrome-conjugated antibodies specific for cell surface antigens including: CD3 (500A2, V500, BD Biosciences, Franklin Lanes, NJ, USA), CD4 (RM4-5, AF700, BD), CD8a (53-6.7, AF488, BioLegend, San Diego, CA, USA), CD25 (PC61, APC Cy7, BioLegend), CD45 (30-F11, PE, BD). Following surface staining, cells were washed in staining buffer and fixed using the Foxp3 fixation buffer set (eBioscience, San Diego, CA, USA). After overnight incubation in staining buffer, cells were permeablilized using the Foxp3 fixation buffer set (eBioscience) and re-suspended in permeabilization buffer containing a cocktail of fluorochrome-conjugated antibodies specific for intracellular antigens including: RUNX3 (R3-5G4, PE, BD), Foxp3 (FLK-16s, eF450 and APC, eBioscience). Following staining, cells were re-suspended in staining buffer and analyzed on an LSR II flow cytometer using FacsDiva software (BD Biosciences). Data analysis was performed with FlowJo 10.0 software (TreeStar Inc., Ashland, OR, USA). A minimum of 10,000 events were captured for each sample. Leukocytes were first identified by their expression of CD45. The Treg subset was further identified as CD3+CD4+CD8−CD25+Foxp3+. Numerical population values were calculated by applying subset frequencies to the initial cell count obtained following lymph node homogenization. Compensation controls were performed using single stained cellular suspensions and OneComp beads (eBioscience, San Diego, CA, USA) and fluorescence minus one (FMO) staining controls were included to help set gating boundaries.
2.7. Treg Suppression Assay
The suppressive ability of T
regs was analyzed using an ex vivo T
reg suppression assay as described by Long et al. [
21] with modifications. This assay evaluates the ability of naïve, conventional dLN-derived T cells (T
cons) to proliferate in the presence of varying numbers of T
regs isolated from acetone- or TDI-exposed mice. Mice were exposed to acetone (
n = 7–11) or TDI (4%) (
n = 4–5) as previously described and following sacrifice at 7 days (peak of the expansion) post TDI exposure the dLN and spleens were removed. T
regs (CD4
+CD25
+) and T
cons (CD4
+CD25
−) were isolated from the lymph nodes and CD4
− accessory cells were isolated from naïve spleens using CD4 negative and CD25 positive selection-based magnetic separation kits (Stemcell, Vancouver, BC, USA). Average T
reg purity is as follows for 7 days. Acetone: 96.5% ± 0.8% of CD3
+CD4
+ cells. 4% TDI: 97.35% ± 0.25% of CD3
+CD4
+ cells. Following isolation from naïve mouse dLNs, T
cons were labeled with 2 µM carboxyfluorescein succinimidyl ester (CFSE). miR-210 mirVana mimic (2 pmol; ThermoFisher) in Lipofectamine RNAiMAX (ThermoFisher) or Lipofectamine only control (LO) were added to a 96-well U-bottom plate in order to reverse transfect cells. T
cons and T
regs were cultured in a 96-well U-bottom plate with anti-CD3 (0.2 µg/mL; BD Biosciences) and accessory cells (naïve CD4
− splenocytes treated with mitomycin C) at a variety of T
con:T
reg ratios (1:1, 2:1, 4:1, and 8:1). Additional controls included stimulated T
cons only to assess baseline proliferation, T
regs only, accessory cells only, and T
cons only with no stimulation nor accessory cells. Cells from each treatment group were pooled and added to triplicate wells of the culture plate. Seventy-two hours following plating, cells were stained with anti-CD4 and Live/Dead Violet (Life Technologies). T
cons were defined as CD4
+CFSE
+ cells and suppression was measured based on changes in the frequency of dividing CFSE
+ cells based on the dilution of CFSE. T
regs were analyzed for purity based on their expression of CD3, CD4, and Foxp3 as determined by flow cytometric analysis as previously described.
2.8. Statistical Analysis
Statistical analyses were generated using GraphPad Prism version 5.0 (San Diego, CA, USA). Data were analyzed by a Student
t-test comparing groups as indicated in the figure legends.
Figure 4C was analyzed by analysis of variance using PROC MIXED. In some cases, data were transformed using the natural log to meet the assumptions of the analysis. Significant interactions were explored utilizing the “slice” option in PROC MIXED and pairwise differences were assessed using a Fisher’s Least Significant Difference Test. All differences were considered significant at
p < 0.05; representative significance symbols varied by figure, as indicated in the legend.
4. Discussion
The occupational use of sensitizing chemicals such as TDI remains a significant public health concern. There are no validated hazard identification strategies for respiratory sensitizers like TDI and the complete immunologic mechanisms of sensitization have not been elucidated for these agents, hindering development of appropriate preventative assays. This justifies research pertaining to the identification of novel cellular subsets and epigenetic regulatory mechanisms such as miRNAs that may be involved in the respiratory chemical sensitization process. Following the identification of several upregulated dLN miRNAs during TDI sensitization, these molecules were investigated, specifically in relation to Treg development and functionality. To our knowledge, this is the first work that functionally investigates miRNAs in a model of TDI-induced chemical sensitization.
miRNAs are powerful regulatory molecules which have been implicated in a number of immunologic states and conditions, including allergic disease [
24,
25,
26]. Specifically, miR-155 has demonstrated a critical role in the development of antibody responses and germinal center function [
27], miR-326 has been shown to regulate Th17 differentiation, exhibiting critical involvement in multiple sclerosis pathogenesis [
28], and in vivo miR-126 inhibition reduces a house dust mite-induced asthmatic phenotype, demonstrating the importance of this miRNA in the regulation of Th2 responses and allergic asthma [
24]. Vennegaard et al. described upregulation of several miRNAs, including miR-21, in skin biopsies from patients with allergic responses to diphenylcyclopropenone and in a murine model of dinitrofluorobenzene (DNFB) allergic contact dermatitis [
17]. Additionally, previous work from our groups identified upregulation of several miRNAs, including miR-31, -155, and -210, in a murine model of epicutaneous TDI sensitization [
1]. These ubiquitous signaling molecules are well-established mediators of many of signaling pathways in a number of cell types; however, their role in chemical sensitization is not well understood. For the work described in this manuscript, miR-210 was selected for additional investigation since it has been predicted and demonstrated to target T
reg-related genes. In addition, its role in chemical sensitization and T
reg regulation has not yet been described.
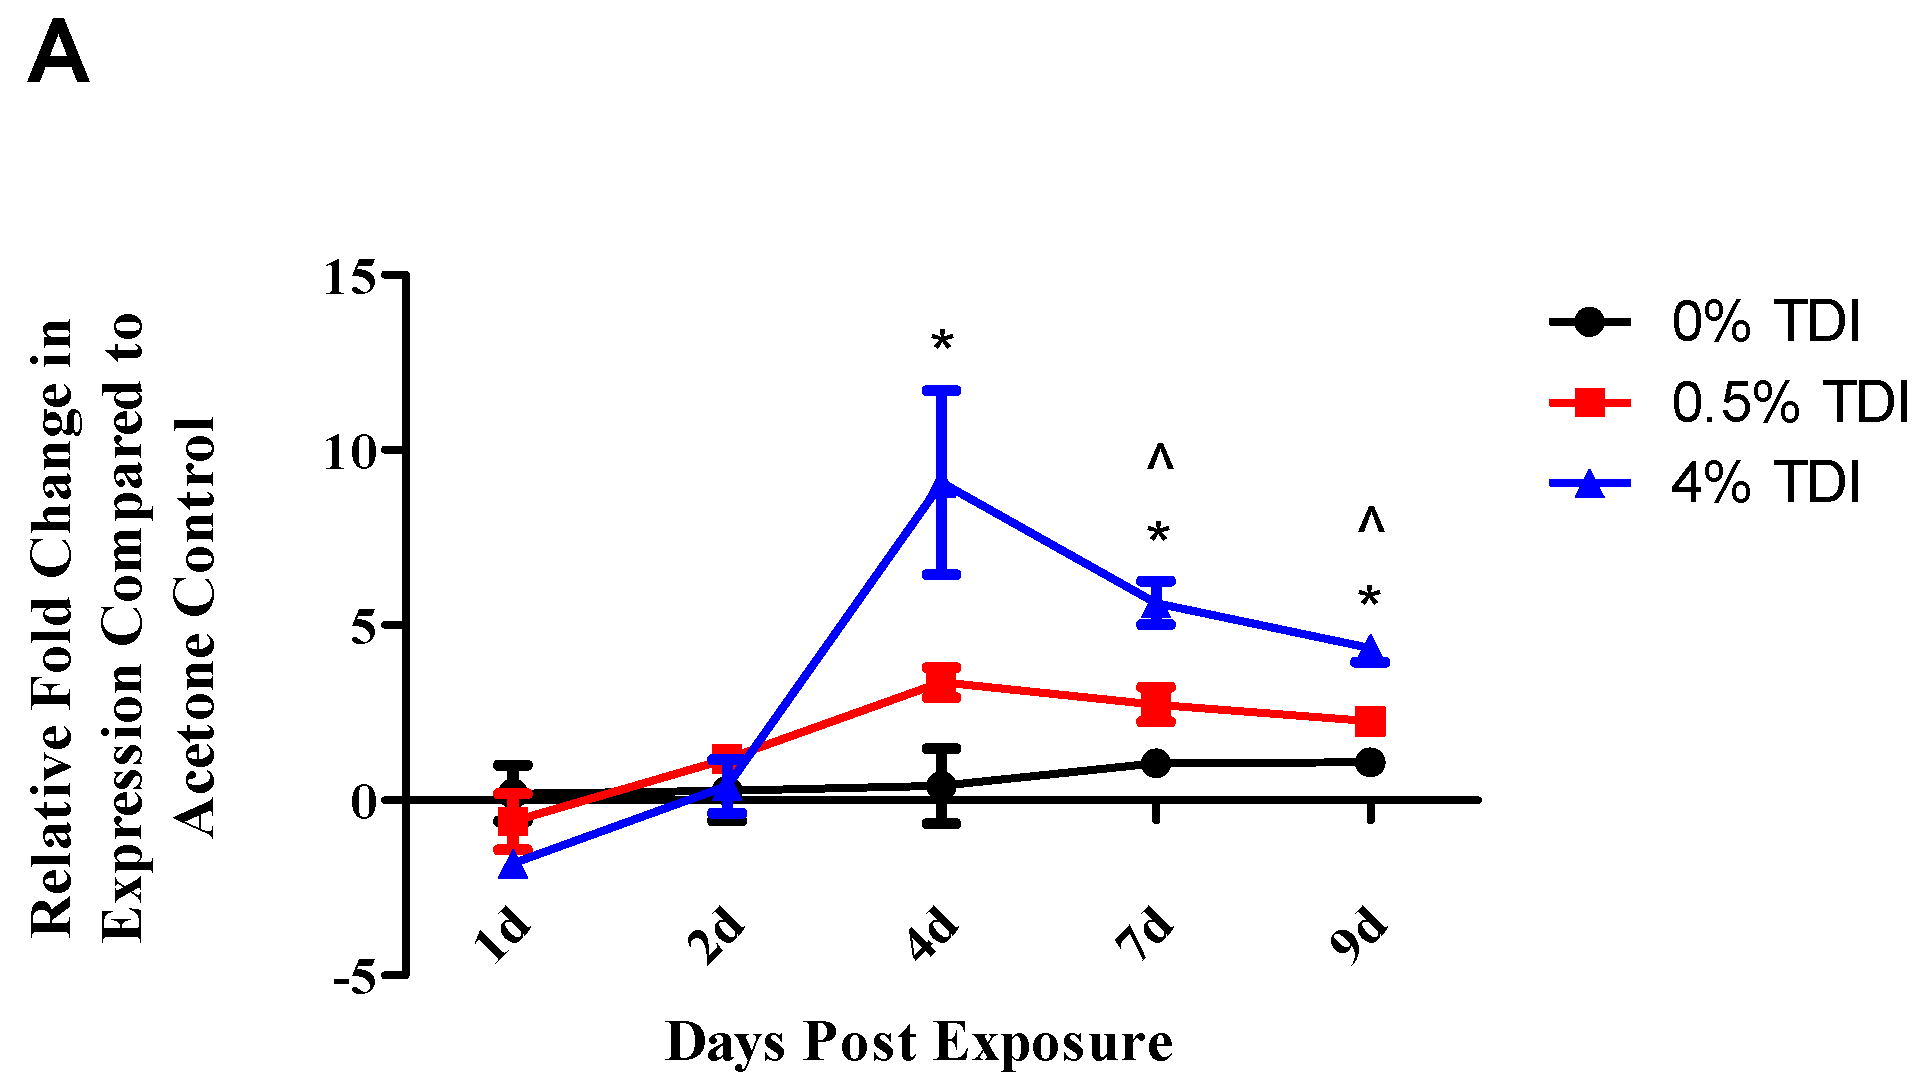
The expression of miR-210 was quantified in a variety of tissues and cellular subsets in a murine model of TDI sensitization. Consistent with previous findings [
1], increased expression of miR-210 in the dLN was also demonstrated in the present study during TDI sensitization (
Figure 1A). In addition, increased expression of miR-210 was also identified in T
regs during TDI sensitization (
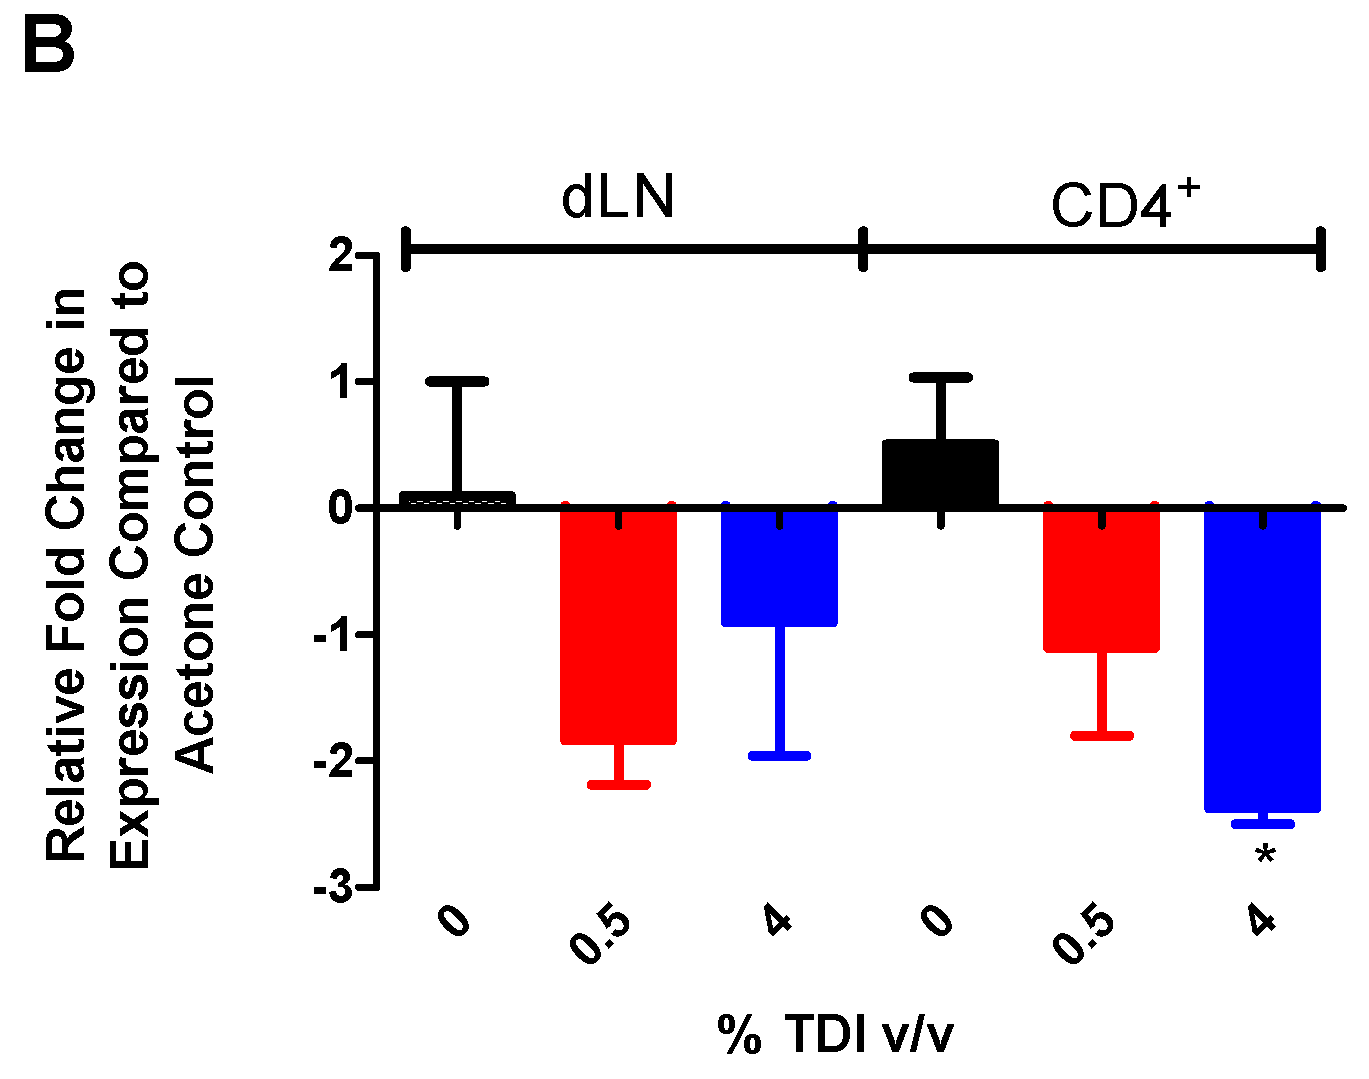
Figure 4A). Since miRNA can be transported to cells via mechanisms such as exosomal transport, experiments to determine if cells are actively producing miR-210 following TDI exposure were conducted. The expression of pri-miRNA indicates gene level expression, presumably within the cell type tested. Pri-miR-210 was detected in the dLN and CD4
+ subsets four days post TDI exposure (
Figure 1B), indicating that miR-210 is being expressed in this tissue by CD4
+ T cells. Interestingly, although they were detectable, pri-miR-210 levels significantly decreased in CD4
+ T cells four days post 4% TDI exposure compared to equivalent cells in acetone-exposed mice, potentially indicating that the majority of mature miR-210 in the dLN is being produced by another cell type, is being transported from another tissue, or is being transcriptionally downregulated at this point, the peak of mature miR-210 levels in the dLN. While pri-miR-210 levels in T
regs were not investigated in the current study, previous studies have demonstrated miR-210 expression following the polarization of naïve T cells into T
regs [
29].
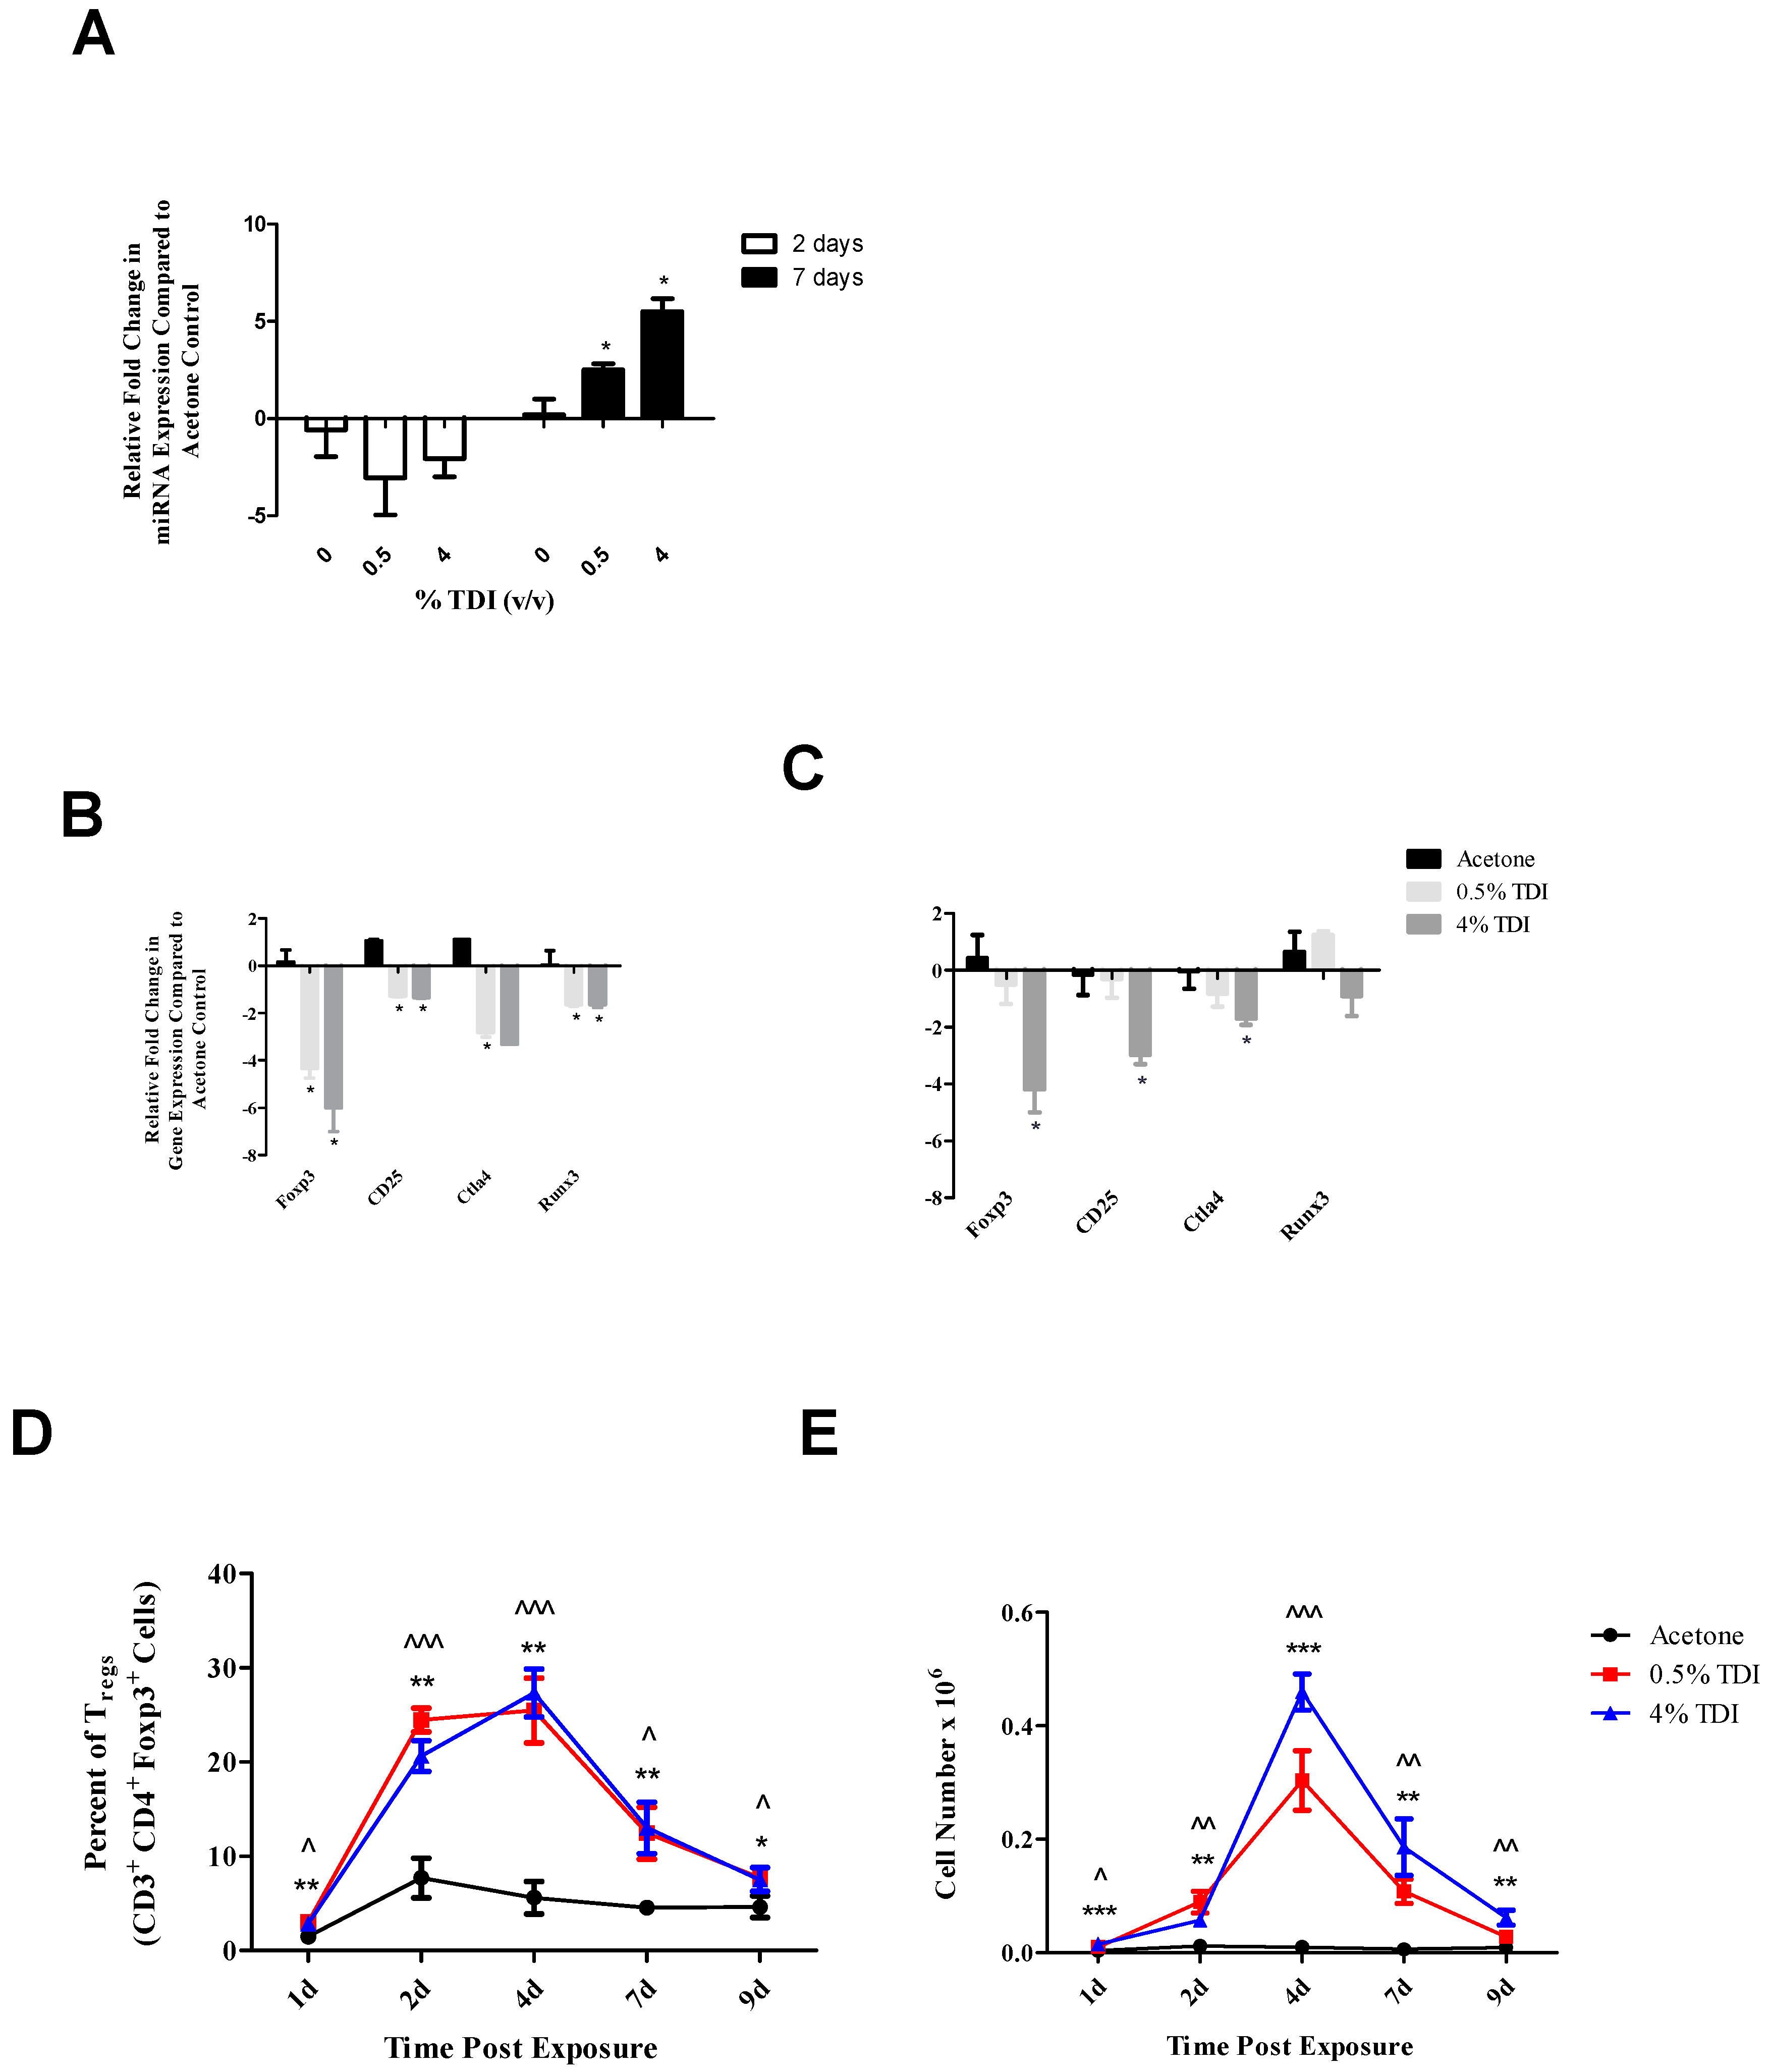
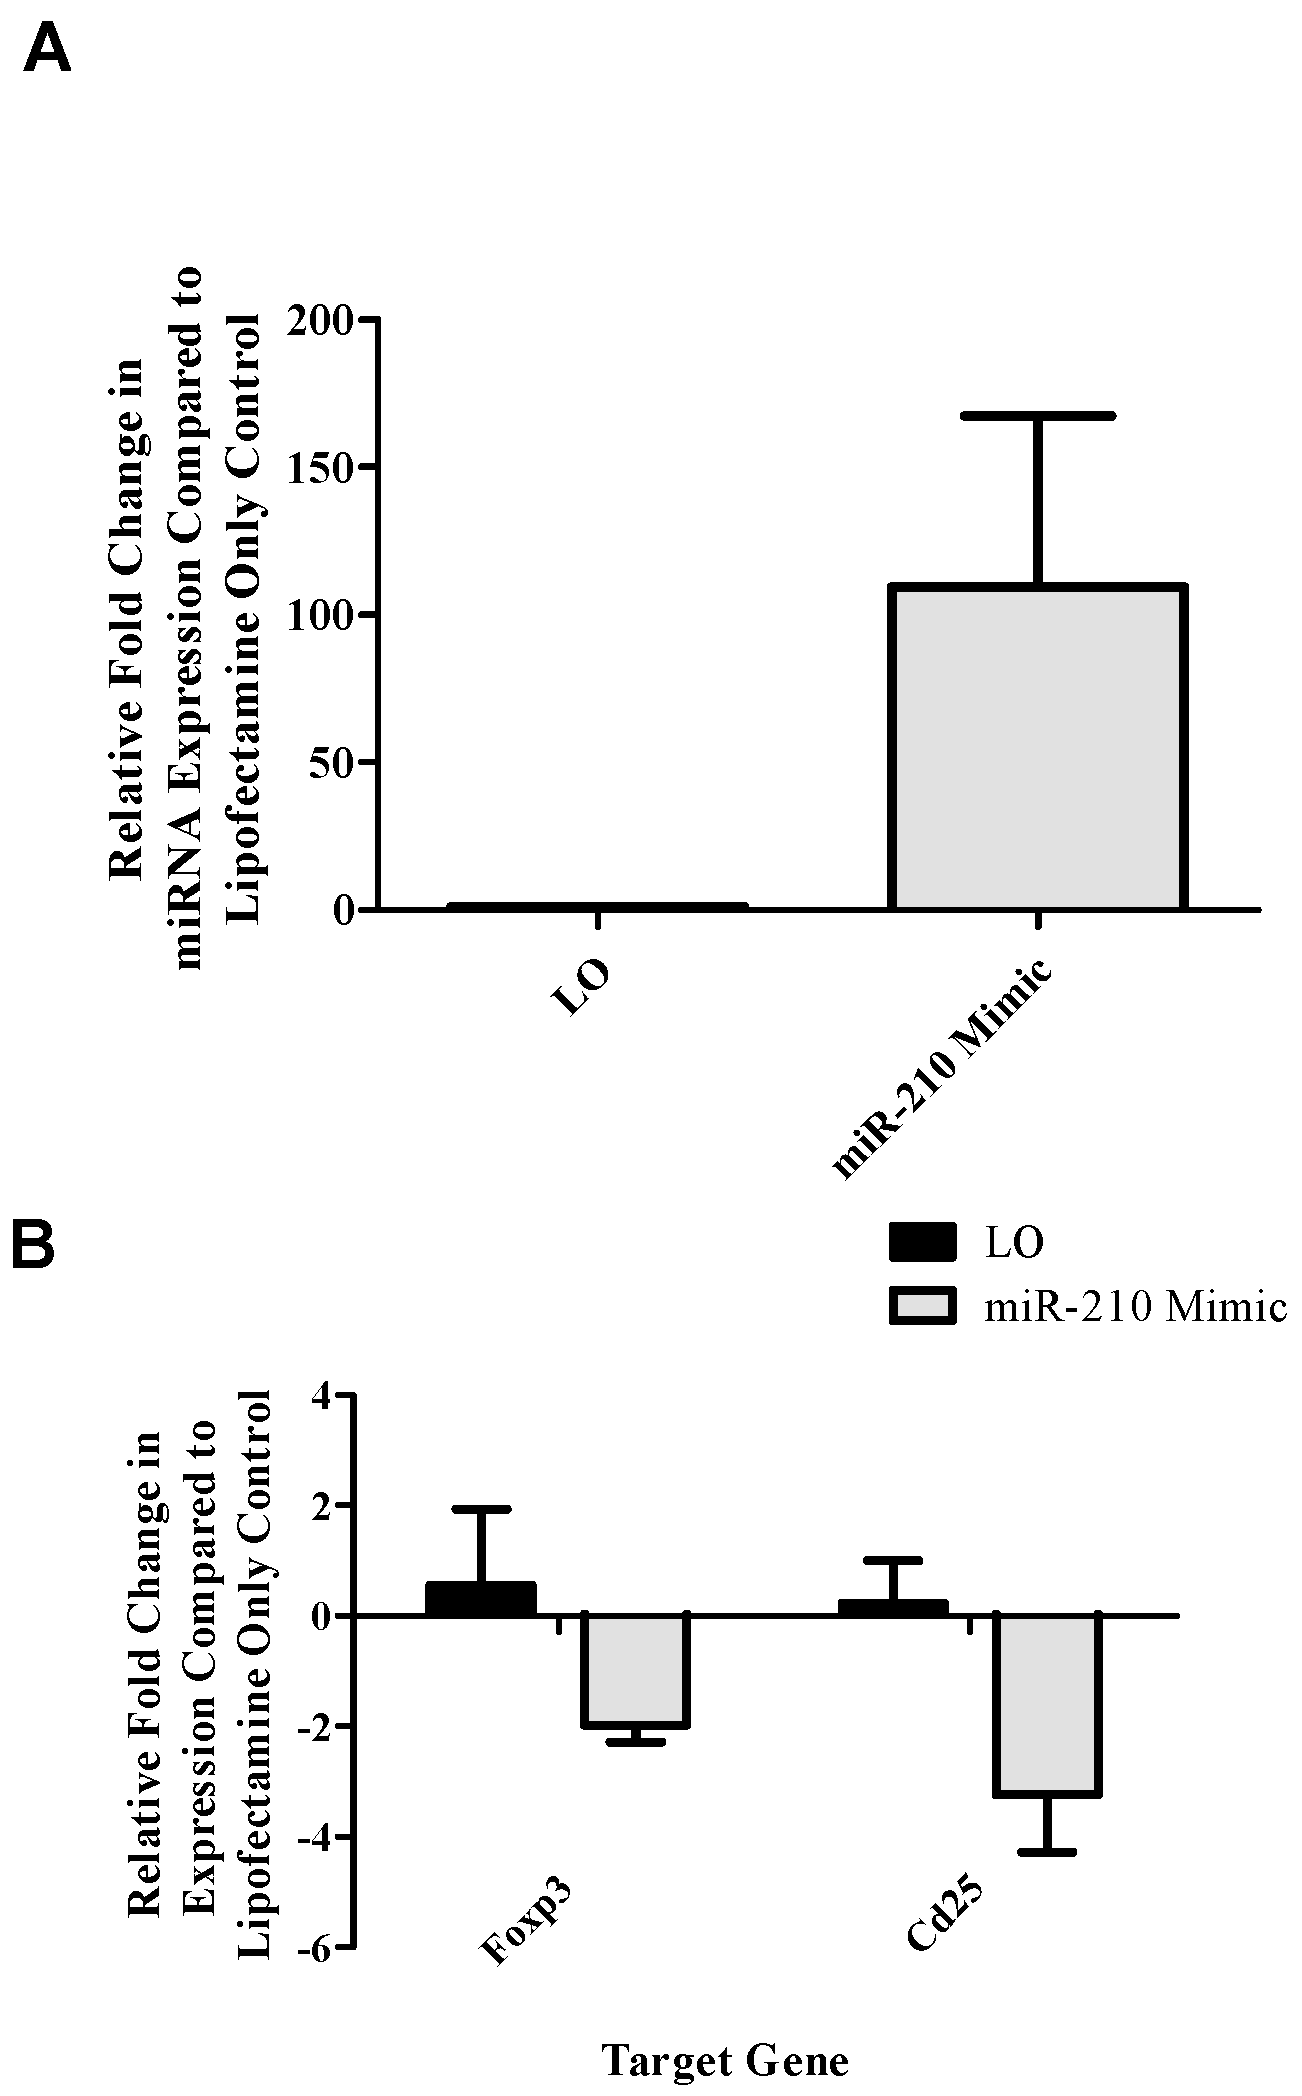
Since T
regs have been implicated as regulators of TDI sensitization [
21] and miR-210 expression has been shown to increase in T
regs following TDI sensitization (
Figure 4A), an ex vivo target analysis system was designed in order to directly examine the effects of miR-210 on T
reg-related genes. Selected genes identified as target of miR-210 included
foxp3, the master transcription factor of the T
reg subset; and
runx3, a transcription factor that signals upstream of
foxp3 by binding to this gene’s promoter [
30]. Additionally,
cd25 and
ctla4 were investigated as important T
reg-related genes as they are involved in IL-2 signaling and proliferation along with direct suppressive functions, respectively. This setup revealed a potential role for miR-210 in the downregulation of T
reg-associated genes (
foxp3 and
cd25;
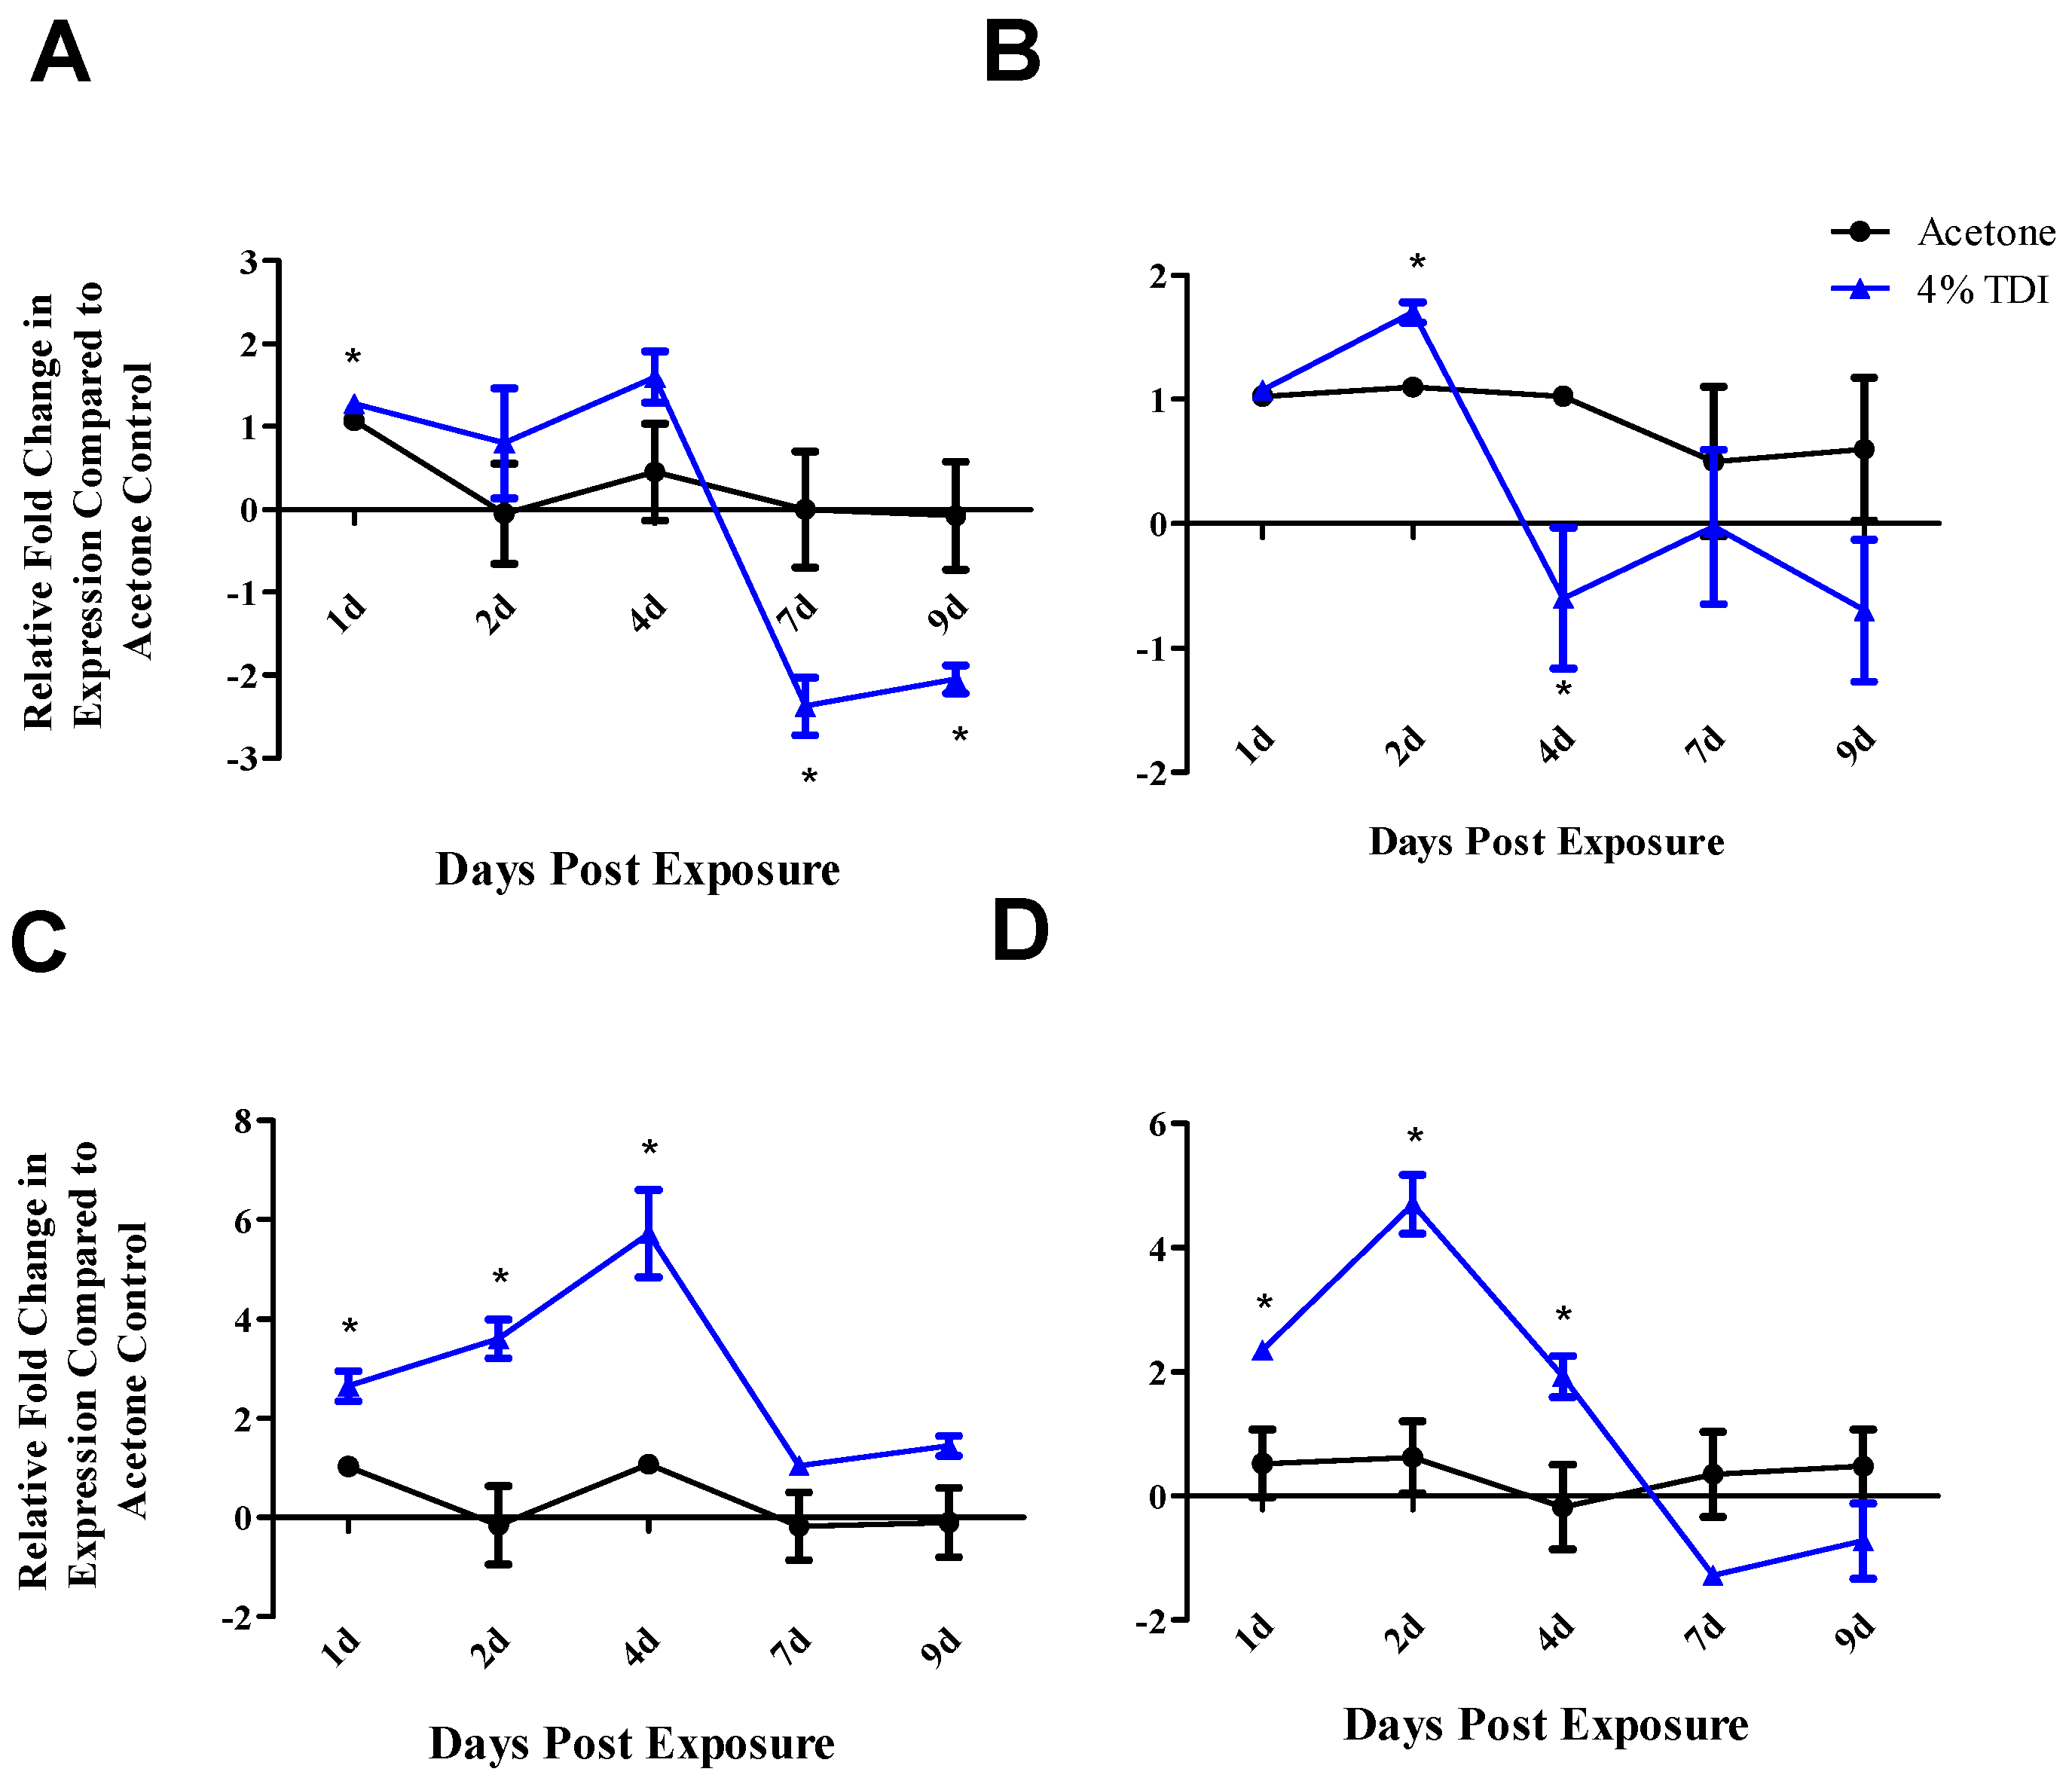
Figure 2B) following the addition of miR-210 mimic. In addition
foxp3 and
runx3 dLN expression decreased in the dLN at various time points following TDI exposure (
Figure 3A,B) which is consistent with our previously reported findings [
21]. The earlier decrease in
runx3 expression observed at four days post 4% TDI exposure may be reflective of the upstream signaling activity of this transcription factor in relation to
foxp3 (
Figure 3B). While the findings for the ex vivo assay did not reach statistical significance, further support for T
reg-associated genes as miRNA targets was provided by in vivo data. Interestingly, whole dLN expression of
ctla4 and
cd25 increased at one, two and four days post 4% TDI exposure (
Figure 3C,D) which is likely a reflection of the activation of both T
regs and conventional T cells as elevated protein expression of these molecules is observed in T
regs at these time points [
21] and would likely be increased in conventional T cells involved in TDI sensitization as well. In T
regs, decreases in
foxp3,
cd25 and
ctla4 were observed at two and seven days with
runx3 only being decreased at the earlier time point post TDI exposure (
Figure 4B). These early changes in T
reg factors provide further support that additional factors might be involved in T
reg regulation since peak increases in miR-210 occur later than two days; accordingly, miR-31 was shown be increased at this time point. In contrast to the transcript, the expression kinetics of Runx3 increased following TDI exposure (
Figure 4D). This expression pattern was similar to other T
reg proteins such as CD25 and Foxp3 (which are represented by the general T
reg population) and T
reg-specific CTLA4 expression, which have previously been investigated during TDI sensitization [
21]. The kinetics of T
regs bearing these molecules tended to peak at four days post TDI exposure with a relative decrease in both cellular frequency and number at seven days post TDI exposure [
21]. In relation to miR-210 expression kinetics, this data may suggest that miR-210 has a regulatory role on the T
reg subset, as its expression wanes in concert with the general T
reg population as well as CTLA4
+ and Runx3
+ T
regs. Additionally, miR-210 is a putative
runx3 target, suggesting a potential direct effect on this gene [
1]. Collectively, this data is suggestive of T
reg regulation with visible effects on the expression of proteins beginning at Day 7 post TDI exposure. miR-210 expression remains elevated in the dLN throughout nine days post 0.5% and 4% TDI exposure (
Figure 1A) and in T
regs at seven days post 0.5% and 4% TDI exposure (
Figure 4A).
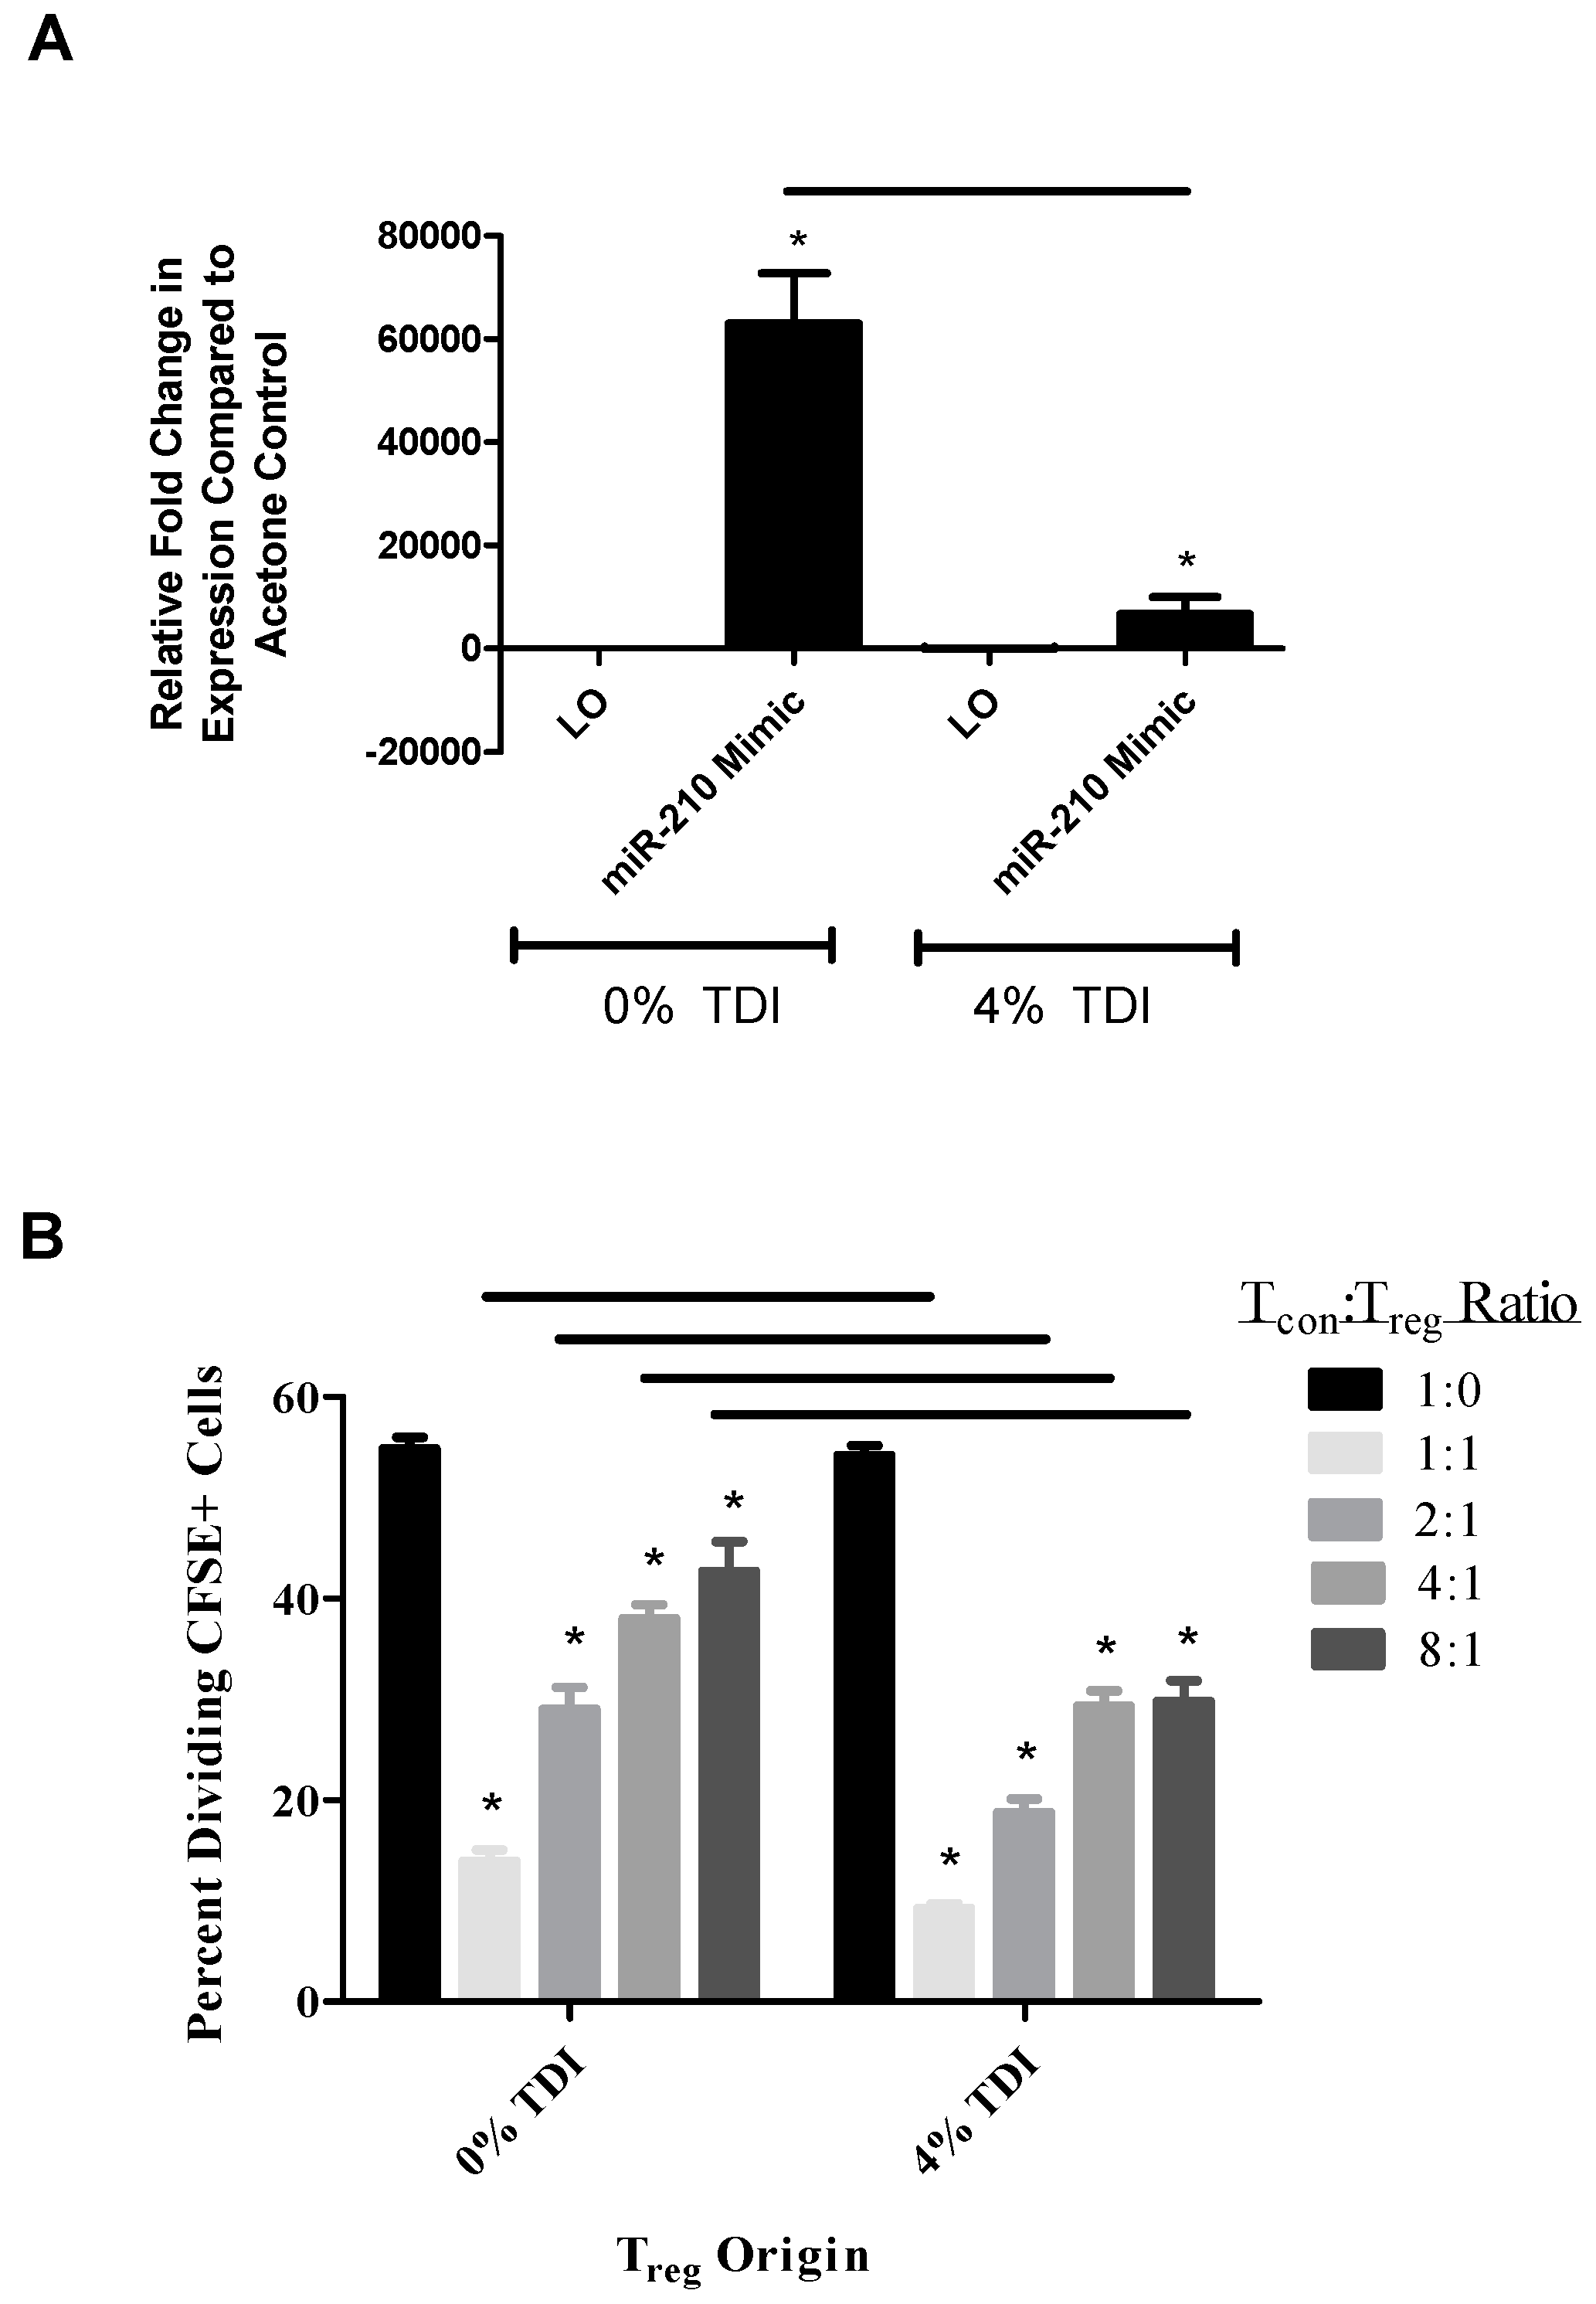
Due to the potential link between miR-210 and T
reg-related gene expression, the functional capabilities of T
regs (acetone and TDI-derived) were examined in the presence and absence of miR-210 mimic. Interestingly, it appeared that miR-210 levels were lower in wells containing T
regs from TDI-treated mice and miR-210 mimic compared to wells with acetone-derived T
regs and miR-210 mimic (
Figure 5A). The increased suppressive capability of TDI T
regs with miR-210 mimic (
Figure 5B) may be a reflection of reduced miR-210 levels, as we hypothesize that miR-210 is inhibiting T
reg differentiation and/or function. This finding suggested that other regulatory factors including other miRNAs might be involved in the regulation of T
reg function. Complex interactions and interplay have often been reported for other miRNAs [
31], therefore this concept was evaluated in the current study. Typically, direct miRNA–miRNA interactions are mediated by reverse complementary binding, resulting in the formation of duplexes [
31]. Additionally, indirect miRNA–miRNA interaction may occur via target gene interaction; e.g., if a miRNA targets a gene that induces a different miRNA, this miRNA is being regulated by its own species.
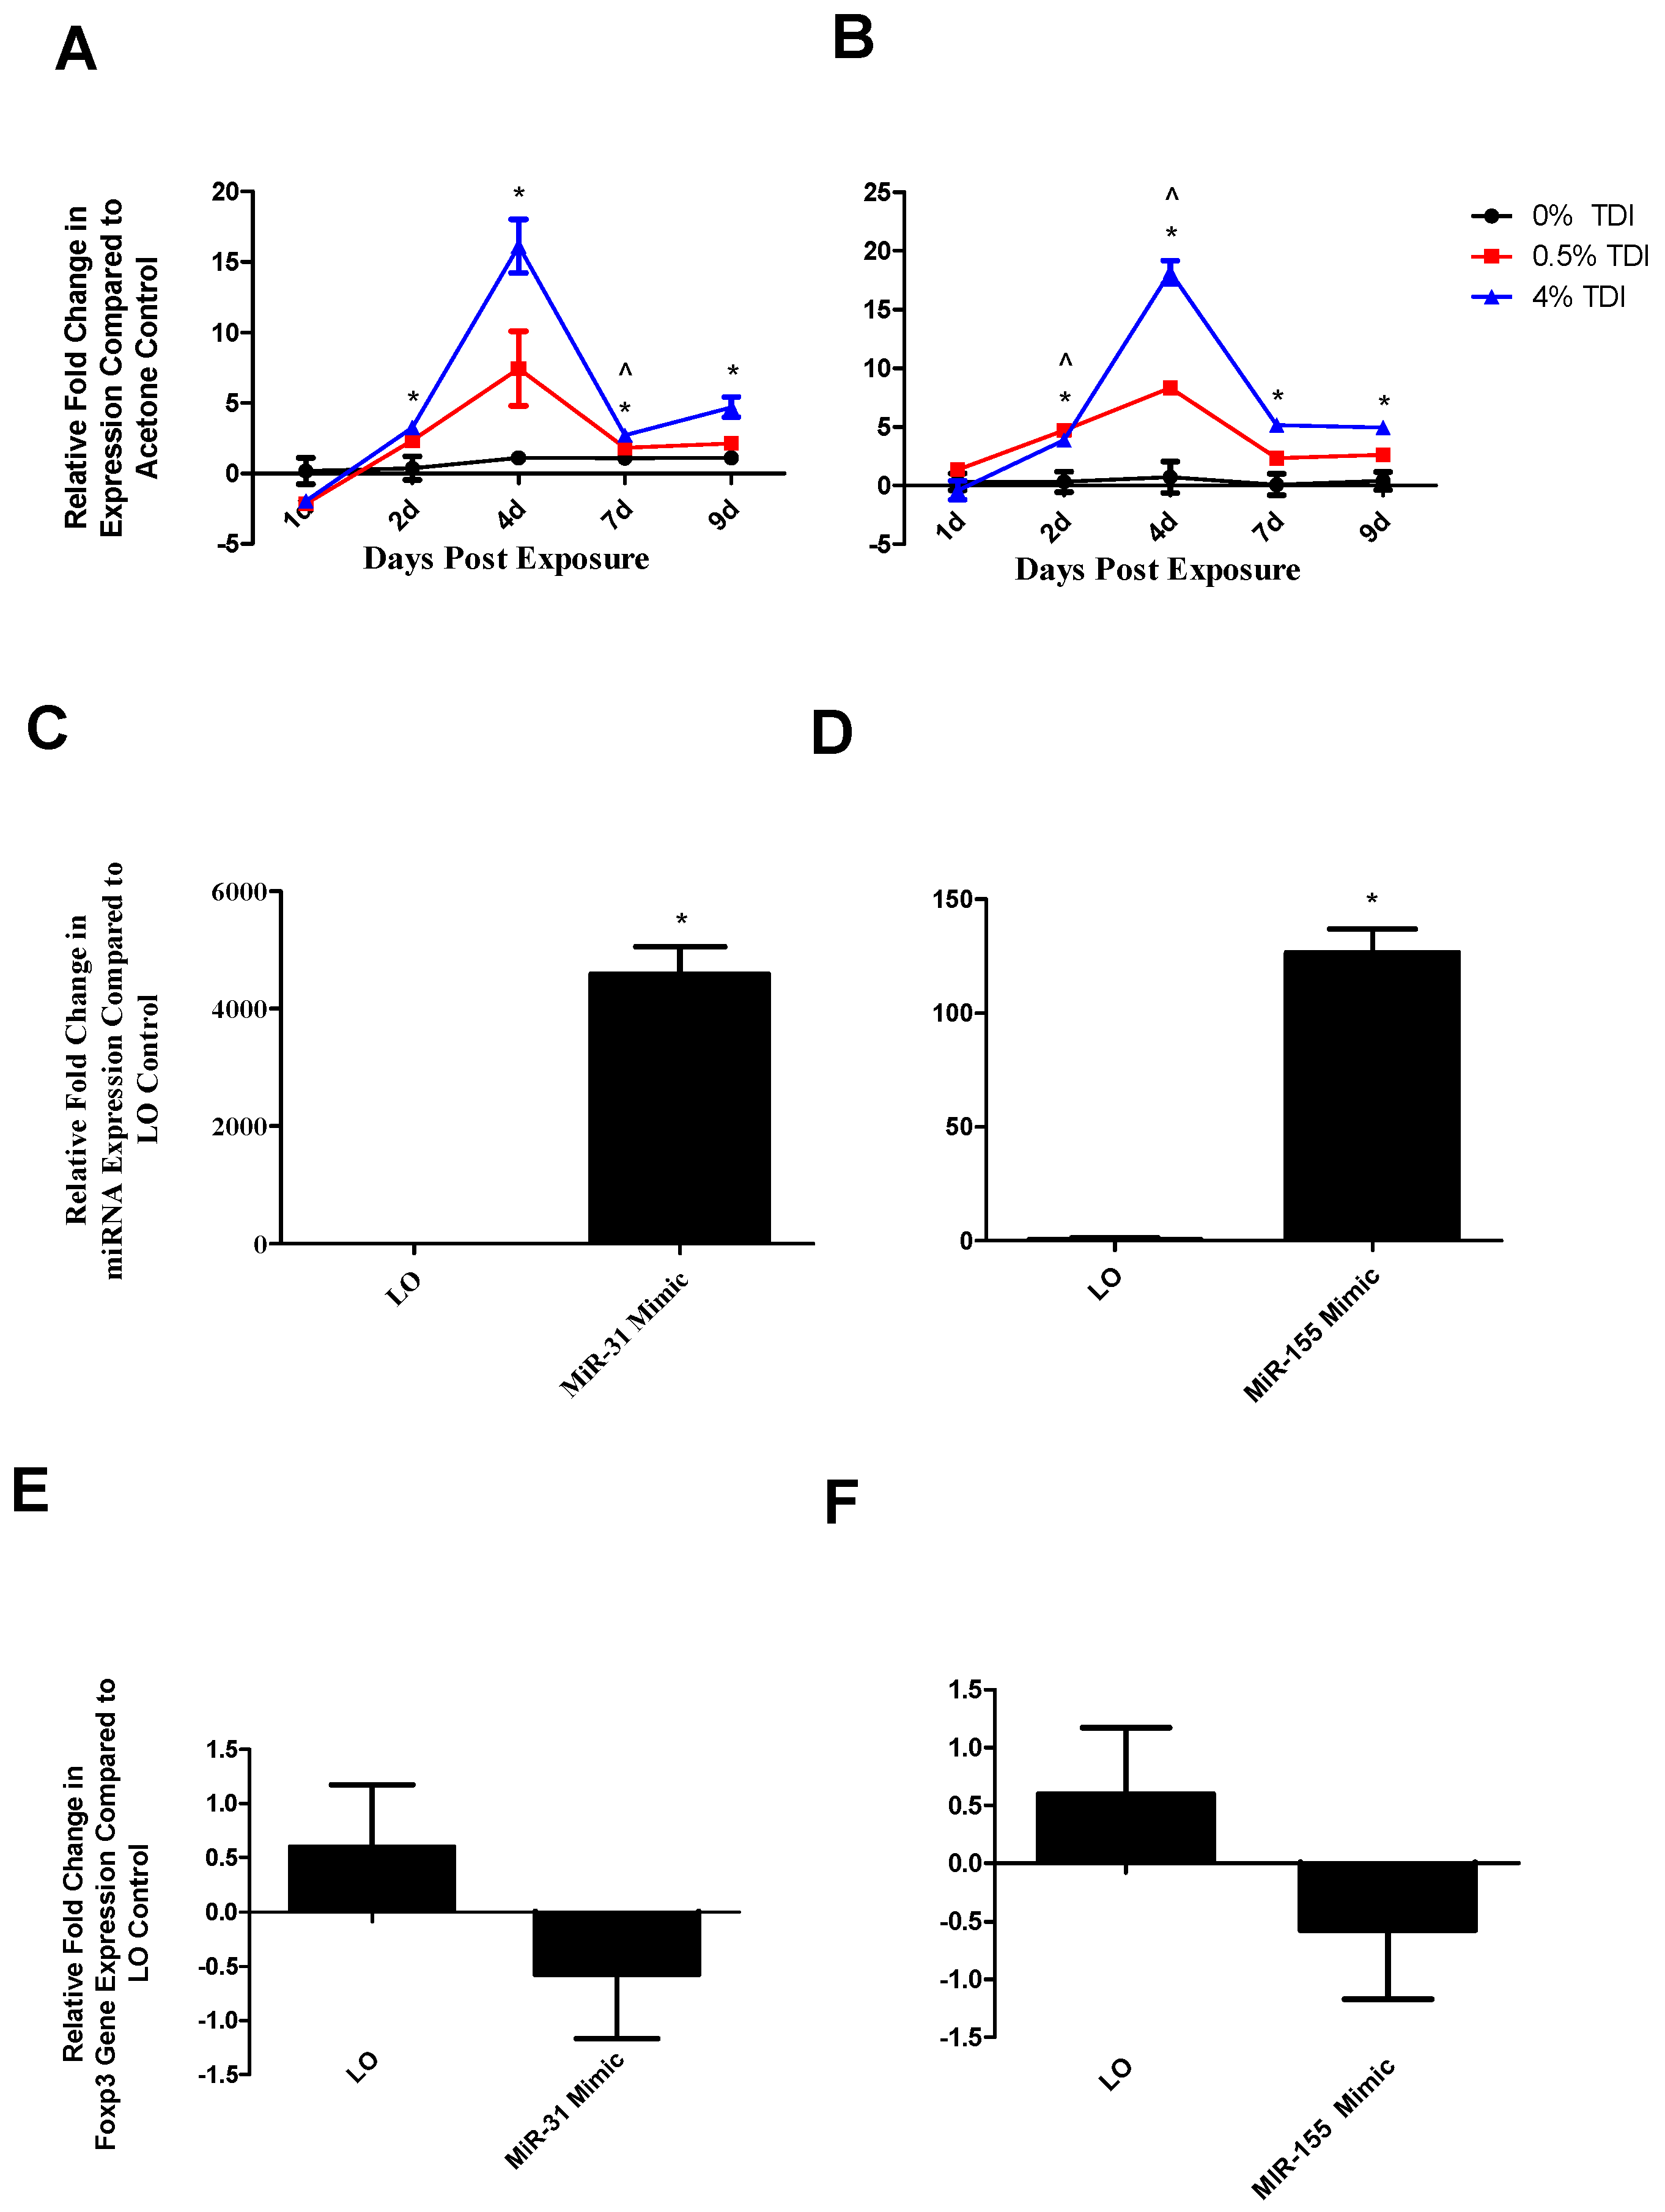
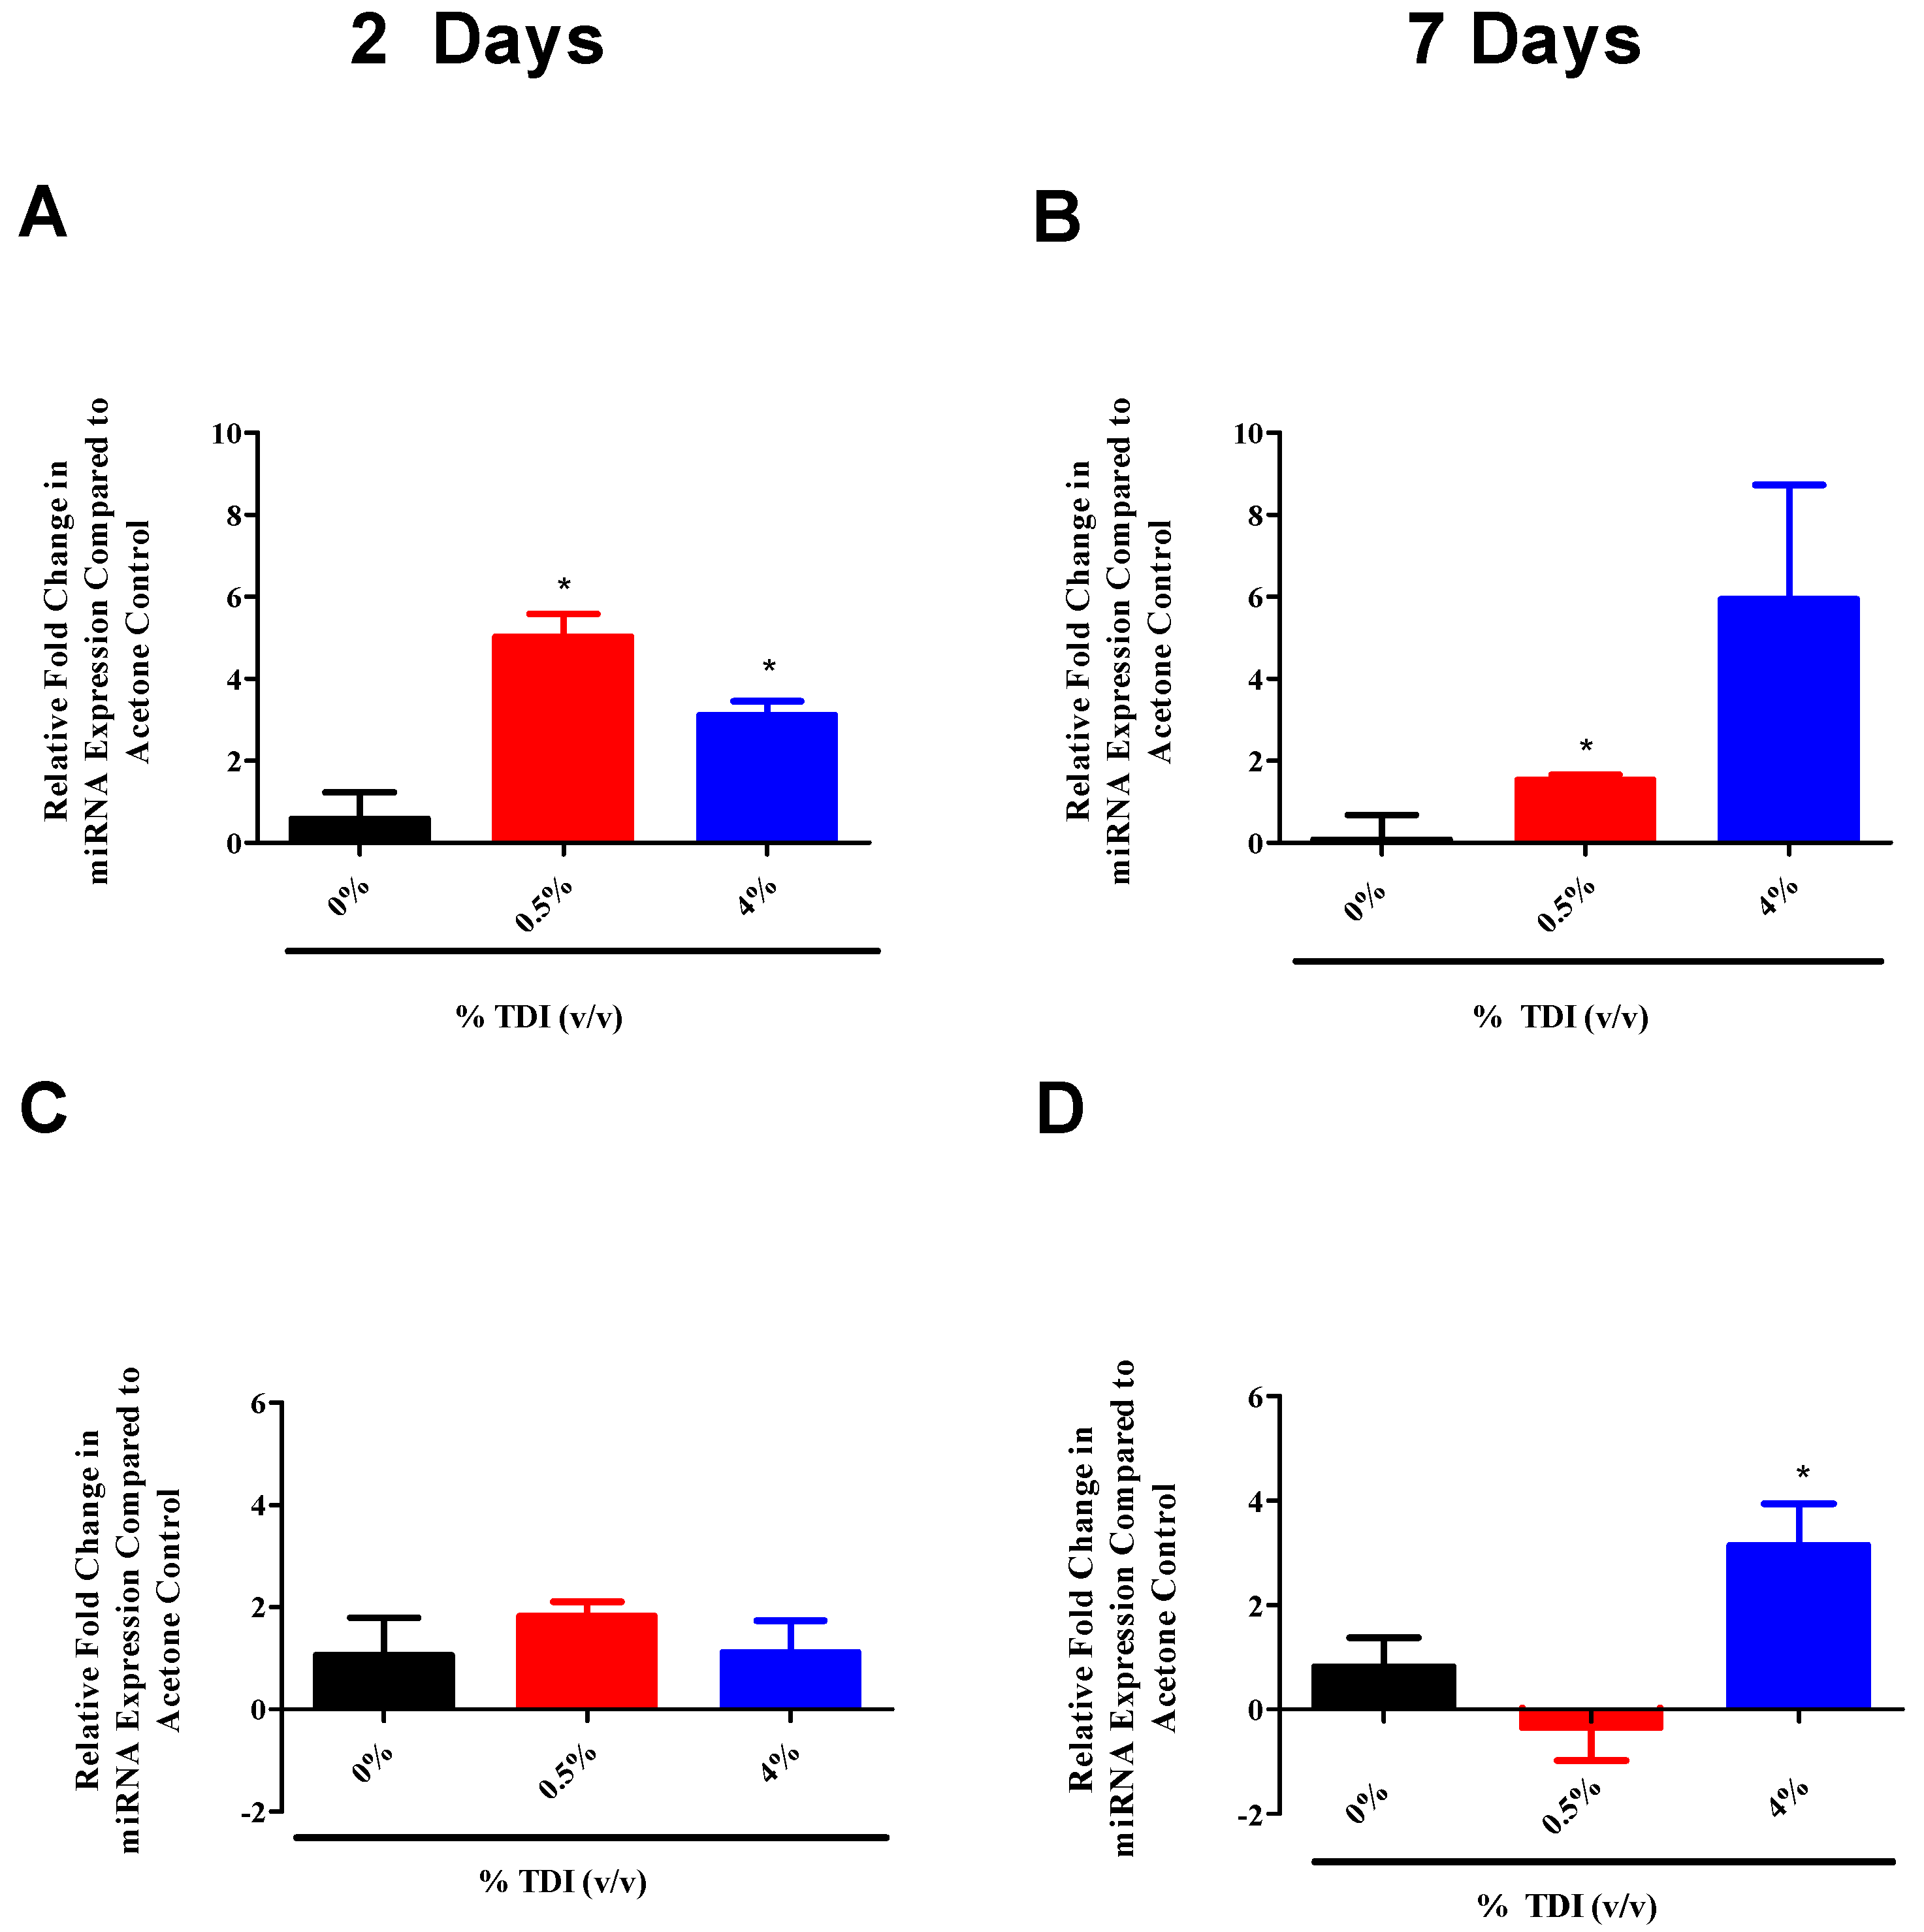
miRNA-31 and-155 were further investigated for the potential to regulate the expression of miR-210 as they were identified to increase at early time points in TDI sensitization in the dLN (
Figure 6A (miR-31) and B (miR-155)) and T
regs (
Figure 7A (miR-31)). Similarly to miR-210, miR-31 and -155 were shown to potentially downregulate
foxp3 expression in this assay (
Figure 6E,F). Although limitations in the assay sensitivities did not reflect significant changes, this may be reflective of a direct effect on
foxp3 or an indirect effect on this gene via other signaling pathways such as miR-210. These alterations are in accordance with recent findings pertaining to miRNA–mRNA interactions. miR-31 may indirectly target
foxp3, leading to suppressed iT
reg development [
19], accounting for the potential decreases in this gene evidenced following miR-31 mimic transfection. In addition, miR-31 increases earlier when more persistent decreases in
foxp3 were observed. Additionally, miR-155 expression appears to be controlled by
foxp3 in T
regs via binding to the intron within the DNA sequence encoding Bic, the precursor transcript of miR-155; accordingly, T
reg miR-155 levels have been shown to be highly responsive to
foxp3 levels [
32]. This regulation may be interrupted by abnormally high levels of miR-155 in the mimic transfection system, resulting in decreased
foxp3 expression in these conditions via signaling feedback. This data suggests that miR-31 and -155 may be influencing the expression of miR-210 and/or T
regs, possibly acting as early signaling mediators in the TDI sensitization response.
The lack of significance associated with the ex vivo experiments conducted in this work could be a reflection of experimental variability associated with similar assays and temporal discrepancies associated with signaling events. The ex vivo system displays several limitations, explaining the utilization of the in vivo TDI sensitization model in the target investigation as well. The T
reg-related gene alterations that were observed as a consequence of miRNA mimic transfections in this system may indicate direct and/or indirect targeting by the miRNA. We propose that for the majority of miRNA–mRNA interactions investigated in our model, regulation is indirect, as few, if any, putative binding sites were identified for many of the potential targets and the corresponding miRNA. For example, miR-210 is predicted to target the 3′ UTR of
runx3 [
1] and although we did not observe significant alterations in
runx3 expression following miR-210 mimic transfection in our ex vivo system, the in vivo expression kinetics of
runx3 suggest potential regulation. The ubiquitous nature of miRNAs and their involvement in various signaling processes accounts for their functional significance but can also cloud investigations into their mechanistic functions.
It is important to note that the increases in miRNA expression were not dependent on the irritant response, as dLN miR-210 levels significantly increased (
Figure 4A) following the non-irritating [
21] 0.5% TDI exposure. As 4% TDI exposure causes significant dermal irritation [
21], ear miR-210 expression was analyzed at both non-irritant (0.5%) and irritant (1%, 2%, and 4%) TDI concentrations, revealing significant increases in dLN at both non-irritant and irritant doses (
Figure 1A). In addition, other miRNAs including miR-22, -31, and -301a were also shown to increase significantly in expression regardless of the irritant status of the TDI dose (data not shown). This data prompts insight into the concept of the “two-signal” sensitization hypothesis which states that antigen delivery alone is insufficient for effective immunological priming but rather a second, innate signal is necessary to ensure the development of sensitization [
33,
34]. As noted in previous studies, the irritant response appears to be a prerequisite for strong sensitization responses in the case of dermal TDI sensitization [
21]. Regardless, the expression of multiple miRNAs in the dLN appears to be due to the sensitization response alone and not significantly influenced by the irritant component of this response, which may be revealing as to their supposed functional roles in the sensitization response and may suggest potential utility as biomarkers of sensitization.
These studies reveal a potential role for miR-210 in a murine model of dermal TDI sensitization (
Figure 8). Additionally, miR-31 and miR-155 were investigated for their regulatory potential in this response. The investigation of novel mediators of chemical-induced allergic disease is important for the overall understanding of the mechanisms involved in these responses. Therefore, this data may result in enhanced understanding of the mechanisms involved in chemical sensitization and could potentially aid in the development of hazard identification strategies for respiratory chemical sensitizers. In conclusion, we have demonstrated that miR-210 may negatively influence the differentiation and/or function of T
regs via direct targeting of
runx3 and/or indirect actions on other T
reg-related genes. These findings suggest that these miRNAs may work in concert to affect the differentiation and function of T
regs as well as the expression and function of miR-210.

