Differential Expression Patterns of Pleurotus ostreatus Catalase Genes during Developmental Stages and under Heat Stress
by

Lining Wang
1,2, 
Xiangli Wu
1,2,
Wei Gao
1,2,
Mengran Zhao
1,2,
Jinxia Zhang
1,2 and
Chenyang Huang
1,2,*
1
Institute of Agricultural Resources and Regional Planning, Chinese Academy of Agricultural Sciences, Beijing 100081, China
2
Key Laboratory of Microbial Resources, Ministry of Agriculture, Beijing 100081, China
*
Author to whom correspondence should be addressed.
Genes 2017, 8(11), 335; https://doi.org/10.3390/genes8110335
Submission received: 28 September 2017
/
Revised: 6 November 2017
/
Accepted: 17 November 2017
/
Published: 21 November 2017
(This article belongs to the Section Molecular Genetics and Genomics)
Abstract
:Catalases are ubiquitous hydrogen peroxide-detoxifying enzymes. They participate in fungal growth and development, such as mycelial growth and cellular differentiation, and in protecting fungi from oxidative damage under stressful conditions. To investigate the potential functions of catalases in Pleurotus ostreatus, we obtained two catalase genes from a draft genome sequence of P. ostreatus, and cloned and characterized them (Po-cat1 and Po-cat2). Po-cat1 (group II) and Po-cat2 (group III) encoded putative peptides of 745 and 528 amino acids, respectively. Furthermore, the gene structures were variant between Po-cat1 and Po-cat2. Further research revealed that these two catalase genes have divergent expression patterns during different developmental stages. Po-cat1/Po-cat1 was at a barely detectable level in mycelia, accumulated gradually during reproductive growth, and was maximal in separated spores. But no catalase activity of Po-cat1 was detected by native-PAGE during any part of the developmental stages. In contrast, high Po-cat2/Po-cat2 expression and Po-cat2 activity found in mycelia were gradually lost during reproductive growth, and at a minimal level in separated spores. In addition, these two genes responded differentially under 32 °C and 40 °C heat stresses. Po-cat1 was up-regulated under both temperature conditions, while Po-cat2 was up-regulated at 32 °C but down-regulated at 40 °C. The accumulation of catalase proteins correlated with gene expression. These results indicate that the two divergent catalases in P. ostreatus may play different roles during development and under heat stress.
1. Introduction
As central components of the enzymatic detoxification pathways, catalases can alleviate oxidative damage by catalyzing hydrogen peroxide (H2O2) to water and molecular oxygen [1,2]. Catalase is a tetramer metalloenzyme that is composed of four subunits and divided into three gene families, namely monofunctional catalases (typical heme catalases, KatEs), bifunctional catalases (heme catalase-peroxidases, KatGs), and manganese catalases (non-heme catalases, MnCats) [3]. Generally, multiple catalases exist in a single fungus, with each performing specialized functions in development and stress resistance [4,5,6,7]. For instance, Neurospora crassa has four catalases: CAT-1 and CAT-3 are two large subunit monofunctional catalases normally expressed in conidia and growing hyphae respectively; CAT-2 is a bifunctional (catalase-peroxidase) member expressed in heat-stressed mycelia; and CAT-4 is a small-subunit monofunctional catalase with unknown function [8,9]. For Aspergillus nidulans, CatA is a spore-specific catalase and is not developmentally regulated, CatB is developmentally regulated and is induced by H2O2, heat shock, and paraquat [10,11]. The catalase family of Beauveria bassiana consists of catA (spore-specific), catB (secreted), catP (peroxisomal), catC (cytoplasmic) and catD (secreted peroxidase/catalase) [12]. All of these catalases differ in phylogeny, structure and functional role in resistance toward environmental stresses.
Recently, the mechanisms of fruiting body development have been a popular topic in mushroom studies [13,14,15], and some development-related functional genes and signaling pathways have been identified and characterized, such as nicotinamide adenine dinucleotide phosphate oxidases [16], cytochrome P450 genes (CYPs) [17], superoxide dismutases (SODs) [18], and the cyclic AMP signaling pathway [19]. However, the role of catalase in the development of edible mushrooms has not been reported. Under the condition of horticultural facilities, high temperature is one of the most common environmental factors that can negatively affect the cultivation of mushrooms. Research on thermotolerance mechanism of edible mushrooms has revealed that heat stress can induce apoptosis-like cell death [20], and inhibit mycelial growth and fruiting body formation [21]. Lu et al. [22] and Meng et al. [23] reported elevated catalase activity in Agaricus bisporus and Pleurotus eryngii var. tuoliensis mycelia under heat stress, respectively. However, both studies were based on total catalase activity and did not distinguish specific functions of the separate catalases.
In China, Pleurotus ostreatus is mostly cultivated under horticultural facilities, and has the third largest production levels, with a yield of 590.18 million tons in 2015 according to the data of China Edible Fungi Association [24]. Insufficient information exists on mushroom catalases during development and under stress, and hence, further studies are needed to gain a deeper insight. In this study, we cloned and characterized the catalase genes of P. ostreatus and analyzed their expression patterns during different developmental stages and under heat stress.
2. Materials and Methods
2.1. Strains, Culture Conditions and Genome Sequence Information
The dikaryotic P. ostreatus strain CCMSSC00389 (China Center for Mushroom Spawn Standards and Control, Beijing, China) was used in this study and was maintained on potato dextrose agar (PDA) at 4 °C. The corresponding genome and protein sequences are available at DDBJ/EMBL/GenBank under the accession number MAYC00000000 [25,26]. Escherichia coli DH5α (Tiangen, Beijing, China) used for plasmid construction was grown in Luria-Bertani broth containing ampicillin (100 μg/mL) or kanamycin (50 μg/mL).
2.2. Catalase Identification, Gene Cloning and Sequence Analysis
Catalase genes were obtained from the annotated genome database of P. ostreatus strain PC15 [27], and two protein sequences were obtained: 1090819 and 1111887. Then, these two sequences were used to BLAST [28] against the CCMSSC00389 genome database to identify homologs. The nucleotide sequences were used to design primers (Po-cat1 and Po-cat2 in Table 1) to amplify the full-length sequences from CCMSSC00389 complementary DNA (cDNA) (details on RNA extraction and processing follow below). The amplified products were purified and cloned into the pGEM-T vector (Promega, Madison, WI, USA) for sequencing.
The theoretical isoelectric point and molecular weight were computed using the online Compute pI/Mw tool [29]. Transcription factor binding sites were predicted using PROMO [30]. SignalP 4.1 Server [31] was used to predict signal peptides. Conserved domains were analyzed using the online tool [32]. An additional 25 fungal catalase protein sequences were collected from GenBank and JGI. Multiple sequence alignment was performed using MUSCLE [33], and a neighbor-joining (NJ) phylogenetic tree was constructed using MEGA 6.0 [34] with 1000 bootstrap replicates. The gene structure was investigated using Gene Structure Draw Server [35] based on the coding sequences and corresponding genomic sequences.
2.3. Fruiting-Body Growth and Sample Collection
The strain CCMSSC00389 was cultured on PDA medium at 28 °C for 7 days. Afterward, a part of the mycelia was collected and the rest was inoculated onto culture compost, which contained 94% cottonseed hull, 5% wheat bran, 1% gypsum and a final water content of 65%. For fruiting body production, the temperature was set at 20 °C (day, 12 h at 500 lux) and at 10 °C (night, 12 h dark), and the room humidity was maintained at 85%. Three samples were collected, including primordia, fruiting bodies and separated spores. Five replicates were collected for each sample, and were frozen in liquid nitrogen immediately after collection.
2.4. Heat Stress Treatment
Mycelial growth rate was measured to select suitable heat stress treatment conditions. The determination of growth rate was performed as follows: fresh mycelia were inoculated on PDA medium and cultured at different temperatures (28, 30, 32, 34, 36, 38, and 40 °C) in the dark for 5 days, and then the mycelial diameters were measured. The growth rate was expressed as cm/d. According to the growth rate test and the results of Zhang et al. [36], 32 °C and 40 °C were selected for heat stress treatment. Intracellular H2O2 content was determined using the Hydrogen Peroxide Assay Kit (Nanjing Jiancheng Bioengineering Institute, Nanjing, China) according to the manufacturer’s instructions.
For heat stress treatment, the mycelia were first cultured on PDA at 28 °C in the dark for 5 days, and then were transferred to the corresponding temperature for a further 48 h incubation following method of Zhang et al. with cultures at 28 °C used as controls [36]. After treatment, mycelia of eight plates were quickly scraped, mixed, and then quickly frozen in liquid nitrogen and stored at −80 °C for further use.
2.5. Protein Extraction and Catalase Activity Assay
Proteins were extracted using Animal–Plant Total Protein Miniprep Kit (Tiandz, Beijing, China) following the manufacturer’s instructions. Proteins were quantified by measuring absorbance at 595 nm using the BCA Protein Assay Kit (Tiandz) with bovine serum albumin as the standard.
Catalase activity was determined using two different methods, namely, the non-denaturing polyacrylamide gel electrophoresis (native-PAGE) [37] and ultraviolet (UV) spectrophotometry [38]. The native-PAGE was performed following Wang et al. [39], and specific procedures are as follows: equal amounts of total protein (3 μg) were loaded into a 7.5% native polyacrylamide gel for electrophoretic separation, the gel was immersed in 7 mM H2O2 for 5 min, and then in a 1/1 mixture of freshly prepared 1% potassium hexacyanoferrate (III) and 1% iron (III) chloride hexahydrate. Catalase activity was visualized as a band where H2O2 was decomposed by catalase. For the UV spectrophotometry assay, catalase activity was measured as the rate of H2O2 decomposition at 240 nm at 25 °C. A 0.01 decrease in absorbance per second was defined as one unit, and catalase activity was expressed as the number of units per milligram of protein.
2.6. Western Blot Analysis
Western blot analysis was performed according to a previous study [40]. Briefly, equal amounts of total protein (20 μg) were loaded into the protein lane and separated in a 12% (w/v) sodium dodecyl sulfate PAGE gel. After electrophoresis, proteins were transferred onto a polyvinylidene fluoride membrane. Western blot analysis was performed using antibodies against Po-cat1 and Po-cat2, and glyceraldehyde 3-phosphate dehydrogenase (GAPDH, PC15_1090663 (jgi)) was used as control.
2.7. RNA Extraction, Reverse Transcription and Quantitative PCR (qPCR)
Total RNA was extracted from 30 mg of −80 °C frozen tissue using the E.Z.N.A. Plant RNA Kit (Omega Bio-Tek, Norcross, GA, USA) following the extraction method for fungal samples, with the addition of DNase I to eliminate genomic DNA. The integrity and concentration of RNA were estimated with an Agilent 2100 bioanalyzer (Agilent Technologies, Palo Alto, CA, USA) using the Total RNA Nano Kit (RNA 6000 Nano LabChip) [41]. The purity of total RNA was measured based on the 260/280 nm absorbance ratio on a Nanodrop 2000 (Thermo Scientific, Wilmington, DC, USA). First strand cDNA was synthesized using the TransScript One-Step genomic DNA Removal and cDNA Synthesis SuperMix Kit (TransGen Biotech, Beijing, China) according to the manufacturer’s instructions.
The KAPA SYBR FAST qPCR Master Mix Kit (Kapa Biosystems, Wilmington, MA, USA) and the ABI 7500 Real-Time PCR amplifier (Applied Biosystems, Foster City, CA, USA) were used for qPCR. All reactions were carried out at a total volume of 20 μL, which contained 2 μL of diluted cDNA, 0.8 μL of primer mix (10 μM), 6.8 μL of nuclease-free water, 0.4 μL ROX Low and 10 μL of SYBR Green mix. All reactions were performed in triplicate. The qPCR amplification procedures were as follows: 95 °C for 3 min, 40 cycles of 95 °C for 3 s, 60 °C for 32 s, and a final extension at 72 °C for 30 s. The GAPDH-encoding gene gapdh was used as the reference. Primers were designed using the DNAMAN software v5.2.2 (Lynnon LLC, San Ramon, CA, USA) (Table 1) and were synthesized by Sangon Biotech Co., Ltd. (Shanghai, China).
2.8 Liquid Chromatogram-Tandem Mass Spectrometry Analysis
Protein bands were cut out directly from the native-PAGE gel and treated with enzyme digestion solution. Afterward, liquid chromatogram-tandem mass spectrometry (LC-MS/MS) was performed to collect and analyze peptide fingerprints. The peptides were searched against the protein sequence of CCMSSC00389 using BLAST [28] to determine protein identity.
2.9. Data Analysis
The relative expression of the genes was calculated using the 2−ΔΔCt method [42]. Gene expression levels in the mycelia was used as a reference in the ΔΔCt calculation during different developmental stages, and mycelia cultured at 28 °C was used as a reference in heat stress treatment. The means and standard deviations were calculated from the experiments performed in triplicate. For comparison between the different groups, gene expressions with ≥2-fold changes (up or down) were considered to be different [43]. For other data (catalase activity, mycelial growth rate and intracellular H2O2 content), parametric one-way analysis of variance (ANOVA) followed by Duncan’s test was used to calculate significant differences among different groups (p < 0.05).
3. Results
3.1. Cloning and Analysis of Catalase Encoding Genes
Two catalase genes were identified in the P. ostreatus genome, and were named Po-cat1 and Po-cat2. The cDNA full length sequences of Po-cat1 and Po-cat2 were 2238 and 1587 bp, respectively, and DNA sequence analysis revealed eight exons interrupted by seven introns in both genes. The Po-cat1 and Po-cat2 sequences were assigned GenBank accession numbers MF491446 and MF491447, respectively. Po-cat1 encoded a putative 745-amino-acid polypeptide (Po-cat1) of 82.92 kDa with a predicted isoelectric point of 6.02 and Po-cat2 encoded a putative 528-amino-acid polypeptide (Po-cat2) of 59.72 kDa with a predicted isoelectric point of 6.67. Domain analyses revealed that a heme binding pocket and a tetramer interface in both Po-cat1 and Po-cat2, but an NADPH binding site only in Po-cat2. Both Po-cat1 and Po-cat2 showed no obvious secretory signal sequence. The promoter regions of both Po-cat1 and Po-cat2 had binding sites for heat shock factor 1 (Hsf1) which is a stress response transcription factor playing important roles in development and stress resistance [44].
A total of 29 fungal catalase sequences were used for phylogenetic analyses, and these sequences clustered into three clades of group II, group III and catalase-peroxidases (Figure 1A). Po-cat1 and Po-cat2 were monofunctional catalases, and were classified into group II (large subunit enzymes) and group III (small subunit enzymes), respectively. The phylogenetic tree showed that Po-cat1 and Po-cat2 had higher similarities to catalase protein sequences of other mushrooms or fungi than to each other. Po-cat1 had the closest relationship to P. ostreatus PC15_1111887 (jgi) and P. eryngii ATCC 90797_1418139 (jgi), while Po-cat2 had the closest relationship to P. ostreatus PC15_1090819 (jgi) and P. eryngii ATCC 90797_1568006 (jgi).
Po-cat1 had an identical gene structure with the gene encoding PC15_1111887, and Po-cat2 had an identical gene structure with the gene encoding PC15_1090819 (Figure 1B). However, P. ostreatus and P. eryngii had different gene structures even though their catalase protein sequences were highly similar. Phylogenetic and gene structure analyses provided evidence that Po-cat1 and Po-cat2 have high identity to catalases of other fungal species, but are not genetically closely related to one another.
3.2. Expression Patterns of Catalases during Different Developmental Stages of P. ostreatus
To investigate the expression patterns of catalases in P. ostreatus during development, the detection of mRNA level, protein accumulation and catalase activity were performed. As revealed by UV spectrophotometry and native-PAGE, the highest catalase activity was observed in mycelia, followed by primordia, then fruiting bodies, and reached the minimal level in the separated spores (Figure 2A,B). Only one catalytic band was detected by native-PAGE (Figure 2B), while there are two catalase genes found in the genome. The results of LC-MS/MS verified that these observed bands were polypeptides of Po-cat2 (the information on detected Po-cat2 polypeptides in mycelia can be found in supplementary Figure S1). This suggests that, of the two catalases, only Po-cat2 plays a catalytic function in decomposing H2O2 during any part of the life cycle of P. ostreatus.
The analyses of quantitative real-time PCR revealed that the mRNA levels of Po-cat1 were up-regulated significantly and continuously during developmental stages, being 44-fold (primordia), 70-fold (fruiting bodies), and 323-fold (spores) higher than that of the mycelia (Figure 2C). Expression of Po-cat1 protein illustrated by Western blot showed the same trend with mRNA of Po-cat1, which was hardly detectable in mycelia and maximal in spores (Figure 2E). The extremely high mRNA and protein expression levels of Po-cat1 were seemingly inconsistent with the lack of observed catalase activity (Figure 2B). The mRNA level of Po-cat2 was down-regulated, being 0.14-fold (primordia), 0.07-fold (fruiting bodies), and 0.03-fold (spores) of that of the mycelia (Figure 2D). Expression of the Po-cat2 protein showed a similar pattern, being highest in mycelia and lowest in spores. For Po-cat2, the consistent expression trends of mRNA, protein and enzyme activity suggest that Po-cat2 was possibly regulated at the transcriptional level.
3.3. Selection of Heat Stress Conditions
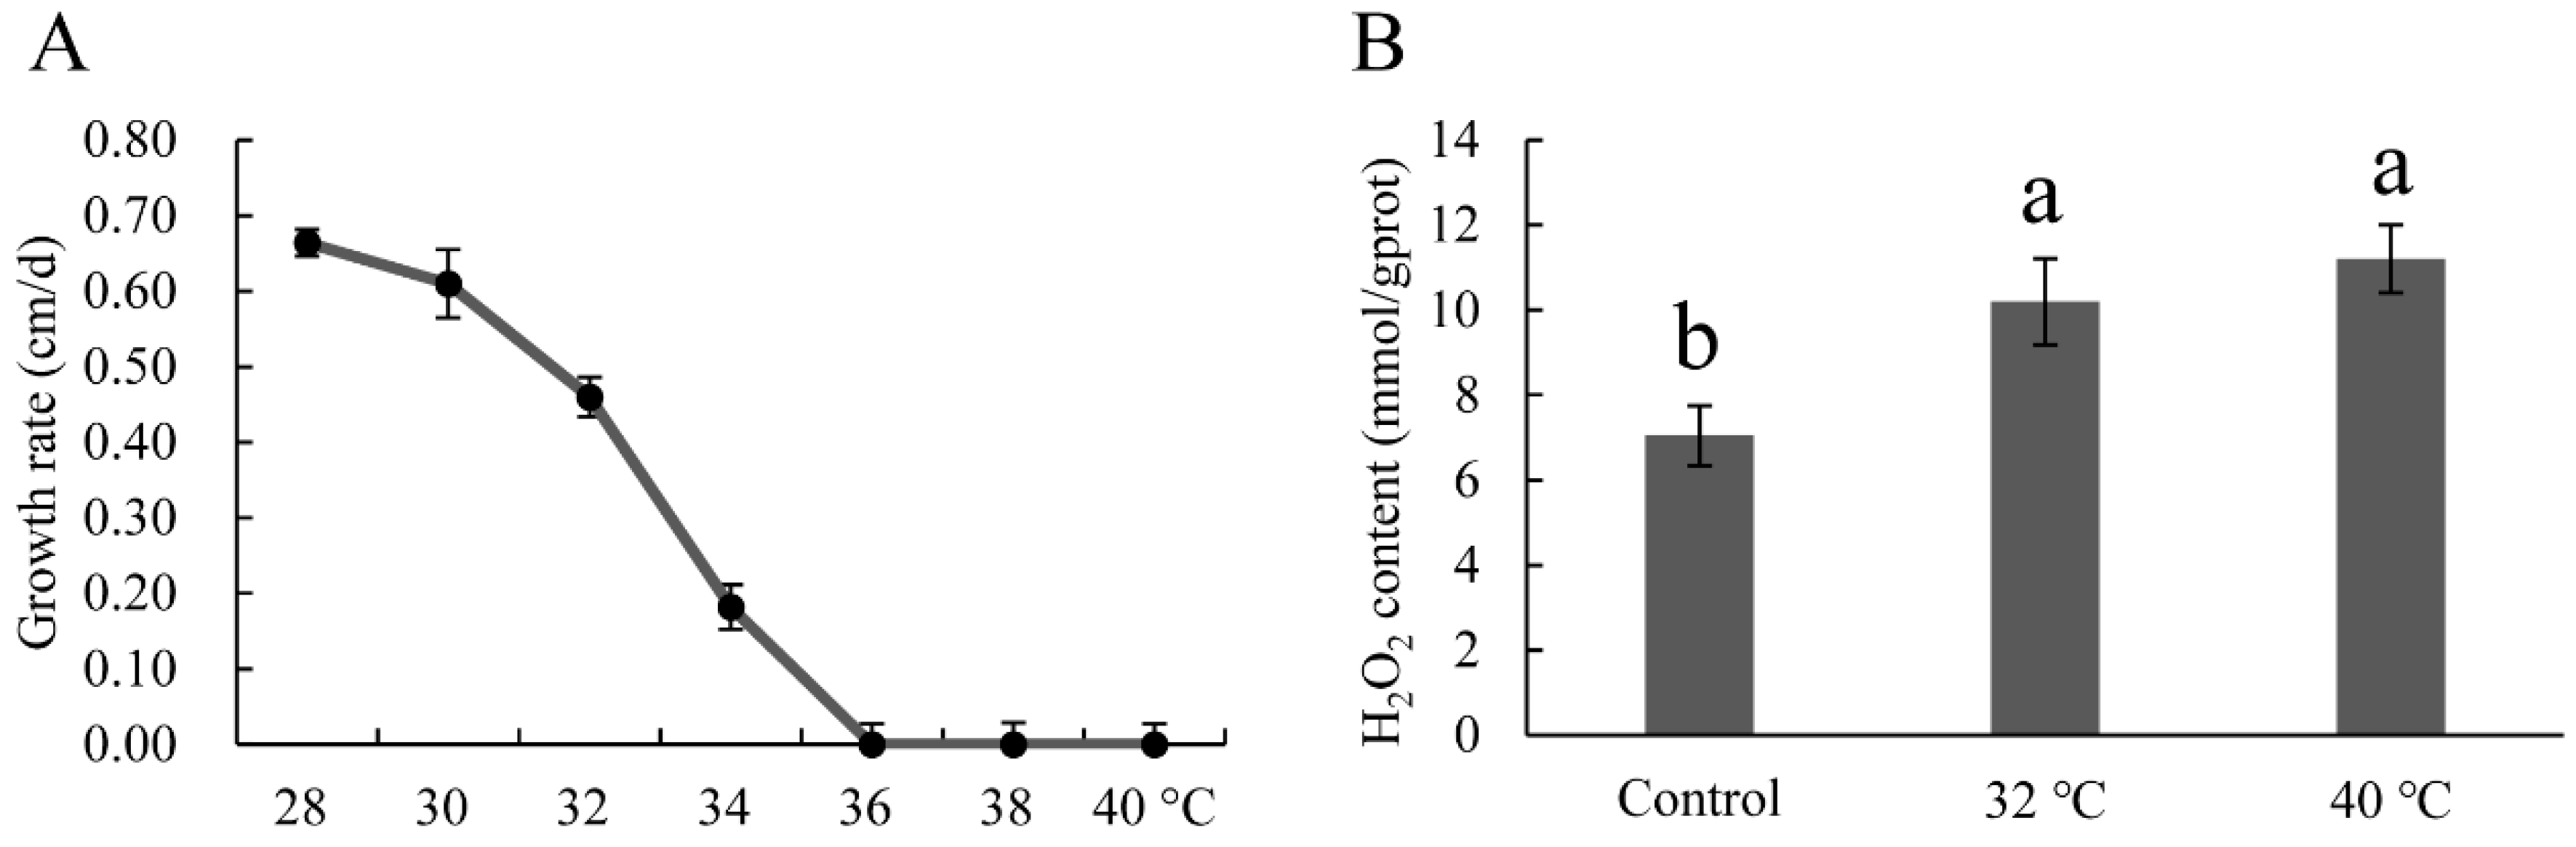
To select suitable heat stress conditions, a mycelial growth rate test was performed. As shown in Figure 3A, mycelial growth rate decreased gradually with the increase in temperature, and reached zero at 36 °C. According to the results of Zhang et al., 40 °C is the optimal heat stress temperature for P. ostreatus [36]. The two temperatures, 32 °C at which the mycelial growth was affected slightly, and 40 °C at which the mycelial growth was completely inhibited were used to conduct the heat stress treatment. Hydrogen peroxide, which is an indicator of oxidative damage, was measured. In this study, the H2O2 contents under 32 °C and 40 °C were higher than that of the control (28 °C), indicating that oxidative damage occurred under both heat stress conditions.
3.4. Expression Patterns of Catalases under Heat Stress
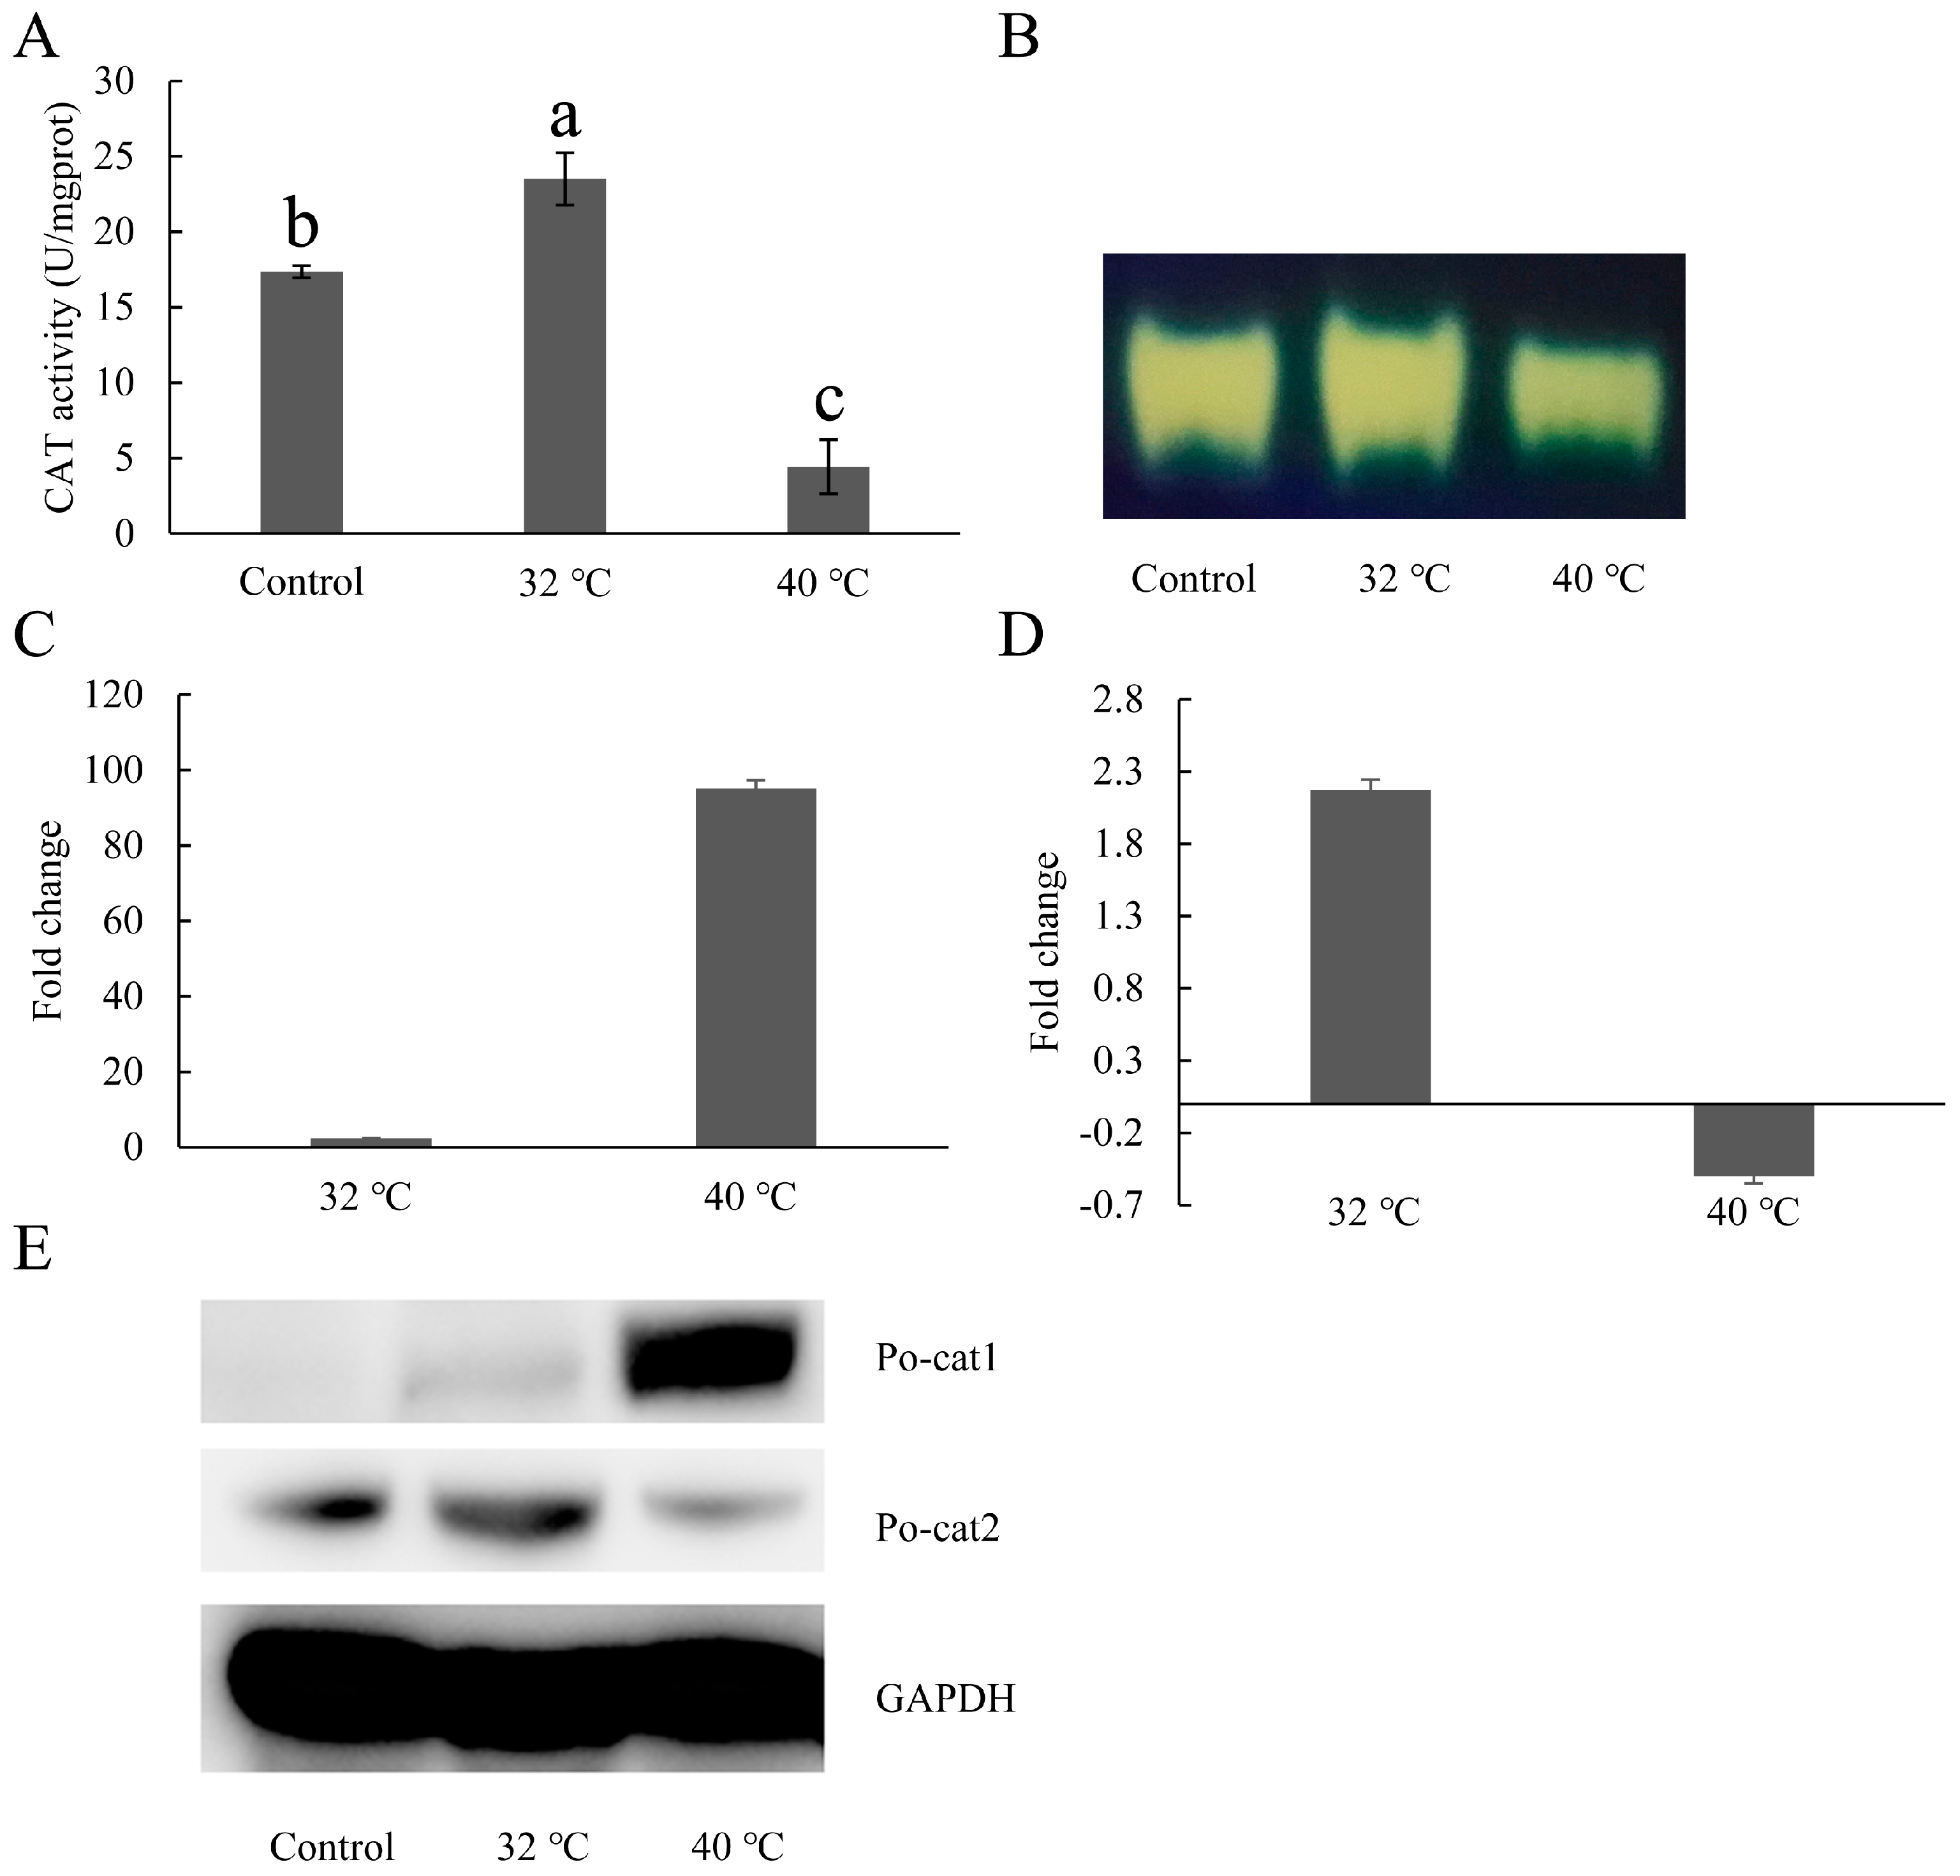
To investigate the expression patterns of catalases in P. ostreatus under heat stress, mRNA level, protein accumulation and catalase activity were assessed. Catalase activity (Po-cat2 catalase activity) increased under 32 °C, but decreased under 40 °C (Figure 4A,B). The transcript levels of Po-cat1 and Po-cat2 in the 32 °C-treated mycelia increased by 2.3-fold and 2.1-fold compared to that of the 28 °C control, respectively (Figure 4C). The transcript levels of Po-cat1 increased by 95-fold while Po-cat2 decreased by 0.5-fold under 40 °C heat stress (Figure 4D). Protein accumulation of Po-cat1 and Po-cat2 showed the same expression profiles as mRNA levels. The above results suggest that both the Po-cat1 and Po-cat2 are involved in heat resistance but in different roles.
4. Discussion
Catalases are ubiquitous in nature and are found in all kingdoms of life. The roles of catalase homologs are of great research interest because their specific functions have not been completely elucidated. Twenty nine catalase sequences were used for phylogenetic analysis of which fifteen sequences were from mushroom species. As shown in Figure 1A, mushroom catalases exhibited different levels of diversity. Our sequence analysis showed significant differences between Po-cat1 and Po-cat2. These two sequences were not found to be phylogenetically closely related to each other and have been classified into different gene families. In the phylogenetic tree, they appear as paralogs, indicating a more ancient origin rather than recent gene duplication.
Po-cat1/Po-cat1 and Po-cat2/Po-cat2 showed opposite expression trends during different stages of development. Po-cat1/Po-cat1 was barely detectable in growing mycelia, highly induced during reproductive growth, and maximal in spores, and thus, Po-cat1 is considered as a spore-specific catalase which might participate in spore-related processes. Our clustering analysis supports this view, as spore-specific catalases of other fungi clustered into the same branch with Po-cat1, such as CatA of Aspergillus fumigatus (EAL85650) [12,45], CAT-1 of N. crassa (Q9C168) [9], and CatA of A. nidulans (P55305) [10]. The high accumulation of Po-cat1/Po-cat1 showed no detectable catalase activity in the tested conditions. This phenomenon is quite similar to the catalases of B. bassiana and Cryptococcus neoformans. In B. bassiana, the five catalases had different levels of transcripts, but it seems that only catB and catP could be normally active, since only two catalase-active bands rather than the expected five bands were visible on the native-PAGE [12]. C. neoformans possesses four catalases (CAT1, CAT2, CAT3, and CAT4) and transcripts for each of them can be detected by qPCR, but only Cat1 was a functionally active catalase under both normal and stressful conditions [46]. In this study, we speculate that no active Po-cat1 complex (tetramer) is formed, or that it engages in other catalytic functions, and this needs further validation. Po-cat2 was the predominant catalytic catalase enzyme during the entire life cycle, accumulating maximally in mycelia, gradually decreasing during reproductive growth, and minimal in spores. This phenomenon is different in A. nidulans [11], Paracoccidioides brasiliensis [4], and N. crassa [47]. All these three species have high catalase activity both in spores and during vegetative growth, which are represented by different catalases. The low activity in spores of P. ostreatus may suggest that huge differences in catalase may exist between mushrooms and other fungi. In addition, alternative H2O2 detoxification pathways, such as glutathione peroxidase and thioredoxin reductase systems, may function in spores of P. ostreatus [48].
Several researchers have reported the induction of catalases during heat stress for multiple species, such as Saccharomyces cerevisiae [49], Rhodotorula mucilaginosa [50], A. nidulans [10], Penicillium marneffei [51], and P. brasiliensis [4]. In this study, the two catalase genes responded differentially under 32 °C and 40 °C heat stresses. Po-cat1/Po-cat1 was significantly induced during heat stress, especially under 40 °C, but its high accumulation was not associated with any catalase activity. Po-cat2/Po-cat2 was induced under 32 °C heat stress, and the increased Po-cat2 activity could enhance the resistance of mycelia to adverse external environmental conditions. But Po-cat2 activity decreased under 40 °C heat stress. This is interesting, because one would expect that under this more stressful condition, the mycelia would synthesize more enzymes required for the decomposition of H2O2. In fact, decreased catalase activity under abiotic stresses has been found in many plants and fungi, such as Pisum sativum L. [52], Brassica napus [53], Triticum aestivum L. [54], and some strains of Candida species [55]. One possible reason for the decrease in Po-cat2 activity may be the inhibition of overall protein synthesis under stressful conditions, as has been previously shown [56]. Another possible reason may be that alternative H2O2 detoxification pathways function in this situation [48].
5. Conclusions
In this study, we cloned and characterized the P. ostreatus genes, Po-cat1 and Po-cat2, which show sequence similarity to catalase genes. We analyzed their expression patterns during several growth stages and under heat stress. These two genes are diverse in structure and have diametrically opposed expression patterns during different developmental stages, and they also respond differentially under 32 °C and 40 °C heat stress conditions. Only Po-cat2 plays a catalytic function in decomposing H2O2 during any part of the life cycle of P. ostreatus, while the function of Po-cat1 is unknown. Further studies are required to reveal the specific function of Po-cat1 which has high expression during some stages but no detectable catalase activity. These results indicate that the two genes may play different roles during development and under heat stress. This study provides a greater understanding of the biological functions of catalases in edible mushrooms. This study also provides a reference for the elucidation of the mechanisms involved in mushroom development and stress resistance.
Supplementary Materials
The following are available online at www.mdpi.com/2073-4425/8/11/335/s1. Figure S1: The information on detected Po-cat2 polypeptides in mycelia by LC-MS/MS analysis.
Acknowledgments
This work was financially supported by National Basic Research Program of China (No. 2014CB138303) and China Agriculture Research System (CARS20). We would like to thank Tom Hsiang (University of Guelph, Canada) for critical comments on this manuscript.
Author Contributions
C.H. and J.Z. conceived and designed the research framework; L.W. and X.W. performed the experiments; L.W. and M.Z. analyzed the data; L.W. and C.H. wrote the paper; W.G. made revisions to the manuscript. All the authors have read and approved the final manuscript.
Conflicts of Interest
The authors declare no conflict of interest.
References
- Willekens, H.; Inzé, D.; Van Montagu, M.; van Camp, W. Catalases in plants. Mol. Breed. 1995, 1, 207–228. [Google Scholar] [CrossRef]
- Ding, M.; Kwok, L.Y.; Schluter, D.; Clayton, C.; Soldati, D. The antioxidant systems in Toxoplasma gondii and the role of cytosolic catalase in defence against oxidative injury. Mol. Microbiol. 2004, 51, 47–61. [Google Scholar] [CrossRef] [PubMed]
- Zámocký, M.; Gasselhuber, B.; Furtmüller, P.G.; Obinger, C. Molecular evolution of hydrogen peroxide degrading enzymes. Arch. Biochem. Biophys. 2012, 525, 131–144. [Google Scholar] [CrossRef] [PubMed]
- Chagas, R.F.; Bailao, A.M.; Pereira, M.; Winters, M.S.; Smullian, A.G.; Deepe, G.S., Jr.; de Almeida Soares, C.M. The catalases of Paracoccidioides brasiliensis are differentially regulated: Protein activity and transcript analysis. Fungal Genet. Biol. 2008, 45, 1470–1478. [Google Scholar] [CrossRef] [PubMed]
- Blackman, L.M.; Hardham, A.R. Regulation of catalase activity and gene expression during Phytophthora nicotianae development and infection of tobacco. Mol. Plant Pathol. 2008, 9, 495–510. [Google Scholar] [CrossRef] [PubMed]
- Scherer, M.; Wei, H.; Liese, R.; Fischer, R. Aspergillus nidulans catalase-peroxidase gene (cpeA) is transcriptionally induced during sexual development through the transcription factor StuA. Eukaryot. Cell 2002, 1, 725–735. [Google Scholar] [CrossRef] [PubMed]
- Bussink, H.-J.; Oliver, R. Identification of two highly divergent catalase genes in the fungal tomato pathogen, Cladosporium fulvum. Eur. J. Biochem. 2001, 268, 15–24. [Google Scholar] [CrossRef] [PubMed]
- Yamashita, K.; Shiozawa, A.; Banno, S.; Fukumori, F.; Ichiishi, A.; Kimura, M.; Fujimura, M. Involvement of OS-2 MAP kinase in regulation of the large-subunit catalases CAT-1 and CAT-3 in Neurospora crassa. Genes Genet. Syst. 2007, 82, 301–310. [Google Scholar] [CrossRef] [PubMed]
- Noguchi, R.; Banno, S.; Ichikawa, R.; Fukumori, F.; Ichiishi, A.; Kimura, M.; Yamaguchi, I.; Fujimura, M. Identification of OS-2 MAP kinase-dependent genes induced in response to osmotic stress, antifungal agent fludioxonil, and heat shock in Neurospora crassa. Fungal Genet. Biol. 2007, 44, 208–218. [Google Scholar] [CrossRef] [PubMed]
- Kawasaki, L.; Wysong, D.; Diamond, R.; Aguirre, J. Two divergent catalase genes are differentially regulated during Aspergillus nidulans development and oxidative stress. J. Bacteriol. 1997, 179, 3284–3292. [Google Scholar] [CrossRef] [PubMed]
- Navarro, R.E.; Stringer, M.A.; Hansberg, W.; Timberlake, W.E.; Aguirre, J. CatA, a new Aspergillus nidulans gene encoding a developmentally regulated catalase. Curr. Genet. 1996, 29, 352–359. [Google Scholar] [CrossRef] [PubMed]
- Wang, Z.L.; Zhang, L.B.; Ying, S.H.; Feng, M.G. Catalases play differentiated roles in the adaptation of a fungal entomopathogen to environmental stresses. Environ. Microbiol. 2013, 15, 409–418. [Google Scholar] [CrossRef] [PubMed]
- Zhang, J.; Ren, A.; Chen, H.; Zhao, M.; Shi, L.; Chen, M.; Wang, H.; Feng, Z. Transcriptome analysis and its application in identifying genes associated with fruiting body development in basidiomycete Hypsizygus marmoreus. PLoS ONE 2015, 10, e0123025. [Google Scholar] [CrossRef] [PubMed]
- Joh, J.H.; Lee, S.H.; Lee, J.S.; Kim, K.H.; Jeong, S.J.; Youn, W.H.; Kim, N.K.; Son, E.S.; Cho, Y.S.; Yoo, Y.B.; et al. Isolation of genes expressed during the developmental stages of the oyster mushroom, Pleurotus ostreatus, using expressed sequence tags. FEMS Microbiol. Lett. 2007, 276, 19–25. [Google Scholar] [CrossRef] [PubMed]
- Cheng, C.K.; Au, C.H.; Wilke, S.K.; Stajich, J.E.; Zolan, M.E.; Pukkila, P.J.; Kwan, H.S. 5′-Serial Analysis of Gene Expression studies reveal a transcriptomic switch during fruiting body development in Coprinopsis cinerea. BMC Genomics 2013, 14, 195. [Google Scholar] [CrossRef] [PubMed]
- Mu, D.; Li, C.; Zhang, X.; Li, X.; Shi, L.; Ren, A.; Zhao, M. Functions of the nicotinamide adenine dinucleotide phosphate oxidase family in Ganoderma lucidum: An essential role in ganoderic acid biosynthesis regulation, hyphal branching, fruiting body development, and oxidative-stress resistance. Environ. Microbiol. 2014, 16, 1709–1728. [Google Scholar] [CrossRef] [PubMed]
- Hsu, K.H.; Lee, Y.R.; Lin, Y.L.; Chu, F.H. Cytochrome P450 genes in medicinal mushroom Antrodia cinnamomea T.T. Chang et W.N. Chou (higher Basidiomycetes) are strongly expressed during fruiting body formation. Int. J. Med. Mushrooms 2011, 13, 513–523. [Google Scholar] [CrossRef] [PubMed]
- Yan, J.J.; Zhang, L.; Wang, R.Q.; Xie, B.; Li, X.; Chen, R.L.; Guo, L.X.; Xie, B.G. The sequence characteristics and expression models reveal superoxide dismutase involved in cold response and fruiting body development in Volvariella volvacea. Int. J. Mol. Sci. 2016, 17, 34. [Google Scholar] [CrossRef] [PubMed]
- Palmer, G.E.; Horton, J.S. Mushrooms by magic: Making connections between signal transduction and fruiting body development in the basidiomycete fungus Schizophyllum commune. FEMS Microbiol. Lett. 2006, 262, 1–8. [Google Scholar] [CrossRef] [PubMed]
- Song, C.; Chen, Q.; Wu, X.; Zhang, J.; Huang, C. Heat stress induces apoptotic-like cell death in two Pleurotus species. Curr. Microbiol. 2014, 69, 611–616. [Google Scholar] [CrossRef] [PubMed]
- Chang, S.T.; Miles, P.G. Mushrooms: Cultivation, Nutritional Value, Medicinal Effect, and Environmental Impact, 2nd ed.; CRC Press: Boca Raton, FL, USA, 2004; p. 451. ISBN 9780849310430. [Google Scholar]
- Lu, Z.; Kong, X.; Lu, Z.; Xiao, M.; Chen, M.; Zhu, L.; Shen, Y.; Hu, X.; Song, S. Para-Aminobenzoic Acid (PABA) synthase enhances thermotolerance of mushroom Agaricus bisporus. PLoS ONE 2014, 9, e91298. [Google Scholar] [CrossRef] [PubMed]
- Meng, L.; Kong, W.; Wu, X.; XM, L.; Huang, C.; Zhang, J. Biochemical pathway analysis of exogenous NO improving heat-tolerance of Pleurotus eryngii var. tuoliensis. Mycosystema 2015, 34, 632–639. [Google Scholar] [CrossRef]
- China Edible Fungi Association. Available online: http://mushroomsci.org/html/001/c0f6c4f4-a.html (accessed on 28 September 2017).
- Qu, J.B.; Zhao, M.R.; Hsiang, T.; Feng, X.X.; Zhang, J.X.; Huang, C.Y. Identification and characterization of small noncoding RNAs in genome sequences of the edible fungus Pleurotus ostreatus. Biomed. Res. Int. 2016, 2016. [Google Scholar] [CrossRef] [PubMed]
- NCBI. Available online: http://www.ncbi.nlm.nih.gov/ (accessed on 28 September 2017).
- JGI. Available online: http://genome.jgi.doe.gov/PleosPC15_2/PleosPC15_2.home.html (accessed on 28 September 2017).
- Altschul, S.F.; Gish, W.; Miller, W.; Myers, E.W.; Lipman, D.J. Basic local alignment search tool. J. Mol. Biol. 1990, 215, 403–410. [Google Scholar] [CrossRef]
- ExPASy. Available online: http://web.expasy.org/compute_pi/ (accessed on 28 September 2017).
- PROMO. Available online: http://alggen.lsi.upc.es/cgi-bin/promo_v3/promo/promoinit.cgi?dirDB=TF_8.3 (accessed on 28 September 2017).
- SignalP 4.1 Server. Available online: http://www.cbs.dtu.dk/services/SignalP/ (accessed on 28 September 2017).
- Conserved Domains and Protein Classification. Available online: https://www.ncbi.nlm.nih.gov/Structure/cdd/docs/cdd_search.html (accessed on 28 September 2017).
- Edgar, R.C. MUSCLE: Multiple sequence alignment with high accuracy and high throughput. Nucleic Acids Res. 2004, 32, 1792–1797. [Google Scholar] [CrossRef] [PubMed]
- Tamura, K.; Stecher, G.; Peterson, D.; Filipski, A.; Kumar, S. MEGA6: Molecular Evolutionary Genetics Analysis Version 6.0. Mol. Biol. Evol. 2013, 30, 2725–2729. [Google Scholar] [CrossRef] [PubMed]
- PIECE. Available online: https://wheat.pw.usda.gov/piece/GSDraw.php (accessed on 28 September 2017).
- Zhang, M.J.; Liu, X.M.; Zou, Y.J.; Huang, C.Y.; Liu, B.; Zhang, J.X. Optimization of heat stress for Pleurotus spp. cultivation. Mycosystema 2015, 34, 662–669. [Google Scholar] [CrossRef]
- Lledías, F.; Rangel, P.; Hansberg, W. Oxidation of catalase by singlet oxygen. J. Biol. Chem. 1998, 273, 10630–10637. [Google Scholar] [CrossRef] [PubMed]
- Lardinois, O.M.; Rouxhet, P.G. Characterization of hydrogen peroxide and superoxide degrading pathways of Aspergillus niger catalase: A steady-state analysis. Free Radic. Res. 1994, 20, 29–50. [Google Scholar] [CrossRef] [PubMed]
- Wang, Y.; Dong, Q.; Ding, Z.; Gai, K.; Han, X.; Kaleri, F.N.; He, Q.; Wang, Y. Regulation of Neurospora Catalase-3 by global heterochromatin formation and its proximal heterochromatin region. Free Radic. Biol. Med. 2016, 99, 139–152. [Google Scholar] [CrossRef] [PubMed]
- Sun, G.; Zhou, Z.; Liu, X.; Gai, K.; Liu, Q.; Cha, J.; Kaleri, F.N.; Wang, Y.; He, Q. Suppression of WHITE COLLAR-independent frequency transcription by histone H3 lysine 36 methyltransferase SET-2 is necessary for clock function in Neurospora. J. Biol. Chem. 2016, 291, 11055–11063. [Google Scholar] [CrossRef] [PubMed]
- Schroeder, A.; Mueller, O.; Stocker, S.; Salowsky, R.; Leiber, M.; Gassmann, M.; Lightfoot, S.; Menzel, W.; Granzow, M.; Ragg, T. The RIN: An RNA integrity number for assigning integrity values to RNA measurements. BMC Mol. Biol. 2006, 7. [Google Scholar] [CrossRef] [PubMed]
- Livak, K.J.; Schmittgen, T.D. Analysis of relative gene expression data using real-time quantitative PCR and the 2−ΔΔCT method. Methods 2001, 25, 402–408. [Google Scholar] [CrossRef] [PubMed]
- Wang, S.H.; Cheng, C.Y.; Tang, P.C.; Chen, C.F.; Chen, H.H.; Lee, Y.P.; Huang, S.Y. Acute heat stress induces differential gene expressions in the testes of a broiler-type strain of Taiwan country chickens. PLoS ONE 2015, 10, e0125816. [Google Scholar] [CrossRef] [PubMed]
- Vihervaara, A.; Sistonen, L. HSF1 at a glance. J. Cell Sci. 2014, 127, 261–266. [Google Scholar] [CrossRef] [PubMed]
- Nierman, W.C.; Pain, A.; Anderson, M.J.; Wortman, J.R.; Kim, H.S.; Arroyo, J.; Berriman, M.; Abe, K.; Archer, D.B.; Bermejo, C.; et al. Genomic sequence of the pathogenic and allergenic filamentous fungus Aspergillus fumigatus. Nature 2005, 438, 1151–1156. [Google Scholar] [CrossRef] [PubMed]
- Giles, S.S.; Stajich, J.E.; Nichols, C.; Gerrald, Q.D.; Alspaugh, J.A.; Dietrich, F.; Perfect, J.R. The Cryptococcus neoformans catalase gene family and its role in antioxidant defense. Eukaryot. cell 2006, 5, 1447–1459. [Google Scholar] [CrossRef] [PubMed]
- Chary, P.; Natvig, D.O. Evidence for three differentially regulated catalase genes in Neurospora crassa: Effects of oxidative stress, heat shock, and development. J. Bacteriol. 1989, 171, 2646–2652. [Google Scholar] [CrossRef] [PubMed]
- Sofo, A.; Scopa, A.; Nuzzaci, M.; Vitti, A. Ascorbate peroxidase and catalase activities and their genetic regulation in plants subjected to drought and salinity stresses. Int. J. Mol. Sci. 2015, 16, 13561–13578. [Google Scholar] [CrossRef] [PubMed]
- Mejia-Barajas, J.A.; Montoya-Perez, R.; Salgado-Garciglia, R.; Aguilera-Aguirre, L.; Cortes-Rojo, C.; Mejia-Zepeda, R.; Arellano-Plaza, M.; Saavedra-Molina, A. Oxidative stress and antioxidant response in a thermotolerant yeast. Braz. J. Microbiol. 2017, 48, 326–332. [Google Scholar] [CrossRef] [PubMed]
- Cheng, Z.; Chi, M.; Li, G.; Chen, H.; Sui, Y.; Sun, H.; Wisniewski, M.; Liu, Y.; Liu, J. Heat shock improves stress tolerance and biocontrol performance of Rhodotorula mucilaginosa. Biol. Control 2016, 95, 49–56. [Google Scholar] [CrossRef]
- Pongpom, P.; Cooper, C.R., Jr.; Vanittanakom, N. Isolation and characterization of a catalase-peroxidase gene from the pathogenic fungus, Penicillium marneffei. Med. Mycol. 2005, 43, 403–411. [Google Scholar] [CrossRef] [PubMed]
- Corpas, F.J.; Gómez, M.; Hernández, J.A.; Luis, A. Metabolism of activated oxygen in peroxisomes from two Pisum sativum L. cultivars with different sensitivity to sodium chloride. J. Plant Physiol. 1993, 141, 160–165. [Google Scholar] [CrossRef]
- Hasanuzzaman, M.; Fujita, M. Selenium pretreatment upregulates the antioxidant defense and methylglyoxal detoxification system and confers enhanced tolerance to drought stress in rapeseed seedlings. Biol. Trace Elem. Res. 2011, 143, 1758–1776. [Google Scholar] [CrossRef] [PubMed]
- Wang, G.P.; Hui, Z.; Li, F.; Zhao, M.R.; Zhang, J.; Wang, W. Improvement of heat and drought photosynthetic tolerance in wheat by overaccumulation of glycinebetaine. Plant Biotechnol. Rep. 2010, 4, 213–222. [Google Scholar] [CrossRef]
- Ramírez-Quijas, M.D.; Zazueta-Sandoval, R.; Obregón-Herrera, A.; López-Romero, E.; Cuéllar-Cruz, M. Effect of oxidative stress on cell wall morphology in four pathogenic Candida species. Mycol. Prog. 2015, 14, 8. [Google Scholar] [CrossRef]
- Sundaram, A.; Grant, C.M. Oxidant-specific regulation of protein synthesis in Candida albicans. Fungal Genet. Biol. 2014, 67, 15–23. [Google Scholar] [CrossRef] [PubMed]
Figure 1.
Relationships of fungal catalases and gene structural features. (A) A neighbor-joining phylogenetic tree of catalase protein sequences from multiple species; Po-cat1 and Po-cat2 are labeled following with black triangles; (B) Gene structures of selected catalase genes, the exons are represented by red rectangles, the black lines connecting two exons represent introns, and the numbers above the line represent the intron phase.
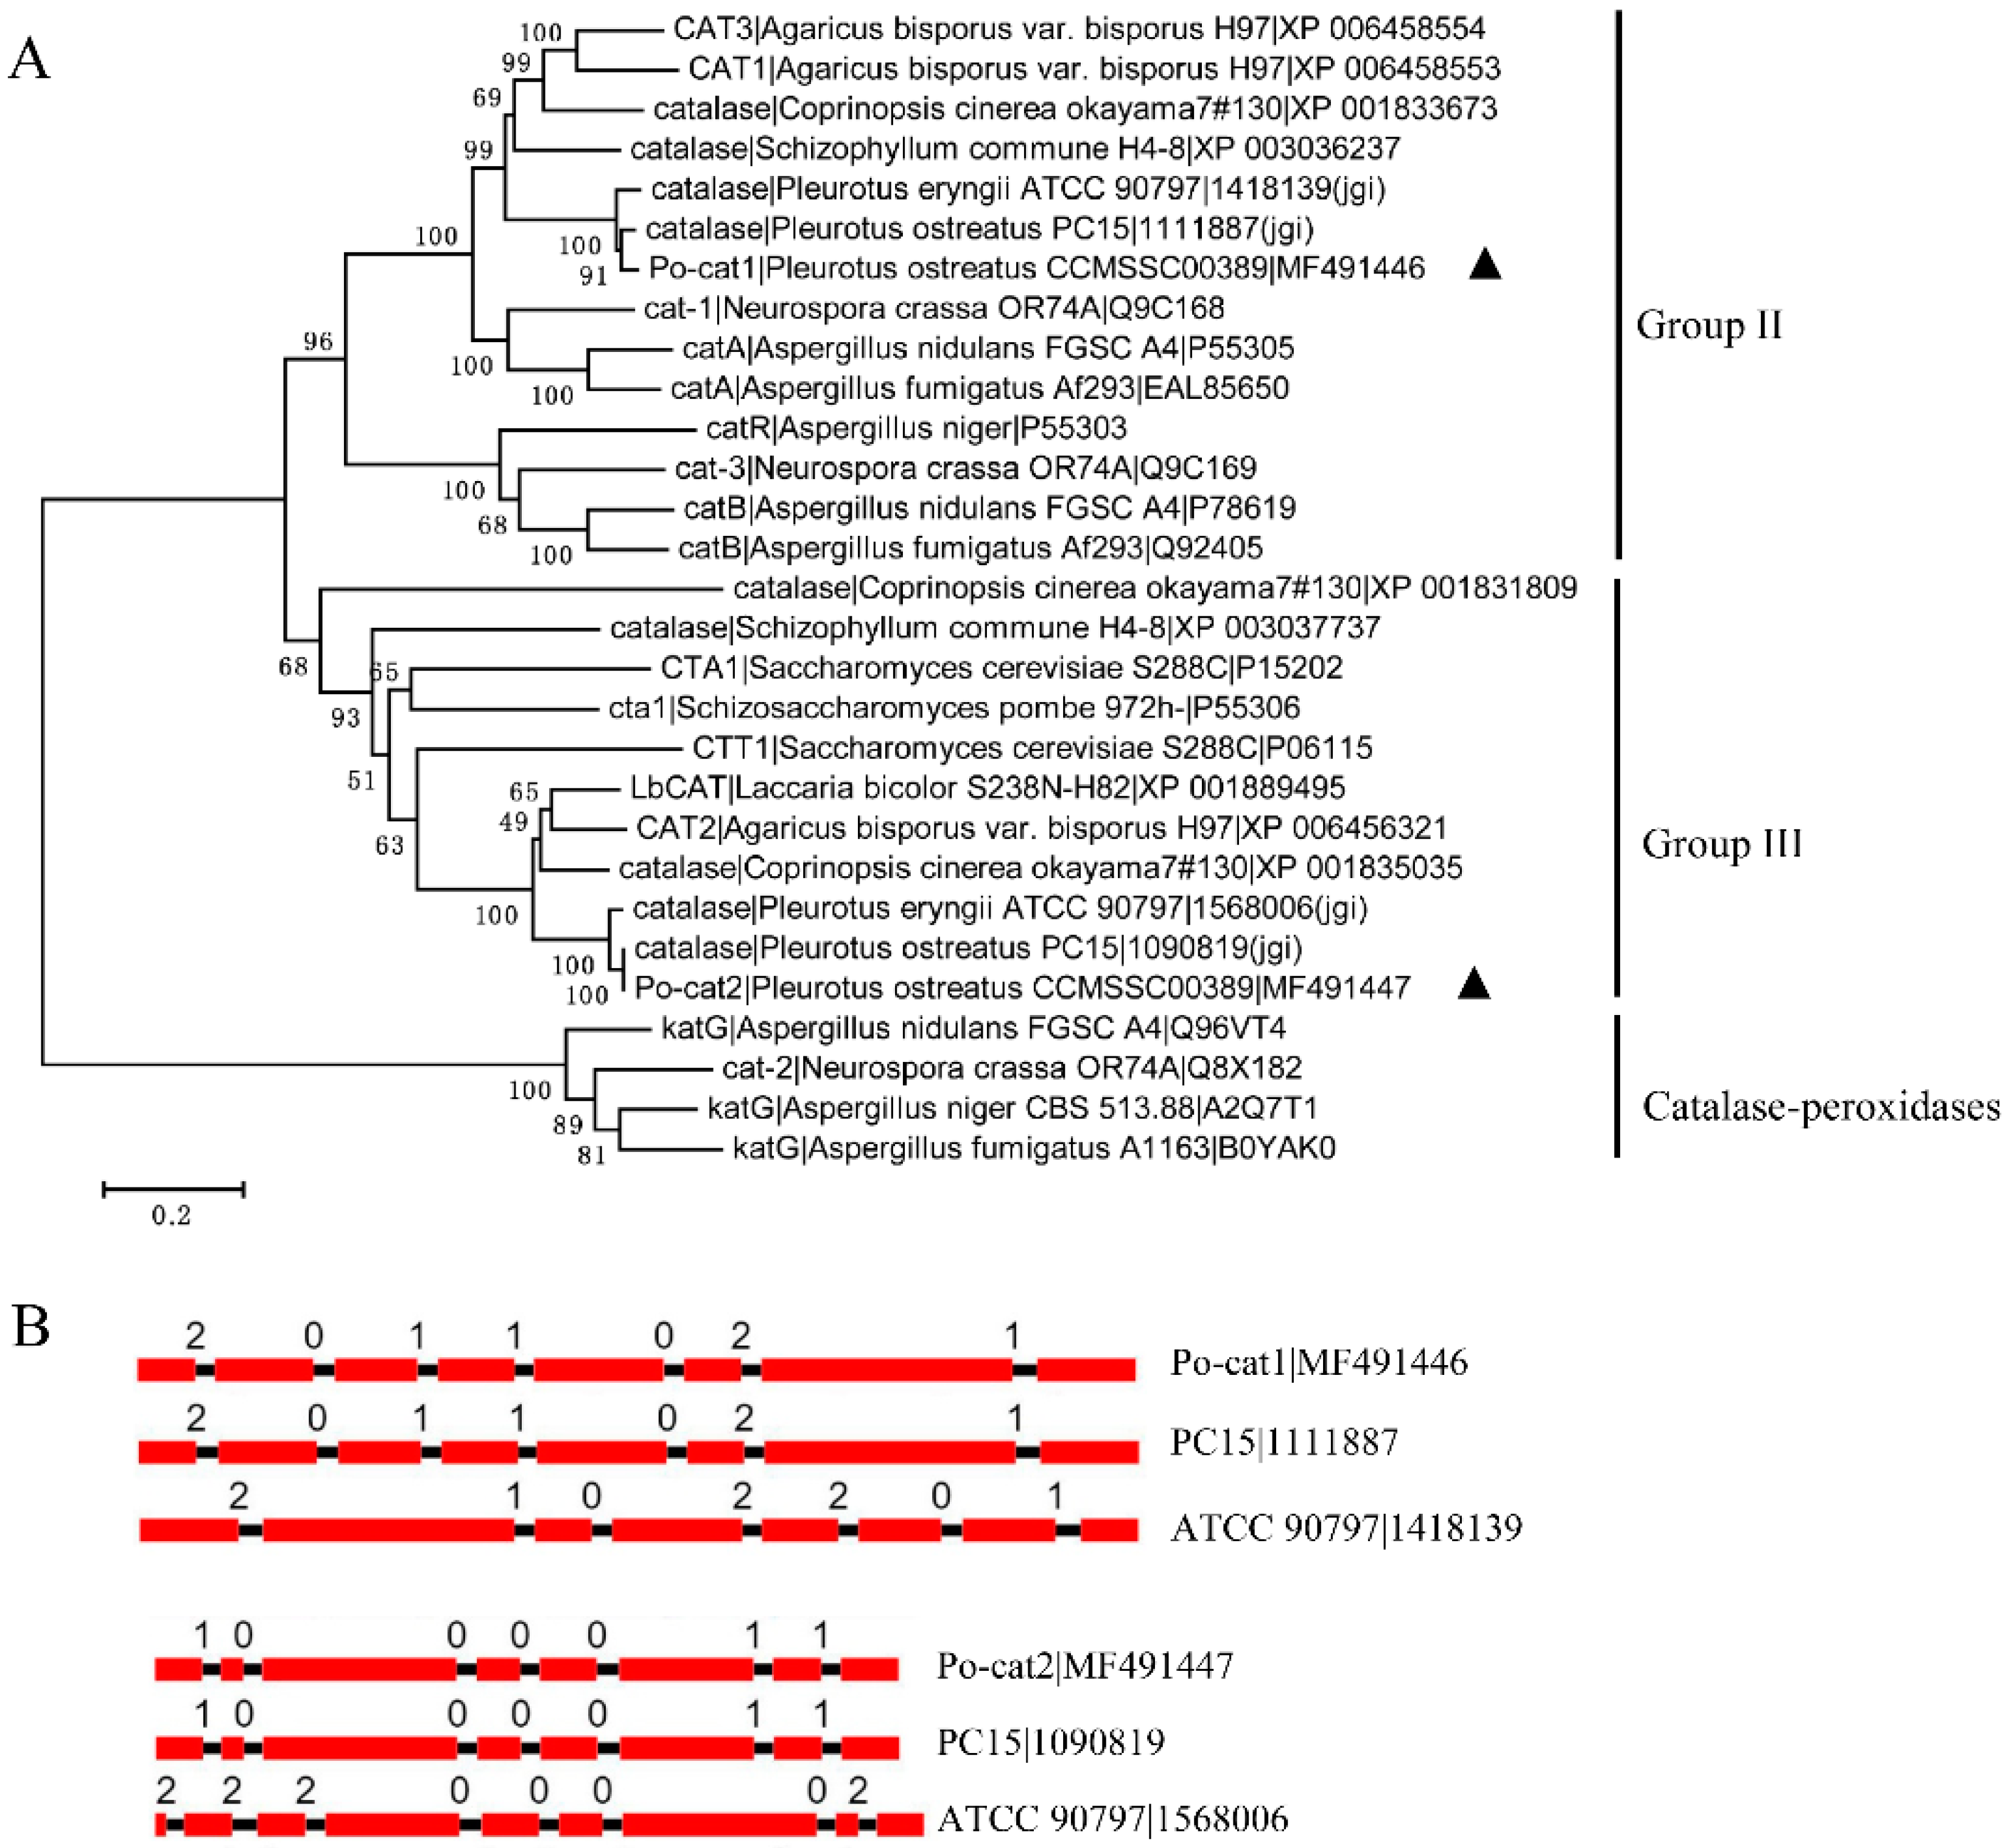
Figure 2.
Expression patterns of catalases during different developmental stages of P. ostreatus. (A) Total catalase activities at different growth stages; (B) Po-cat2 catalase activity; (C) Differential expression of Po-cat1; (D) Differential expression of Po-cat2; (E) Protein expression of Po-cat1 and Po-cat2. M = mycelia; P = primordia; F = fruiting bodies; S = spores. The gene expression levels are presented relative to that in mycelia. Mean values and standard deviations of three biological replicates are shown. The error bars with different letters over the columns denote significant differences (p < 0.05, n = 3).
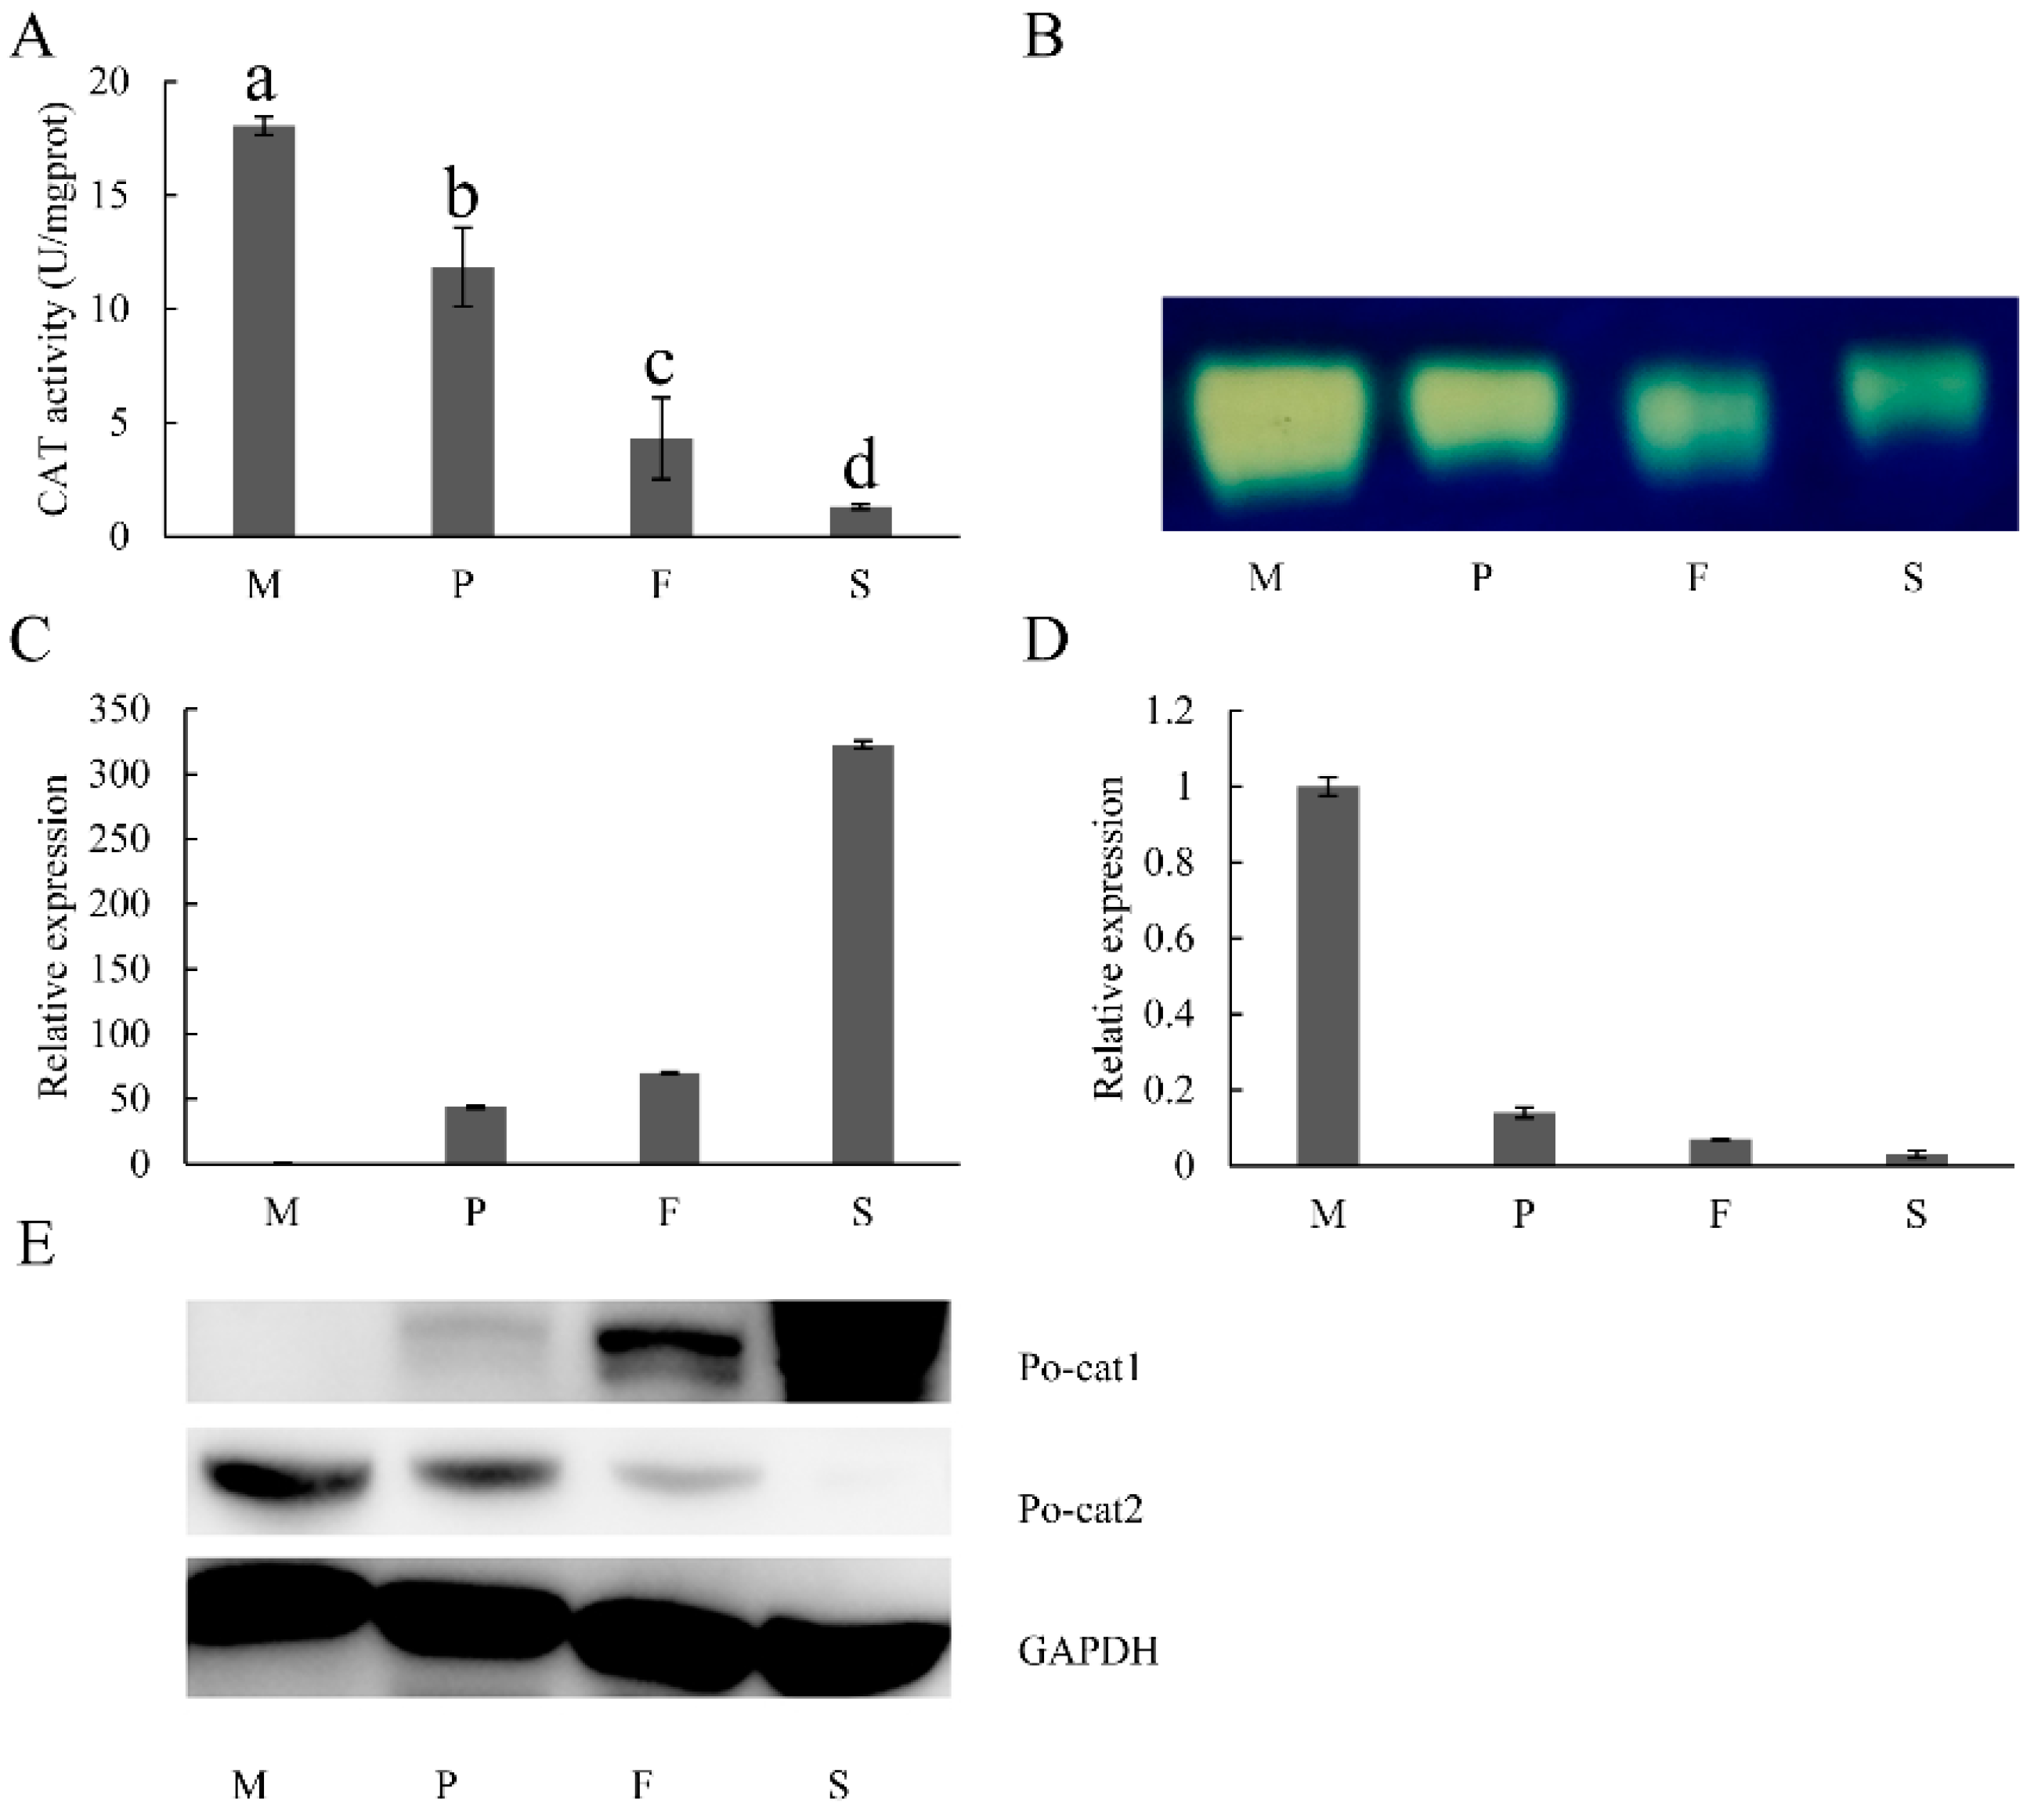
Figure 3.
Growth rate (A) and H2O2 contents (B) of mycelia at different growth temperatures. Mean values and standard deviations of three biological replicates are shown. The error bars with different letters over the columns denote significant differences (p < 0.05, n = 3).
Figure 3.
Growth rate (A) and H2O2 contents (B) of mycelia at different growth temperatures. Mean values and standard deviations of three biological replicates are shown. The error bars with different letters over the columns denote significant differences (p < 0.05, n = 3).

Figure 4.
Expression patterns of catalases under heat stress. (A) Total catalase activities after 32 °C and 40 °C heat stress; (B) Po-cat2 catalase activity; (C) Expression patterns of Po-cat1 under heat stress; (D) Expression patterns of Po-cat2 under heat stress; (E) Protein expression patterns of Po-cat1 and Po-cat2 under heat stress. The gene expression levels are presented relative to mycelia cultured at 28 °C. Mean values and standard deviations of three biological replicates are shown. The error bars with different letters over the columns denote significant differences (p < 0.05, n = 3).


Table 1.
Primers used in complementary DNA full length sequence amplification and quantitative PCR (qPCR).
Table 1.
Primers used in complementary DNA full length sequence amplification and quantitative PCR (qPCR).
| Name | Forward Sequence (5′–3′) | Reverse Sequence (5′–3′) | Product Size (bp) |
|---|---|---|---|
| Po-cat1 | ATGTCGTCCATCACAGCTG | TCAATACGCAATCCTCGC | 2238 |
| Po-cat2 | ATGCCCACTCAAGAAGTC | TCAGTGGGCGGTGGACTT | 1587 |
| gapdh | GTGTTAACCTCGAGACTTACG | TGGTGGCGTGGATTGTGCTC | 144 |
| Po-cat1_1 | TGTGCATTGGTTGAGAGAGG | TACGACGCTACAACTTCCG | 147 |
| Po-cat2_1 | CGGACTTTCTTGCCCACAG | GACTTGCTCGCCCATTTCG | 149 |
© 2017 by the authors. Licensee MDPI, Basel, Switzerland. This article is an open access article distributed under the terms and conditions of the Creative Commons Attribution (CC BY) license (http://creativecommons.org/licenses/by/4.0/).
Share and Cite
MDPI and ACS Style
Wang, L.; Wu, X.; Gao, W.; Zhao, M.; Zhang, J.; Huang, C. Differential Expression Patterns of Pleurotus ostreatus Catalase Genes during Developmental Stages and under Heat Stress. Genes 2017, 8, 335. https://doi.org/10.3390/genes8110335
AMA Style
Wang L, Wu X, Gao W, Zhao M, Zhang J, Huang C. Differential Expression Patterns of Pleurotus ostreatus Catalase Genes during Developmental Stages and under Heat Stress. Genes. 2017; 8(11):335. https://doi.org/10.3390/genes8110335
Chicago/Turabian StyleWang, Lining, Xiangli Wu, Wei Gao, Mengran Zhao, Jinxia Zhang, and Chenyang Huang. 2017. "Differential Expression Patterns of Pleurotus ostreatus Catalase Genes during Developmental Stages and under Heat Stress" Genes 8, no. 11: 335. https://doi.org/10.3390/genes8110335
Note that from the first issue of 2016, this journal uses article numbers instead of page numbers. See further details here.