Article

Genes and Gut Bacteria Involved in Luminal Butyrate Reduction Caused by Diet and Loperamide

1
Faculty of Biotechnology, School of Life Sciences, SARI, Jeju National University, Jeju 63243, Korea
2
Subtropical/tropical Organism Gene Bank, Jeju National University, Jeju 63243, Korea
3
Microbial Institute for Fermentaion Industry (MIFI), Sunchang, Jeonbuk 595804, Korea
4
Department of Gastroenterology, Wonkwang University Sanbon Hospital, Gunpo 435040, Korea
5
Department of Bioenvironmental Chemistry, Chonbuk National University, Jeonju 54896, Korea
6
BioTechnology Insittute, University of Minnesota, St. Paul, MN 55108, USA
7
Department of Soil, Water, and Climate, University of Minnesota, St. Paul, MN 55108, USA
8
Department of Plant and Microbial Biology, University of Minnesota, St. Paul, MN 55108, USA
*
Author to whom correspondence should be addressed.
Genes 2017, 8(12), 350; https://doi.org/10.3390/genes8120350
Submission received: 31 October 2017 / Revised: 16 November 2017 / Accepted: 23 November 2017 / Published: 28 November 2017
(This article belongs to the Special Issue Diabetes, Obesity and the Gut Microbiome)

Abstract

:
Unbalanced dietary habits and gut dysmotility are causative factors in metabolic and functional gut disorders, including obesity, diabetes, and constipation. Reduction in luminal butyrate synthesis is known to be associated with gut dysbioses, and studies have suggested that restoring butyrate formation in the colon may improve gut health. In contrast, shifts in different types of gut microbiota may inhibit luminal butyrate synthesis, requiring different treatments to restore colonic bacterial butyrate synthesis. We investigated the influence of high-fat diets (HFD) and low-fiber diets (LFD), and loperamide (LPM) administration, on key bacteria and genes involved in reduction of butyrate synthesis in mice. MiSeq-based microbiota analysis and HiSeq-based differential gene analysis indicated that different types of bacteria and genes were involved in butyrate metabolism in each treatment. Dietary modulation depleted butyrate kinase and phosphate butyryl transferase by decreasing members of the Bacteroidales and Parabacteroides. The HFD also depleted genes involved in succinate synthesis by decreasing Lactobacillus. The LFD and LPM treatments depleted genes involved in crotonoyl-CoA synthesis by decreasing Roseburia and Oscilllibacter. Taken together, our results suggest that different types of bacteria and genes were involved in gut dysbiosis, and that selected treatments may be needed depending on the cause of gut dysfunction.

Graphical Abstract

1. Introduction

Butyrate is a bioactive compound that inhibits histone deacetylase (HDAC). Inhibition of HDAC has been studied in mammalian cells, and inhibits proliferation, induction of differentiation, and induction/repression of gene expression. However, inhibition of HDAC activity affects the expression of only ~2% of mammalian genes [1]. Butyrate is also known to activate G-protein-coupled receptors (GPCR), by which it regulates diverse body functions. In addition, butyrate has antitumor activity by activating GPR43 [2]. Recent gut microbiome studies have revealed that butyrate also serves as an energy source to gut epithelial cells. Donohoe et al. [3] reported that gut microbiota influences the host’s metabolic functions by regulating the abundance of mRNA and proteins involved in metabolism, especially the tricarboxylic acid (TCA) cycle. Deprived energy status leads to autophagy in the colon. In contrast, feeding mice with the butyrate producing bacterium, Butyrivibrio fibrisolvens increased ATP and restored autophagy to the normal level. Butyrate intake as a dietary supplement was also found to improve insulin sensitivity in mice [4], counteract adverse effects caused by a high-fat diet [5] and was useful in treating Type 1 diabetes by improving beta-cell proliferation and glucose homeostasis [6].
One of the possible underlying mechanisms by which butyrate improves metabolic disorder is by production of mucin. Mucins are high molecular weight glycoproteins produced by goblet cells that resides throughout the gastrointestinal (GI) tract. Consequently, a large part of the colon is covered with mucins. While this mucosal layer acts as an innate defense system against bacterial infection, some species of gut bacteria can colonize the mucous layer. It has been reported that Akkermansia muciniphila can alter the host’s metabolism, reversing effects of obesity, diabetes, and inflammation [7]. Other bacteria that colonize the inside of the mucosal layer include Bifidobacterium, well-known probiotic strains that are reported to improve the host’s metabolism [8]. In addition, Bacteroides and Ruminococcus are known butyrate-producing bacteria that are also found within mucosal layers [9].
In vivo studies are often conducted to study roles of gut microbiota in dysbiosis. In general, two types of gut dysbiosis induction methods have been used with mice models. One uses a dietary-based gut dysbiosis induction method, whereby high-fat diets (HFD) and low-fiber diets (LFD) are used as to represent unhealthy and unbalanced dietary habits. The other uses drugs to cause gut dysbiosis. Loperamide (LPM) is frequently applied to slow gastrointestinal (GI) motility, and consequently induces constipation in mice.
Previous studies have reported that these three treatments (HFD, LFD, and LPM) shift gut microbiota and decrease concentrations of luminal butyrate [10,11,12]. Restoration of butyrate synthesis in the colon was shown to improve the host physiological status [4,5]. Since the primary source of butyrate in humans comes from bacterial fermentation of carbohydrates in the colon, having abundant butyrate-producing bacteria and their substrate producing bacteria (i.e., lactic acid producing bacteria) could be a key to maintain optimal amounts of butyrate in the gut [13]. Various types of polysaccharides can be fermented by different butyrate producing bacteria [14], and amount of luminal butyrate depends on both the types of butyrate producers and polysaccharides present in the gut. The butyrate producers are mostly strict anaerobes, but are phylogenetically diverse [14], and most remain uncultured [15]. Thus, the abundance of the butyrate producing bacteria may need to be estimated by functional-based approaches [16].
Previously, four different metabolic pathways were proposed for butyrate synthesis by gut bacteria: starting from glutarate, acetyl-CoA, lysine, and succinic acid [17,18]. Since various types of bacteria are involved in these butyrate synthesis routes, and gut dysbiosis decreases luminal butyrate by inhibiting the activities of specific bacteria, restoration of luminal butyrate synthesis may require different treatments depending on the cause(s) of dysbiosis. In the present study, we investigated the bacteria and genes involved in butyrate synthesis using a mouse model of gut dysbiosis. Although not inclusive of all mechanisms of gut dysbiosis associated with butyrate reduction, the results in this study will provide a fundamental understanding of the inhibition of luminal butyrate production by three different causes of gut dysbiosis.

2. Materials and Methods

2.1. Experimental Design for Animal Studies

The Jeju National University Institutional Animal Care and Use Committee approved the animal experiments (JNU-IACUC; Approval Number 2016-0045). Five-week-old female ICR mice (Orient Bio Inc., Seungnam, Korea) were housed at 22 °C, with a relative humidity of 50–55% and a 12 h light/dark cycle. Mice were housed in separate cages and supplied with food and water ad libitum. After one week of acclimation, a three-week feeding trial was conducted. Animals were divided into four groups (n = 10 per group): control diet (CTL; 5L79, Orient Bio Inc., Seungnam, Korea), 45% HFD (D12451, Research Diets, New Brunswick, NJ, USA), LFD (Crea Japan, Inc., Shizuoka, Japan) containing 0.1% crude fiber, and control diet with 1.5 mg kg−1 of orally injected LPM daily on days 11–21. Two mice in LPM group died during the feeding trial, thus, eight mice were used for analyses. The calorie content of the diets used in this study are provided in Table S1.

2.2. Mucosal Studies

Animals were sacrificed on day 21 for histopathology study. Mucosa thickness was measured according to the method described by Kim et al. [19]. Briefly, the transverse colon was collected by dissection, sliced to a rectangle, fixed with 5% formalin for 48 h, embedded in paraffin wax, and then sectioned into 3 μm thick slices. Fixed specimens were subsequently deparaffinized with xylene, rehydrated, rinsed with distilled water, and stained with an alcian blue. Stained colon sections were observed by light microscopy (Olympus IX73, Tokyo, Japan) and the mucosa thickness was measured using cellSens (Olympus, Tokyo, Japan).

2.3. Butyrate Quantification

Butyrate in the cecum were measured by gas chromatography on a GC-2010 Plus gas chromatograph (Shimazu, Kyoto, Japan) equipped with a flame ionization detector. Cecum samples were obtained at the end of the feeding trials, immediately frozen in liquid nitrogen, and stored at −80 °C until used. Frozen cecum was homogenized in distilled water for 10 min. The pH was adjusted to 3 with 1 M HCl, and incubated for 10 min at room temperature with frequent agitation. Samples were centrifuged at 5000× g for 20 min at 4 °C, and the supernatant was stored at −20 °C. Gas chromatography was done using a fused-silica capillary column (30 m × 0.25 mm) coated with 0.25 μm thick free fatty acid phase film (DB_FFAP 122-3232, J&W Scientific, Agilent Technologies Inc., Santa Clara, CA, USA). Helium was supplied as the carrier gas using a linear velocity mode at 22.2 cm sec−1. The injection and detector ports were maintained at 200 °C and 240 °C, respectively. Glass wool was inserted in the liner of the splitless injection port. The oven temperature was initially set to 80 °C, then gradually increased by 6.13 °C min−1 to 120 °C, 20 °C min−1 to 150 °C, and 6.13 °C min−1 to 205 °C. There were 1 min intervals between the shifts, and the oven temperature was then maintained at 205 °C for 2 min. Flow rates were 40, 400, and 80 mL min−1 for hydrogen, air, and helium, respectively.

2.4. Fecal Microbiome Analysis

Feces were collected on days 7 and 20. Bacterial DNA was extracted using the PowerFecal DNA isolation kit (MOBIO Laboratories Inc., Carlsbad, CA, USA). For microbial community analysis, the V4 region of the 16S rRNA gene was amplified from fecal DNA, and a library for Illumina Miseq (250 bp × 2) was constructed with two-step PCR. For functional gene investigation, three fecal DNA samples collected at day 20 were randomly selected from each group and sequenced using Illumina HiSeq 4000 (2 × 150 bp). Both sequencing methods were performed at Macrogen Inc. (Seoul, Korea). MiSeq output was analyzed using MOTHUR [20]. The differential abundance test was performed with LEfSe [21] and community types were estimated using Dirichlet multinomial mixture (DMM) model [22], which employs probabilistic modelling to cluster microbial communities. This method was previously used to define enterotypes in the human gut [23]. Outlier samples were removed prior to analysis, based on cluster analysis using the Yue and Clayton measure of dissimilarity.
HiSeq outputs were trimmed, assembled, and annotated with the EDGE pipeline [24], using IDBA_UD for assembly [25], BWA [26] for contig abundance estimation and annotation, and Prodigal [27] for structural gene prediction. KEGG orthology (KO) assignment was performed using KAAS [28], and differential KO genes were identified by MetaPath [29]. Operational taxonomic unit (OTU)-based network analysis was performed with Cytoscape, using an organic yFile layout. Sequence data used in this study were deposited to the Short Read Archive (SRA) with project number PRJNA394775.

2.5. Statistical Analysis

Bioparameters were compared by using analysis of variance, with Tukey’s range and Duncan’s multiple range tests. Analysis of molecular variance [30] (AMOVA) was used to evaluate significant differences between gut microbial communities. Pearson correlation analysis was used to correlate taxa with microbial community shifts.

3. Results

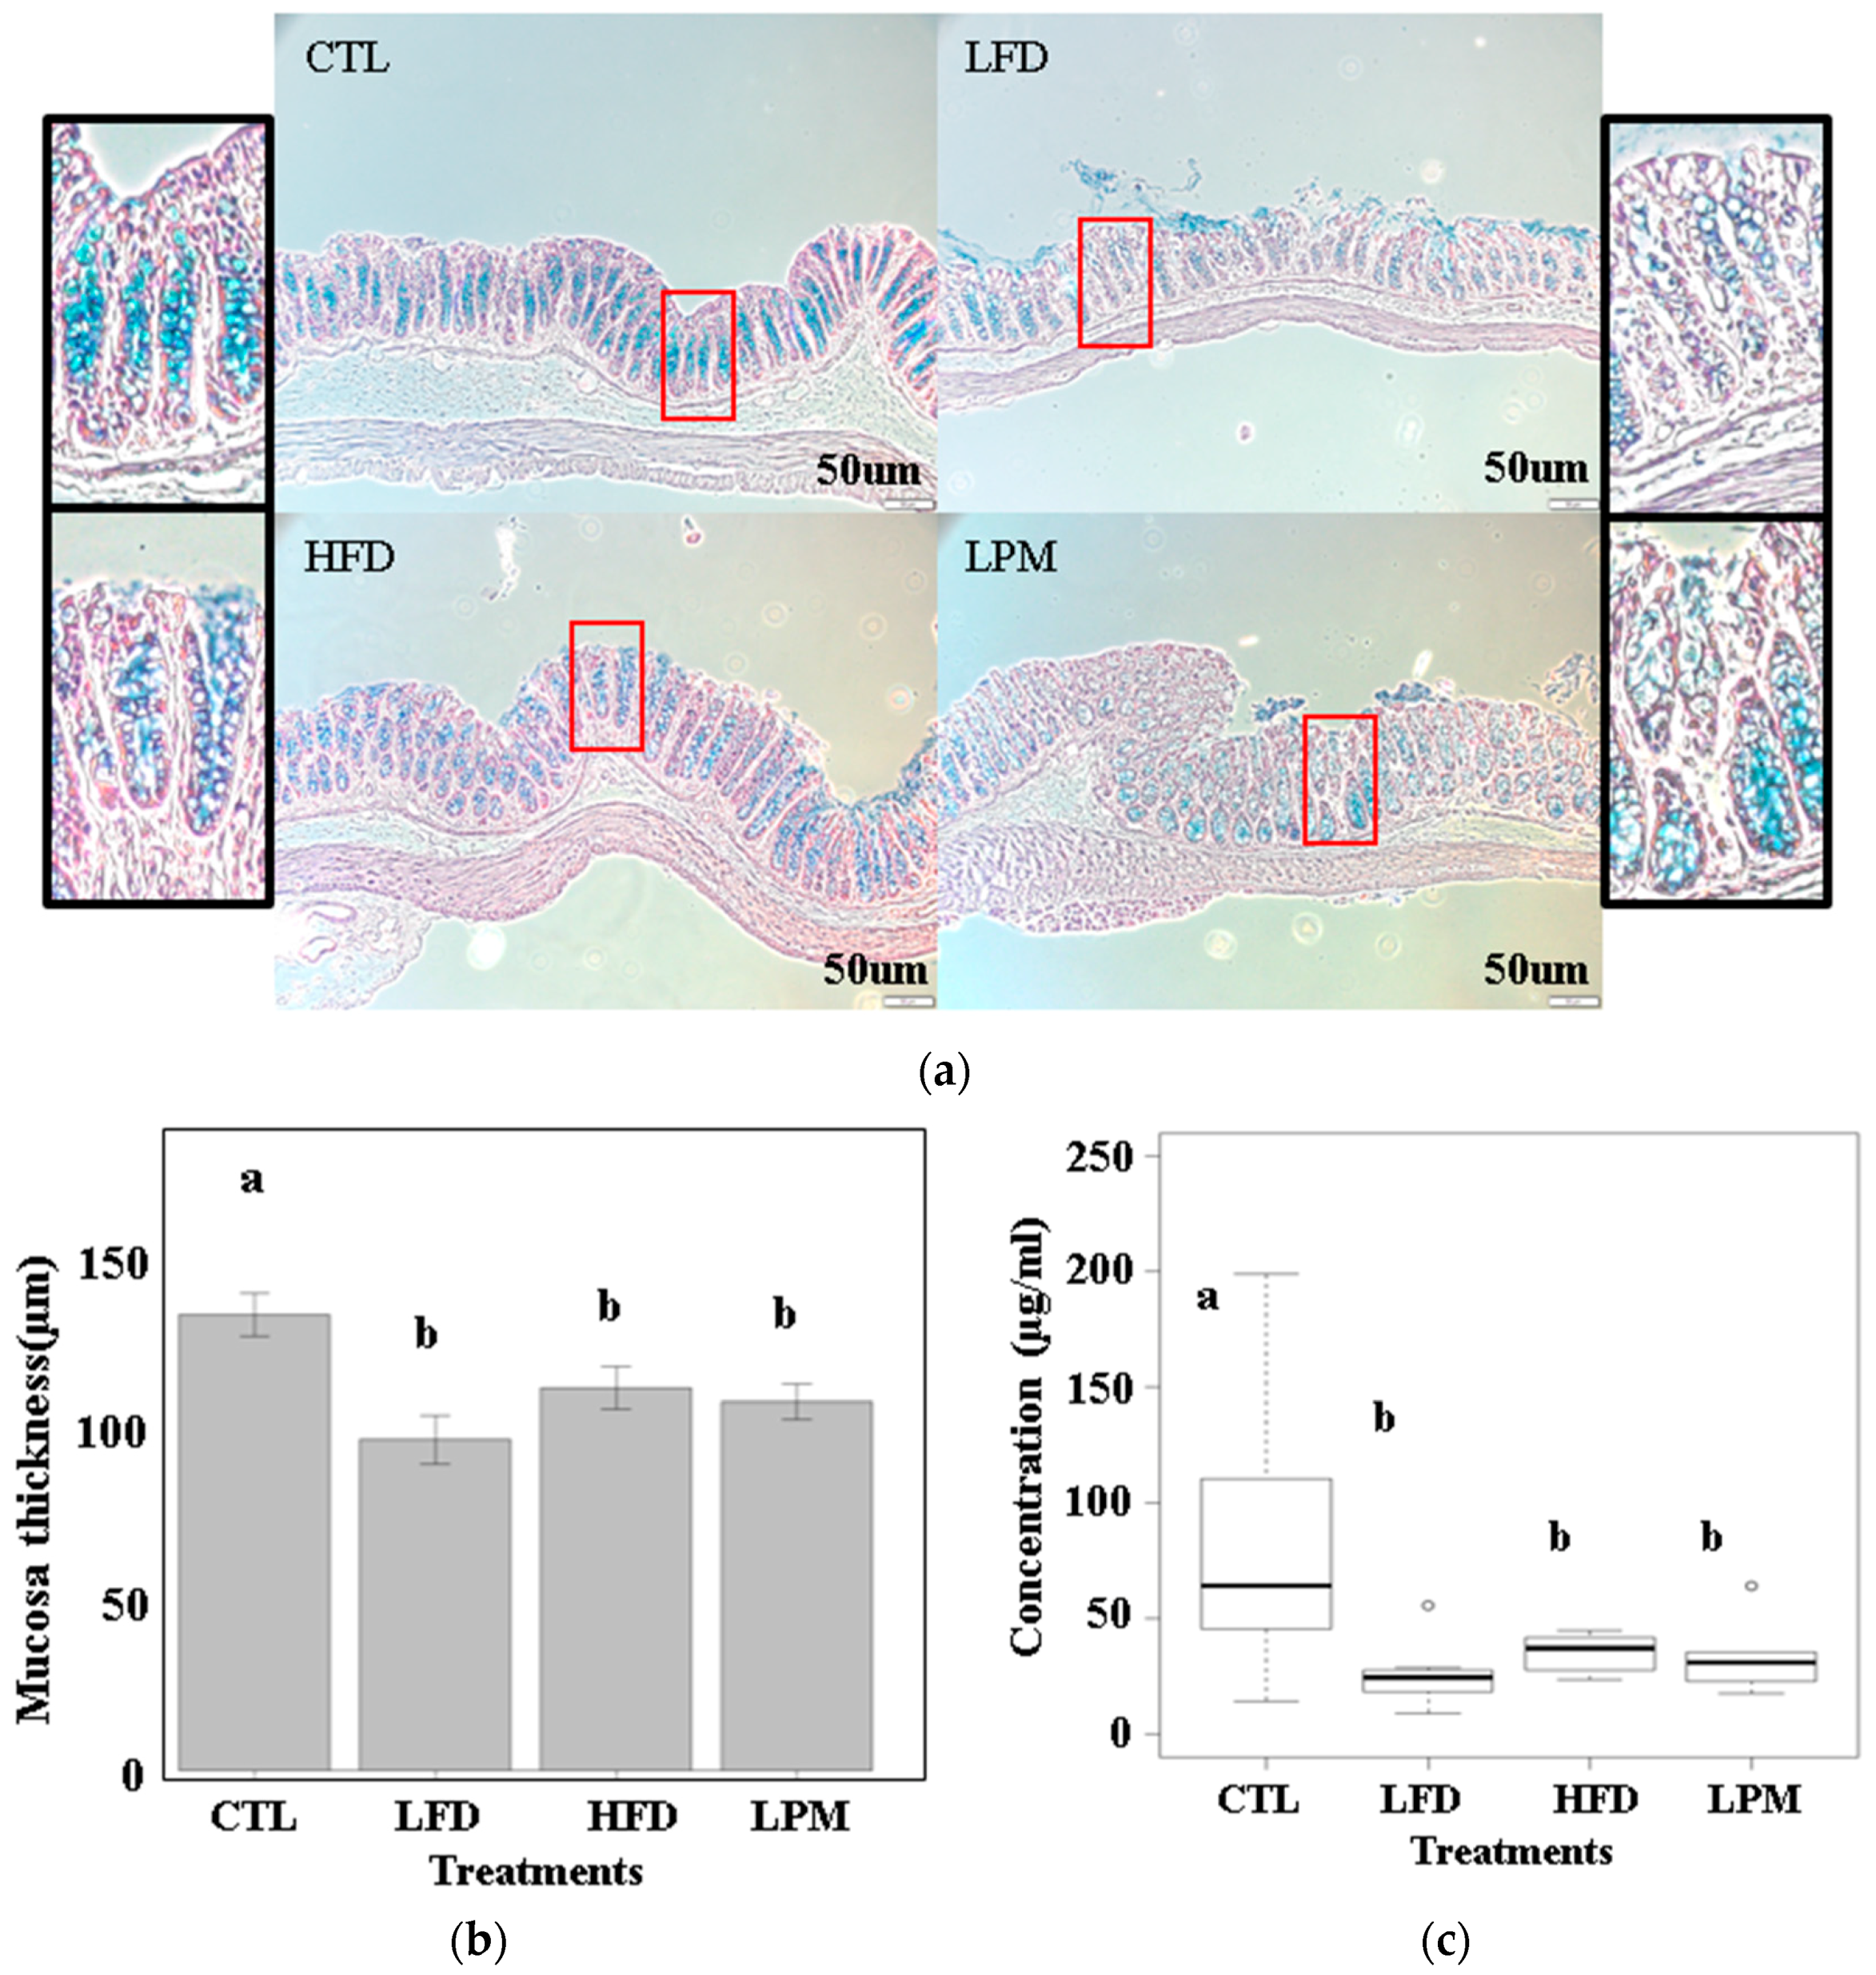
3.1. Bioparametric and Histological Changes

Throughout the three-week feeding trial, no significant body weight differences were observed among all groups. The HFD- and LFD-fed mice had significantly lower food intake and lower fecal output per gram of feed (p < 0.05), whereas the LPM treatment did not affect food intake or fecal output (Table S2). This difference was observed starting on the first day of the feeding trial (Figure S1). Results in Figure 1 show that HFD, LFD, and LPM decreased amount of mucin in goblet cells (Figure 1A). Significant decrease in the thickness of mucosa (p < 0.05) (Figure 1B) and increase in the amount of cecum butyrate (p < 0.05) (Figure 1C) were also observed. Other images and length of mucosa thickness were summarized in Figure S2.

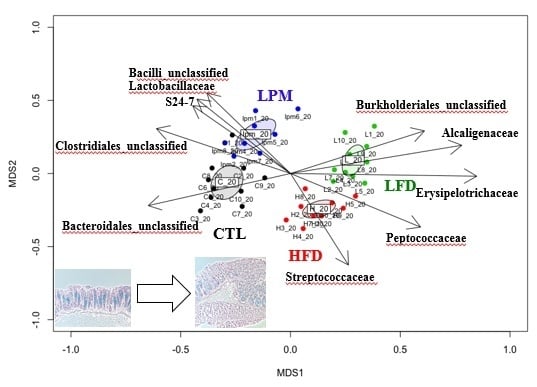
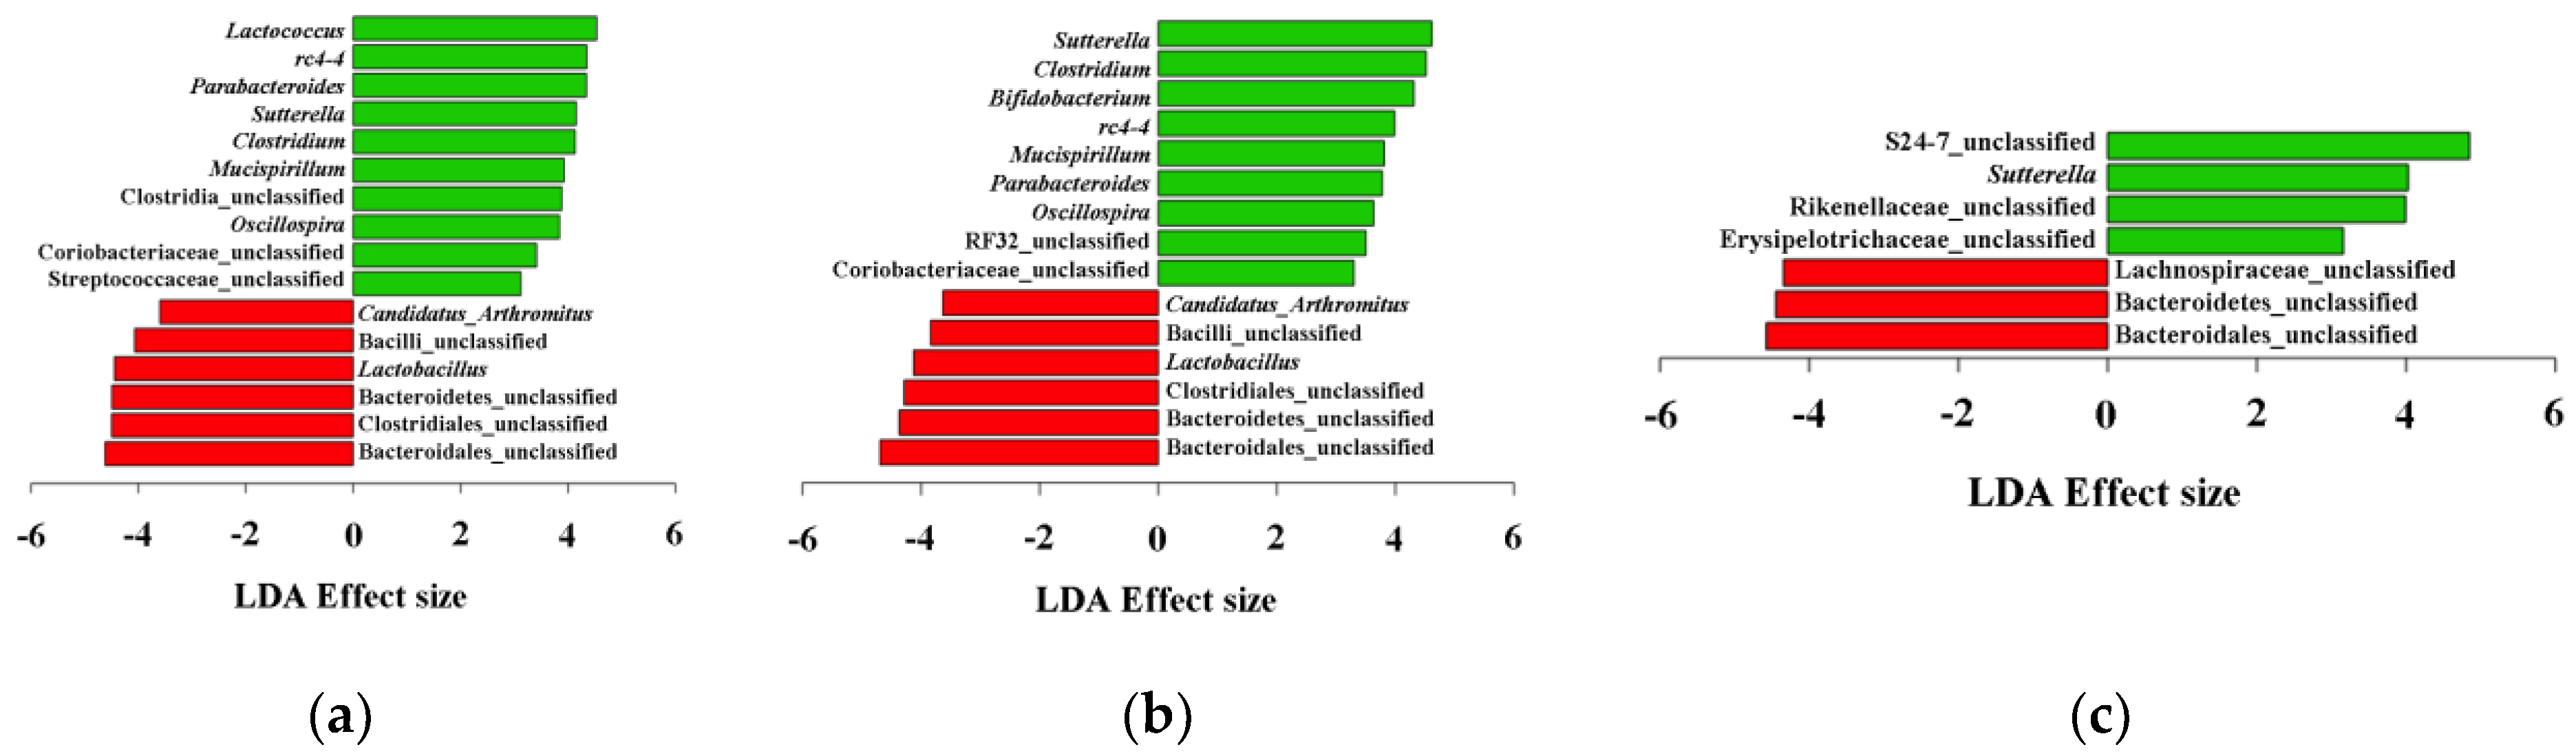
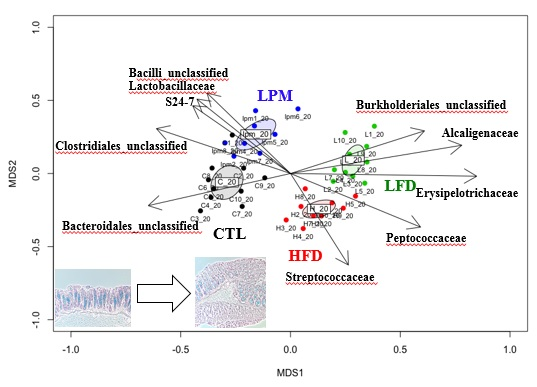
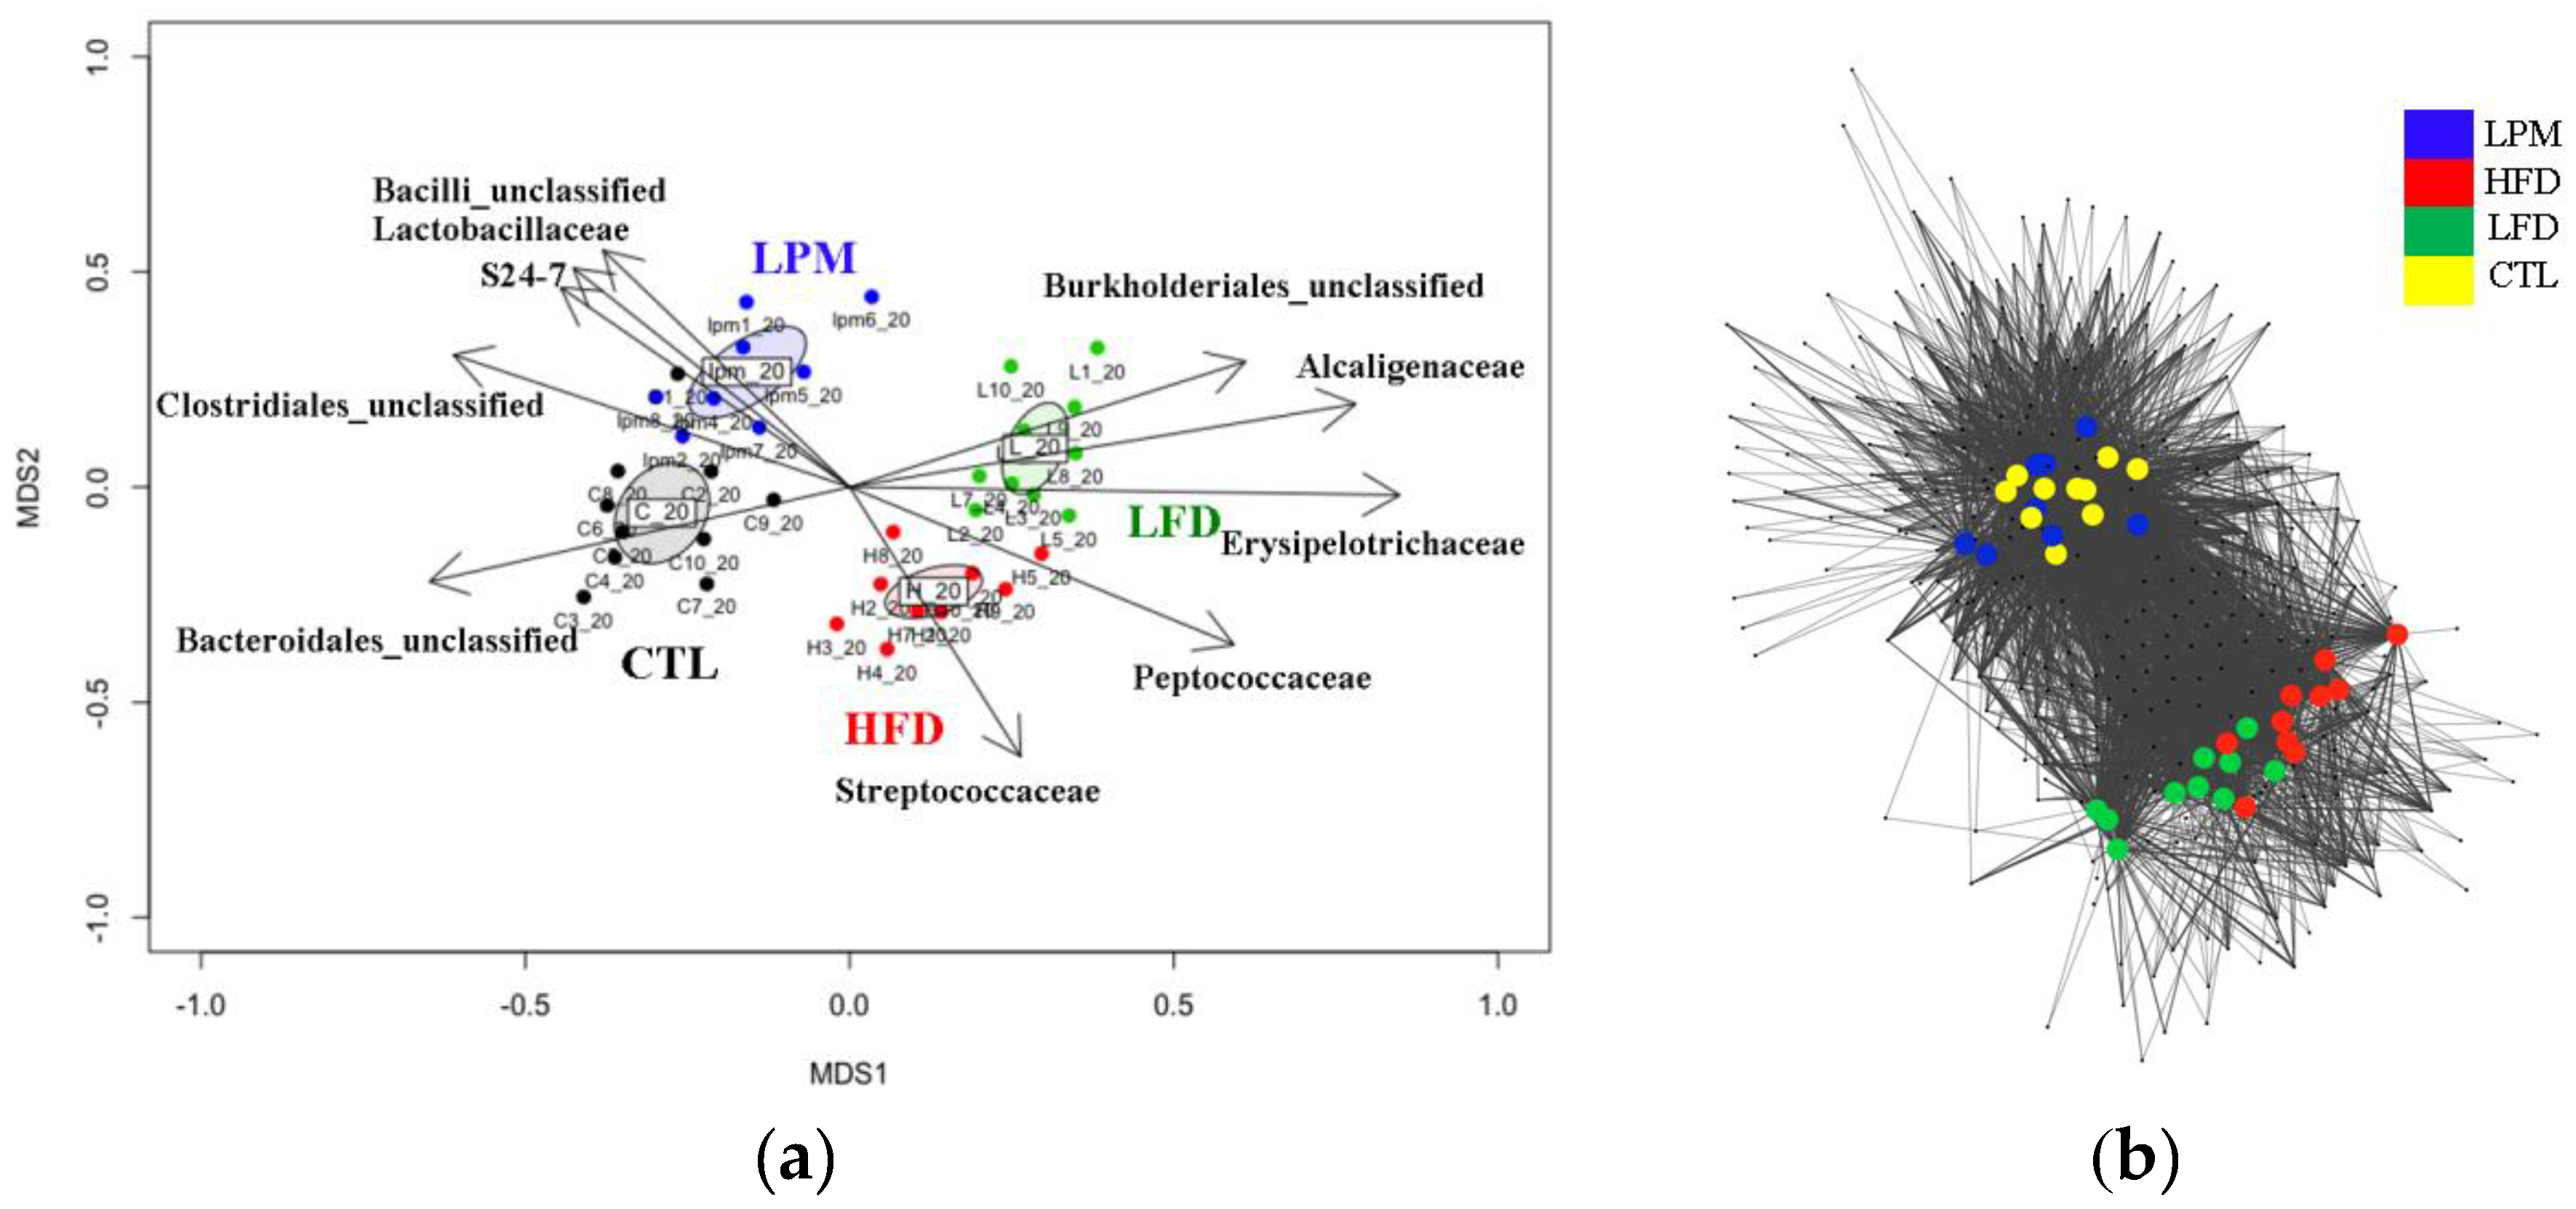
3.2. Gut Microbial Community Comparison

A total of 134,266 MiSeq reads and 99,992,814 HiSeq reads were obtained in order to investigate bacterial community differences across the groups used in this study (Table S3). A rarefaction curve confirmed that adequate reads were obtained for microbial community analysis (Figure S3). Comparison of ecological indices indicated that the HFD and LFD groups had significantly decreased species richness (p < 0.05), whereas no significant differences in species evenness were observed (Figure S4). The LPM treatment did not have any statistical effect on species richness or evenness.
Non-metric multidimensional scaling (NMDS) analysis demonstrated that all induction methods clearly shifted the gut microbiota (p < 0.001), and network analysis clearly separated the HFD and LFD groups from the CTL and LPM groups (Figure 2).
Results in Figure 2 show that HFD- and LFD-diets shifted the gut microbiota by altering both the species present and their abundance, whereas the LPM treatment only changed the abundance of existing species. Heatmap cluster analysis, done based on taxonomic composition, allowed clear separation of samples at the family level, but showed no significant differences at the phylum level (Figure S5). Therefore, correlation analysis between family level taxonomic composition and NMDS plots were analyzed.
Results in Figure 2A show that the HFD- and LFD-diet groups contained significantly decreased (p < 0.05) abundance of the unclassified family belonging to the phylum Bacteroidetes and increases in members of the families Erysipelotrichaceae and Alcaligenaceae. The abundance of members of the family S24-7 was significantly (p < 0.01) and positively correlated with the shift in gut microbiota caused by feed LPM.
DMM bacterial community type analysis divided the samples into two groups: CTL–LPM and HFD–LFD at the genus level. The top 10 genera responsible for this separation are shown in Table 1.
Diet treatment increased Bacteroides, Clostridium (Erysipelotrichaceae), Sutterella, Parabacteroides, and rc4-4, while decreasing Lactobacillus and unclassified genera belonging to Clostridiales, Bacteroidales, Bacilli, and S24-7. DMM did not show community type difference between CTL and LPM. To investigate difference between CTL samples and each treatment, we conducted LEfSe test to identify differentially abundant genera (Figure 3).
LEfSe analyses showed significant increases in Sutterella and decrease in unclassified genera in Bacteroidales and Bacteroidetes in all treatments (p < 0.05). HFD and LFD increased Mucispirillum, Parabacteroides, Oscillospira, Clostridium, and rc4-4, while decreasing Lactobacillus, Candidatus Arthromitus, and unclassified genera of Clostoridiales and Bacilli (p < 0.05). Lactococcus in HFD mice and Bifidobacterium in LFD mice were also significantly increased (p < 0.05).

3.3. Analysis of Genes Involved in the Butanoate Metabolism Pathway

The analysis of differentially abundant KEGG reaction modules indicated that 19 genes and three KEGG entries were related to butyrate synthesis. These genes and entries are mapped to KEGG butanoate metabolism map (kegg00650) and summarized in Figures S7–S9 for HFD, LFD, and LPM, respectively. When compared to CTL mice, the HFD mice were depleted of buk (420 TPM) and ptb (399 TPM), followed by gabD (38 TPM; Table S4), but were enriched with 2.3.1.54 (2105 TPM) and adhE (1121 TPM), followed by BDH (443; Table S5). Similarly, the LFD mice were depleted of buk (372 TPM), and ptb (351 TPM), followed by paaH (314 TPM; Table S6), and enriched with 2.3.1.54 (2077 TPM), followed by BDH (285 TPM) and atoD (205 TPM; Table S7). Lastly, the LPM mice were depleted of adhE (599 TPM), ACAD (515 TPM), and paaH (459 TPM), followed by crt (407 TPM) (Table S8) and enriched with ptb (1475 TPM) and buk (1460 TPM), followed by gabD (165 TPM) (Table S9).
The buk and ptb genes were depleted in both the HFD and LFD groups, and were classified to Bacteroidales and Parabacteroides. In contrast, these genes were enriched in the LPM group and classified to Bacteroidales and Bacteroides. The gabD gene, which was depleted by the HFD, but enriched by LPM, was classified to Lactobacillus.
The HFD and LFD treatments particularly enriched genes involved in acetyl-CoA synthesis from pyruvate (2.3.1.54). While these genes were classified to diverse taxa, such as Bacteroidales and Clostridiales in the HFD group, they were mainly classified to Bacteroides in the LFD group. The LFD and LPM treatments both depleted paaH, which was classified to Oscillibacter valericigenes and Roseburia hominis. In this study, differential gene mapping to lysine degradation (map00310) did not appear to be involved in butyrate synthesis (data not shown).

4. Discussion

4.1. Duration of Feeding Trial for Reduction in Butyrate Synthesis

We conducted a feeding trial for three weeks to investigate the differences across the treatment groups used in this study. Shifting of gut microbiota by diet usually takes no longer than a week [31], and we also observed a significant gut microbiota shift at day 7 (p < 0.001), which was maintained for two additional weeks (Figure S6). Therefore, the three weeks was more than adequate to capture microbial shifts caused by the diets.
We also observed significant decrease in mucins, mucosa thickness, and butyrate in the gut. It has been reported that longer treatments of diet-induced dysbiosis (5 and 13 weeks for LFD and HFD, respectively) eventually causes physiological changes such as obesity and constipation [32,33]. Since our focus is on butyrate synthesis, a longer feeding trial would likely involve other factors leading to dysbiosis.

4.2. Mechanisms in Butyrate Reduction Induced by HFD, LFD, and LPM Treatments

SCFAs (short chain fatty acids) are byproducts of bacterial carbohydrate fermentation in the gut. The concentrations of luminal SCFAs differ depending on the bacteria and carbohydrates present in the gut. Among intestinal bacteria, Eubacterium, Roseburia, and Faecalibacterium are known SCFA producers [34], while Bifidobacterium and Lactobacillus are the substrate providers [35]. Brown et al. [13] suggested that optimal butyrate concentration in gut can be maintained by having abundant butyrate-producing bacteria and lactate-producing bacteria. Moreover, Bacteria in the gut are known to communicate by syntrophic interactions (cross-feeding) [36], thus, other bacteria may also play important roles in butyrate production.

4.2.1. Butyrate Reduction Mechanism(s) Induced by HFD

In this study, we observed significant loss of Lactobacillus in HFD samples, and taxonomic classification of contigs indicated the depletion of gabD is mainly due to the loss of Lactobacillus (Table S4), resulting in decreased synthesis of butyrate from succinate. Moreover, HFD decreased the abundance of the butyrate producers Parabacteroides and Bacteroides (in the Bacteroidales) that contain the buk and ptb genes. Conversely, HFD increased the Bacteroidales, especially Bacteroides, who can convert pyruvate into acetyl-CoA (KEGG 2.3.1.54). Acetyl-CoA can be subsequently metabolized to butyrate. In this case, however, depletion of the buk and ptb genes did not allow for butyrate synthesis. The unused acetyl-CoA indirectly increases fat storage by feedback inhibition. The HFD treatment also increased the relative abundance of Lactococcus, a known probiotic species [37]. In contrast, many obese people are colonized with Lactococcus [38], suggesting that probiotic effects of Lactococcus are host, or bacterial species- or strain-specific. These Lactococcus species with aldehyde-alcohol dehydrogenase gene adhE are known to convert substrates into alcohol rather than lactate [39], further reducing syntrophically-produced lactate. Lastly, the HFD also increased a member of the genus rc4-4, belonging to the phylum Firmicutes. This genus is known as a diet-induced, obesity-associated bacterium [40], but its function has not been reported.

4.2.2. Butyrate Reduction Mechanisms Induced by LFD

The LFD also depleted butyrate producers containing buk and ptb genes. LEfSe analysis showed an increase in Bifidobacterium, a known lactate producer, by LFD treatment (Figure 3B). Functional gene analysis, however, showed the increase of the Bifidobacterium is related to the increase in its pyruvate formate-lyase (KEGG 2.3.1.54) activity (Table S7). In this case, pyruvate is used for acetyl-CoA production rather than lactate production [41], although large part of the acetyl-CoA production was likely performed by members of the Bacteroides and Parabacteroides.

4.2.3. Butyrate Reduction Mechanisms Induced by LPM

In this study, we did not observe gut dysmotility in the LPM treated mice. In addition, gut microbiota shifts in the LPM-treated mice were smaller compared to those of the HFD and LFD treated mice. Nevertheless, the LPM treatment shifted gut microbiota by increasing species of the S24-7 family and members of the genus Sutterella, consistent with a previous report by Touw et al. [42]. The family S24-7 is a member of uncultured Bacteroidales, and contain commensal intestinal bacteria of homeothermic animals, particularly mice. However, the metabolic functions of these species are still unknown [43]. Unlike HFD and LFD, the LPM treatment enriched ptb and buk. However, LPM depleted four KEGG reaction modules (adhE, ACADS, paaH and crt) possessed by unclassified bacteria (Table S8). All of these enzymes are necessary to utilize acetyl-CoA to produce crotonoyl-CoA, an intermediate metabolite for butyrate, except for adhE. Therefore, the increase in ptb and buk genes does not likely lead to an increase in the production of butyrate.

4.3. Other Bacteria Involved in Gut Dysbiosis

In all treatments, we found an increase in Sutterella and Clostridium (family Erysipelotrichaceae) and a decrease in Anaeroplasma (Figure 3). The family Alcaligenaceae (genus Sutterella) can adhere to epithelial cells, and is associated with autism, Downs syndrome, and inflammatory disease [44,45]. The family Erysipelotrichaceae is known to be associated with inflammation-related gastrointestinal diseases, although a large part of its functions are still unknown [46]. The decrease in the mucosal thickness induced by the loss of luminal butyrate may have allowed the increase of Sutterella and Erysipelotrichaceae, since they colonize epithelial cells. A decrease in Anaeroplasma has been reported to be associated with fecal hardness [47] and diet-induced obesity [48], suggesting that members of this genus negatively correlate with gut dysbiosis. Diet-induced gut dysbiosis has been reported to increase the abundances of Mucispirillum, Parabacteroides, Oscillospira, and Anaerotruncus. Mucispirillum colonizes mucosal layers in rodents, and is associated with gut inflammation [49]. Loy et al. [50] suggested that Mucispirillum may modify mucosal gene expression in the host. Parabacteroides is also known to be associated with diet-induced obesity. Lecomte et al. [51] reported that Parabacteroides is one of the major succinate producers in the gut, and is also associated with obesity. Oscillospira is anaerobic bacteria that has been difficult to culture. Oscillospira has been reported to be capable of utilizing host glycans, but is not a fiber degrader. Interestingly, this bacterium increases with consumption of a high-fat diet, and it has been known to be associated with leanness in human [52]. Due to the difficulties in growing this bacterium, Gophna et al. [53] used a metagenomics approach to infer its function. They reported that it may be a butyrate producer, and is associated with leanness and negatively correlated to intestinal inflammation, which contradicts our results. Further studies are required to understand the role of this bacterium. Lastly, Anaerotruncus have been reported to be positively correlated with bloating and abdominal pain in humans [54]. Although the role of this bacterium in mice is unknown, the increase of Anaerotruncus may have negative effects on health.
In summary, we evaluated three treatment models often used to induce gut dysbiosis in mice, for effects on the structure and function of intestinal microbiota. We observed that butyrate production was inhibited in all dysbiosis models. MiSeq-based microbial community analysis indicated that these treatments shifted microbiota differently, and HiSeq-based metagenome analysis demonstrated that these treatments likely inhibited multiple butyrate biosynthetic pathways. Since our results suggest that the mechanism of butyrate inhibition may differ depending on which pathway is involved, different strategies may need to be adopted for efficiently cure gut dysbiosis.

Supplementary Materials

The following are available online at www.mdpi.com/2073-4425/8/12/350/s1. Figure S1: Time series bioparametric changes for body weight, food/water intake, and fecal output/gram of feed; Figure S2: Images and thickness (μm) of mucosa stained with alcian blue; Figure S3: Rarefaction curve analysis for CTL, HFD, LFD, and LPM samples, indicated C, H, L, and lpm, respectively. “_20” indicates “day 20” when samples were obtained; Figure S4: Comparison of ecological indices between constipated mice gut microbiota: (A) for species richness; (B) for species evenness. Different letters indicate significant difference according to Duncan’s multiple range test (p < 0.05). Figure S5: Taxonomic composition comparison: (A) at the phylum; (B) at the family level. Black, red, green, and blue indicate CTL, HFD, LFD and LPM, respectively; Figure S6: Comparison of gut microbiota at day 7 and day 20. C, H, L, and lpm indicate control, high fat diet, low fiber diet, and loperamide groups, respectively. Numbers after sample names indicate day of the feeding trial. Figure S7: Significantly affected KEGG reaction modules by high-fat diet treatment; Figure S8: Significantly affected KEGG reaction modules by low-fiber diet treatment; Figure S9: Significantly affected KEGG reaction modules by loperamide treatment; Table S1: Calories of feeds used in this study. Table S2: Changes in body weight, feed intake, water intake, and fecal parameters of mice at day 21. Table S3: Average number of reads, operational taxonomic units, and structural genes for MiSeq and HiSeq. Table S4: Abundance (TPM) and taxa of CTL contigs with higher differential abundance compared to HFD. Table S5: Abundance (TPM) and taxa of HFD contigs with higher differential abundance compared to CTL; Table S6: Abundance (TPM) and taxa of CTL contigs with higher differential abundance compared to LFD; Table S7: Abundance (TPM) and taxa of LFD contigs with higher differential abundance compared to CTL; Table S8: Abundance (TPM) and taxa of CTL contigs with higher differential abundance compared to LPM; Table S9: Abundance and taxa of LPM contigs with higher differential abundance compared to CTL.

Acknowledgments

This research was supported by Traditional Culture Convergence Research Program through the National Research Foundation of Korea (NRF) funded by the Ministry of Science, ICT & Future Planning (NRF-2016M3C1B5907205), and the Basic Science Research Program through the National Research Foundation of Korea (NRF) funded by the Ministry of Education (2016R1A6A1A03012862). We are grateful to Sustainable Agriculture Research Institute (SARI) in Jeju National University for providing the experimental facilities.

Author Contributions

N.H. and T.E. performed the experiments; S.K.G., J.-H.L. and T.U analyzed the data; S.-Y.J. and D.-Y.J. contributed reagents/materials/analysis tools; Y.S.K, M.J.S, and T.U wrote the paper.

Conflicts of Interest

The authors declare no conflict of interest.

References

  1. Davie, J.R. Inhibition of histone deacetylase activity by butyrate. J. Nutr. 2003, 133, 2485S–2493S. [Google Scholar] [PubMed]
  2. Tang, Y.; Chen, Y.; Jiang, H.; Robbins, G.T.; Nie, D. G-protein-coupled receptor for short-chain fatty acids suppresses colon cancer. Int. J. Cancer 2011, 128, 847–856. [Google Scholar] [CrossRef] [PubMed]
  3. Donohoe, D.R.; Garge, N.; Zhang, X.; Sun, W.; O’Connell, T.M.; Bunger, M.K.; Bultman, S.J. The microbiome and butyrate regulate energy metabolism and autophagy in the mammalian colon. Cell Metab. 2011, 13, 517–526. [Google Scholar] [CrossRef] [PubMed]
  4. Gao, Z.; Yin, J.; Zhang, J.; Ward, R.E.; Martin, R.J.; Lefevre, M.; Cefalu, W.T.; Ye, J. Butyrate improves insulin sensitivity and increases energy expenditure in mice. Diabetes 2009, 58, 1509–1517. [Google Scholar] [CrossRef] [PubMed]
  5. Mattace Raso, G.; Simeoli, R.; Russo, R.; Iacono, A.; Santoro, A.; Paciello, O.; Ferrante, M.C.; Canani, R.B.; Calignano, A.; Meli, R. Effects of sodium butyrate and its synthetic amide derivative on liver inflammation and glucose tolerance in an animal model of steatosis induced by high fat diet. PLoS ONE 2013, 8. [Google Scholar] [CrossRef] [PubMed]
  6. Khan, S.; Jena, G.B. Protective role of sodium butyrate, a HDAC inhibitor on beta-cell proliferation, function and glucose homeostasis through modulation of p38/ERK MARK mapk and apoptotic pathways: Study in juvenile diabetic rat. Chem. Biol. Interact. 2014, 213, 1–12. [Google Scholar] [CrossRef] [PubMed]
  7. Schneeberger, M.; Everard, A.; Gomez-Valades, A.G.; Matamoros, S.; Ramirez, S.; Delzenne, N.M.; Gomis, R.; Claret, M.; Cani, P.D. Akkermansia muciniphila inversely correlates with the onset of inflammation, altered adipose tissue metabolism and metabolic disorders during obesity in mice. Sci. Rep. 2015, 5, 16643. [Google Scholar] [CrossRef] [PubMed] [Green Version]
  8. Ruas-Madiedo, P.; Gueimonde, M.; Fernandez-Garcia, M.; de los Reyes-Gavilan, C.G.; Margolles, A. Mucin degradation by bifidobacterium strains isolated from the human intestinal microbiota. Appl. Environ. Microbiol. 2008, 74, 1936–1940. [Google Scholar] [CrossRef] [PubMed] [Green Version]
  9. Tailford, L.E.; Crost, E.H.; Kavanaugh, D.; Juge, N. Mucin glycan foraging in the human gut microbiome. Front. Genet. 2015, 6, 81. [Google Scholar] [CrossRef] [PubMed]
  10. Jakobsdottir, G.; Xu, J.; Molin, G.; Ahrne, S.; Nyman, M. High-fat diet reduces the formation of butyrate, but increases succinate, inflammation, liver fat and cholesterol in rats, while dietary fibre counteracts these effects. PLoS ONE 2013, 8. [Google Scholar] [CrossRef] [PubMed]
  11. Wang, L.; Hu, L.; Yan, S.; Jiang, T.; Fang, S.; Wang, G.; Zhao, J.; Zhang, H.; Chen, W. Effects of different oligosaccharides at various dosages on the composition of gut microbiota and short-chain fatty acids in mice with constipation. Food Funct. 2017, 8, 1966–1978. [Google Scholar] [CrossRef] [PubMed]
  12. Tottey, W.; Feria-Gervasio, D.; Gaci, N.; Laillet, B.; Pujos, E.; Martin, J.F.; Sebedio, J.L.; Sion, B.; Jarrige, J.F.; Alric, M.; et al. Colonic transit time is a driven force of the gut microbiota composition and metabolism: In vitro evidence. J. Neurogastroenterol. Motil. 2017, 23, 124–134. [Google Scholar] [CrossRef] [PubMed]
  13. Brown, C.T.; Davis-Richardson, A.G.; Giongo, A.; Gano, K.A.; Crabb, D.B.; Mukherjee, N.; Casella, G.; Drew, J.C.; Ilonen, J.; Knip, M.; et al. Gut microbiome metagenomics analysis suggests a functional model for the development of autoimmunity for type 1 diabetes. PLoS ONE 2011, 6. [Google Scholar] [CrossRef] [PubMed]
  14. Louis, P.; Flint, H.J. Diversity, metabolism and microbial ecology of butyrate-producing bacteria from the human large intestine. FEMS Microbiol. Lett. 2009, 294, 1–8. [Google Scholar] [CrossRef] [PubMed]
  15. Lay, C.; Dore, J.; Rigottier-Gois, L. Separation of bacteria of the Clostridium leptum subgroup from the human colonic microbiota by fluorescence-activated cell sorting or group-specific PCR using 16s rRNA gene oligonucleotides. FEMS Microbiol. Ecol. 2007, 60, 513–520. [Google Scholar] [CrossRef] [PubMed]
  16. Pryde, S.E.; Duncan, S.H.; Hold, G.L.; Stewart, C.S.; Flint, H.J. The microbiology of butyrate formation in the human colon. FEMS Microbiol. Lett. 2002, 217, 133–139. [Google Scholar] [CrossRef] [PubMed]
  17. Anand, S.; Kaur, H.; Mande, S.S. Comparative in silico analysis of butyrate production pathways in gut commensals and pathogens. Front. Microbiol. 2016, 7, 1945. [Google Scholar] [CrossRef] [PubMed]
  18. Vital, M.; Howe, A.C.; Tiedje, J.M. Revealing the bacterial butyrate synthesis pathways by analyzing (meta)genomic data. mBio 2014, 5. [Google Scholar] [CrossRef] [PubMed]
  19. Kim, J.E.; Go, J.; Sung, J.E.; Lee, H.A.; Yun, W.B.; Hong, J.T.; Hwang, D.Y. Uridine stimulate laxative effect in the loperamide-induced constipation of SD rats through regulation of the mAChRs signaling pathway and mucin secretion. BMC Gastroenterol. 2017, 17, 21. [Google Scholar] [CrossRef] [PubMed]
  20. Schloss, P.D.; Westcott, S.L.; Ryabin, T.; Hall, J.R.; Hartmann, M.; Hollister, E.B.; Lesniewski, R.A.; Oakley, B.B.; Parks, D.H.; Robinson, C.J.; et al. Introducing mothur: Open-source, platform-independent, community-supported software for describing and comparing microbial communities. Appl. Environ. Microbiol. 2009, 75, 7537–7541. [Google Scholar] [CrossRef] [PubMed]
  21. Segata, N.; Izard, J.; Waldron, L.; Gevers, D.; Miropolsky, L.; Garrett, W.S.; Huttenhower, C. Metagenomic biomarker discovery and explanation. Genome Biol. 2011, 12, R60. [Google Scholar] [CrossRef] [PubMed]
  22. Holmes, I.; Harris, K.; Quince, C. Dirichlet multinomial mixtures: Generative models for microbial metagenomics. PLoS ONE 2012, 7. [Google Scholar] [CrossRef] [PubMed]
  23. Arumugam, M.; Raes, J.; Pelletier, E.; Le Paslier, D.; Yamada, T.; Mende, D.R.; Fernandes, G.R.; Tap, J.; Bruls, T.; Batto, J.M.; et al. Enterotypes of the human gut microbiome. Nature 2011, 473, 174–180. [Google Scholar] [CrossRef] [PubMed]
  24. Li, P.E.; Lo, C.C.; Anderson, J.J.; Davenport, K.W.; Bishop-Lilly, K.A.; Xu, Y.; Ahmed, S.; Feng, S.; Mokashi, V.P.; Chain, P.S. Enabling the democratization of the genomics revolution with a fully integrated web-based bioinformatics platform. Nucl. Acids Res. 2017, 45, 67–80. [Google Scholar] [CrossRef] [PubMed]
  25. Peng, Y.; Leung, H.C.; Yiu, S.M.; Chin, F.Y. Idba-ud: A de novo assembler for single-cell and metagenomic sequencing data with highly uneven depth. Bioinformatics 2012, 28, 1420–1428. [Google Scholar] [CrossRef] [PubMed]
  26. Li, H.; Durbin, R. Fast and accurate short read alignment with burrows-wheeler transform. Bioinformatics 2009, 25, 1754–1760. [Google Scholar] [CrossRef] [PubMed]
  27. Hyatt, D.; Chen, G.L.; Locascio, P.F.; Land, M.L.; Larimer, F.W.; Hauser, L.J. Prodigal: Prokaryotic gene recognition and translation initiation site identification. BMC Bioinform. 2010, 11, 119. [Google Scholar] [CrossRef] [PubMed]
  28. Moriya, Y.; Itoh, M.; Okuda, S.; Yoshizawa, A.C.; Kanehisa, M. KAAS: An automatic genome annotation and pathway reconstruction server. Nuleic Acids Res. 2007, 35. [Google Scholar] [CrossRef] [PubMed]
  29. Liu, B.; Pop, M. Metapath: Identifying differentially abundant metabolic pathways in metagenomic datasets. BMC Proc. 2011, 5. [Google Scholar] [CrossRef] [PubMed]
  30. Roewer, L.; Kayser, M.; Dieltjes, P.; Nagy, M.; Bakker, E.; Krawczak, M.; de Knijff, P. Analysis of molecular variance (amova) of Y-chromosome-specific microsatellites in two closely related human populations. Hum. Mol. Genet. 1996, 5, 1029–1033. [Google Scholar] [CrossRef] [PubMed]
  31. David, L.A.; Maurice, C.F.; Carmody, R.N.; Gootenberg, D.B.; Button, J.E.; Wolfe, B.E.; Ling, A.V.; Devlin, A.S.; Varma, Y.; Fischbach, M.A.; et al. Diet rapidly and reproducibly alters the human gut microbiome. Nature 2014, 505, 559–563. [Google Scholar] [CrossRef] [PubMed] [Green Version]
  32. Anitha, M.; Reichardt, F.; Tabatabavakili, S.; Nezami, B.G.; Chassaing, B.; Mwangi, S.; Vijay-Kumar, M.; Gewirtz, A.; Srinivasan, S. Intestinal dysbiosis contributes to the delayed gastrointestinal transit in high-fat diet fed mice. Cell. Mol. Gastroenterol. Hepatol. 2016, 2, 328–339. [Google Scholar] [CrossRef] [PubMed]
  33. Kakino, M.; Tazawa, S.; Maruyama, H.; Tsuruma, K.; Araki, Y.; Shimazawa, M.; Hara, H. Laxative effects of agarwood on low-fiber diet-induced constipation in rats. BMC Complement. Altern. Med. 2010, 10, 68. [Google Scholar] [CrossRef] [PubMed]
  34. Louis, P.; Scott, K.P.; Duncan, S.H.; Flint, H.J. Understanding the effects of diet on bacterial metabolism in the large intestine. J. Appl. Microbiol. 2007, 102, 1197–1208. [Google Scholar] [CrossRef] [PubMed]
  35. Duncan, S.H.; Louis, P.; Flint, H.J. Lactate-utilizing bacteria, isolated from human feces, that produce butyrate as a major fermentation product. Appl. Environ. Microbiol. 2004, 70, 5810–5817. [Google Scholar] [CrossRef] [PubMed]
  36. Shankar, V.; Homer, D.; Rigsbee, L.; Khamis, H.J.; Michail, S.; Raymer, M.; Reo, N.V.; Paliy, O. The networks of human gut microbe-metabolite associations are different between health and irritable bowel syndrome. ISME J. 2015, 9, 1899–1903. [Google Scholar] [CrossRef] [PubMed]
  37. Carlsson, M.; Gustafson, Y.; Haglin, L.; Eriksson, S. The feasibility of serving liquid yoghurt supplemented with probiotic bacteria, lactobacillus rhamnosus LB 21, and Lactococcus lactis L1A—A pilot study among old people with dementia in a residential care facility. J. Nutr. Health Aging 2009, 13, 813–819. [Google Scholar] [CrossRef] [PubMed]
  38. Million, M.; Maraninchi, M.; Henry, M.; Armougom, F.; Richet, H.; Carrieri, P.; Valero, R.; Raccah, D.; Vialettes, B.; Raoult, D. Obesity-associated gut microbiota is enriched in Lactobacillus reuteri and depleted in Bifidobacterium animalis and Methanobrevibacter smithii. Int. J. Obes. 2012, 36, 817–825. [Google Scholar] [CrossRef] [PubMed]
  39. Solem, C.; Dehli, T.; Jensen, P.R. Rewiring Lactococcus lactis for ethanol production. Appl. Environ. Microbiol. 2013, 79, 2512–2518. [Google Scholar] [CrossRef] [PubMed]
  40. Zietak, M.; Kovatcheva-Datchary, P.; Markiewicz, L.H.; Stahlman, M.; Kozak, L.P.; Backhed, F. Altered microbiota contributes to reduced diet-induced obesity upon cold exposure. Cell Metab. 2016, 23, 1216–1223. [Google Scholar] [CrossRef] [PubMed]
  41. Van der Meulen, R.; Adriany, T.; Verbrugghe, K.; De Vuyst, L. Kinetic analysis of Bifidobacterial metabolism reveals a minor role for succinic acid in the regeneration of NAD+ through its growth-associated production. Appl. Environ. Microbiol. 2006, 72, 5204–5210. [Google Scholar] [CrossRef] [PubMed]
  42. Touw, K.; Ringus, D.L.; Hubert, N.; Wang, Y.; Leone, V.A.; Nadimpalli, A.; Theriault, B.R.; Huang, Y.E.; Tune, J.D.; Herring, P.B.; et al. Mutual reinforcement of pathophysiological host-microbe interactions in intestinal stasis models. Physiol. Rep. 2017, 5. [Google Scholar] [CrossRef] [PubMed]
  43. Ormerod, K.L.; Wood, D.L.; Lachner, N.; Gellatly, S.L.; Daly, J.N.; Parsons, J.D.; Dal’Molin, C.G.; Palfreyman, R.W.; Nielsen, L.K.; Cooper, M.A.; et al. Genomic characterization of the uncultured Bacteroidales family S24–7 inhabiting the guts of homeothermic animals. Microbiome 2016, 4, 36. [Google Scholar] [CrossRef] [PubMed]
  44. Williams, B.L.; Hornig, M.; Parekh, T.; Lipkin, W.I. Application of novel PCR-based methods for detection, quantitation, and phylogenetic characterization of sutterella species in intestinal biopsy samples from children with autism and gastrointestinal disturbances. mBio 2012, 3. [Google Scholar] [CrossRef] [PubMed]
  45. Wang, L.; Christophersen, C.T.; Sorich, M.J.; Gerber, J.P.; Angley, M.T.; Conlon, M.A. Increased abundance of Sutterella spp. And Ruminococcus torques in feces of children with autism spectrum disorder. Mol. Autism 2013, 4, 42. [Google Scholar] [CrossRef] [PubMed]
  46. Kaakoush, N.O. Insights into the role of Erysipelotrichaceae in the human host. Front. Cell. Infect. Microbiol. 2015, 5, 84. [Google Scholar] [CrossRef] [PubMed]
  47. Zeng, B.; Han, S.; Wang, P.; Wen, B.; Jian, W.; Guo, W.; Yu, Z.; Du, D.; Fu, X.; Kong, F.; et al. The bacterial communities associated with fecal types and body weight of rex rabbits. Sci. Rep. 2015, 5, 9342. [Google Scholar] [CrossRef] [PubMed]
  48. Kang, S.S.; Jeraldo, P.R.; Kurti, A.; Miller, M.E.; Cook, M.D.; Whitlock, K.; Goldenfeld, N.; Woods, J.A.; White, B.A.; Chia, N.; et al. Diet and exercise orthogonally alter the gut microbiome and reveal independent associations with anxiety and cognition. Mol. Neurodegener. 2014, 9, 36. [Google Scholar] [CrossRef] [PubMed]
  49. Robertson, B.R.; O’Rourke, J.L.; Neilan, B.A.; Vandamme, P.; On, S.L.; Fox, J.G.; Lee, A. Mucispirillum schaedleri gen. Nov., sp. Nov., a spiral-shaped bacterium colonizing the mucus layer of the gastrointestinal tract of laboratory rodents. Int. J. Syst. Evolut. Microbiol. 2005, 55, 1199–1204. [Google Scholar] [CrossRef] [PubMed]
  50. Loy, A.; Pfann, C.; Steinberger, M.; Hanson, B.; Herp, S.; Brugiroux, S.; Gomes Neto, J.C.; Boekschoten, M.V.; Schwab, C.; Urich, T.; et al. Lifestyle and horizontal gene transfer-mediated evolution of Mucispirillum schaedleri, a core member of the murine gut microbiota. mSystems 2017, 2. [Google Scholar] [CrossRef] [PubMed]
  51. Lecomte, V.; Kaakoush, N.O.; Maloney, C.A.; Raipuria, M.; Huinao, K.D.; Mitchell, H.M.; Morris, M.J. Changes in gut microbiota in rats fed a high fat diet correlate with obesity-associated metabolic parameters. PLoS ONE 2015, 10. [Google Scholar] [CrossRef] [PubMed]
  52. Konikoff, T.; Gophna, U. Oscillospira: A central, enigmatic component of the human gut microbiota. Trends Microbiol. 2016, 24, 523–524. [Google Scholar] [CrossRef] [PubMed]
  53. Gophna, U.; Konikoff, T.; Nielsen, H.B. Oscillospira and related bacteria—From metagenomic species to metabolic features. Environ. Microbiol. 2017, 19, 835–841. [Google Scholar] [CrossRef] [PubMed]
  54. Zhang, Y.J.; Li, S.; Gan, R.Y.; Zhou, T.; Xu, D.P.; Li, H.B. Impacts of gut bacteria on human health and diseases. Int. J. Mol. Sci. 2015, 16, 7493–7519. [Google Scholar] [CrossRef] [PubMed]
Figure 1. Mucosa thickness and concentration of butyrate: (a) histological images of intestinal tissue; (b) mean values (n = 3) of mucosa thickness; and (c) concentration of cecum butyrate. Different letters on bars indicate significant difference (p < 0.05) according to the Duncan’s multiple range test.
Genes 08 00350 g001
Figure 2. Comparison of mice gut microbiota across different treatments: (a) non-metric multidimensional scaling analysis; and (b) network analysis with operational taxonomic units (distance = 0.03).
Genes 08 00350 g002
Figure 3. Analysis of differentially abundant genera. Red bars indicate control samples and green bars indicate high-fat diets (a); low-fiber diets (b); and loperamide administration (c).
Genes 08 00350 g003
Table 1. Top 10 genera with higher differences in Dirichlet multinomial mixtures analysis.
GroupMeanCumulative FractionGenus
TotalHFD–LFDCTL–LPM
CTL–LPM6.884.669.580.11Clostridiales unclassified
CTL–LPM4.162.426.690.2Lactobacillus
HFD–LFD40.2942.0137.80.29Bacteroides
HFD–LFD2.175.110.990.38Clostridium (Erysipelotrichaceae)
CTL–LPM1.60.74.090.46Bacteroidales unclassified
HFD–LFD2.333.861.270.51Sutterella
CTL–LPM1.380.633.090.57Bacilli unclassified
HFD–LFD3.324.152.230.61Parabacteroides
HFD–LFD2.513.411.560.65rc4-4
CTL–LPM0.690.251.820.68S24-7 unclassified

