Phylogenetic Analysis of the SNORD116 Locus


1
Translational Biology, Medicine and Health Graduate Program, Virginia Tech, Blacksburg, VA 24061, USA
2
Department of Human Nutrition, Foods, and Exercise, Virginia Tech, Blacksburg, VA 24061, USA
*
Author to whom correspondence should be addressed.
Genes 2017, 8(12), 358; https://doi.org/10.3390/genes8120358
Submission received: 31 October 2017
/
Revised: 25 November 2017
/
Accepted: 26 November 2017
/
Published: 30 November 2017
(This article belongs to the Special Issue Non-coding RNAs)
Abstract
:The SNORD116 small nucleolar RNA locus (SNORD116@) is contained within the long noncoding RNA host gene SNHG14 on human chromosome 15q11-q13. The SNORD116 locus is a cluster of 28 or more small nucleolar (sno) RNAs; C/D box (SNORDs). Individual RNAs within the cluster are tandem, highly similar sequences, referred to as SNORD116-1, SNORD116-2, etc., with the entire set referred to as SNORD116@. There are also related SNORD116 loci on other chromosomes, and these additional loci are conserved among primates. Inherited chromosomal 15q11-q13 deletions, encompassing the SNORD116@ locus, are causative for the paternally-inherited/maternally-imprinted genetic condition, Prader–Willi syndrome (PWS). Using in silico tools, along with molecular-based and sequenced-based confirmation, phylogenetic analysis of the SNORD116@ locus was performed. The consensus sequence for the SNORD116@ snoRNAs from various species was determined both for all the SNORD116 snoRNAs, as well as those grouped using sequence and location according to a human grouping convention. The implications of these findings are put in perspective for studying SNORD116 in patients with inherited Prader–Willi syndrome, as well as model organisms.
1. Introduction
While we have known about the RNA molecule for over 100 years [1], RNA was originally thought to take just three major forms: transfer RNA, ribosomal RNA and the messenger RNA that codes for protein [2]. As our genomes were further dissected and more sophisticated technologies for sequencing and quantifying small RNAs were developed, both long and small families of non-coding RNA were discovered. In fact, mRNA makes up only 1–2% of the total expressed RNA, with the rest of the transcribed RNA remaining untranslated [3,4,5]. One of these families of non-transcribed RNAs is the small nucleolar RNA family, or snoRNAs. This family of short, 60–170-nt RNAs includes two major groups, the C/D box snoRNAs and H/ACA snoRNAs, as well as subfamilies of each, which are so named by the motifs they contain (C/D or H/ACA boxes) [6]. These motifs specify RNA secondary structure, and interaction with both other RNAs and RNA-binding proteins [6].
The fact that humans and many other animals transcribe these snoRNA only leads to more questions, as many of the targets for these snoRNAs are not known; and in many cases, it is not clear what the very function of each is [6]. In this short communication, which focuses on the C/D box snoRNA group SNORD116@, the question of whether conservation of sequence between species can be used to identify regions that are key for the regulatory and functional properties of a snoRNA group such as SNORD116@ will be investigated. The human SNORD116@ locus (previously known as HBII-85) encodes up to 30 snoRNAs that belong to the C/D box family of snoRNAs [7]. In several publications, the human SNORD116@ locus snoRNAs have been grouped by location on the chromosome into three groups, with Group I consisting of SNORD116-1–SNORD116-9, Group II of SNORD 116-10–SNORD116-23 and Group III of SNORD116-24–SNORD116-27 [8]. Later studies included SNORD116-28 and SNORD116-29 snoRNAs in the human locus within Group III [9].
No known RNA targets have been identified for SNORD116@, although the related and adjacent SNORD115@ locus RNAs share an 18-nucleotide sequence complementarity to the serotonin receptor 2C pre-mRNA and appear to mediate differential splicing by promoting the inclusion of an alternative exon when SNORD115 is present [10]. Both SNORD116@ and SNORD115@ are deleted in the genetically-inherited syndrome Prader–Willi syndrome (PWS; Online Mendelian Inheritance in Man (OMIM) #176270), https://www.omim.org/ [7]. However, the smallest known deletions that still cause clinical PWS contain or overlap with SNORD116 [11], suggesting that deletion of the SNORD116@ locus plays a direct causative role in PWS.
PWS results from a 15q11-q13 deletion in an imprinted region that is normally active only from the paternal allele. Thus, deletion of the paternally-inherited allele causes PWS, while deletion of a maternally-inherited allele has no known effect, as the maternally-inherited allele is not expressed [11]. Individuals with PWS display developmental delay and hypogonadism, accompanied by intellectual disabilities [12]. With an occurrence rate of one in 15,000–25,000 individuals, PWS is considered to be the leading cause of life-threatening childhood, genetically-inherited obesity [12]. The central 485-kb PWS region contains the SNURF-SNRPN region, which is most frequently deleted in PWS [13]. This region contains at least 148 expressed exons, including SNORD116@ and SNORD115@ loci. Fine analysis of the deleted regions of many clinically-diagnosed patients revealed one family with Angelman syndrome (due to maternal deletion on 15q), whose deletion extended to SNORD115@, but who did not show PWS phenotypes [14]. Three separate patients have been diagnosed with PWS caused by different, overlapping microdeletions in 15q, which all encompass the SNORD116@ locus. However, these patients do not show some of the facial and hand features typical of PWS, but do show macrocephaly and tall stature, phenotypes not in typical PWS presentation. A single patient with a 118-kb microdeletion, which only includes IPW, SNORD1091 and SNORD116@, plus a small amount of intergenic region on either side of that cluster, has all of the clinical features of PWS [15]. Importantly, paternally-deleted Snord116p-/m+ mice re-capitulate many, although not all, of the clinical phenotypes seen in human PWS; namely, they fail to develop obesity [16,17].
Using pluripotent stem cell-induced neurons from the microdeletion patients, along with the Snord116p-/m+ mouse model, Burnett and colleagues were able to show that the Nhlh2/NHLH2 gene is significantly downregulated in PWS [18]. Mice with a deletion of Nhlh2 show adult-onset obesity [19], suggesting that the obese phenotype of PWS patients may involve SNORD116-mediated regulation of NHLH2. Considering the human clinical cases and the mouse Snord116p-/m+ knockout model together, a strong case can be made that deletion of SNORD116@ is the most plausible mechanism for the development of the main clinical phenotypes of PWS. Thus, it is imperative that we start to understand what the SNORD116 snoRNAs do and to identify any RNA or protein targets that interact with them. In addition, large deletions within the PWS locus, such as those encompassing the MAGEL, SNORD115@ and NDN loci, complicate the genotype-phenotype relationship as these losses likely extend the phenotypic landscape of the condition, compared to patients with the smaller or microdeletion patients.
In this study, SNORD116@ sequences from humans and other species were compared phylogenetically, at the level of nucleotide sequence to identify conserved regions. The regions of the SNORD116 snoRNA with the greatest potential for target-specific interactions are discussed, as well as how function may vary between primate and rodent species.
2. Materials and Methods
2.1. Data Acquisition
Sequences were obtained from Ensembl Release 90, using genome assemblies GRCh38.p10 (human), CHIMP2.1.4 (chimpanzee), Mmul_8.0.1 (rhesus macaque), OryCun_2.0 (rabbit), Rnor_6.0 (rat) and GRCm38.p5 (mouse). The tracks used for analysis were: genes (Ensembl) (every species except human and mouse), GENCODE 27 (human tracks) and GENCODE M15 (mouse tracks). The GENCODE project (https://www.gencodegenes.org/) provides reference sequence information for both human and mouse genomes, and merges both Havana manual gene annotation and the Ensembl automated gene annotation. The numbers indicate the version used in this study.
2.2. Sequence Analysis
Sequences were aligned using Clustal Omega multiple sequence alignment (https://www.ebi.ac.uk/Tools/msa/clustalo, EMBL-EBI, Wellcome Genome Campus, Hinxton, Cambridgeshire, CB10 1SD, UK/), MAFFT, multiple alignment program for amino acid or nucleotide sequences, Version 7 (https://mafft.cbrc.jp/alignment/server/, Computation Biology Research Consortium, Tokyo, Japan), and BioEdit biological sequence alignment editor, Version 7.2.6.1 (http://www.mbio.ncsu.edu/bioedit/bioedit.html, Ibis Therapeutics, Carlsbad, CA, USA). Consensus sequences were created in BioEdit using a threshold frequency of inclusion in the consensus of 90%. Sites that did not meet the threshold were notated using IUPAC ambiguity codes. Sequences are displayed as DNA rather than RNA, indicating T’s in place of U’s for all analyses.
2.3. Sequence Subgrouping
Human SNORD116@ followed a previous grouping method [8,9] consisting of Groups I, II and III. Additionally, Group I within chimp, rhesus and rabbit was defined as transcripts with 95% homology to the 1st SNORD116 transcript downstream of the SNURF/SNRPN site. Group I transcripts in human are found tandem along the genome in the direction of transcription. For the purpose of the analyses, this is how transcripts were ‘numbered’ for species that are not annotated with numbered SNORD116 names (i.e., rhesus, chimp and rabbit SNORD116-1s were classified as the closest SNORD116 downstream of the SNURF/SNRPN transcription site). The tandem SNORD transcripts that follow were classified as 116-2, 116-3, and so on. This resembles the naming scheme of human SNORD116 individual transcripts.
Mouse and rat Snord116@ members do not follow this naming scheme. For example, Snord116s 116-1, 116-2 and 116-3 are not found tandem to each other or closest to the Snurf/Snrpn locus. Rat Snord116s were instead classified into Group I by using a template Snord116 transcript that resulted in the largest group of transcripts with 95% homology (Snord116.3). Mice Snord116s were not grouped, as all 70 potential Snord116 sequences show 95% homology or more.
For primates, Groups II and III were informed by previous groupings of human SNORD116 [8,9]. Sequences within a species were grouped according to clusters of high homology that show tandem appearance in the SNORD116@ locus, with Group I including genes closest to Group II transcripts on the genome. In rabbit and rat, further groupings beyond Group I showed much less homology. The remaining ungrouped sequences outside of Group I were grouped using a homology threshold of 80%, excluding any sequence with a lower homology. This left 2 sequences ungrouped in both rat and rabbit.
Group I: human (116-1–116-9); chimp (1–4, 6–8); macaque (1–9); rabbit (1–19); rat (116.3, 116.7, 116.8, 116.15, 116.16, 116.19, 116.23, 116.24, 116.25, 116.31, 116.35).
Group II: human (116-10–116-24); chimp (9–22); macaque (10–24); rabbit (20–27); rat (116.6, 116.20, 116.10, 116.21, 116.29, 116.12, 116.11, 116.27, 116.1, 116.34, 116.13, 116.28, 116.33).
Group III: human (116-25–116-30); chimp (23–28); macaque (25–29).
Ungrouped: chimp (5); rabbit (28, 29); rat (116.9, 116.17); mouse (116@).
2.4. Sequence Accession Codes
Ensembl SNORD116 transcript sequences used are provided with Ensembl accession codes and are displayed in order of shortest distance from the SNURF/SNRPN locus within the respective species (Supplemental Tables S1 and S2). In species without individually-annotated and numbered SNORD116 transcripts (e.g., macaque, chimp, rabbit), predicted gene names are omitted, and instead, the sequences are numbered starting from the one that is the shortest distance from the SNURF/SNRPN locus. All sequences are listed in order of the chromosome, starting with the sequence closest to the SNURF/SNRPN locus. Sequence alignments used for each species can be found in Supplemental Figures S1–S6.
3. Results and Discussion
A number of papers and reviews have compared the mouse Snord116@ sequences and genomic locus on murine chromosome 7, to the human SNORD116@ locus on human chromosome 15 (for a recent review, see [7]). While the overall structure and gene organization is similar between these two species and mouse deletion models of Snord116 replicate many, but not all of the phenotypes of PWS [16,17], there are differences between the copy numbers for the human and mouse SNORD116@ locus (Table 1). In addition, there are differences in the variability of the sequences between mice and humans. Using the Ensembl browser [20], there are 70 paralogs within the murine Snord116 family, and these are organized into two clusters, separated by approximately 50 kb (Table 1), not to be confused with the Snord115 cluster, which is separated further still. The total size of the Snord116 cluster on mouse chromosome 7 is 179,261 base pairs. In addition, of the 17 annotated Snord116 snoRNAs, most are nearly identical in sequence. Compare this to the 30 human SNORD116 annotated snoRNAs; while close in sequence, they are not nearly identical like mice. Rather, human SNORD116 snoRNAs can be divided by sequence into three paralogous groups [8,9]. In considering the structure of the human and mouse locus and comparing this to other species (Table 1), it appears that the murine locus had a duplication event at some point after divergence between Rodentia (mouse and rat) and Lagomorpha (rabbit). The Snord116 locus is similarly large in rat, although fewer Snord116 snoRNAs have been discovered in rat, compared to mice. Additionally, no orthologues of the SNORD116 gene were found outside of the class Mammalia [16].
In addition to the SNORD116 clusters found on chromosomes syngeneic to human chromosome 15 (Table 1), primates have paralogs on other chromosomes (Table 2). These paralogs are singly located paralogs to SNORD116, identified by BLAST analysis, but not found within the human chromosome 15 cluster (or syngeneic primate clusters). Most of these only possess partial C/C’ and D/D’ motifs, showing slight variance in nucleotides within a given motif. The importance of these other SNORD116 paralogs is not currently known, and due to the lack of complete C/C’ and D/D’ box motifs, it is questionable whether these genes are expressed and processed to form a mature snoRNA-protein complex (snoRNP), as the C/D motifs are required to escape degradation [21]. They were not included in further consensus analyses.
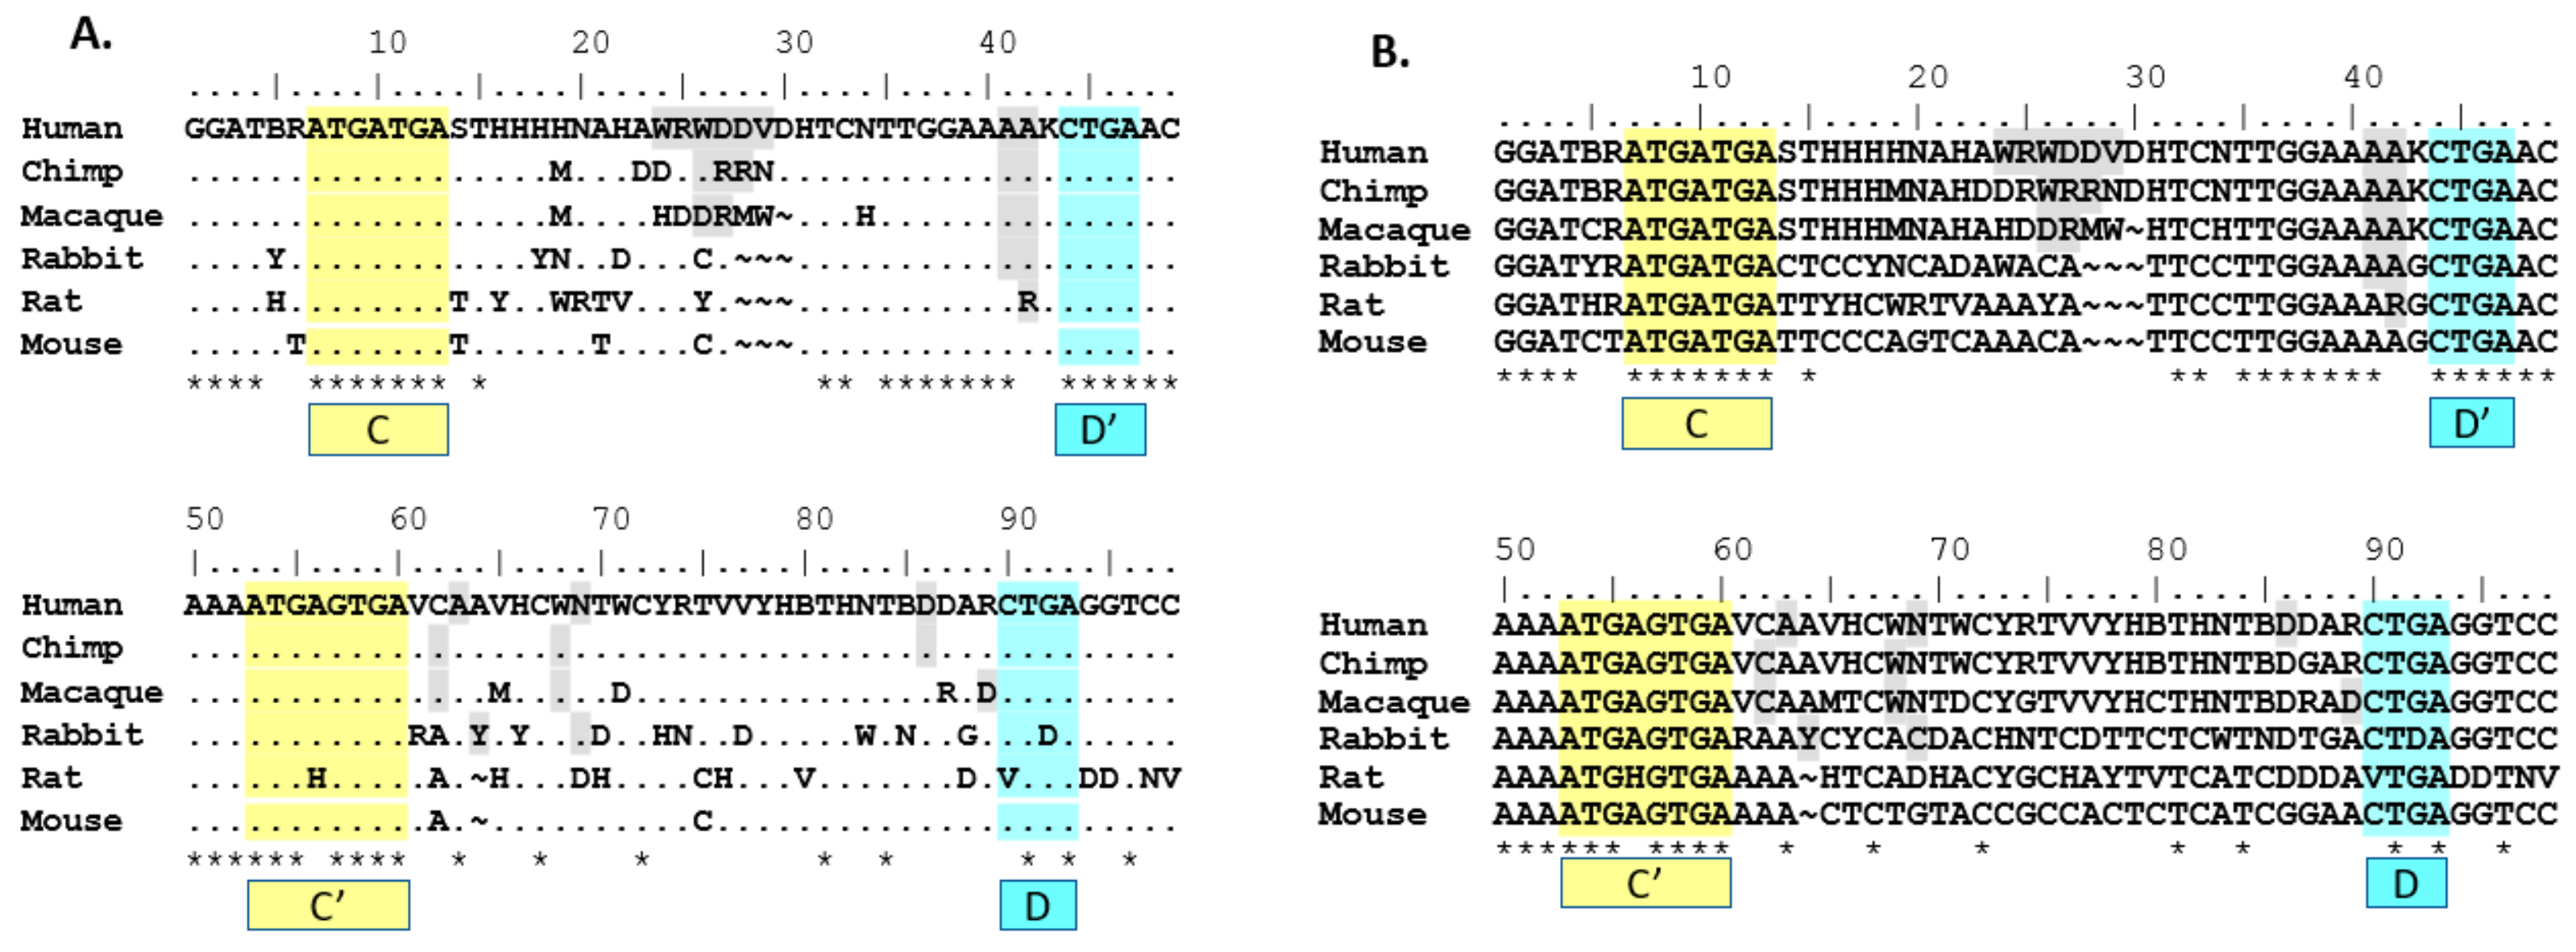
In order to begin to understand the relatedness and relationships between both paralogs and orthologs within the SNORD116 locus, a consensus sequence for each species SNORD116 cluster was generated (Figure 1). To do this, the sequences of each of the SNORD116 transcripts within the species cluster were compared. A consensus sequence was generated by using a threshold frequency for single nucleotide inclusion in the consensus of 90% of the SNORD116 snoRNAs. Nucleotides that did not meet the 90% threshold were indicated using IUPAC ambiguity codes. As shown, the location and sequence of the C/C’ and D/D’ boxes are conserved across species, with the exception of the C’ box in rat and the D box in rat and rabbit (Figure 1), which calls into question whether the transcripts that lack a complete C/C’ or D/D’ box are processed and expressed. In doing this comparison, 53 out of 98 (54%) nucleotides are conserved cross-species (when allowing non-perfect matches to ambiguous nucleotides; i.e., T is acceptable homology under a W site). Forty-nine out 98 (50%) nucleotides are conserved when using strict homology that only allows perfect matches; i.e., T is not an acceptable homology under a W site. The highest homology appears to include the region from 5’ of the D’ box through the C’ box, confirming our hypothesis that this analysis would yield homologous domains outside of the C/C’ and D/D’ domains.
When comparing consensus sequences for groups, it is important to note the difference in grouping method for rat Snord116 sequences. Because it differs from the primate and rabbit grouping method, it may not show the best fit with the rest of the Group I consensus sequences. For this reason, to explore which groups showed the most homology to the human groups, consensus sequences of various groups and animals were compared to the human consensus sequences of Groups I, II and III (Table 3). In fact, rat’s Group I appears to fit slightly better with human’s Group II, but only when using non-strict homology. Additionally, the mouse 116@ consensus sequence does not appear to cluster strongly within a human group consensus. Depending on either non-strict or strict homology rules, the mouse 116@ consensus sequence shows greater homology with either human Group II or Group I, respectively. This effect may be due in part to the higher number of ambiguous nucleotides found in human Group II (16) vs. Group I (8), combined with the lack of any ambiguous nucleotides in the mouse 116@ consensus sequence. This analysis is therefore inconclusive in the grouping of mouse Snord116 sequences into either human Group I or II, but indicates an exclusion from human Group III.
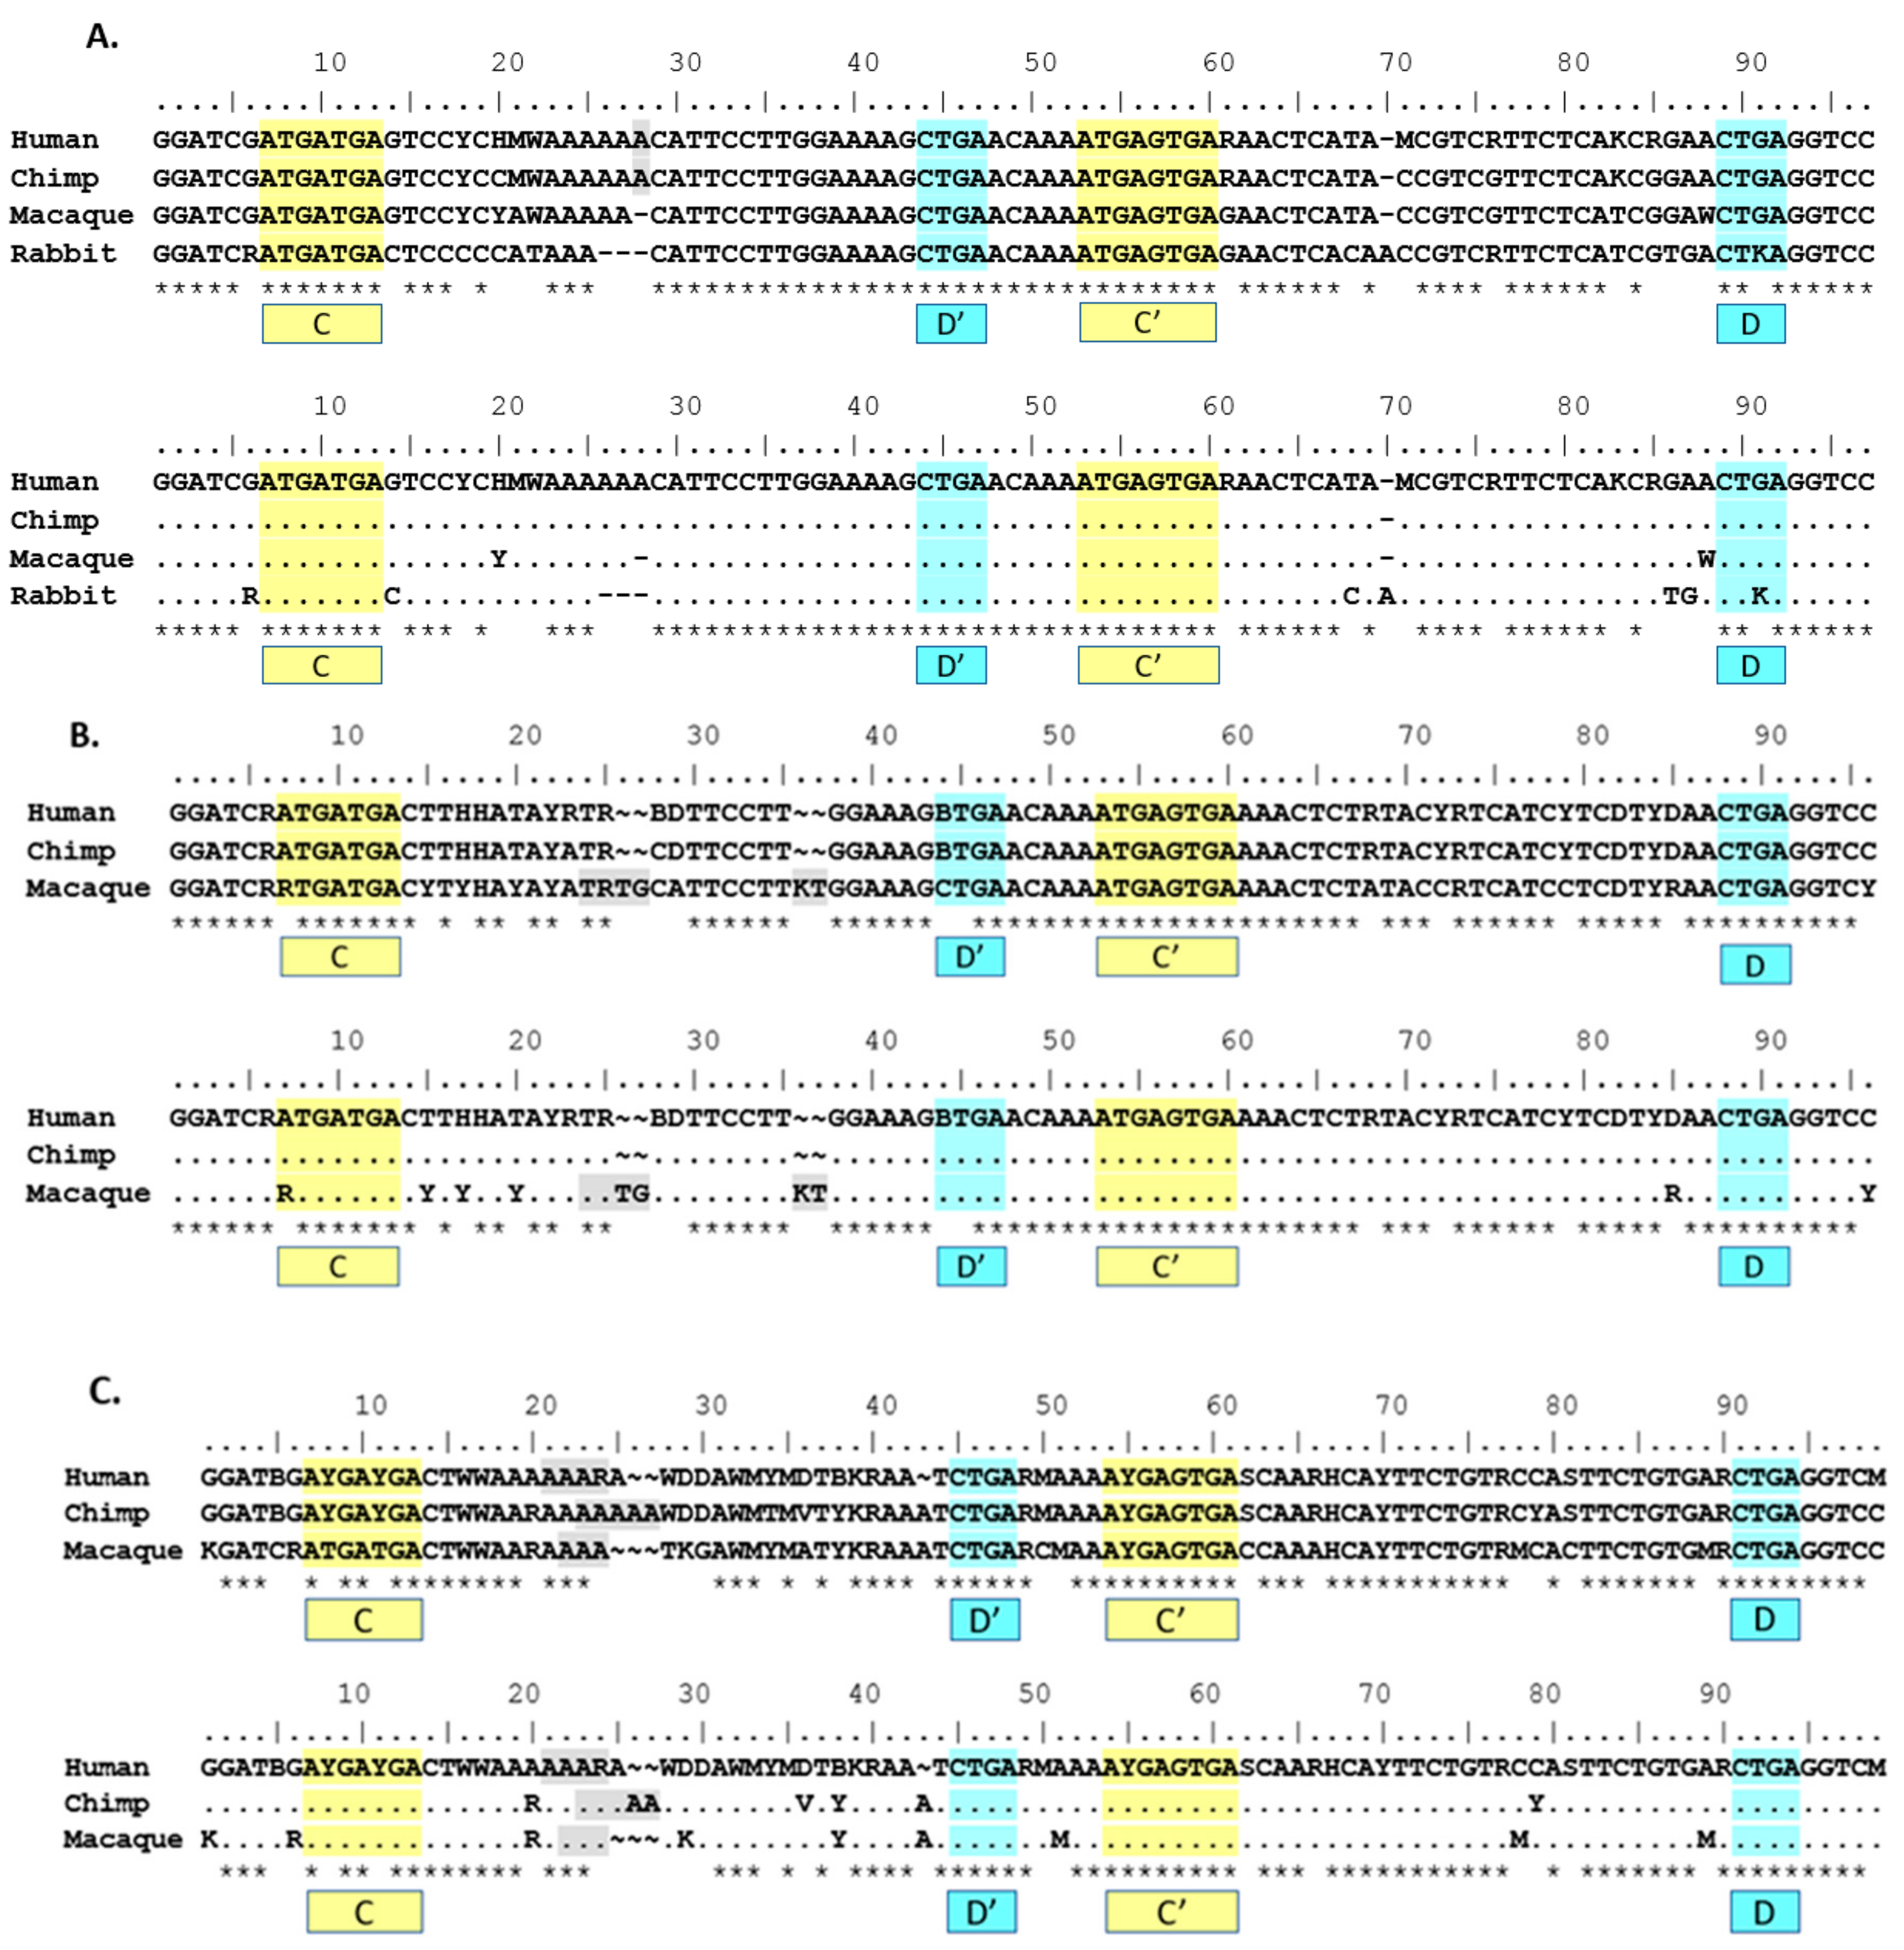
Patterns of homology observed in Table 3 informed alignments of between-species group consensus sequences in Figure 2. Due to different methods for defining and clustering rat groups, both rat Group I and Group II consensus sequences were excluded from group alignments in Figure 2. Rabbit Group I was included in the Group I between-species consensus sequence alignment due to the same grouping method used in primates and human, as well as the consistent fit with the human Group I consensus sequence as shown in Table 3. Rabbit Group II was excluded from the Group II alignment due to a lack of strong preferential fit to human Group II.
The use of phylogenetic sequence analysis on SNORD116 family members allows for an expansion of the homologous regions from just the C/C’ and D/D’ boxes to sequences outside of those regions, especially within the 5’ sequences of the transcripts and the region spanning D’ and C’. This finding was conserved using the human groupings for groups I, II and III (Figure 2A–C). Based on the proposed structure of a C/D box snoRNA, it is the region 5’ of the D/D’ box that may interact with target RNA and/or RNA binding proteins [7]. This predicted functional region is consistent with the expected variability in SNORD116 transcripts, as this is the antisense region that hybridizes to putative RNA targets for modification. Such variation observed would allow a wide range of putative targets if structural function is not compromised.
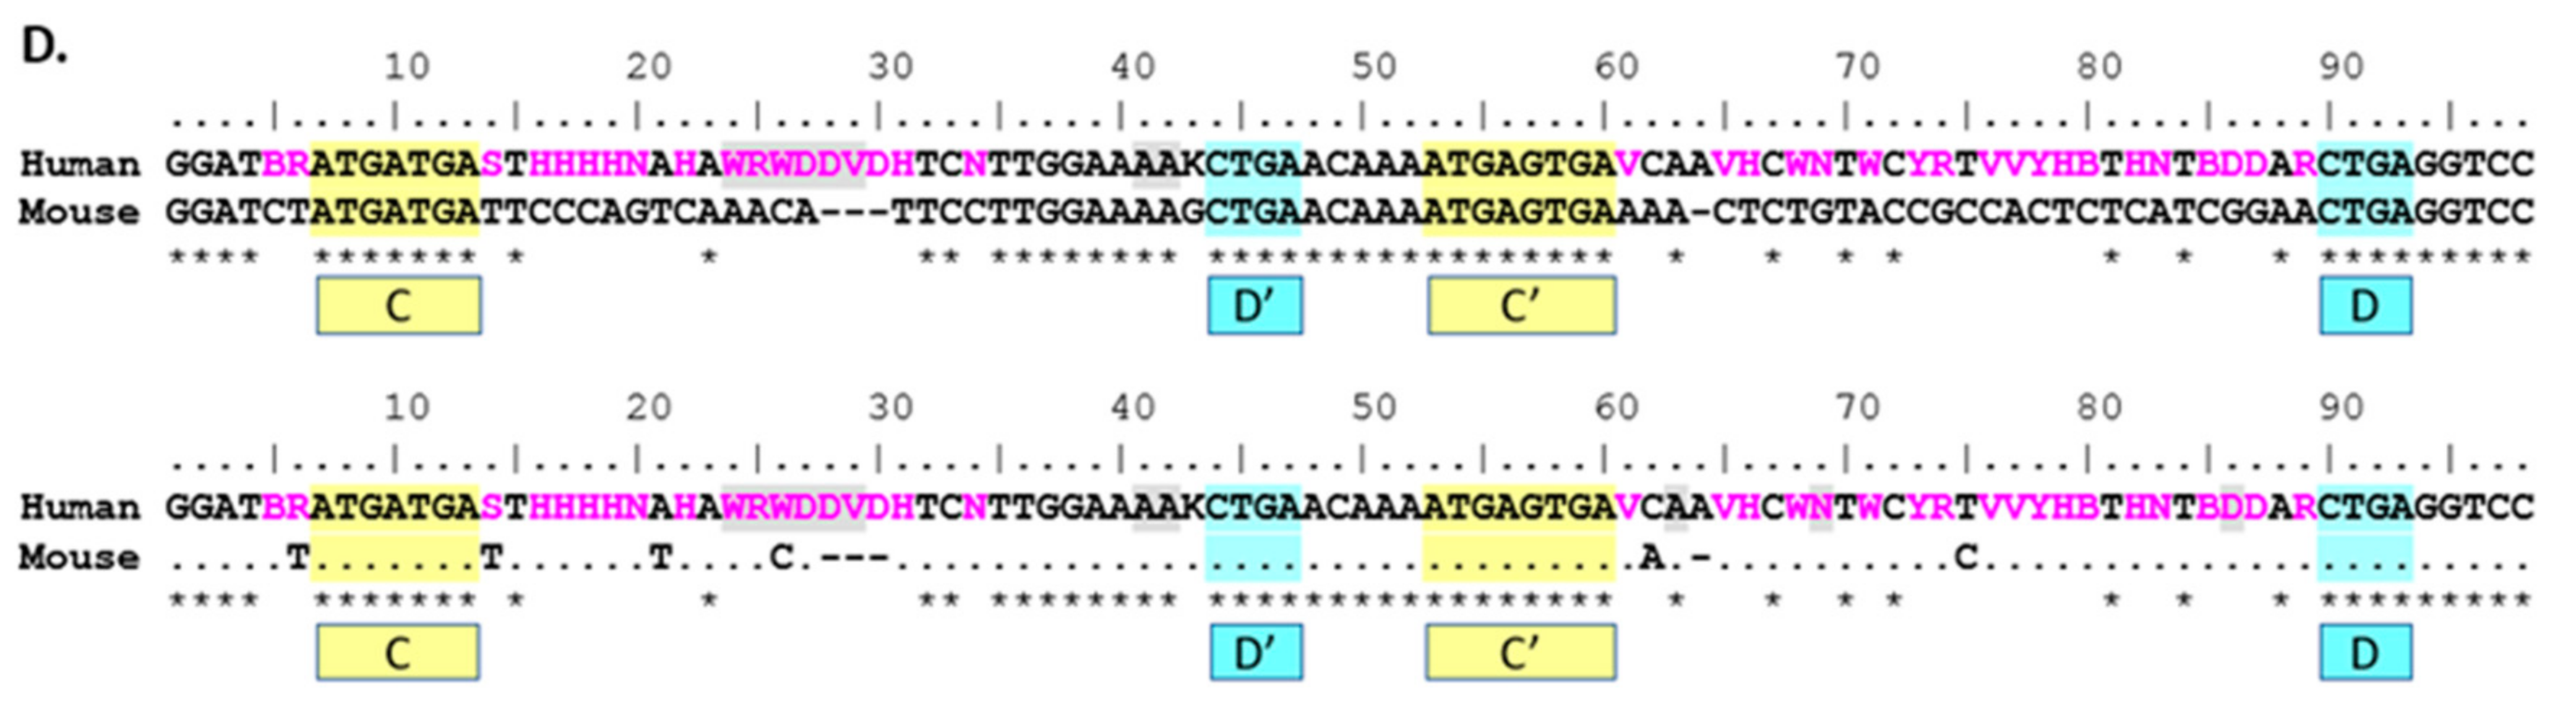
The direct comparison between mouse and human 116@ consensus sequences shows homology in the C/C’ and D/D’ boxes, as well as the 5’ and 3’ ends that form the stem structure in a functional SNORD. Additionally, nearly all the sequence is homologous in the non-strict sense, yet due to the high variation in human sequences, the antisense region 5’ of the D’ box shows a low strict homology indicated by the asterisks (*) in Figure 2D. Mouse 116@ is certainly very homologous when compared to human 116@, as mouse possesses no ambiguous nucleotides in the consensus sequence, whereas human possesses 37 ambiguous sites. As Groups II and III are largely responsible for this variance, this finding could partially explain why the expression of Groups II and III is relatively low [9]. For the region 5’ of the D’ box (nucleotides 32–42), there is highly strict homology, and contrastingly, the region 5’ of the D box (75–89) shows very low strict homology. This could be interpreted in multiple ways. Implications include that the region near the D’ box could play a large structural role, perhaps contributing to the stability of the individual snoRNAs or that this region may be important for the shared phenotypes seen in Snord116 deletion mice and PWS patients.
It is important to note that the consensus sequences are created from a multiple sequence alignment. The specific alignment used will influence the resulting consensus sequences. Although we are confident that our alignments are good fits, alternative alignment methods may lead to different results. Slight variation is possible in highly variant regions, where alignments do not fit as smoothly, and the parameters used for allowing gaps is one aspect that can influence this. With different alignment methods, the majority of our results would be consistent, but the details could change, such as the sites that use IUPAC ambiguity codes in the 116@ consensus alignments. Our finding that this region is highly variant would still hold true. The results from the grouped alignments are less prone to variance, as their alignments have better fits. We have included alignments of individual SNORD116 sequences used in the Supplementary Data.
Finally, it is important to further note the proposed mechanisms for the expression of the SNORD116@ locus in the context of this analysis. The classical SNORD mechanism is a release from introns following an RNA splicing event in which the escape from degradation, processing and maturation of the SNORD is carried out by key RNA binding proteins to form a functional snoRNP complex. This mechanism is likely to be conserved, as it is necessary for expression, yet some SNORDs have shown differential dependence on RNA binding proteins [22]. Additionally, further proposed mechanisms of SNORD116@ include the product of processed RNAs derived from snoRNA degradation that may or may not regulate downstream targets [23]. Jorjani and colleagues showed that an overwhelming majority of RNA seq reads from SNORD116 Group I were processed sequence reads (<40 nt) rather than long form sequences across multiple cell types. Reads from other groups were comparatively less processed [6]. Although there is a lack of evidence indicating the use of the micro-RNA machinery, it remains a possibility that these small SNORD-derived RNAs are functional [24]. Furthermore, there is a possibility that the SNORD116 locus may express long non-coding RNAs (lncRNAs) with snoRNA ends as “caps” [25,26]. These rely on the snoRNP processing mechanism to escape degradation, but the functional unit does not rely on the SNORD116 sequence itself as the canonical SNORD mechanism does. Rather, the region outside the SNORD carries out the proposed function of binding splicing factors and affecting alternative splicing. This possibility would weaken the relevance of the current analysis. Though there are many proposed mechanisms regarding SNORD116, these may not be mutually exclusive, but rather provide many layers of functionality. Importantly, experiments have been performed using various cell types, and there are likely to be unique tissue-specific patterns. Future studies will need to address these caveats.
4. Conclusions
Phylogenetic analysis of the SNORD116 cluster on human chromosome 15q has identified nucleotides that are conserved cross-species. It is hoped that this type of analysis for SNORD116@, as well as other snoRNAs could help to identify functional domains, as well as regions that are susceptible to genetically-inherited phenotypes. In particular, the region from 5’ of the D’ box through the C’ box is highly homologous between species. Perhaps comparison between well-characterized SNORDs and orphan SNORDs may provide insight into the mechanisms of other orphan SNORDs and help to target regions for future bench research. Additionally, prior studies have lacked specificity in sensing members of SNORD116 transcripts; often using methods that are sensitive to all the transcripts or a representative transcript. The degree of nucleotide variation between and within mouse and human sequences may inform new methods for detecting and analyzing the expression of individual transcripts for this complex locus.
It is hoped that these studies will lead to a better understanding of the genetic imprinting condition, PWS. While the single PWS patient who carries the smallest known microdeletion encompassing all of the SNORD116@, IPW and SNORD109a locus is informative of the minimal causative genotype, additional studies on SNORD109a and IPW are warranted. Furthermore, some additional small processed RNA species, which appear to be derived from the SNORD116@ locus, have been detected, but contain only partial sequences, as compared to the full SNORD116@ sequences [23]. Little is known about the biological relevance of these, but they do warrant further investigation.
One of the reasons for undertaking this work was to attempt to use phylogenetic comparisons to determine where there may be functional and non-functional domains, as well as whether the SNORD116m+/p- mouse model could be justified as a functional model of the human SNORD1116@ deletion. We believe our results suggest that the SNORD116m+/p- mouse can be used as a simplified version of a human Group I or Group II SNORD116 deletion, with the caveat that the overlapping phenotypes of PWS with the SNORD116m+/p- mouse may be due to the loss of SNORD116 Groups I and II, and that the other RNAs, namely Group III, may account for the non-overlapping phenotypes. This hypothesis remains to be proven. It remains to be determined to which human SNORD116 groups the mouse Snord116 correlates functionally rather than by sequence homology. As we move from this phylogenetic analysis of SNORD116@ to future studies, characterization of the differential expression and gene regulatory targets of SNORD116@ across various species and tissue types, especially those tissues—namely brain, pancreas and muscle—that are affected in PWS patients will hopefully provide possible drug and genetic targets for basic scientists to direct therapies.
Supplementary Materials
The following are available online at www.mdpi.com/2073-4425/8/12/358/s1. Supplemental Figures S1–S6, as well as supplemental Tables S1 and S2.
Acknowledgments
This work was supported by the Foundation for Prader-Willi Research, Walnut, CA. Publication costs were supported by Virginia Tech Libraries Open Access Subvention Fund.
Author Contributions
Matthew A. Kocher and Deborah J. Good both conceived of, designed and performed the experiments, the analysis of the data and the writing of the manuscript.
Conflicts of Interest
The authors declare no conflict of interest. The founding sponsors had no role in the design of the study; in the collection, analyses or interpretation of data; in the writing of the manuscript; nor in the decision to publish the results.
References
- Levene, P.A.; Jacobs, W.A. Über inosinsäure. Eur. J. Inorg. Chem. 1909, 42, 1198–1203. [Google Scholar]
- Gros, F.; Gilbert, W.; Hiatt, H.H.; Attardi, G.; Spahr, P.F.; Watson, J.D. Molecular and biological characterization of messenger RNA. Cold Spring Harb. Symp. Quant. Biol. 1961, 26, 111–132. [Google Scholar] [CrossRef] [PubMed]
- Carninci, P.; Kasukawa, T.; Katayama, S.; Gough, J.; Frith, M.C.; Maeda, N.; Oyama, R.; Ravasi, T.; Lenhard, B.; Wells, C.; et al. The transcriptional landscape of the mammalian genome. Science 2005, 309, 1559–1563. [Google Scholar] [PubMed]
- Ensemble Consortium; Birney, E.; Stamatoyannopoulos, J.A.; Dutta, A.; Guigo, R.; Gingeras, T.R.; Margulies, E.H.; Weng, Z.; Snyder, M.; Dermitzakis, E.T.; et al. Identification and analysis of functional elements in 1% of the human genome by the encode pilot project. Nature 2007, 447, 799–816. [Google Scholar]
- Pennisi, E. Genomics. ENCODE project writes eulogy for junk DNA. Science 2012, 337, 1159, 1161. [Google Scholar]
- Jorjani, H.; Kehr, S.; Jedlinski, D.J.; Gumienny, R.; Hertel, J.; Stadler, P.F.; Zavolan, M.; Gruber, A.R. An updated human snoRNAome. Nucleic Acids Res. 2016, 44, 5068–5082. [Google Scholar] [CrossRef] [PubMed]
- Cavaille, J. Box C/D small nucleolar RNA genes and the Prader-Willi syndrome: A complex interplay. Wiley Interdiscip. Rev. RNA 2017, 8. [Google Scholar] [CrossRef] [PubMed]
- Runte, M.; Huttenhofer, A.; Gross, S.; Kiefmann, M.; Horsthemke, B.; Buiting, K. The IC-SNURF-SNRPN transcript serves as a host for multiple small nucleolar RNA species and as an antisense RNA for UBE3A. Hum. Mol. Genet. 2001, 10, 2687–2700. [Google Scholar] [CrossRef] [PubMed]
- Castle, J.C.; Armour, C.D.; Lower, M.; Haynor, D.; Biery, M.; Bouzek, H.; Chen, R.; Jackson, S.; Johnson, J.M.; Rohl, C.A.; et al. Digital genome-wide ncRNA expression, including SnoRNAs, across 11 human tissues using polya-neutral amplification. PLoS ONE 2010, 5. [Google Scholar] [CrossRef] [PubMed]
- Kishore, S.; Stamm, S. The snoRNA HBII-52 regulates alternative splicing of the serotonin receptor 2C. Science 2006, 311, 230–232. [Google Scholar] [CrossRef] [PubMed]
- Hassan, M.; Butler, M.G. Prader-Willi syndrome and atypical submicroscopic 15q11-q13 deletions with or without imprinting defects. Eur. J. Med. Genet. 2016, 59, 584–589. [Google Scholar] [CrossRef] [PubMed]
- Foundation for Prader-Willi Research. About Prader-willi Syndrome. Available online: https://www.fpwr.org/about-prader-willi-syndrome/ (accessed on 31 October 2017).
- Cheon, C.K. Genetics of Prader-Willi syndrome and Prader-Will-Like syndrome. Ann. Pediatr. Endocrinol. Metab. 2016, 21, 126–135. [Google Scholar] [CrossRef] [PubMed]
- Runte, M.; Varon, R.; Horn, D.; Horsthemke, B.; Buiting, K. Exclusion of the C/D box snoRNA gene cluster HBII-52 from a major role in Prader-Willi syndrome. Hum. Genet. 2005, 116, 228–230. [Google Scholar] [CrossRef] [PubMed]
- Bieth, E.; Eddiry, S.; Gaston, V.; Lorenzini, F.; Buffet, A.; Conte Auriol, F.; Molinas, C.; Cailley, D.; Rooryck, C.; Arveiler, B.; et al. Highly restricted deletion of the SNORD116 region is implicated in Prader-Willi syndrome. Eur. J. Hum. Genet. 2015, 23, 252–255. [Google Scholar] [CrossRef] [PubMed]
- Ding, F.; Li, H.H.; Zhang, S.; Solomon, N.M.; Camper, S.A.; Cohen, P.; Francke, U. SnoRNA Snord116 (Pwcr1/MBII-85) deletion causes growth deficiency and hyperphagia in mice. PLoS ONE 2008, 3. [Google Scholar] [CrossRef] [PubMed]
- Skryabin, B.V.; Gubar, L.V.; Seeger, B.; Pfeiffer, J.; Handel, S.; Robeck, T.; Karpova, E.; Rozhdestvensky, T.S.; Brosius, J. Deletion of the MBII-85 snoRNA gene cluster in mice results in postnatal growth retardation. PLoS Genet. 2007, 3. [Google Scholar] [CrossRef] [PubMed]
- Burnett, L.C.; LeDuc, C.A.; Sulsona, C.R.; Paull, D.; Rausch, R.; Eddiry, S.; Carli, J.F.; Morabito, M.V.; Skowronski, A.A.; Hubner, G.; et al. Deficiency in prohormone convertase PC1 impairs prohormone processing in Prader-Willi syndrome. J. Clin. Investig. 2017, 127, 293–305. [Google Scholar] [CrossRef] [PubMed]
- Good, D.J.; Porter, F.D.; Mahon, K.A.; Parlow, A.F.; Westphal, H.; Kirsch, I.R. Hypogonadism and obesity in mice with a targeted deletion of the Nhlh2 gene. Nat. Genet. 1997, 15, 397–401. [Google Scholar] [CrossRef] [PubMed]
- Aken, B.L.; Ayling, S.; Barrell, D.; Clarke, L.; Curwen, V.; Fairley, S.; Fernandez Banet, J.; Billis, K.; Garcia Giron, C.; Hourlier, T.; et al. The ensembl gene annotation system. Database 2016, 2016. [Google Scholar] [CrossRef] [PubMed]
- Cavaille, J.; Bachellerie, J.P. Processing of fibrillarin-associated snornas from pre-mrna introns: An exonucleolytic process exclusively directed by the common stem-box terminal structure. Biochimie 1996, 78, 443–456. [Google Scholar] [CrossRef]
- Deschamps-Francoeur, G.; Garneau, D.; Dupuis-Sandoval, F.; Roy, A.; Frappier, M.; Catala, M.; Couture, S.; Barbe-Marcoux, M.; Abou-Elela, S.; Scott, M.S. Identification of discrete classes of small nucleolar RNA featuring different ends and RNA binding protein dependency. Nucleic Acids Res. 2014, 42, 10073–10085. [Google Scholar] [CrossRef] [PubMed]
- Shen, M.; Eyras, E.; Wu, J.; Khanna, A.; Josiah, S.; Rederstorff, M.; Zhang, M.Q.; Stamm, S. Direct cloning of double-stranded RNAs from RNase protection analysis reveals processing patterns of C/D box snoRNAas and provides evidence for widespread antisense transcript expression. Nucleic Acids Res. 2011, 39, 9720–9730. [Google Scholar] [CrossRef] [PubMed]
- Kishore, S.; Gruber, A.R.; Jedlinski, D.J.; Syed, A.P.; Jorjani, H.; Zavolan, M. Insights into snoRNA biogenesis and processing from PAR-CLIP of snoRNA core proteins and small RNA sequencing. Genome Biol. 2013, 14. [Google Scholar] [CrossRef] [PubMed]
- Wu, Q.; Zhou, X.; Han, X.; Zhuo, Y.; Zhu, S.; Zhao, Y.; Wang, D. Genome-wide identification and functional analysis of long noncoding RNAs involved in the response to graphene oxide. Biomaterials 2016, 102, 277–291. [Google Scholar] [CrossRef] [PubMed]
- Yin, Q.F.; Yang, L.; Zhang, Y.; Xiang, J.F.; Wu, Y.W.; Carmichael, G.G.; Chen, L.L. Long noncoding RNAs with snoRNA ends. Mol. Cell 2012, 48, 219–230. [Google Scholar] [CrossRef] [PubMed]
Figure 1.
Comparison of genomic sequences of the SNORD116 locus from model organisms used for most biological research. Sequences from human (Homo sapiens), chimpanzee (Pan troglodytes), rhesus (Macaca mulatta), rabbit (Oryctolagus cuniculus), rat (Rattus norvegicus) and mouse (Mus musculus) were analyzed and the composite sequence shown. Nucleotides AGCT shown are present in 90% or greater of the transcripts at that position, while IUPAC codes are used for positions with one or more variable nucleotides. (A) Alignment of SNORD116@ consensus sequences displaying sites of non-strict homology. A dot (.) indicates non-strict homology with the human sequence for the given nucleotide position. (B) Alignment showing all nucleotides of consensus sequences used in (A). Sequences used for the analysis were obtained from Ensembl builds. The build and the number of SNORD116 sequences analyzed are shown after the common name of the organism: human (n = 30, GRCh38.p10), chimp (n = 28, CHIMP2.1.4), rhesus (n = 29, Mmul_8.0.1), rabbit (n = 29, OryCun_2.0), rat (n = 26, Rnor_6.0) and mouse (n = 17, GRCm38.p5). The C and C’ boxes are highlighted in yellow, while the D and D’ boxes are highlighted in blue. Nucleotides that do not meet the 90% frequency threshold are indicated using IUPAC ambiguity codes. Grey-shading indicates regions of insertion/deletion in some sites of the group. Frequency for qualifying as in/del site is 10% or greater. A dot (.) indicates non-strict homology with the human sequence for the given nucleotide position. A tilde (~) indicates a gap in consensus sequence compared to the aligned consensus sequence. An asterisk (*) indicates perfect homology with the human sequence for all nucleotides in the site above.

Figure 2.
Consensus sequences for respective SNORD116@ transcript clusters (groups). Threshold frequency for single nucleotide inclusion in the consensus is 90%. Nucleotides that do not meet or exceed the 90% frequency threshold are indicated using IUPAC ambiguity codes. In/del sites are highlighted in light gray. Frequency for qualifying as in/del site is 10% or greater. C/C’ boxes highlighted in yellow. D/D’ boxes highlighted in light blue. A dot (.) indicates non-strict homology with human sequence for the given nucleotide position. A tilde (~) indicates a gap in consensus sequence compared to other consensus sequences. An asterisk (*) indicates perfect homology with the human sequence for all nucleotides in the site above. (A) Group I consensus analysis; (B) Group II consensus analysis; (C) Group 3 consensus analysis; (D) Mouse-human consensus analysis. For this analysis, nucleotides using IAPUC codes are pink.


Table 1.
SNORD116 snoRNA clusters in different species.
| Common Name Genus species | Chromosome | Synteny with Human Chromosome 15 | Cluster Size (bp) | Strand | Number of Transcripts (with Perfectly Homologous C/C’ and D/D’ Boxes) | Number of Annotated Transcripts |
|---|---|---|---|---|---|---|
| Human Homo sapiens | 15 | - | 56,781 | Forward | 30 (24) | 30 |
| Chimpanzee Pan troglodytes | 15 | yes | 66,103 | Forward | 28 (22) | 0 |
| Rhesus macaque Macaca mulatta | 7 | yes | 61,342 * | Forward | 29 (26) | 29 |
| Rabbit Oryctolagus cuniculus | 17 | yes | 72,915 | Reverse | 29 (22) | 0 |
| Rat Rattus norvegicus | 1 | yes | 163,162 @ | Reverse | 26 (15) | 26 |
| Mouse Mus musculus | 7 | yes | 45,634 (Cluster 1) 133,627 (Cluster 2) ^ | Reverse | 71 (64) | 17 |
* Missing one ~6.5 kb contig within the cluster; @ missing six contigs, totaling ~50 kb within the region; ^ missing one ~50 kb contig between clusters.
Table 2.
Non-cluster paralogs to SNORD116.
| Human Chromosome Number (Accession Number) | Location in Humans | Presence of Homologous C/C’ and D/D’ Boxes to SNORD116 | Chimpanzee Chromosome (synteny)/Location/ Homologous C/D Boxes? | Rhesus Macaque Chromosome (synteny)/Location/Homologous C/D Boxes? |
|---|---|---|---|---|
| 1(ENST00000365628.1) | Intronic | No | 3 (no)/intergenic/yes | 1 (yes)/intronic/no |
| 9(ENST00000517176.1) | Intronic | No | 9 (yes)/intronic/no | 15 (yes)/intronic/no |
| 13(ENST00000391251.1) | Intergenic | No | N/A (scaffold) (yes)/intergenic/no | 17 (yes)/intergenic/no |
Table 3.
Homology comparison of consensus sequences for SNORD116 groupings between human and rat, rabbit and mouse. The number of homologous nucleotide sites is displayed.
Table 3.
Homology comparison of consensus sequences for SNORD116 groupings between human and rat, rabbit and mouse. The number of homologous nucleotide sites is displayed.
| Non-Strict Homology | Strict Homology | |||||
|---|---|---|---|---|---|---|
| Human Group I 96 Nucleotides | Human Group II 92 Nucleotides | Human Group III 96 Nucleotides | Human Group I 96 Nucleotides | Human Group II 92 Nucleotides | Human Group III 96 Nucleotides | |
| Rat 116@ | 64 (66.7%) | 65 (70.7%) | 52 (54.2%) | 59 (61.5%) | 57 (62.0%) | 30 (31.3%) |
| Rat Group I | 76 (79.2%) | 79 (85.9%) | 65 (67.7%) | 69 (71.9%) | 66 (71.7%) | 48 (50.0%) |
| Rat Group II | 64 (66.7%) | 60 (65.2%) | 53 (55.2%) | 59 (61.5%) | 55 (59.8%) | 40 (41.7%) |
| Rabbit 116@ | 73 (76.0%) | 69 (75.0%) | 58 (60.4%) | 68 (70.8%) | 60 (65.2%) | 45 (46.9%) |
| Rabbit Group I | 86 (89.6%) | 78 (84.8%) | 64 (66.7%) | 78 (81.3%) | 64 (69.6%) | 47 (49.0%) |
| Rabbit Group II | 57 (59.4%) | 59 (64.1%) | 48 (50.0%) | 54 (56.3%) | 53 (57.6%) | 41 (42.7%) |
| Mouse 116@ | 81 (84.4%) | 81 (88.0%) | 64 (66.7%) | 75 (78.1%) | 66 (71.7%) | 47 (49.0%) |
© 2017 by the authors. Licensee MDPI, Basel, Switzerland. This article is an open access article distributed under the terms and conditions of the Creative Commons Attribution (CC BY) license (http://creativecommons.org/licenses/by/4.0/).
Share and Cite
MDPI and ACS Style
Kocher, M.A.; Good, D.J. Phylogenetic Analysis of the SNORD116 Locus. Genes 2017, 8, 358. https://doi.org/10.3390/genes8120358
AMA Style
Kocher MA, Good DJ. Phylogenetic Analysis of the SNORD116 Locus. Genes. 2017; 8(12):358. https://doi.org/10.3390/genes8120358
Chicago/Turabian StyleKocher, Matthew A., and Deborah J. Good. 2017. "Phylogenetic Analysis of the SNORD116 Locus" Genes 8, no. 12: 358. https://doi.org/10.3390/genes8120358
Note that from the first issue of 2016, this journal uses article numbers instead of page numbers. See further details here.