Absence of Correlation between Chimeric RNA and Aging

1
Department of Pathology, School of Medicine, University of Virginia, Charlottesville, VA 22908, USA
2
National Institute of Plant Genome Research (NIPGR), New Delhi 110067, India
3
Department of Biochemistry and Molecular Genetics, School of Medicine, University of Virginia, Charlottesville, VA 22908, USA
*
Author to whom correspondence should be addressed.
Genes 2017, 8(12), 386; https://doi.org/10.3390/genes8120386
Submission received: 18 November 2017
/
Revised: 6 December 2017
/
Accepted: 7 December 2017
/
Published: 14 December 2017
(This article belongs to the Special Issue The Value of Being Different: Ultraconserved Genomic Elements, Micro Peptides and Chimeric RNAs)
Abstract
:Chimeric RNAs have been recognized as a phenomenon not unique to cancer cells. They also exist in normal physiology. Aging is often characterized by deregulation of molecular and cellular mechanisms, including loss of heterochromatin, increased transcriptional noise, less tight control on alternative splicing, and more stress-induced changes. It is thus assumed that chimeric RNAs are more abundant in older people. In this study, we conducted a preliminary investigation to identify any chimeric RNAs with age-based trends in their expression levels in blood samples. A chimeric RNA candidate list generated by bioinformatic analysis indicated the possibility of both negative and positive trends in the expression of chimeric RNAs. Out of this candidate list, five novel chimeric RNAs were successfully amplified in multiple blood samples and then sequenced. Although primary smaller sample sizes displayed some weak trends with respect to age, analysis of quantitative PCR data from larger sample sizes showed essentially no relationship between expression levels and age. Altogether, these results indicate that, contradictory to the common assumption, chimeric RNAs as a group are not all higher in older individuals and that placing chimeric RNAs in the context of aging will be a much more complex task than initially anticipated.
1. Introduction
Traditionally, it was thought that chimeric RNA events were exclusively characteristic of the cells of neoplasms [1], but evidence has shown the presence of chimeric RNAs in various physiologically normal tissue [2,3]. Furthermore, because of their presence in cancers, fusion RNAs were once thought to be the sole result of chromosomal translocations [4], but other work has recently shown that they can exist without DNA arrangement and rather through two mechanisms called cis-splicing of adjacent genes (cis-SAGe) [5,6,7,8], and trans-splicing [9]. Cis-SAGe involves the splicing of a singular pre-mRNA molecule that results from passing through the termination site between two adjacent genes. On the other hand, trans-splicing involves the splicing that connects separate transcripts.
Much research has been invested into elucidating the biology of aging in recent years. Many have tried to identify characteristics and understand mechanisms that contribute to aging due to its role as a major risk factor in many chronic diseases [10], such as cardiovascular disease and cancer, that rank amongst the top causes of death in developed nations. Most indisputable is the genome damage that accompanies aging in organisms, but just how that damage affects cell and tissue function and vitality is more complex.
Previous studies have found pronounced heterochromatin loss in individuals with progeroid syndromes, which is characterized by accelerated aging in affected children [11], and similarly, non-neuronal cell types in Caenorhabditis elegans have shown progressive loss of heterochromatin in an age-dependent manner [12,13]. Such a loss of heterochromatin causes the expression of genes that are normally repressed and, therefore, aberrant transcription that may be associated with a variety of RNA classes. Another aspect of aging is transcriptional noise, which is the differential gene expression of cells in an isogenic population, and this phenomenon is correlated with genome damage. This transcriptional noise has also been implicated in reduced organismal fitness [14], which is essentially what is recognized as aging. Similarly, certain transcription levels of protein isoforms have been shown to change with age, and specifically, some of these isoforms cause the deregulation of mechanisms in alternative splicing [15], which would directly increase the occurrence of abnormal splicing products. Recent work has also taken a look into the genetic level of stress, and the results support the increase of read-through transcripts under many types of biological stress, including osmotic-induced stress, heat shock, oxidative stress, and viral infection [16].
We therefore hypothesize that frequency of chimeric RNA events will have a positive correlation with age due to expected age-dependent deregulation of transcription machinery, particularly in the case of cis-SAGe. With our study, we aimed to confirm the existence of chimeric RNA candidates and elucidate the presence of trends, if any, with respect to age.
2. Materials and Methods
2.1. RNA-Seq and Bioinformatics Analyses
The Genotype-Tissue Expression (GTEx) raw RNA-Seq data was downloaded. Next Generation Sequencing Quality Control toolkit (http://www.nipgr.res.in/ngsqctoolkit.html) was used for filtering off low-quality reads. Paired end sequencing reads were mapped to Human genome version hg19 and analyzed using software tool, EricScript to identify candidate fusion RNAs [17]. Fusions with Ericscore less than 0.5 were filtered off. The occurrence and frequencies of candidate fusion RNAs were then correlated to gender, age, race, ethnicity, height, weight, and Body Mass Index (BMI).
2.2. Sample Collection
The use of human clinical samples was approved by the IRB committee of the University of Virginia (#13310, 8/28/2017). Blood samples were obtained from the Department of Pathology at the University of Virginia. All of the samples were de-identified.
2.3. RNA Extraction
The RNA was extracted with TRIzol reagent (Invitrogen, Waltham, MA, USA) following the manufacturer’s instruction. Extracted RNA was then treated with DNaseI and reverse-transcribed by random primers using AMV (New England Biolabs, Ipswich, MA, USA). More detailed procedures have been previously described [18].
2.4. RT-PCR and Sanger Sequencing
Specific primer pairs that were designed using Primer3 (Whitehead Institute for Biomedical Research, Cambridge, MA, USA) were utilized in Reverse Transcription Polymerase Chain Reaction (RT-PCR) to confirm candidates on the RNA level with quantitative RT-PCR. Amplification products were separated through gel electrophoresis, and proper size product bands were purified and sent for Sanger sequencing. More detailed procedures have been previously described [18,19].
2.5. Statistical Analyses
All quantitative RT-PCR amplification data for the samples were normalized to their GAPDH values to control for general transcription levels between samples. The correlation between normalized fusion RNA levels and age of the sample were calculated using the Pearson correlation method, with R-values.
3. Results
3.1. Bioinformatic Analysis of GTEx Data
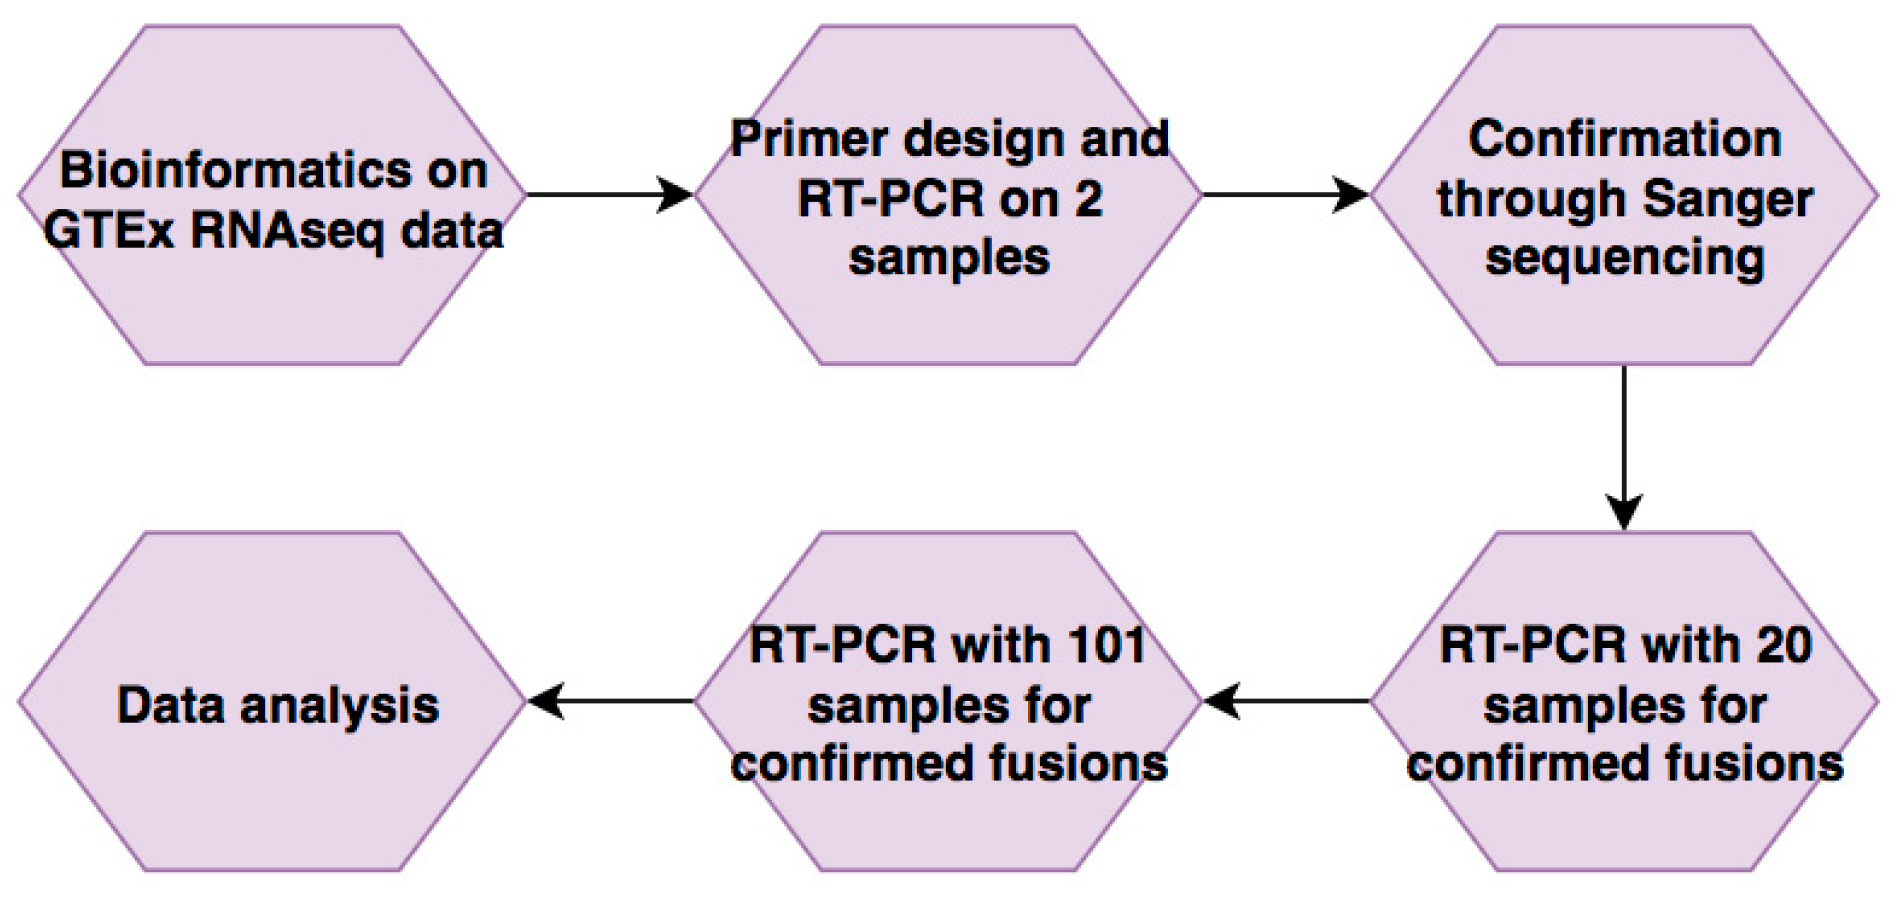
Starting with bioinformatics, our work followed a pipeline through which candidates were identified and then narrowed down through confirmation before testing in larger sample sizes for their expression (Figure 1). We wanted to avoid the effect of neoplasm, so we started with a data set collected from non-cancer samples. The Genotype-Tissue Expression (GTEx) project provides an ideal resource to study non-cancer associated fusions [20], in that the samples were procured from non-cancer patients, and the paired-end RNA-Sequencing datasets are publically available. We mined 426 GTEx whole blood RNA-Seq data to identify candidate fusion RNAs. Software Ericscript [17] was used to identify fusion RNAs. Fusion RNAs with Ericscore above 0.5 were further analyzed. p-Values were then calculated to determine correlation with the samples’ various characteristics, including gender, age, race, ethnicity, height, weight, and BMI with the frequency with which they were found. Age-correlation was investigated through a x2 test comparing four different age groups that split the sample numbers evenly. A list of 65 top candidates was then generated by compiling the most significant p-values with respect to age. When we examined other variables, no significant p-values were found. Contrary to our initial expectations, some of these candidates may also decrease in frequency with age (Table 1).
3.2. Confirmation of Five Candidates through RT-PCR and Sanger Sequencing
We designed pairs of specific primers to amplify the candidate fusion RNAs. Eleven of the 65 had no primers successfully designed for them due to their highly repetitive and nonspecific sequences. For the remaining 54, we designed primers and performed quantitative PCR (qPCR). To quickly survey through this list of candidates for age-biased fusions, we ran one sample extracted from an 80-year-old, and one sample from a 30-year-old. Water was included as the negative control. After running the amplified products on a gel, any clear bands of correct product size that also presented themselves in the given expected trend from the bioinformatics results were purified and processed for Sanger sequencing (example in Figure 2A). Therefore, while some bands were of the correct product size, they were not investigated further if they did not show the same trend as predicted. In addition, there may be candidates that could not be amplified in the particularly small sample size.
From this step, five separate fusion RNAs were confirmed through Sanger sequencing, including ATXN1L-IST1, DHRS13-FLOT2, LRP10-REM2, VKORC1L1-CCT6A, and ZNF451-BAG2 (example in Figure 2B). Two separate bands were purified and sequenced for LRP10-REM2, confirming two different forms of the fusion, one between the 6th exon of LRP10 and the 2nd exon of REM2 (e6e2), the other being the 7th exon of LRP10 and the 2nd exon of REM2 (e7e2), representing the original expected junction site. All five of these fusions were composed of genes on the same chromosome, and in some cases, immediate neighboring genes, thus candidates for cis-SAGe (DHRS13-FLOT2, LRP10-REM2, and ZNF451-BAG2).
3.3. Investigation of the Correlation between the Five Candidates and Age of the Donors
We then attempted to amplify these five confirmed fusions on complementary DNAs (cDNAs) extracted from 20 different blood samples. Correlation was calculated between the fusion RNAs expression for each sample and the age of the patient that each sample was attributed. ATXN1L-IST1 showed a moderate negative correlation with age, while DHRS13-FLOT2 and LRP10-REM2 had stronger negative correlations with age. Data showed that VKORC1L1-CCT6A had a weak positive correlation in amplification with age, but nearly no correlation could be made between ZNF451-BAG2 and age (examples in Figure 3A) (Table 2).
We then measured the fusion RNAs using a group of 101 cDNA samples to see if similar correlations could be found in a larger sample size (Table S1). Most trends either flipped or decreased in their absolute R-value, or both. ATXN1L-IST1, DHRS13-FLOT2, and ZNF451-BAG2 went from negative trends to only marginally positive trends. VKORC1L1-CCT6A went from a positive trend to negative. The correlation of LRP10-REM2 did not change in direction, but its absolute R-value decreased from −0.45383219 to −0.0464758 (examples in Figure 3B) (Table 2). No correlation of the expression of GAPDH with age was observed (Figure S1).
3.4. Alternate Forms of LRP10-REM2 Correlate in Expression with Each Other, But Had No Correlation with Age
Since LRP10-REM2 had two forms that were confirmed through Sanger sequencing, we designed assays specifically for each form (Figure 4A,B). To specifically detect the form with the junction between the 7th LRP10 exon and the 2nd REM2 exon (e7e2), a new forward primer was designed to be specific to the 7th exon of LRP10, which would avoid amplifying the fusion with 6th LRP10 exon and the 2nd REM2 exon form (e6e2). Then, to specifically detect the e6e2 form, a Taqman probe annealing to the junction site between the 6th exon of LRP10 and the 2nd exon of REM2 was designed. Twenty samples were used first to compare the two forms. A strong positive correlation with the expression levels of the two forms (R2 = 0.77711) was found (Figure 4C). Because of this, it was determined that using the set of primers that amplify both forms simultaneously would be proper to investigate the correlation of both fusions and age. As shown in Figure 4, no significant correlation was seen for LRP10-REM2.
3.5. Alternate Analysis of the Data with Age Buckets also Failed to Show a Prominent Trend
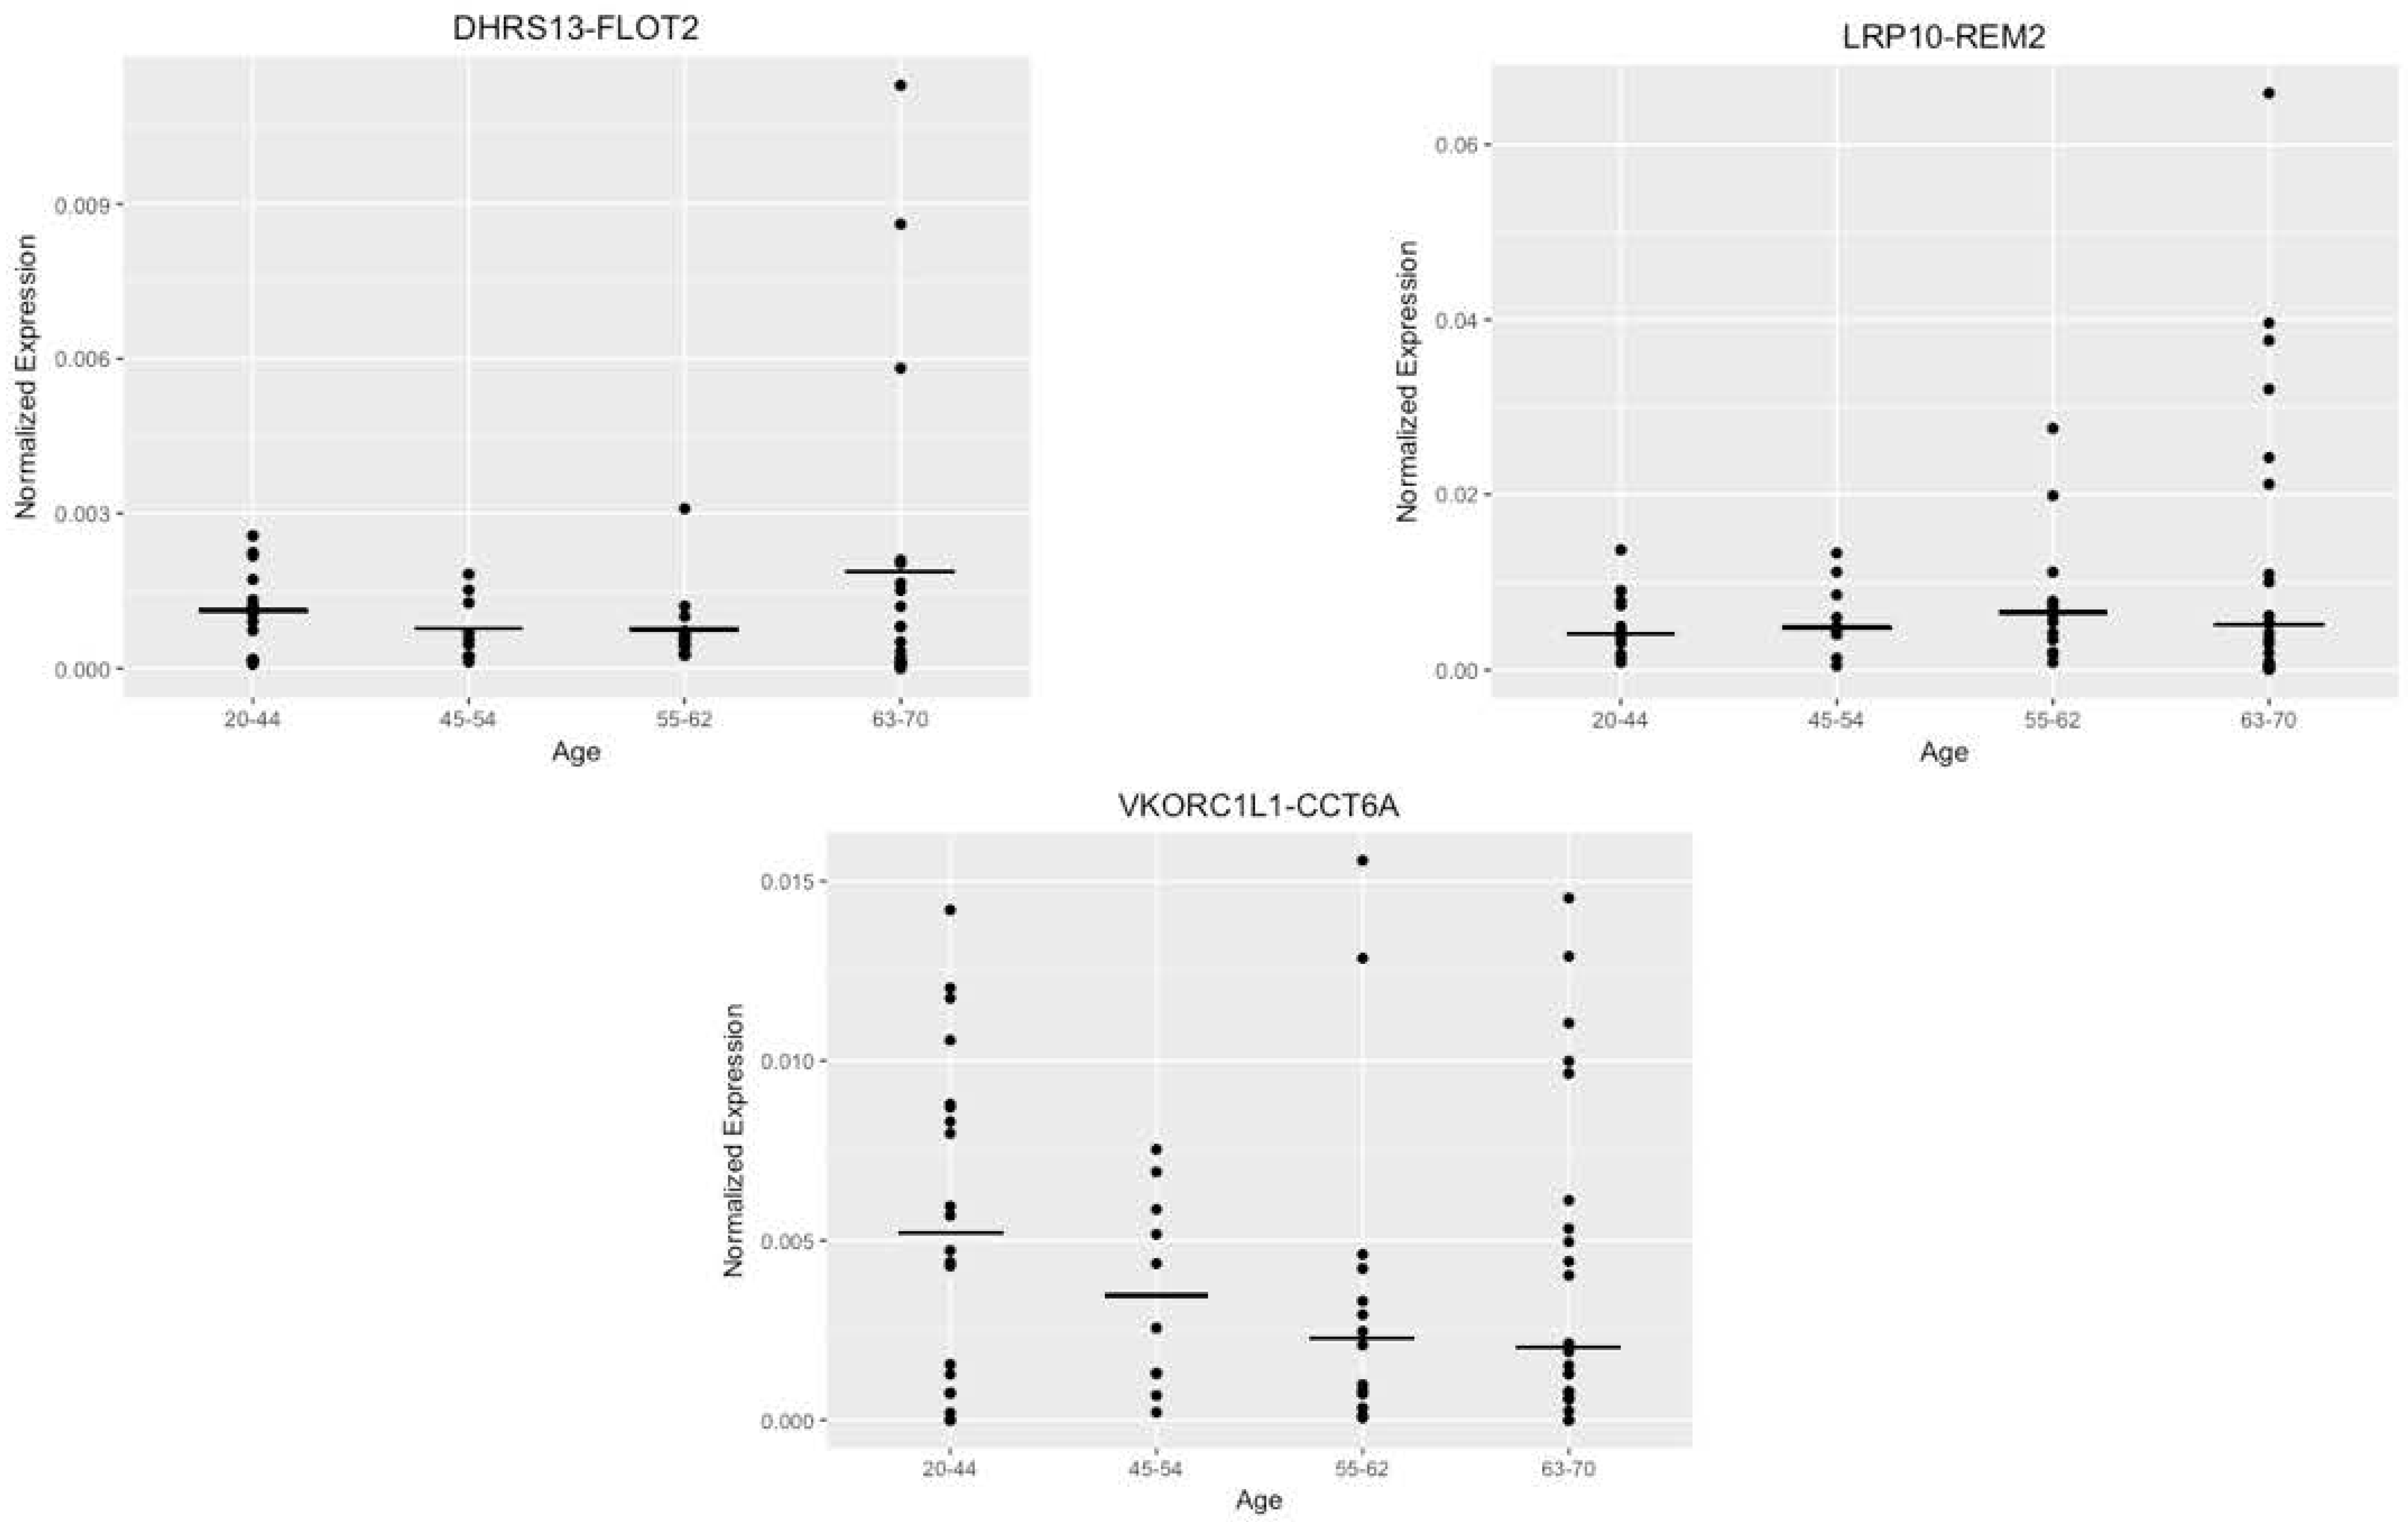
After attempting to correlate the normalized expression levels with age as a continuous variable, we created age buckets identical to those used in the bioinformatics stage and compared the average expression levels of the samples that fell within these buckets to each other (Figure 5). This was an attempt to confirm any significance detected in the bioinformatics stage of the pipeline. The generated graphs exhibited no particular trend for any of the fusions except for VKORC1L1-CCT6A, but this trend was negative. This contrasts with the bioinformatics analysis, which predicted a positive trend with age.
4. Discussion
In this study, we failed to establish with any strongly supporting evidence the existence of any age-biased trends in the expression of fusion RNAs. Even though certain fusion RNAs have been previously shown to be accurate biomarkers of certain diseases and these diseases affect a larger proportion of older individuals, no strong correlations could be made with age with the larger sample size.
Interestingly, not all of the fusion candidates uncovered from the RNA-Seq data were found in increasing frequency with age. This already contradicts our hypothesis and many of the aforementioned mechanisms that are associated with aging. This also suggests these candidates or fusion RNAs are not simply the byproducts of dysregulated transcription machinery. What their roles actually are would require further work to elucidate.
The lack of significant age-based trends in the expression levels of these confirmed fusions in a larger sample size, may be partially due to the complexity of aging. Aging carries countless confounding variables that are difficult to control for with de-identified samples. The blood samples used in this study were collected from various patients in the hospital, so profiles of health conditions and demographics varied greatly. Furthermore, due to the de-identification process, it was impossible to know how much healthier one sample was compared to another, which is a relationship that a numerical age may improperly represent. Thus, at this point, we had to confront the concept of difference in years since one’s birth and the current aging state one is in. In future work, it would be necessary to consider just what sample size and what demographics would be sufficient to statistically support bioinformatically predicted trend.
There are also limitations associated with the use of blood samples for studying age. Previous work has already shown that there is differential expression of fusion RNAs between tissues [21], so contrasting results may have been collected if different tissues were used as samples. Another caveat of using blood can be realized when considering how different tissues relate to aging. Any red blood cell in the human body will stay in circulation for approximately 120 days, meaning that unlike other cell types, such as neurons, a blood cell would not age with an individual through their lifespan. However, the relative availability of blood samples compared to relatively difficult collection of any other tissues from individuals of all ages made it our first choice to probe the question.
Supplementary Materials
The following are available online at www.mdpi.com/2073-4425/8/12/386/s1. Figure S1: The absence of correlation of GAPDH with aging. Table S1: Age of the clinical samples used in Figure 3, Figure 4 and Figure 5 and Figure S1.
Acknowledgments
Hui Li is supported by NCI grant CA190713, St. Baldrick’s V Scholar grant, and a Research Scholar Grant (126405-RSG-14-065-01-RMC) from the American Cancer Society.
Author Contributions
Reyna Huang carried out analysis, interpreted results, and wrote and revised manuscript. Shailesh Kumar conducted bioinformatic analyses. Hui Li conceived and supervised the project and manuscript.
Conflicts of Interest
We declare that there are no conflicts of interest in relation to the work described.
References
- Heim, S.; Mitelman, F. Molecular screening for new fusion genes in cancer. Nat. Genet. 2008, 40, 685–686. [Google Scholar] [CrossRef] [PubMed]
- Tang, Y.; Qin, F.; Liu, A.; Li, H. Recurrent fusion RNA DUS4L-BCAP29 in non-cancer human tissues and cells. Oncotarget 2017, 8, 31415–31423. [Google Scholar] [CrossRef] [PubMed]
- Chwalenia, K.; Facemire, L.; Li, H. Chimeric RNAs in cancer and normal physiology. Wiley Interdiscip. Rev. RNA 2017. [Google Scholar] [CrossRef] [PubMed]
- Rabbitts, T.H. Chromosomal translocations in human cancer. Nature 1994, 372, 143–149. [Google Scholar] [CrossRef] [PubMed]
- Qin, F.; Song, Z.; Chang, M.; Song, Y.; Frierson, H.; Li, H. Recurrent cis-SAGe chimeric RNA, D2HGDH-GAL3ST2, in prostate cancer. Cancer Lett. 2016, 380, 39–46. [Google Scholar] [CrossRef] [PubMed]
- Zhang, Y.; Gong, M.; Yuan, H.; Park, H.; Frierson, H.; Li, H. Chimeric transcript generated by cis-splicing of adjacent genes regulates prostate cancer cell proliferation. Cancer Discov. 2012, 2, 598–607. [Google Scholar] [CrossRef] [PubMed]
- Prakash, T.; Sharma, V.; Adati, N.; Ozawa, R.; Kumar, N.; Nishida, Y.; Fujikake, T.; Takeda, T.; Taylor, T. Expression of conjoined genes: Another mechanism for gene regulation in eukaryotes. PLoS ONE 2010, 5, e13284. [Google Scholar] [CrossRef] [PubMed]
- Akiva, P.; Toporik, A.; Edelheit, S.; Peretz, Y.; Diber, A.; Shemesh, R.; Novik, A.; Sorek, R. Transcription-mediated gene fusion in the human genome. Gen. Res. 2006, 16, 30–36. [Google Scholar] [CrossRef] [PubMed]
- Xie, Z.; Babiceanu, M.; Kumar, S.; Jia, Y.; Qin, F.; Barr, F.G.; Li, H. Fusion transcriptome profiling provides insights into alveolar rhabdomyosarcoma. Proc. Natl. Acad. Sci. USA 2016, 113, 13126–13131. [Google Scholar] [CrossRef] [PubMed]
- Lopez-Itin, C.; Blasco, M.A.; Partridge, L.; Serrano, M.; Kroemer, G. The hallmarks of aging. Cell 2013, 153, 1194–1217. [Google Scholar] [CrossRef] [PubMed]
- Liu, G.-H.; Barkho, B.; Ruiz, S.; Diep, D.; Qu, J.; Yang, S.-L.; Panapoulos, A.; Suzuki, K.; Kurian, L.; Walsh, C.; et al. Recapitulation of premature ageing with iPSCs from hutchinson-gilford progeria syndrome. Nature 2011, 472, 221–225. [Google Scholar] [CrossRef] [PubMed]
- Arancio, W.; Pizzolanti, G.; Genovese, S.I.; Pitrone, M.; Giordano, C. Epigenetic involvement in hutchinson-gilford progeria syndrome: A mini-review. Gerontology 2014, 60, 197–203. [Google Scholar] [CrossRef] [PubMed]
- Haithcock, E.; Dayani, Y.; Neufeld, E.; Zahand, A.; Feinstein, N.; Mattout, A.; Gruenbaum, Y.; Liu, J. Age-related changes of nuclear architecture in Caenorhabditis elegans. Proc. Natl. Acad. Sci. USA 2005, 102, 16690–16695. [Google Scholar] [CrossRef] [PubMed]
- Bahar, R.; Hartmann, C.H.; Rodriguez, K.; Denny, A.D.; Busuttil, R.A.; Dolle, M.E.; Calder, B.; Chisholm, G.B.; Pollock, B.; Klein, C.; et al. Increased cell-to-cell variation in gene expression in ageing mouse heart. Nature 2006, 441, 1011–1014. [Google Scholar] [CrossRef] [PubMed]
- Harries, L.W.; Hernandez, D.; Henley, W.; Wood, A.; Holly, A.; Bradley-Smith, R.; Yaghootkar, H.; Dutta, A.; Murray, A.; Frayling, T.; et al. Human aging is characterized by focused changes in gene expression and deregulation of alternative splicing. Aging Cell 2011, 10, 868–878. [Google Scholar] [CrossRef] [PubMed]
- Villborg, A.; Sabath, N.; Wiesel, Y.; Nathans, J.; Levy-Adam, F.; Yario, T.A.; Steitz, J.A.; Shalgi, R. Comparative analysis reveals genomic features of stress-induced transcriptional readthrough. Proc. Natl. Acad. Sci. USA 2017, 114, E8362–E8371. [Google Scholar] [CrossRef] [PubMed]
- Benelli, M.; Pescucci, C.; Marseglia, G.; Severgnini, M.; Torricelli, F.; Magi, A. Discovering chimeric transcripts in paired-end RNA-seq data by using EricScript. Bioinformatics 2012, 28, 3232–3239. [Google Scholar] [CrossRef] [PubMed]
- Qin, F.; Song, Z.; Babiceanu, M.; Song, Y.; Facemire, L.; Singh, R.; Adli, M.; Li, H. Discovery of CTCF-sensitive Cis-spliced fusion RNAs between adjacent genes in human prostate cells. PLoS Genet. 2015, 11, e1005001. [Google Scholar]
- Qin, F.; Song, Y.; Zhang, Y.; Facemire, L.; Frierson, H.; Li, H. Role of CTCF in regulating SLC45A3-ELK4 chimeric RNA. PLoS ONE 2016, 11, e0150382. [Google Scholar] [CrossRef] [PubMed]
- Carithers, L.J.; Moore, H.M. The genotype-tissue expression (GTEx) project. Biopreserv. Biobank. 2015, 13, 307–308. [Google Scholar] [CrossRef] [PubMed]
- Babiceanu, M.; Qin, F.; Xie, Z.; Jia, Y.; Lopez, K.; Janus, N.; Facemire, L.; Kumar, S.; Pang, Y.; Qi, Y. Recurrent chimeric fusion RNAs in non-cancer tissues and cells. Nucleic Acids Res. 2016, 44, 2859–2872. [Google Scholar] [CrossRef] [PubMed]
Figure 1.
The flow of the study. A list of candidate fusion RNAs that have correlations with aging was generated through bioinformatic analyses on Genotype-Tissue Expression (GTEx) RNA-Seq data. They were then validated using Reverse Transcription Polymerase Chain Reaction (RT-PCR) and Sanger sequencing. Five fusions passed this step and were then evaluated in 20 samples, then extended to 101 samples. Their expression levels were then correlated with donors’ age.

Figure 2.
Confirmation of fusion RNAs. (A) Representative examples of fusion RNAs amplified by RT-PCR and separated by gel electrophoresis before being purified and processed for Sanger sequencing. The size of the fusion RNAs fall within 100–300 bp. (B) Sanger sequencing data highlighting the junction sequence for the same representative fusions.
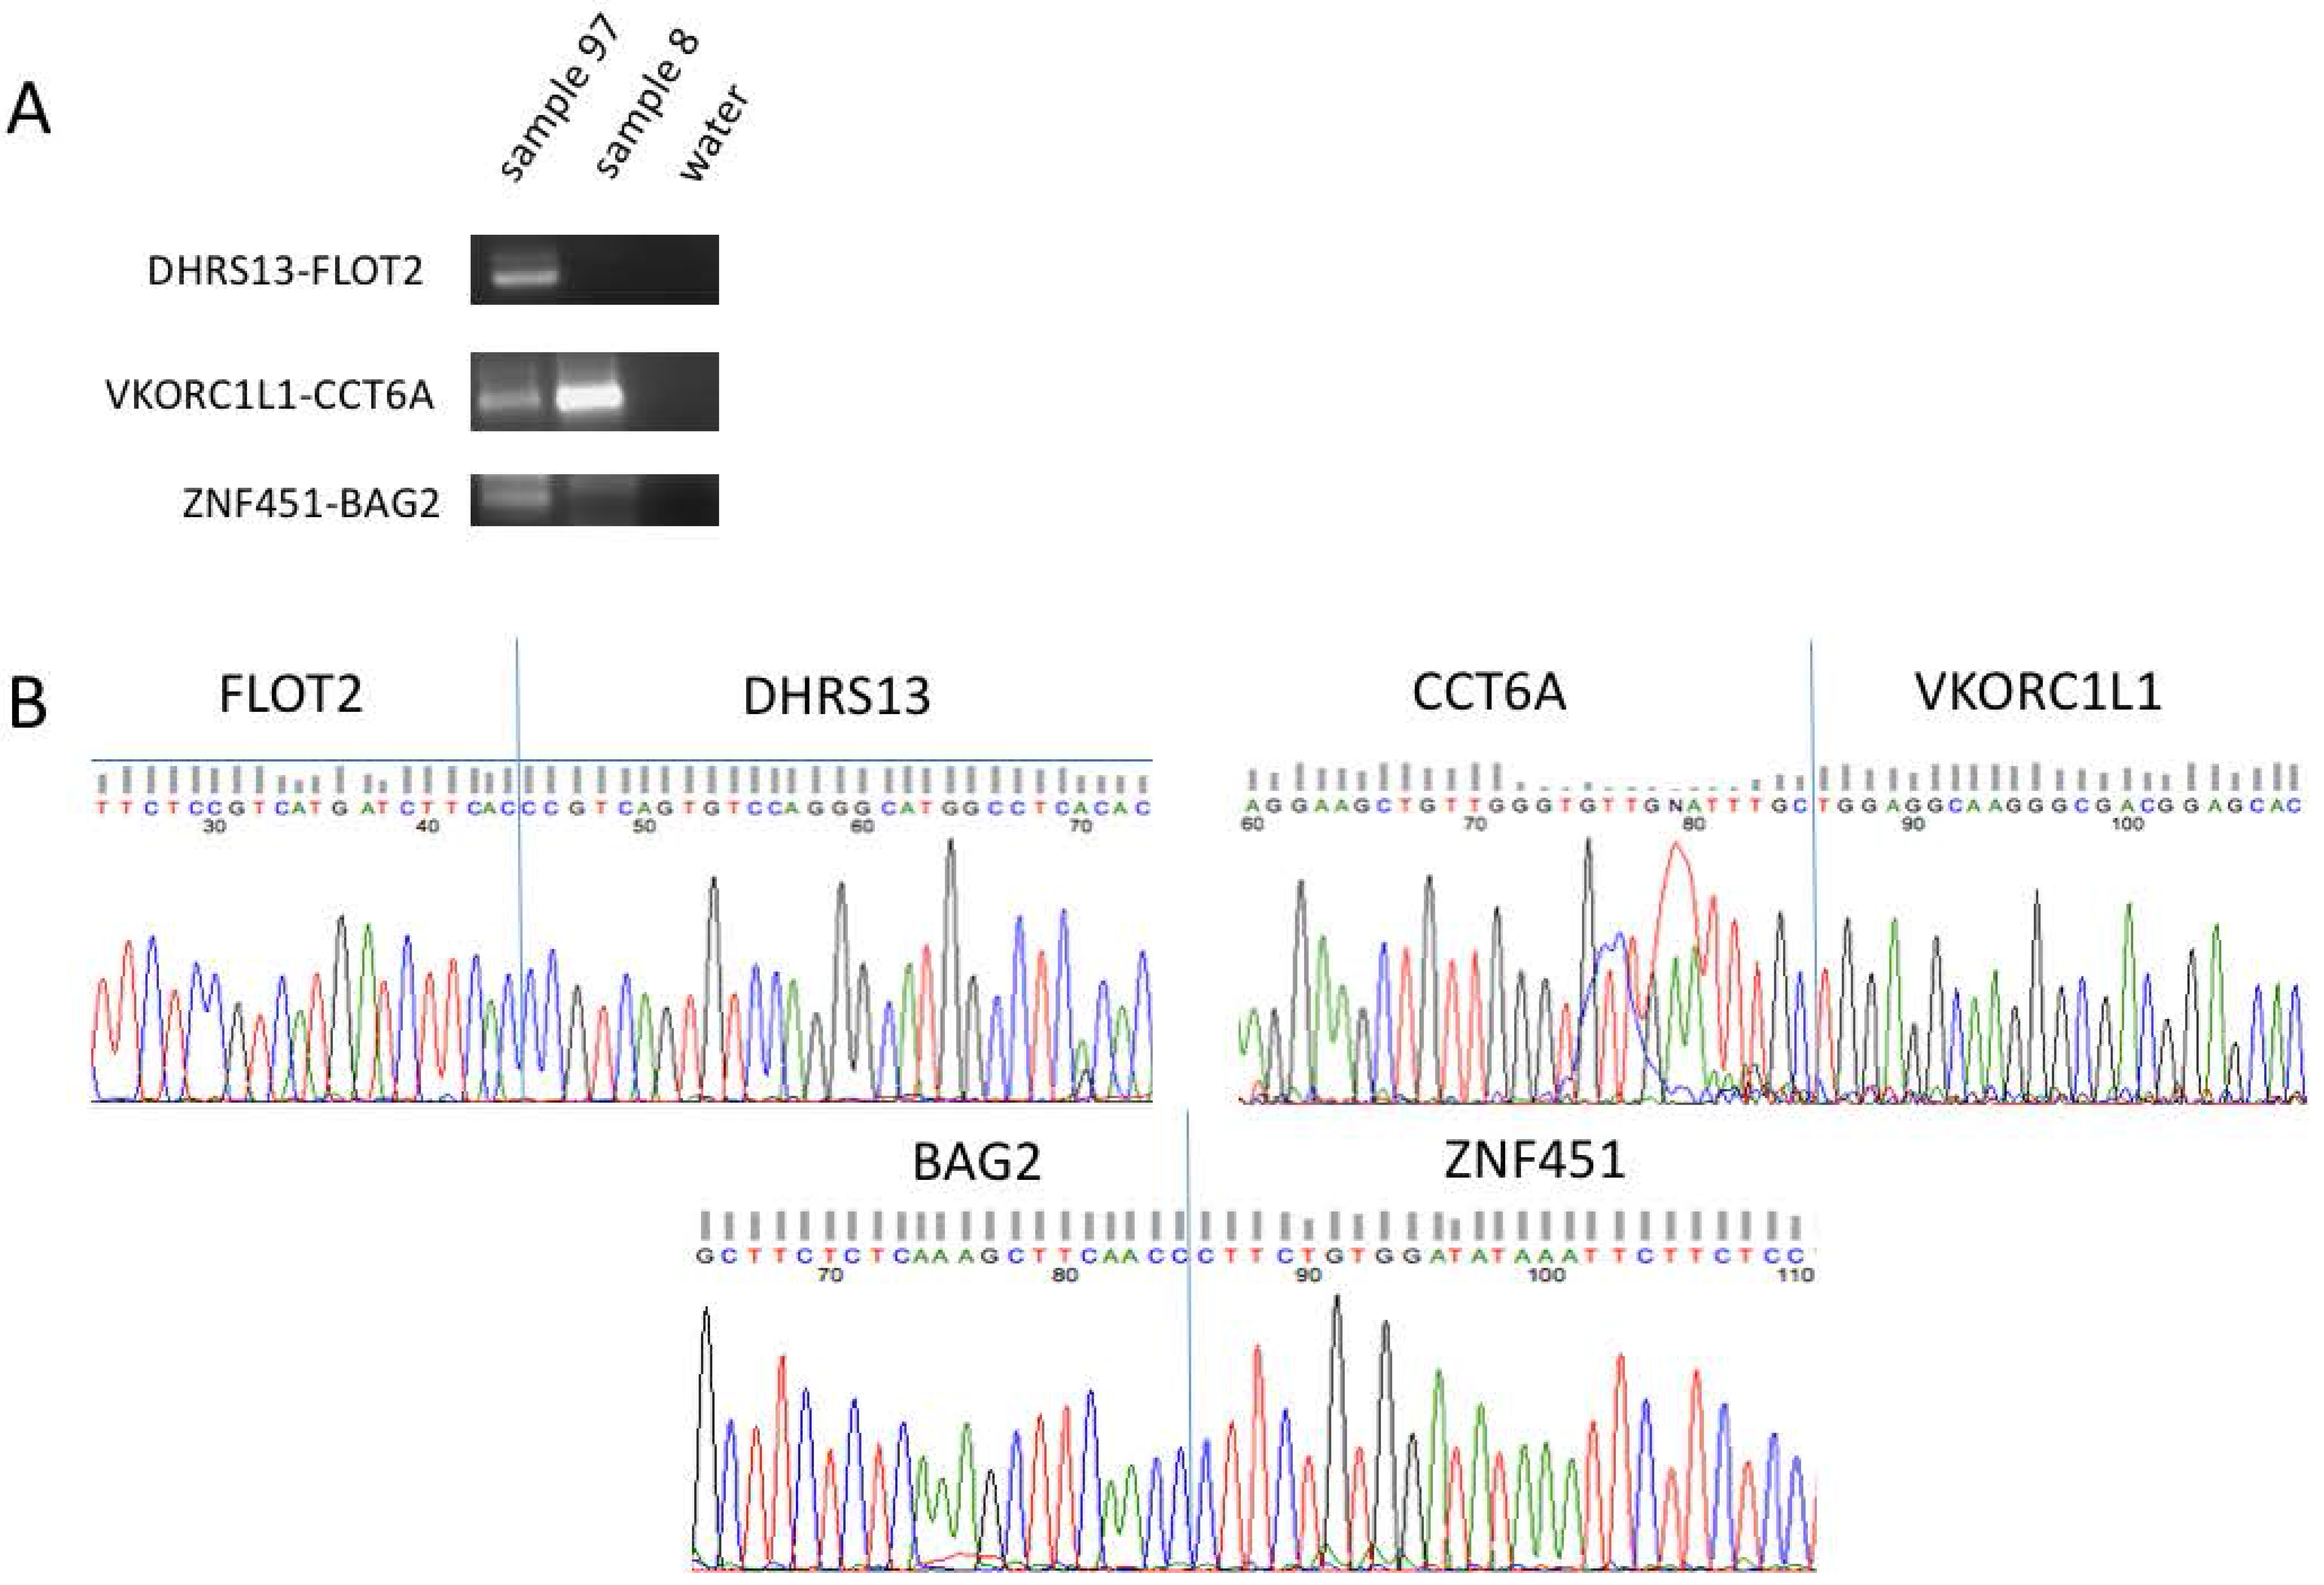
Figure 3.
Correlation of fusion RNAs with aging. (A) DHRS13-FLOT2 and LRP10-REM2 (both forms) normalized expression levels graphed against age with 20 samples. (B) DHRS13-FLOT2 and LRP10-REM2 (both forms) normalized expression levels graphed against age with 101 samples.
Figure 3.
Correlation of fusion RNAs with aging. (A) DHRS13-FLOT2 and LRP10-REM2 (both forms) normalized expression levels graphed against age with 20 samples. (B) DHRS13-FLOT2 and LRP10-REM2 (both forms) normalized expression levels graphed against age with 101 samples.
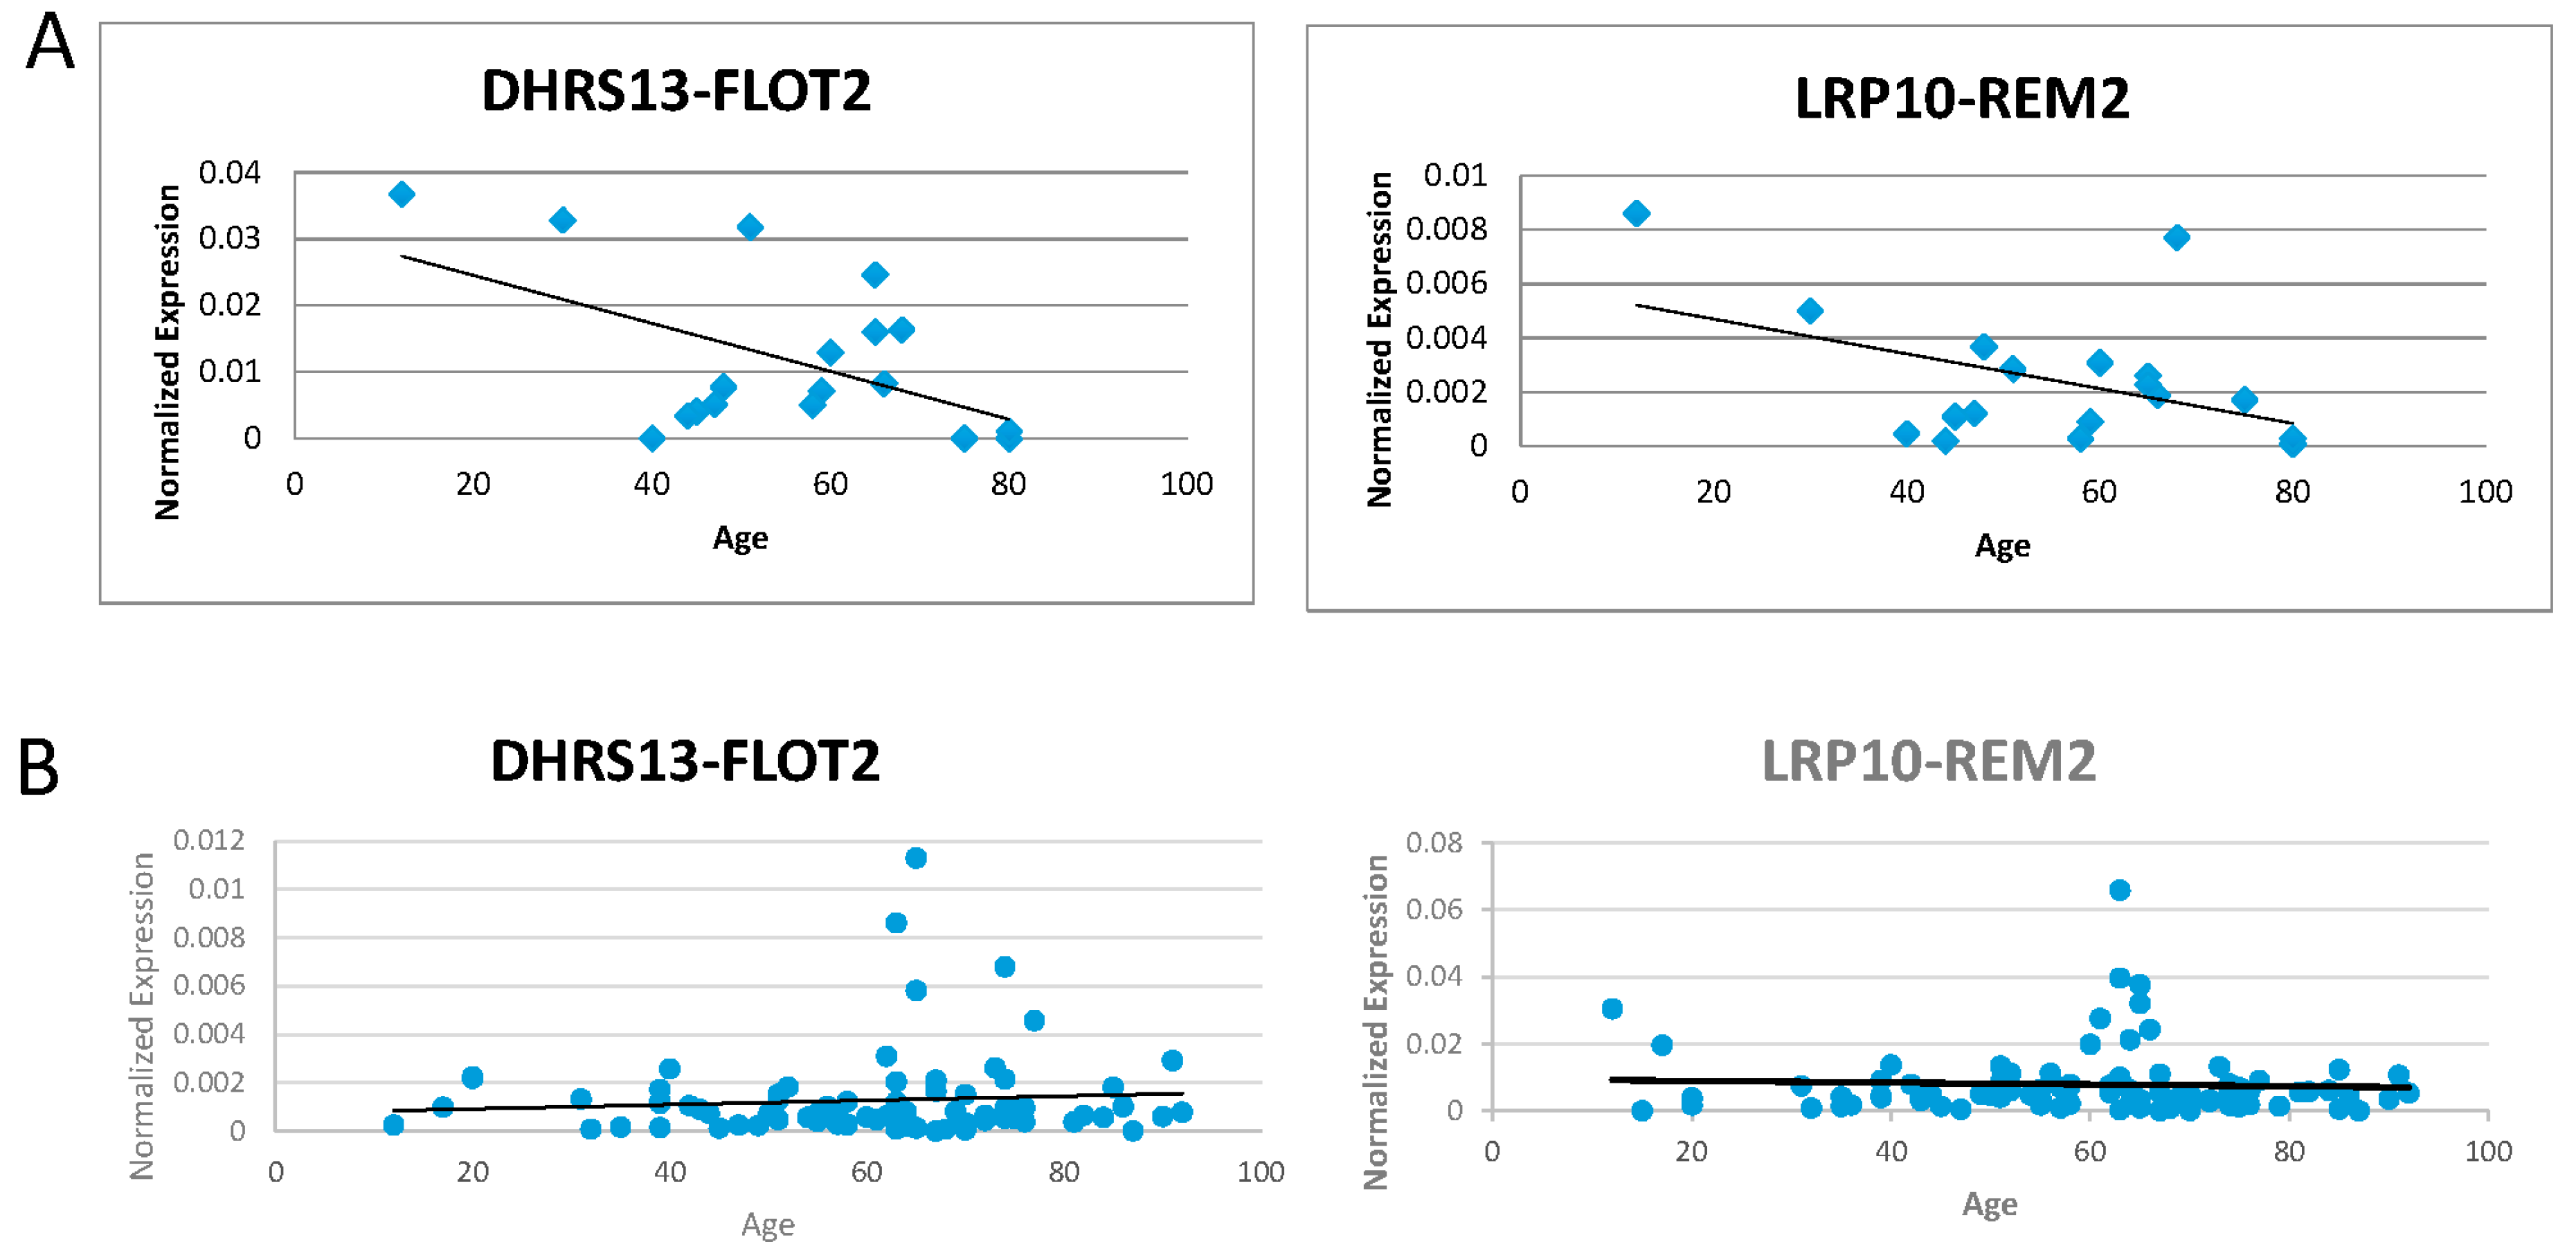
Figure 4.
Two isoforms of LRP10-REM2. (A) Exon diagram of the first form with 6th LRP10 exon joining to the 2nd REM2 exon (e6e2) of LRP10-REM2. (B) Exon diagram of the second form with 7th LRP10 exon joining to the 2nd REM2 exon (e7e2) of LRP10-REM2. (C) Correlation between the expression levels between the two forms of LRP10-REM2. Diagrams not to scale with base pair length.
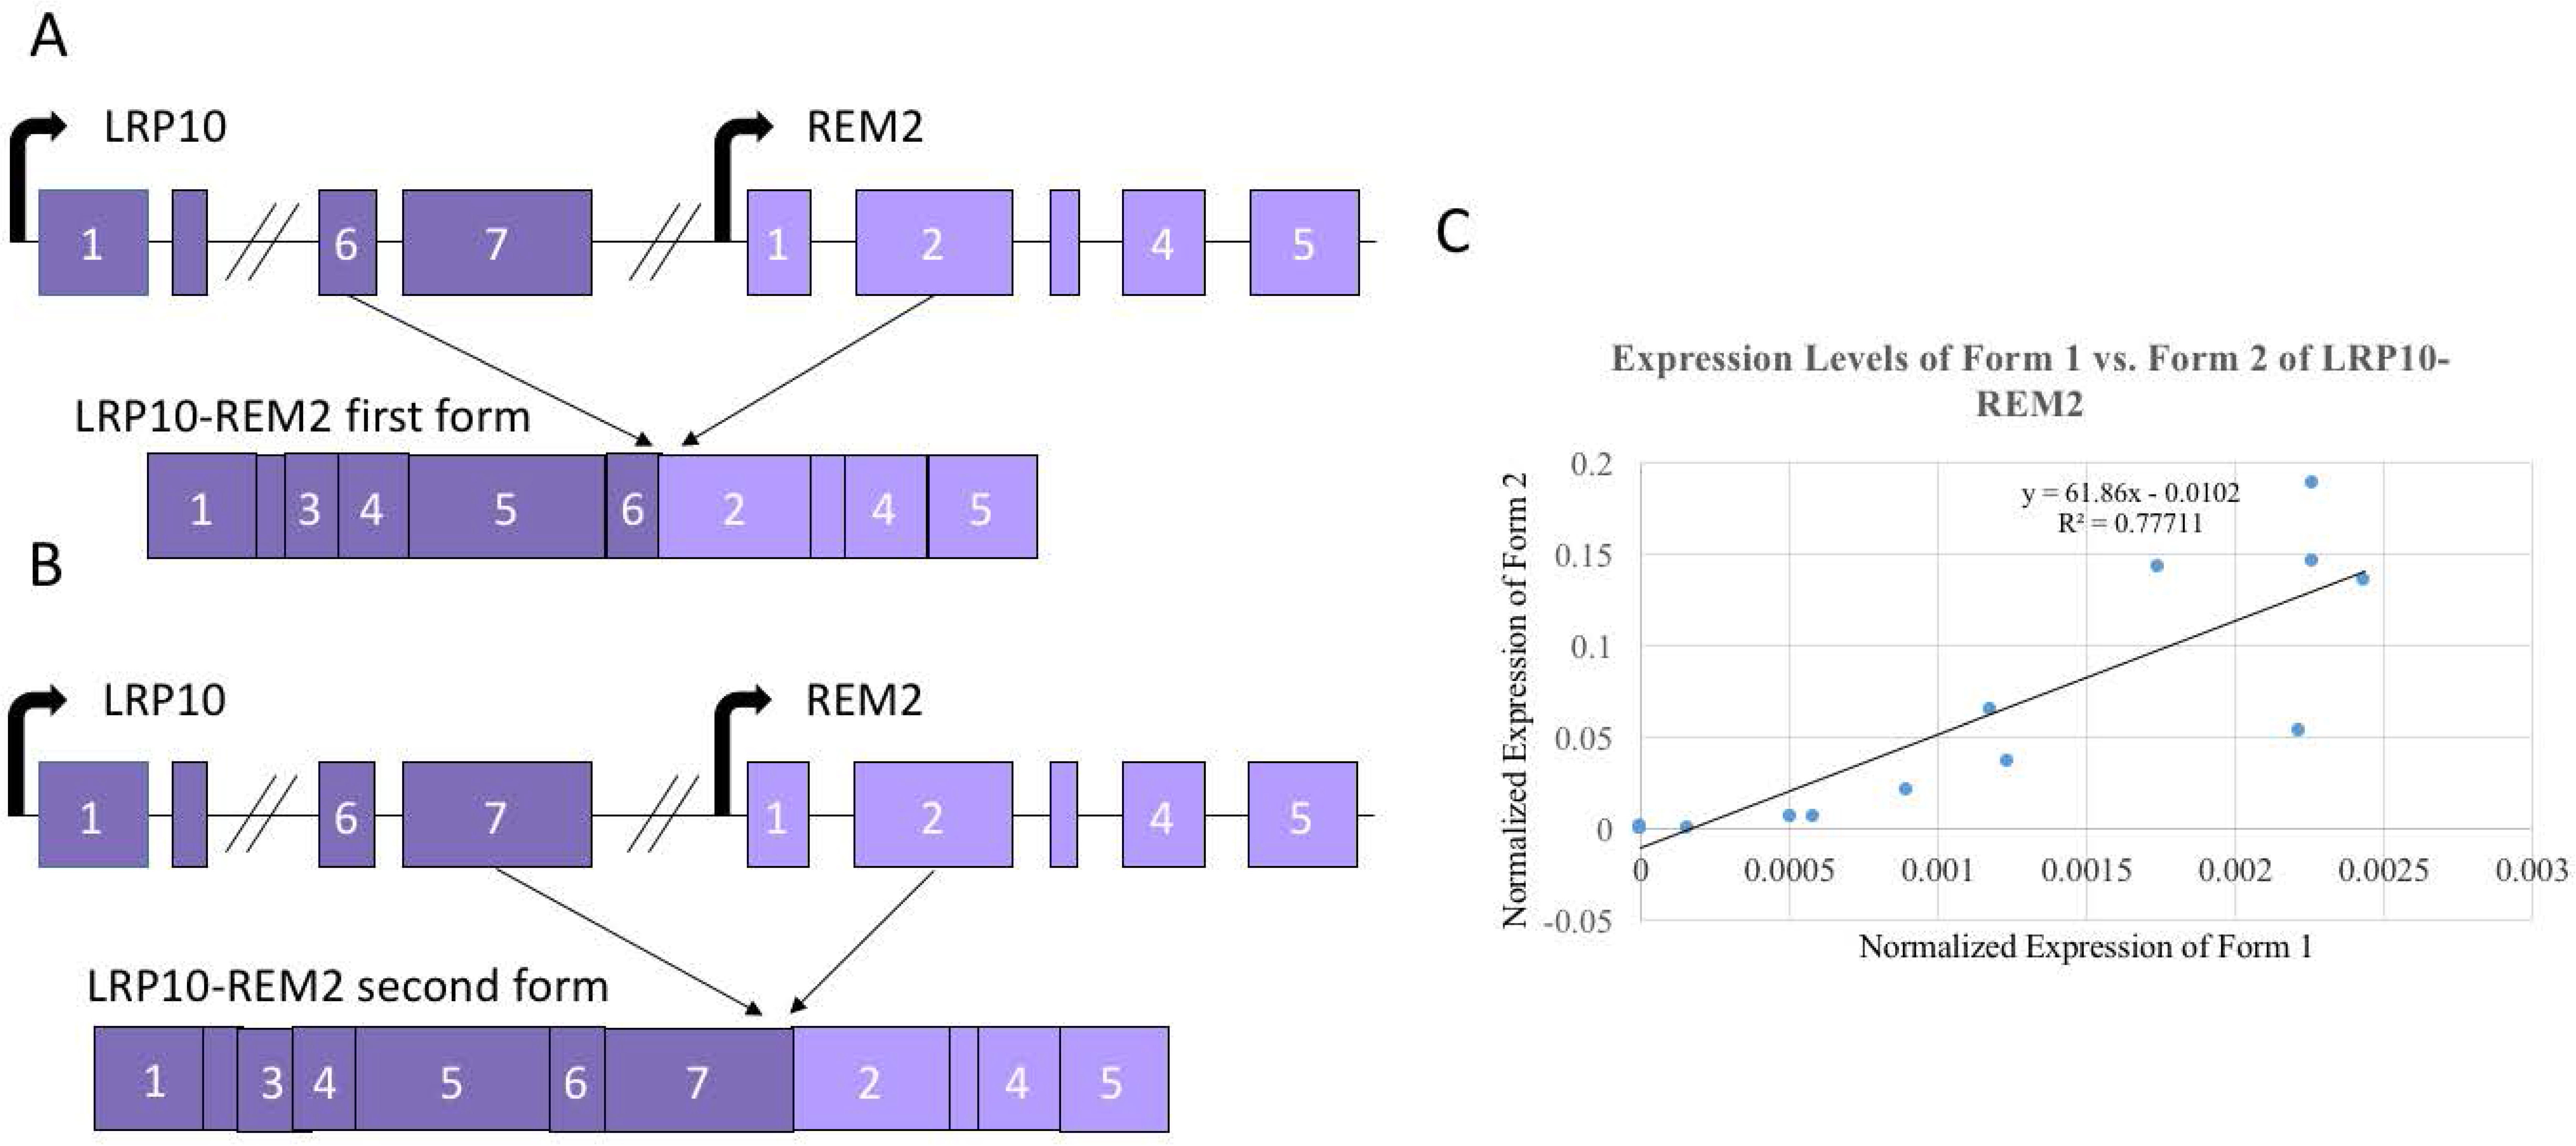
Figure 5.
Alternate analysis of the fusion expression with age buckets. Dot plots representing distribution of normalized expression by age groups (20–44, 45–54, 55–62, 63–70) for DHRS13-FLOT2, LRP10-REM2 (both forms), and VKORC1L1-CCT6A.
Figure 5.
Alternate analysis of the fusion expression with age buckets. Dot plots representing distribution of normalized expression by age groups (20–44, 45–54, 55–62, 63–70) for DHRS13-FLOT2, LRP10-REM2 (both forms), and VKORC1L1-CCT6A.

Table 1.
(A) Table of a subset of fusion candidates, their frequencies in GTEx, and their p-values for gender, age, race, ethnicity, height, weight, and Body Mass Index (BMI). (B) Primer sequences designed with Primer3 (Whitehead Institute for Biomedical Research, Cambridge, MA, USA) for all confirmed fusions. * Second forward primer designed to amplify the e7e2 form of LRP10-REM2.

(A)
| Candidate | Frequency | Cohort | Gender | Age | Race | Ethnicity | Height | Weight | BMI |
|---|---|---|---|---|---|---|---|---|---|
| ADCK4-NUMBL | 16 | 2.4 × 10⁻² | 1.90 × 10⁻¹ | 3.60 × 10⁻² | 9.39 × 10⁻¹ | 1 | 9.90 × 10⁻² | 4.40 × 10⁻¹ | 3.01 × 10⁻¹ |
| ATXN1L-IST1 | 7 | 1.24 × 10⁻¹ | 1 | 3.20 × 10⁻² | 9.95 × 10⁻¹ | 1 | 2.14 × 10⁻¹ | 5.10 × 10⁻² | 9.40 × 10⁻² |
| DHRS13-FLOT2 | 22 | 1.72 × 10⁻⁴ | 4.94 × 10⁻¹ | 4.00 × 10⁻² | 5.95 × 10⁻¹ | 1 | 8.20 × 10⁻¹ | 5.44 × 10⁻¹ | 6.31 × 10⁻¹ |
| LRP10-REM2 | 31 | 1.49 × 10⁻¹ | 7.09 × 10⁻¹ | 4.00 × 10⁻³ | 9.45 × 10⁻¹ | 1 | 8.96 × 10⁻¹ | 8.77 × 10⁻¹ | 4.73 × 10⁻¹ |
| AMN1-RBM28 | 51 | 1.01 × 10⁻⁵ | 6.52 × 10⁻¹ | 2.00 × 10⁻² | 5.06 × 10⁻¹ | 7.05 × 10⁻¹ | 5.49 × 10⁻¹ | 1.85 × 10⁻¹ | 3.03 × 10⁻¹ |
| C1orf112-SMARCA4 | 23 | 9.00 × 10⁻⁴ | 1 | 6.00 × 10⁻³ | 7.54 × 10⁻¹ | 1 | 9.80 × 10⁻¹ | 9.58 × 10⁻¹ | 5.96 × 10⁻¹ |
| C17orf99-SYNGR2 | 7 | 1.23 × 10⁻¹ | 9.55 × 10⁻¹ | 4.00 × 10⁻³ | 7.50 × 10⁻¹ | 1 | 9.54 × 10⁻¹ | 3.79 × 10⁻¹ | 9.30 × 10⁻¹ |
| EIF4A1-SENP3-EIF4A1 | 54 | 2.20 × 10⁻⁵ | 5.00 × 10⁻³ | 4.50 × 10⁻² | 2.55 × 10⁻¹ | 1 | 5.70 × 10⁻¹ | 2.94 × 10⁻¹ | 9.02 × 10⁻¹ |
| ARHGEF39-CCDC107 | 59 | 5.11 × 10⁻¹⁰ | 4.19 × 10⁻¹ | 3.00 × 10⁻³ | 5.82 × 10⁻¹ | 9.42 × 10⁻¹ | 8.16 × 10⁻¹ | 7.34 × 10⁻¹ | 6.75 × 10⁻¹ |
(B)
| Fusion | Forward Primer | Reverse Primer | Predicted Trend |
|---|---|---|---|
| ATXN1L-IST1 | AGAGGACAAGAAAGCTGGTCAC | ggctcaaagccagatcttctaa | negative |
| DHRS13-FLOT2 | ACCGAATTCAGGCTAAAGTTGA | tgatgtcctgcacattcttacc | positive |
| LRP10-REM2 | GCTACAGATCTTACGCCAGGAT | tggccagtcaagttcatctaca | positive |
| CTTGCTCCCTCGAACCAAC * | |||
| VKORC1L1-IST1 | AATCCTGCTCTCCATCTACGC | ttcagcagctctccaatgatta | positive |
| ZNF451-BAG2 | TGATAACATGGGTGCCAAAA | tctcaccgtcactgatctgc | negative |
Table 2.
Summary of R-values of normalized expression levels correlated with age for confirmed fusions at the 20 sample and 101 sample level.
Table 2.
Summary of R-values of normalized expression levels correlated with age for confirmed fusions at the 20 sample and 101 sample level.
| Fusion | 20 Sample R Value | 101 Sample R Value |
|---|---|---|
| ATXN1L-IST1 | −2.36 × 10⁻¹ | 1.08 × 10⁻¹ |
| DHRS13-FLOT2 | −5.25 × 10⁻¹ | 5.25 × 10⁻² |
| LRP10-REM2 | −4.54 × 10⁻¹ | −4.64 × 10⁻² |
| VKORC1L1-CCT6A | 2.36 × 10⁻¹ | −3.04 × 10⁻¹ |
| ZNF451-BAG2 | −8.25 × 10⁻² | 3.05 × 10⁻² |
© 2017 by the authors. Licensee MDPI, Basel, Switzerland. This article is an open access article distributed under the terms and conditions of the Creative Commons Attribution (CC BY) license (http://creativecommons.org/licenses/by/4.0/).
Share and Cite
MDPI and ACS Style
Huang, R.; Kumar, S.; Li, H. Absence of Correlation between Chimeric RNA and Aging. Genes 2017, 8, 386. https://doi.org/10.3390/genes8120386
AMA Style
Huang R, Kumar S, Li H. Absence of Correlation between Chimeric RNA and Aging. Genes. 2017; 8(12):386. https://doi.org/10.3390/genes8120386
Chicago/Turabian StyleHuang, Reyna, Shailesh Kumar, and Hui Li. 2017. "Absence of Correlation between Chimeric RNA and Aging" Genes 8, no. 12: 386. https://doi.org/10.3390/genes8120386
Note that from the first issue of 2016, this journal uses article numbers instead of page numbers. See further details here.