Article

Structural Characterization and Association of Ovine Dickkopf-1 Gene with Wool Production and Quality Traits in Chinese Merino

1
Key Laboratory of Chicken Genetics and Breeding at Ministry of Agriculture, Key Laboratory of Animal Genetics, Breeding and Reproduction at Education Department of Heilongjiang Province, Key Laboratory of Animal Cellular and Genetic Engineering of Heilongjiang Province, Harbin 150030, China
2
Institute of Animal Husbandry and Veterinary, Xinjiang Academy of Agriculture and Reclamation Science, Shihezi 832000, China
*
Author to whom correspondence should be addressed.
These authors contributed equally to this work.
Genes 2017, 8(12), 400; https://doi.org/10.3390/genes8120400
Submission received: 20 October 2017 / Revised: 6 December 2017 / Accepted: 15 December 2017 / Published: 20 December 2017
(This article belongs to the Section Animal Genetics and Genomics)

Abstract

:
Dickkopf-1 (DKK1) is an inhibitor of canonical Wnt signaling pathway and regulates hair follicle morphogenesis and cycling. To investigate the potential involvement of DKK1 in wool production and quality traits, we characterized the genomic structure of ovine DKK1, performed polymorphism detection and association analysis of ovine DKK1 with wool production and quality traits in Chinese Merino. Our results showed that ovine DKK1 consists of four exons and three introns, which encodes a protein of 262 amino acids. The coding sequence of ovine DKK1 and its deduced amino acid sequence were highly conserved in mammals. Eleven single nucleotide polymorphisms (SNPs) were identified within the ovine DKK1 genomic region. Gene-wide association analysis showed that SNP5 was significantly associated with mean fiber diameter (MFD) in the B (selected for long wool fiber and high-quality wool), PW (selected for high reproductive capacity, high clean wool yield and high-quality wool) and U (selected for long wool fiber with good uniformity, high wool yield and lower fiber diameter) strains (p < 4.55 × 10−3 = 0.05/11). Single Nucleotide Polymorphisms wide association analysis showed that SNP8 was significantly associated with MFD in A strain and fleece weight in A (selected for large body size), PM (selected for large body size, high reproductive capacity and high meat yield) and SF (selected for mean fiber diameter less than 18 μm and wool fiber length between 5 and 9 cm) strains (p < 0.05), SNP9 was significantly associated with curvature in B and U strains (p < 0.05) and SNP10 was significantly associated with coefficient of variation of fiber diameter in A, PW and PM strains and standard deviation of fiber diameter in A and PM strains (p < 0.05). The haplotypes derived from these 11 identified SNPs were significantly associated with MFD (p < 0.05). In conclusion, our results suggest that DKK1 may be a major gene controlling wool production and quality traits, also the identified SNPs (SNPs5, 8, 9 and 10) might be used as potential molecular markers for improving sheep wool production and quality in sheep breeding.

1. Introduction

Wool is an important valuable economic product of Merino sheep and plays an important role in textile industry. Wool still is a vital source of income in sheep operation although the proportion of income derived from wool sales has decreased. In Xinjiang Uyghur Autonomous Region where Chinese Merino sheep are raised, wool generally accounts for 21% of gross flock income. The value of wool is determined by its intrinsic quality which includes a number of wool quality traits. From these traits, mean fiber diameter (MFD) is the most important wool characteristics when assessing value. The variation of mean fiber diameter, expressed as the standard deviation of the mean fiber diameter (FDSD) and coefficient of variation of the mean fiber diameter (CVFD), is also an important trait for wool processing. Less variation in fiber diameter is desirable to wool processor because of its better spinning quality. Wool production and quality traits are polygenic and several of genes have been identified to be associated with wool production and quality trait. For example, it has been shown that the Desmoglein 4 (DSG4) gene is associated with wool length and curvature [1], while the Beta-3 adrenergic receptor (ADRB3) gene is associated with wool mean staple strength and yield [2].
Dickkopf-1 (DKK1), a member of the dickkopf family, is a secreted canonical Wnt signaling inhibitor [3]. The canonical Wnt signaling pathway plays important roles in developmental processes, organogenesis, oncogenetic and self-renewal during tissue morphogenesis [4,5]. In the absence of the Wnt ligands, cytoplasmic β-catenin is phosphorylated and constantly degraded by the destruction complex formed by Axin, APC (WNT signaling pathway regulator), casein kinase 1 (CK1) and glycogen synthase kinase 3 beta (GSK-3β). In the presence of Wnt ligands, they bind to the Frizzled/LRP receptor complex at the cell surface. These receptors transduce a signal into the cells. As a consequence, the degradation of β-catenin is inhibited and β-catenin accumulates in the cytoplasm. The accumulated β-catenin travels to the nucleus to form complexes with the T cell factor/lymphoid enhancer binding factor (TCF/LEF) and activates Wnt target gene expression [6]. The canonical Wnt signaling regulates hair follicle morphogenesis [7], cycling [8] and hair follicle stem cell proliferation [9]. It has also been demonstrated that DKK1 regulates hair follicle density [10], terminal hair [11], hair follicle size [12] and hair follicle cycling [13,14] by inhibiting canonical Wnt signaling. The hair follicle size, density and cycling have an effect on the hair or wool length and fiber diameter [15,16,17]. Although it has been demonstrated that DKK1 regulates hair follicle morphogenesis and cycling, its effects on hair production and quality traits are unclear.
The aim of this work was to investigate the potential involvement of DKK1 in wool production and quality traits. We characterized the genomic structure of ovine DKK1 and performed single nucleotide polymorphism screening and association analysis of the single nucleotide polymorphisms (SNPs) and haplotypes of DKK1 with wool production and quality traits in Chinese Merino population.

2. Materials and Methods

2.1. Animals and Trait Measurements

A total of 743 ewes from Chinese Merino breed population (Xinjiang Junken type) comprising 181 superfine wool sheep (SF), 134 prolific meat sheep (PM), 138 prolific wool sheep (PW), 151 A strain, 103 B strain and 36 U strain were genotyped and phenotyped in this study. These six Chinese Merino strains were selected for different purposes. The SF strain was selected for mean fiber diameter less than 18 μm and wool fiber length between 5 and 9 cm. The PM strain was selected for large body size, high reproductive capacity and high meat yield. Its wool fiber length ranged between 9.30 and 12.11 cm, while mean fiber diameter ranged between 20.72 and 23.65 μm. The PW strain was selected for high reproductive capacity, high clean wool yield and high-quality wool. The reproduction rate of PM and PW was 182.4%, which is more than 60% higher compared to SF. The A strain was selected for large body size, while B strain was selected for long wool fiber and high-quality wool. The U strain was selected for long wool fiber with good uniformity, high wool yield and lower fiber diameter. Its mean fiber diameter ranged between 15.58 μm and 20.79 μm [18]. All animals were fed ad libitum with grazing diet and maintained under the same conditions of environment, feeding and management. Procedures involving animals and their care were conducted in conformity with the guidelines of National Institutes of Health guidelines [19] (NIH Publication No. 85-23, revised 1996) and the Ministry of Science and Technology of the People’s Republic of China (Approval number:2006-398, 30 September 2006) and were approved by the Laboratory Animal Management Committee of the Northeast Agricultural University (Harbin, China) and Xinjiang Academy of Agriculture and Reclamation Science (Shihezi, China) (2014ZX08009-002 and 2009ZX08009-160B, 5 February 2010).
Wool sample were collected from ewes before pregnancy, which occurred in May 2009. All ewes were aged from 1 to 12 years and shorn at the same year. According to the guidelines of the China Fiber Inspection Bureau (CFIB) and International Wool Textile Organization (IWTO), the wool production and quality traits (MFD, FDSD, CVFD, wool fiber length (WFL), curvature and fleece weight (FW)) were measured in this study. The MFD, FDSD and CVFD were measured using an instrument called OFDA2000 (BSC Electronics, Ardross, Australia) which is recognized by the IWTO test method (47 and 57). Wool fiber length was measured in centimeters and reflected the relaxed length of the staple under no tension on the spine, above the last rib. A crimp is defined as the distance from one peak to the next in the wool staple. Curvature was measured by using the OFDA2000 (BSC Electronics). Fleece weight and the total sheared fleece were weighed [20].

2.2. Genomic DNA Isolation

Ear notch samples were collected and genomic DNA was extracted using the standard phenol-chloroform method [21], then stored for genotyping. DNA concentration and purity were measured using the NanoDrop 2000 spectrophotometer (Thermo Scientific, Irvine, CA, USA). An absorbance 260/280 ratio between 1.8 and 2.0 AU and an absorbance 260/230 ratio between 2.0 and 2.2 AU represent a high-quality DNA sample. Genomic DNA integrity was determined by 1% agarose gel electrophoresis using the intercalating agent GelRed™ (Biotium, Fremont, CA, USA) 10,000× with the Bromophenol Blue as carrier, then visualized under ultraviolet light (UV) and photographed.

2.3. RNA Isolation and Reverse Transcription

The Liver, testis and kidney tissues of the six strains of Chinese Merino sheep were collected (n = 18, three for each strain). The total RNAs from these samples were isolated using TRIzol reagent (Invitrogen, Rockville, MD, USA) according to the manufacturer’s instructions. RNA concentration and purity were measured using the Nanodrop 2000 spectrophotometer (Thermo Scientific). Absorbance 260/280 ratio was used to assess the purity of the isolated total RNAs. The absorbance 260/280 ratio between 1.8 and 2.0 indicate good RNA purity. RNA integrity was determined by 1.2% formaldehyde denaturing gel electrophoresis. To eliminate genomic DNA (gDNA) contamination, all isolated RNAs were treated with RNase-free DNase I (Qiagen Inc., Hilden, Germany). Complementary DNA (cDNA) was synthesized from 1 μg of total RNA using Promega Improm-II reverse transcription System (Promega, Madison, WI, USA) following the manufacturer’s instructions.

2.4. PCR Amplification

The synthesized cDNA was used as a template to amplify the entire coding sequence of ovine DKK1 by PCR using gene specific primer DKK1-F1 and DKK1-R1 (Table 1), which were designed according to the predicted cDNA sequence of ovine DKK1 (GenBank accession No. XM_012138945.2). The PCR amplification of DKK1 cDNA was performed in a 50 μL reaction volume containing 1 μL of Phanta Max Super-Fidelity DNA Polymerase (Vazyme Biotech Co., Ltd., Nanjing, China), 1 μL cDNA, 25 μL of 2× Phanta Max buffer, 1 μL of 10 mM dNTP Mix, 2 µL of forward primer (10 µM), 2 µL of reverse primer (10 µM) and 18 μL of RNase-free water. The cycling protocol was 95 °C for 3 min, 30 cycles of 95 °C for 15 s, 59 °C for 15 s, 72 °C for 1 min and a final extension at 72 °C for 5 min. The products were analyzed by 1% agarose gel electrophoresis.
To obtain the full-length ovine DKK1 genomic sequence, a total of five primer pairs, were designed to cover the entire genomic region of ovine DKK1 based on the caprine DKK1 genomic sequence (GenBank accession No. GQ480837) and the bovine genome sequence from the assembly of chromosome 26 reported in Genbank (accession number NM_001205544) and the Bos taurus genome sequence (http://genome.ucsc.edu). The 3′-terminus of each amplified fragment overlapped with the 5′-terminus of its adjacent amplified fragment. The primer sequences are listed in Table 1. The PCR amplification of the DKK1 genomic sequence was performed in a 50 μL reaction volume containing 1 μL of Phanta Max Super-Fidelity DNA Polymerase (Vazyme Biotech Co., Ltd.), 100 ng ovine gDNA, 25 μL of 2× Phanta Max buffer, 1 μL of 10 mM dNTP Mix, 2 µL of forward primer (10 µM), 2 µL of reverse primer (10 µM) and RNase-free water to final volume of 50 μL. The genomic PCR conditions included: 95 °C for 3 min followed by 35 cycles at 95 °C for 15 s and 46.9 °C (52.0, 56.2, 56.2, 58.6 °C) for 15 s, 72 °C for 2 min and a final extension at 72 °C for 5 min. The products were analyzed by 1% agarose gel electrophoresis.

2.5. Sequencing and Sequence Analysis

PCR products of DKK1 cDNA and genomic fragments were purified using the Agarose Gel Extraction Kit according to the manufacturer’s instructions (TIANGEN, Beijing, China) and cloned into pGEM-T Easy Vector (Promega, Madison, WI, USA). The recombinant plasmids were extracted using PureLinkR Quick Plasmid Miniprep kit (Invitrogen) and sequenced by Invitrogen. The sequences were aligned using the Align X function of Vector NTI program (Informax, Rockville, MD, USA). The homologous DKK1 mRNA sequences of 16 different animal species used in this study were obtained from National Center for Biotechnology Information (NCBI, https://www.ncbi.nlm.nih.gov/) database (Table S1). Homology analysis was performed using the Align Sequences Nucleotide BLAST utility at NCBI (https://blast.ncbi.nlm.nih.gov/Blast.cgi). Translation of the nucleotide sequences into the amino acids was performed using the DNAMAN program (Lynnon Corp., Quebec, Canada). Exon–intron boundaries were identified by alignment of the acquired Merino DKK1 genomic DNA sequence (GenBank accession No. JQ348893.1) and the acquired Merino DKK1 cDNA sequence using the Align Sequences Nucleotide BLAST at NCBI. The signal peptide was analyzed using SignalP 3.0 (http://www.cbs.dtu.dk/services/SignalP/). The conserved domains were analyzed using a conserved domain database (CDD) (http://www.ncbi.nlm.nih.gov/cdd/). Transcription factor binding sites (TFBS) were predicted using Mulan (https://mulan.dcode.org/). Core promoter was predicted using Promoter SCAN (http://www-bimas.cit.nih.gov/molbio/proscan/). The neighbor-joining phylogenetic tree was constructed using the Phydit program version 3.0 [22] based on genetic distances calculated with Kimura’s two-parameter method [23].

2.6. Identification of Polymorphisms of the Ovine DKK1

To screen for DKK1 polymorphisms, a total of five primer pairs (DKK1-F2/R2-DKK1-F6/R6) were used to amplify DKK1 genomic region (Table 1) using the pooled gDNA as the template, which were from 60 Chinese Merino individuals as previously described [24]. The PCR products obtained from pooled genomic DNA sample were directly sequenced by Sanger sequencing and a SNP was ascertained by the presence of a double peak at the level of a single base in the chromatograms of sequencing of pooled PCR products [25].

2.7. Genotyping of the Ovine DKK1

A multiplexed SNP single base extension (SBE) assay was used for SNP genotyping. It was performed using a 384 well plate format on the Sequenom Mass ARRAY platform (Bioyong Technologies Inc., Beijing, China). The Mass ARRAY Assay Design 3.1 software (Sequenom, San Diego, CA, USA) was used to design amplification and allele-specific extension primers. The raw data files generated by Mass Array (Sequenom) were analyzed for the intensity peaks of calibrant to ascertain the quality of the data as previous described [26,27]. An overall call rate of greater than 95% was maintained. For every 96 samples (a quadrant of the Sequenom chip), four samples were duplicated and the call rates were checked for concordance. The calls in the negative control (no DNA) were also monitored in all the runs. The reproducibility of this study was 100%.

2.8. Statistical Analysis

Data are summarized as mean values for each parameter measured in each group. Correlation analysis between wool production and quality traits was subjected to the Pearson procedure of SPSS 22.0 (IBM, Armonk, NY, USA). Genotype and allelic frequencies at each SNP site were calculated, with the allele frequencies in subjects for each SNP evaluated for deviation from Hardy–Weinberg equilibrium and differences between groups using the χ2 test using Statistical Analysis System (SAS Inst. Inc., Cary, NC, USA).
Haplotypes for each individual were obtained in SAS/GENETICS using the PROC HAPLOTYPE procedure. This procedure uses the Expectation Maximization (EM) algorithm to generate maximum likelihood estimates of the haplotype frequencies. Before analyzing the association between the identified SNPs and wool production and quality traits, we performed the data preprocessing: if the number of one genotype was fewer than 5% × the total number of samples, we removed the data for this genotype.
According to the characteristics of the Chinese Merino population, associations of DKK1 SNPs, haplotypes or allele substitution effect with wool production and quality traits were analyzed using mixed linear model procedure in SAS (SAS Inst. Inc.). The model was as below:
Y = μ + A + S + L + G [L] + e
where Y is the phenotypic value for each individual, μ is the population mean, A is the continuous effect of the age, S is the random effect of the sire, L is the fixed effect of the line, G [L] is the effect of genotype nested within line and e is the random error; Data were subjected to the John’s Macintosh Program 7.0 (JMP, SAS Inst. Inc.) which was used to examine the correlation between genotypes and haplotypes and continuous traits (MFD, FDSD, CVFD, WFL, curvature and FW) and to evaluate the least squares means. The genetic and phenotypic correlations between the wool production and quality traits were estimated using ASREML software [28], with line treated as a fixed effect. The bivariate model was used to calculate the genetic and phenotypic correlations.
The standard errors (SE) of correlations between genotypes and wool production and quality traits were approximated as described in the study of Falconer and Mackay [29]. The genetic model used for parameter estimations is described as follows:
y = + Zu + e
in which y is an n-dimensional vector of observed values for the traits, X is an n × p matrix of the fixed effects, β is a p-dimensional vector of the fixed effects, Z is an n × q matrix of the random effects, u is a q-dimensional vector of the random genetic effects and e is an n-dimensional vector of the random residual effects.
The random effects u and e were assumed to follow the normal distributions with mean 0, that is, Expectation [y] = . The variances of u and e were assumed to be Var(u) = Ag and Var(e) = Ir, respectively, in which A is the numerator relationship matrix of all animals in the sire file, g is the additive genetic variance for the single-variate and the additive genetic variance–covariance matrix between traits for the bivariate model analysis, I is the identity matrix of order equal to the number of animals with phenotypes and r is the residual variance for the single-variate and the variance–covariance matrix between residuals on the same animal when performing the bivariate model analysis, where residual covariance equal to 0 [30]. Significance was evaluated based on an SNP-wide and gene-wide type I error rate of 0.05. The values were considered significant at p < 0.05 based on SNP-wide and threshold gene-wide which is p < 4.55 × 10−3 = 0.05/11 using Bonferroni correction.

3. Results

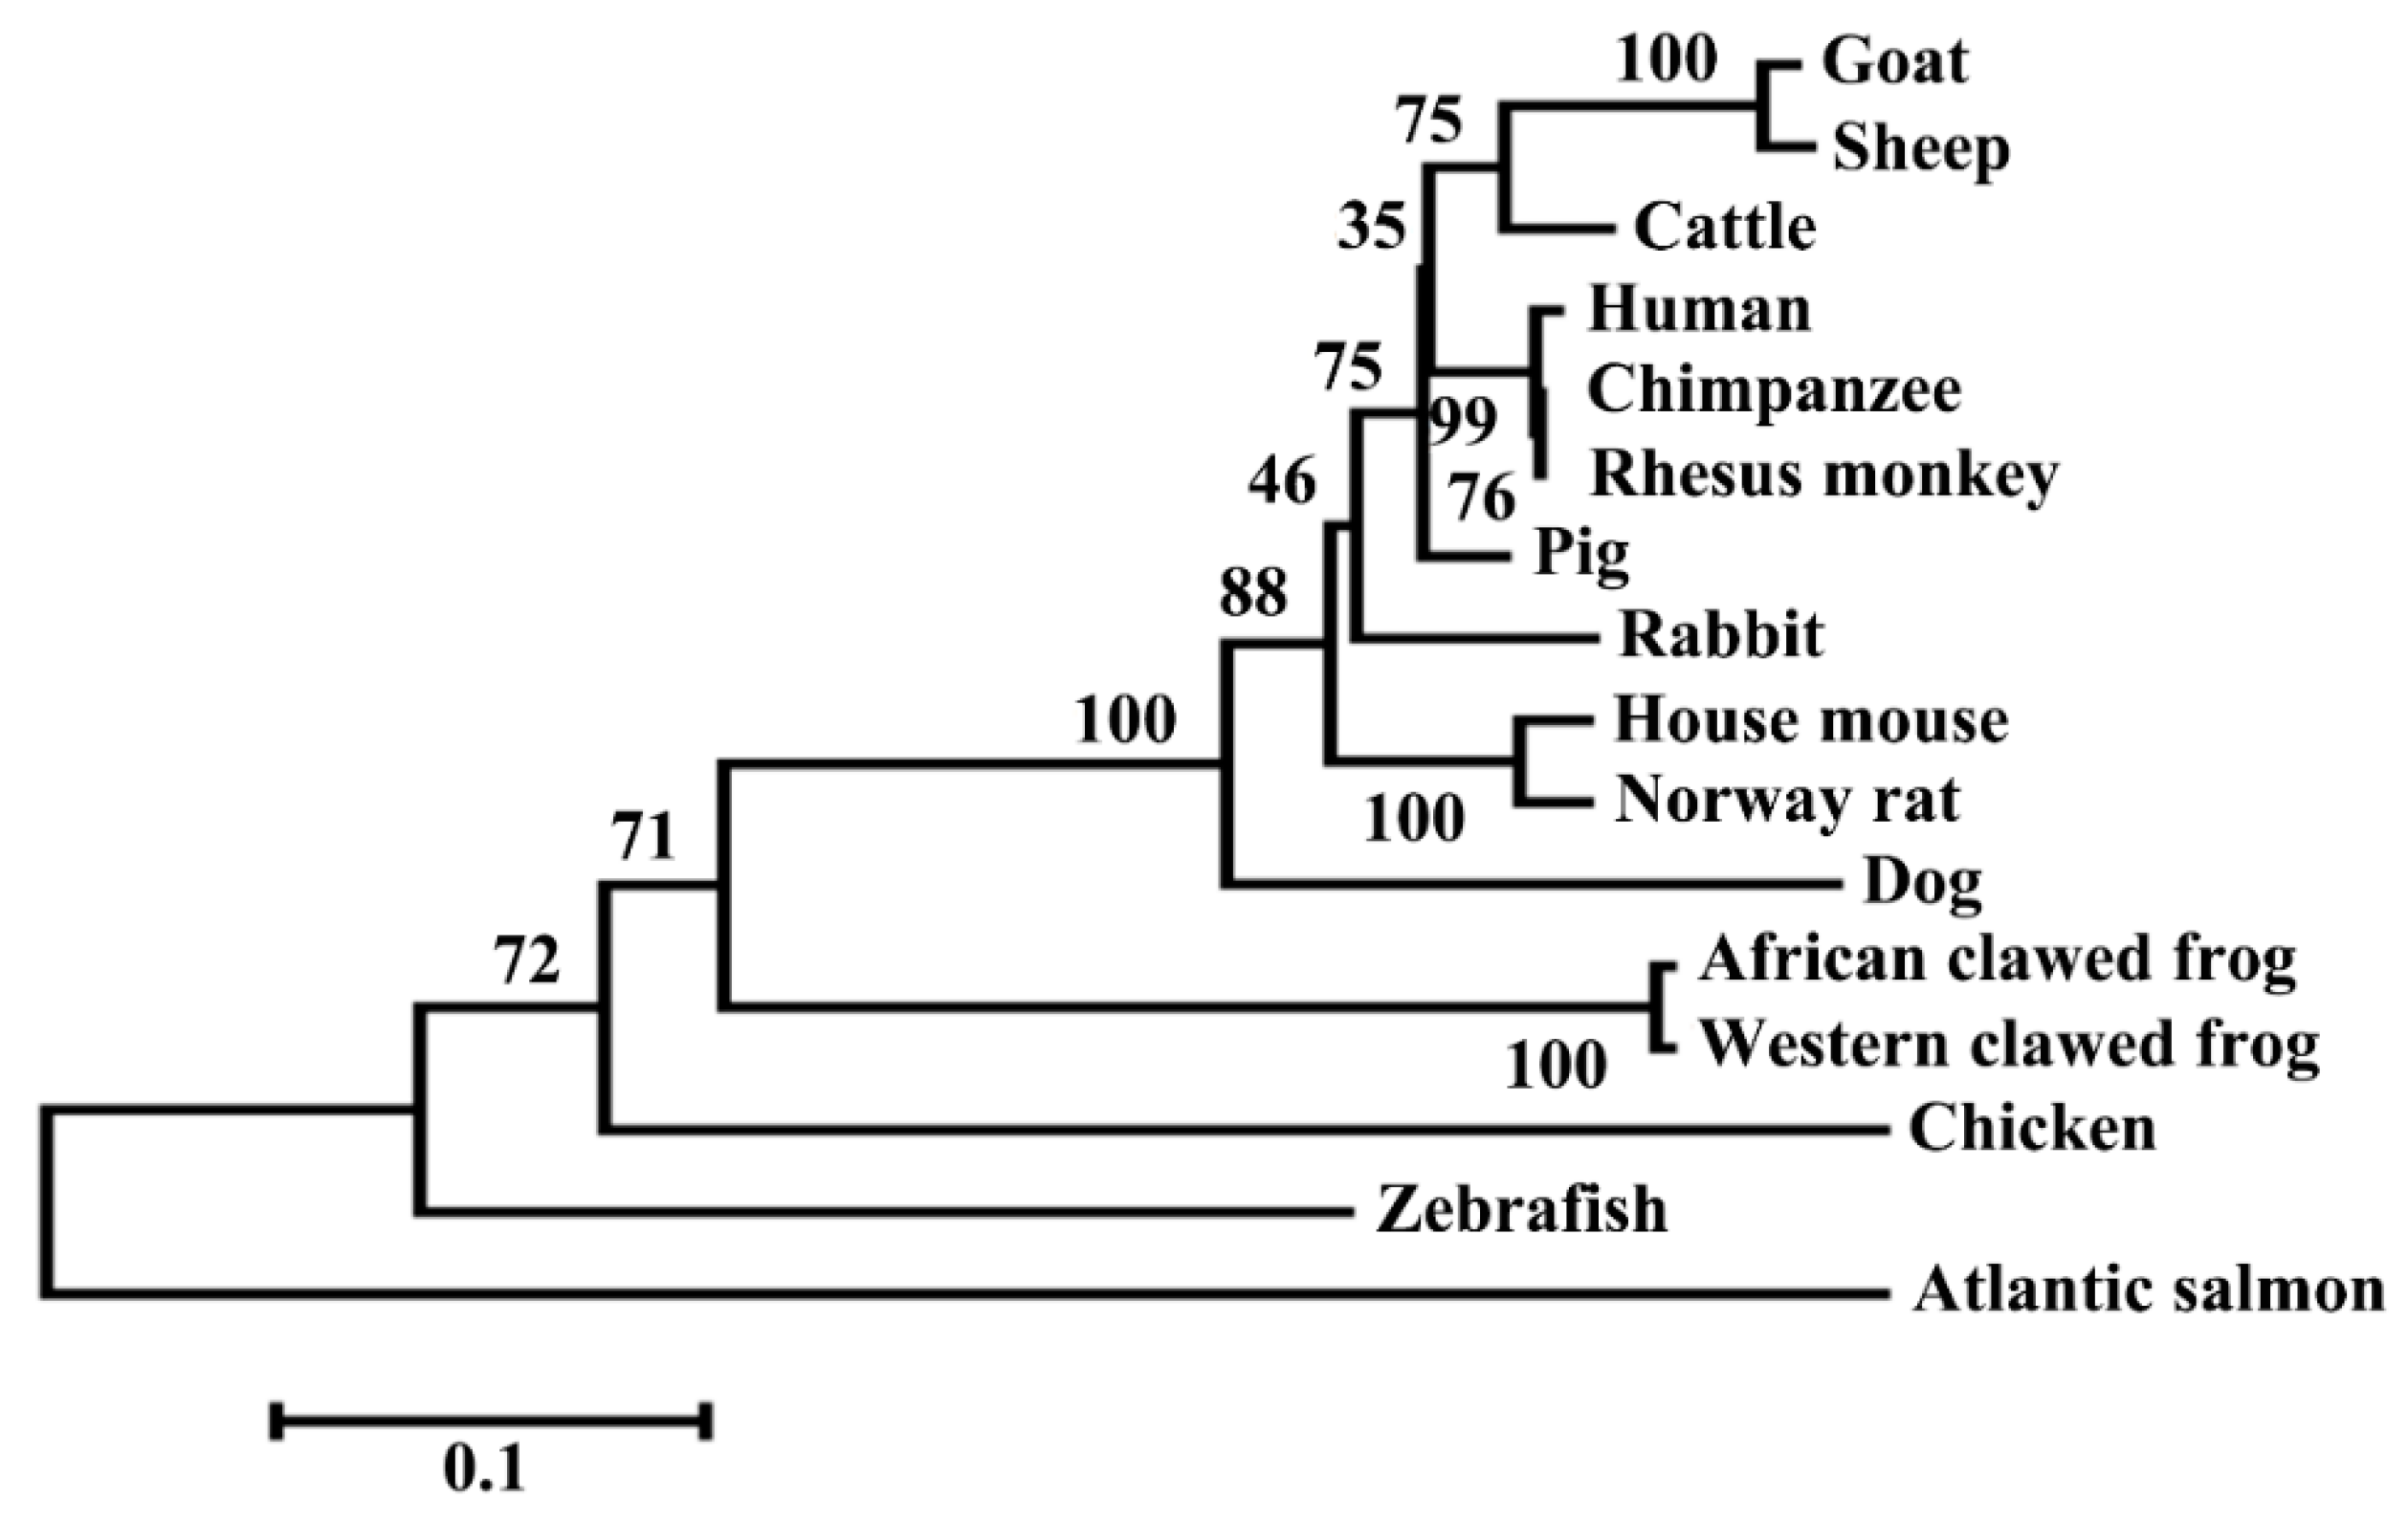
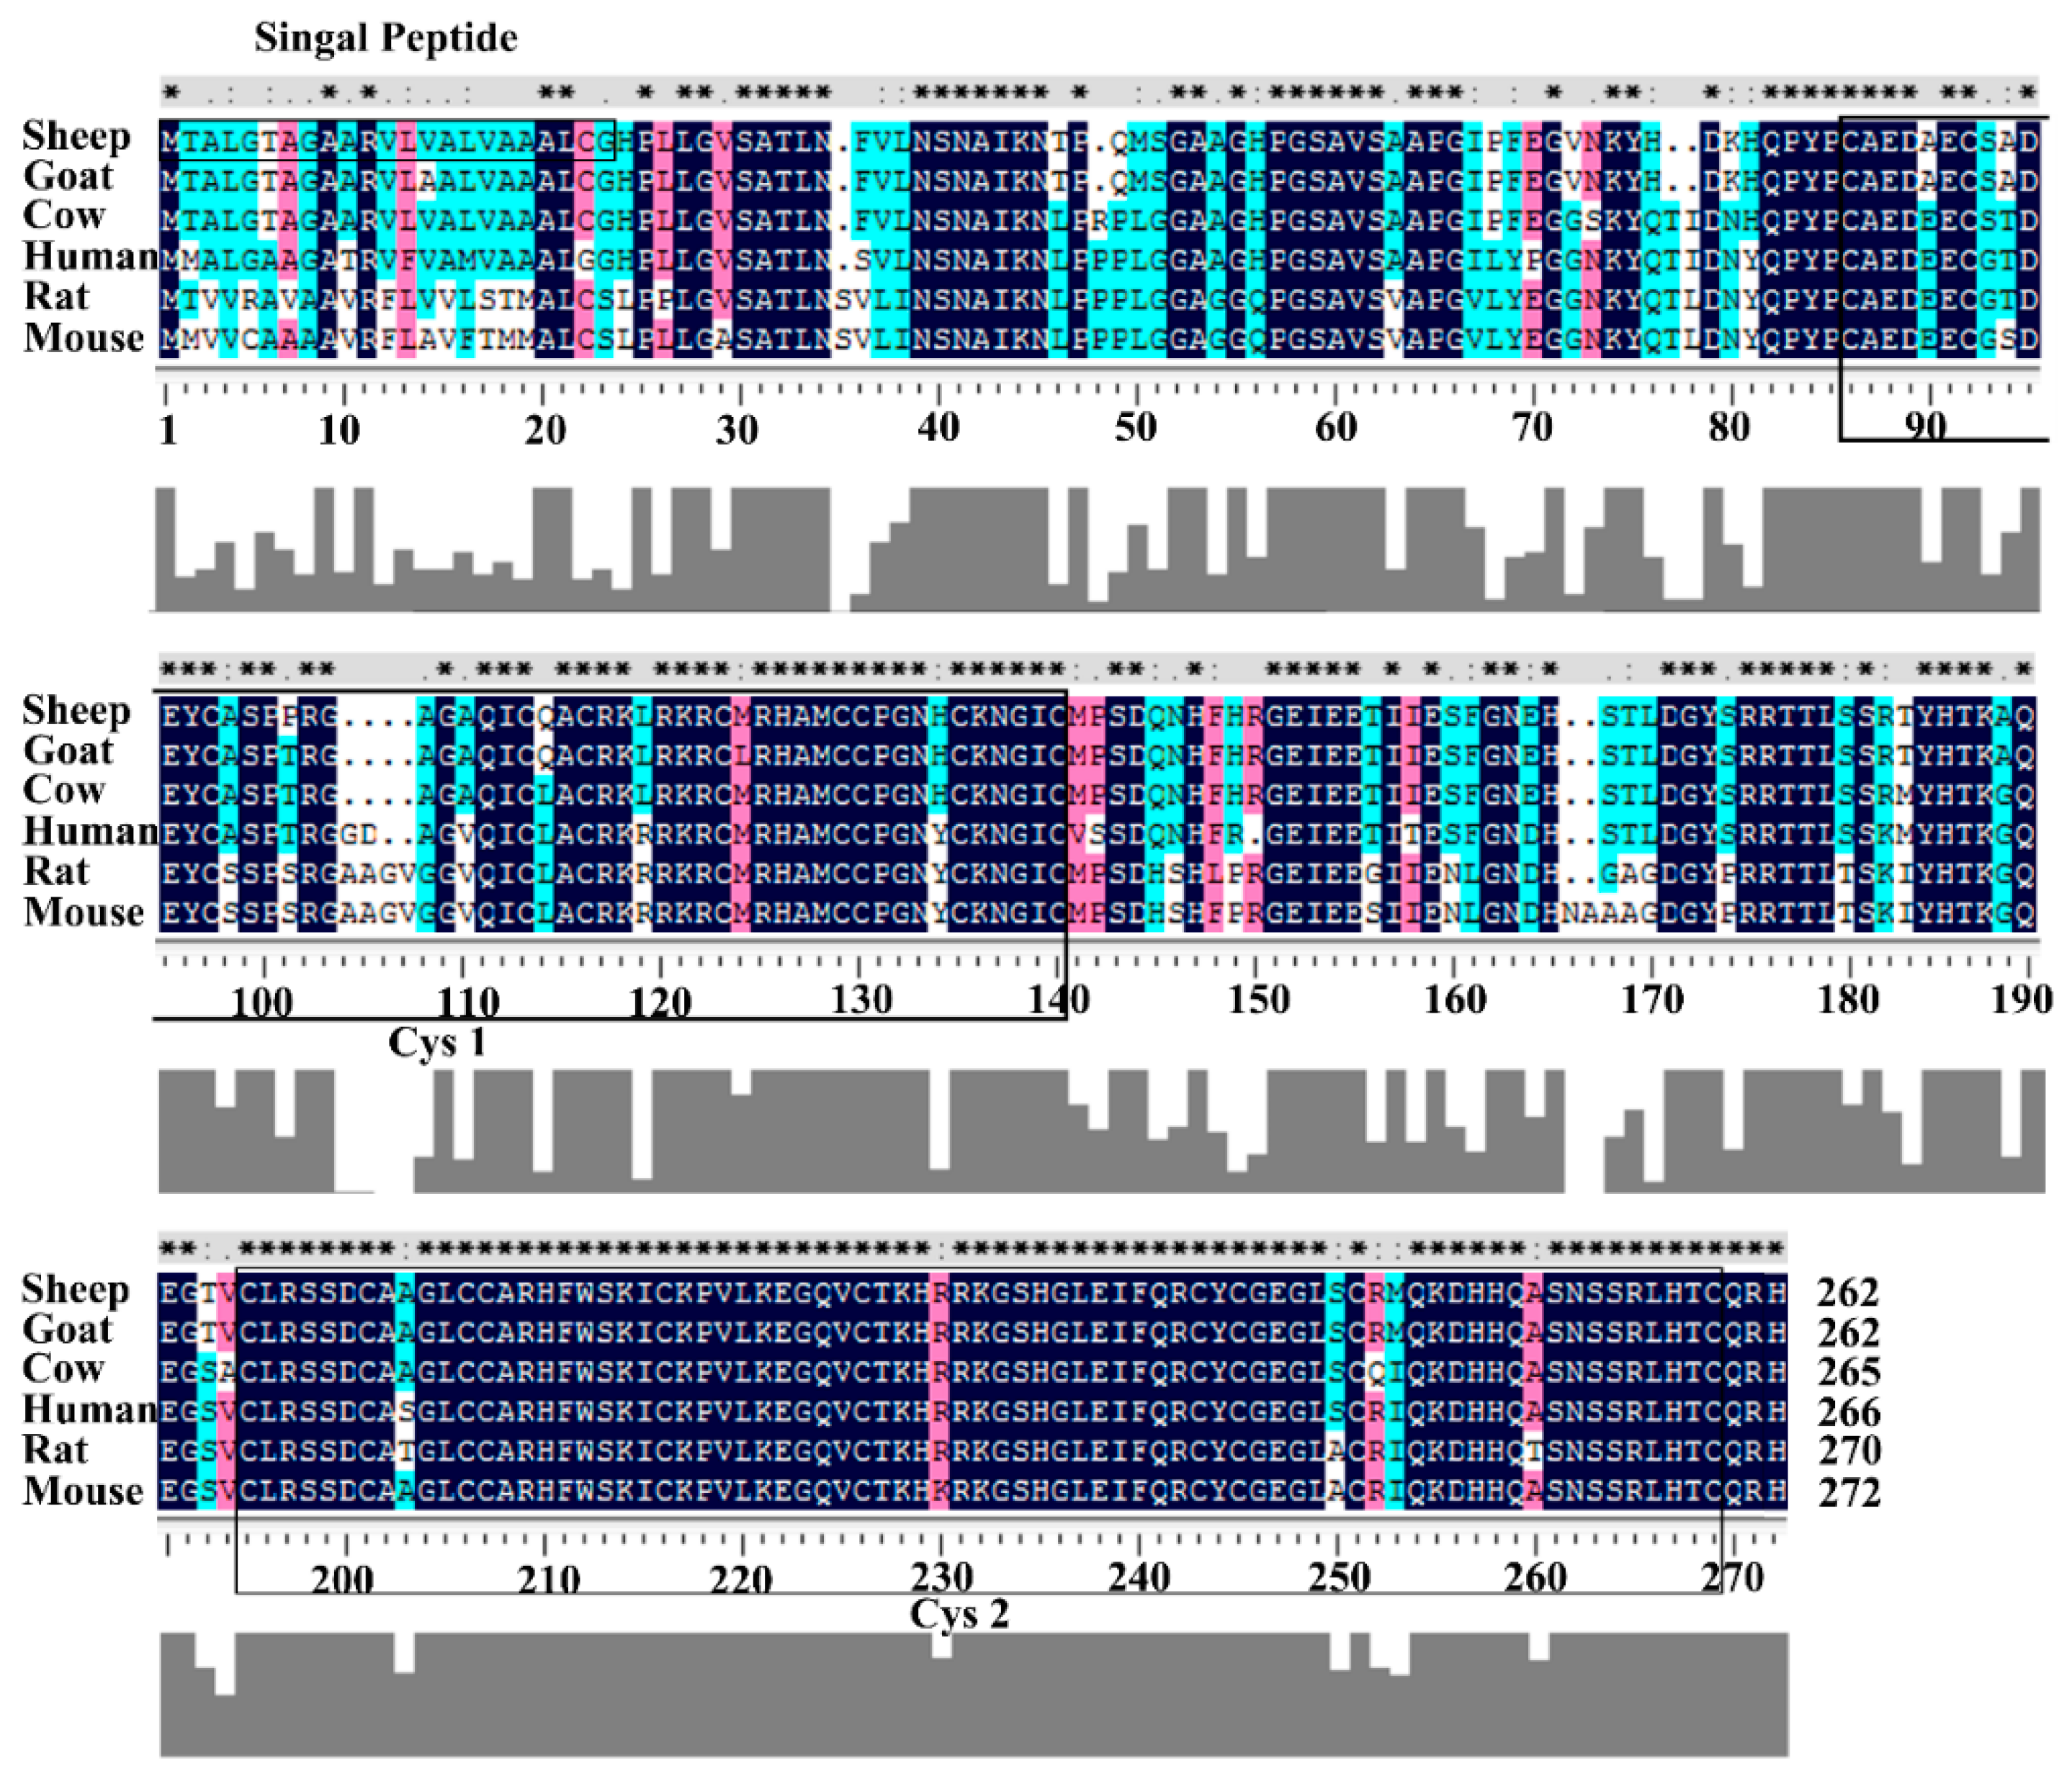
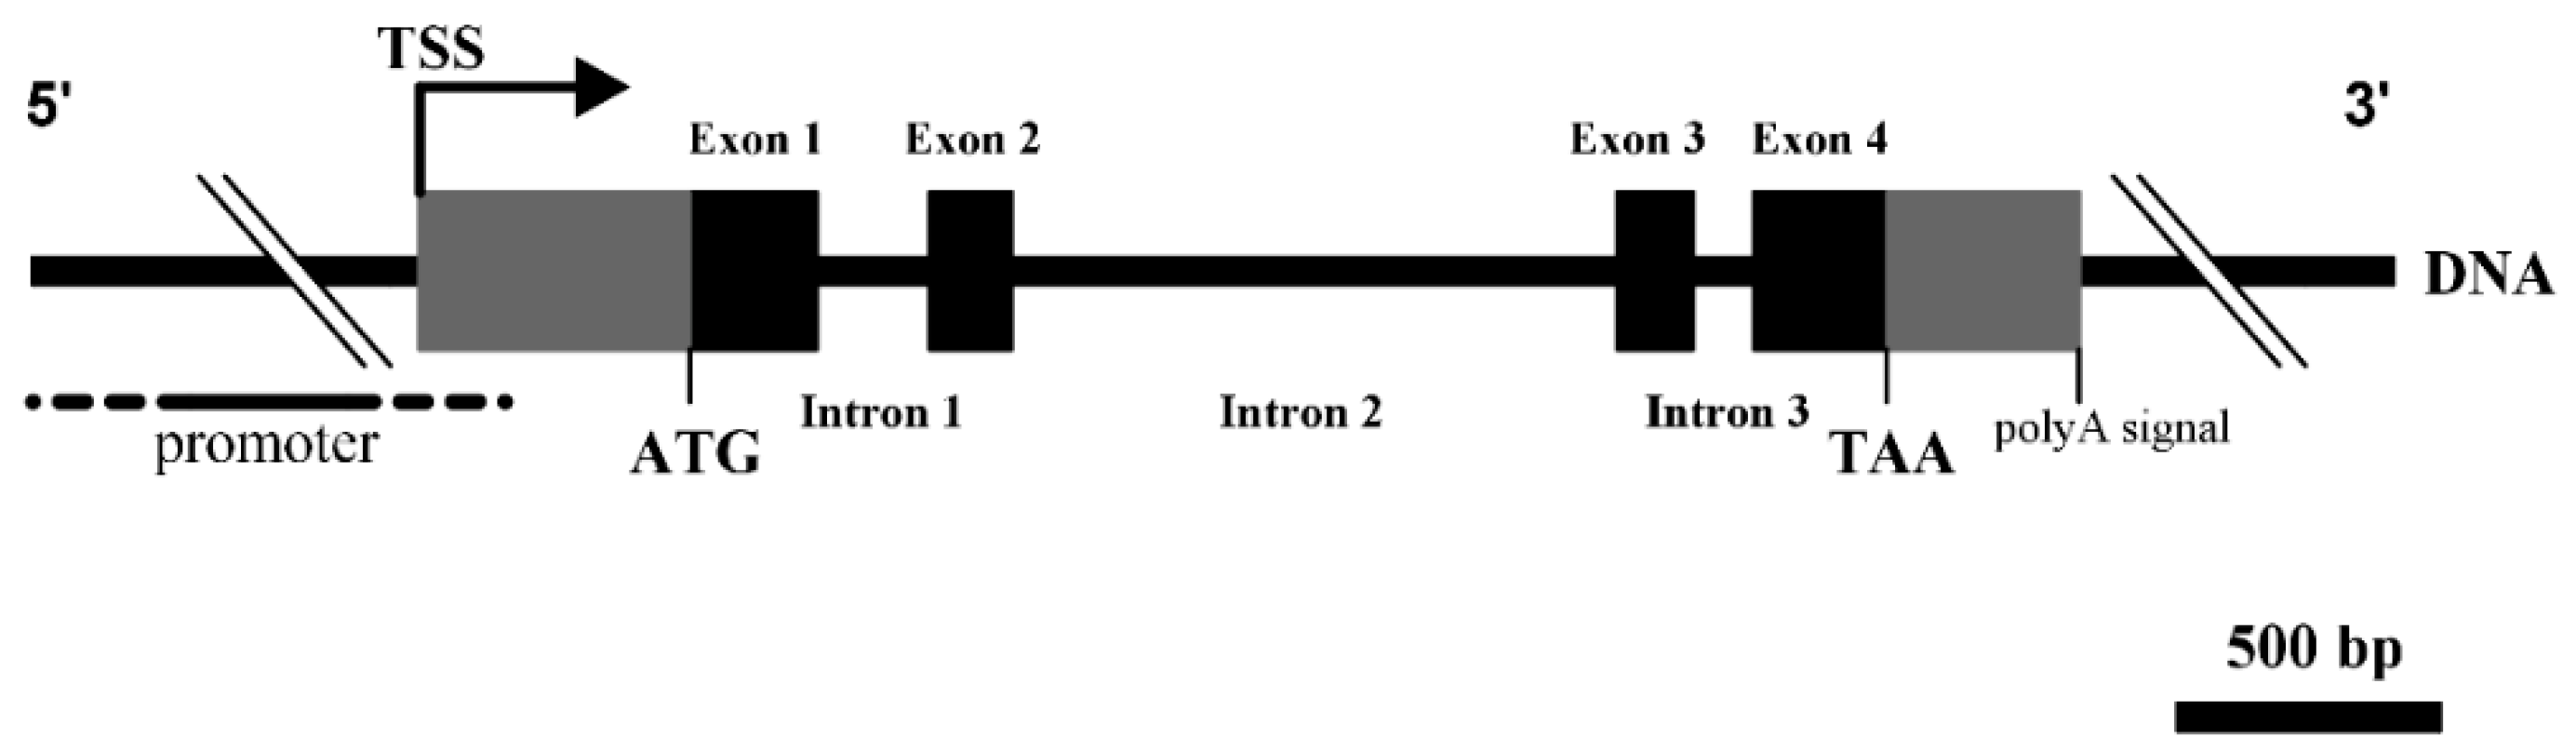
3.1. Structural Characterization of Ovine DKK1

To investigate the potential involvement of the DKK1 in wool production and quality traits in Chinese Merino sheep, we first determined the full-length coding sequence and genomic structure of ovine DKK1. The cDNA sequence of ovine DKK1 was amplified by Real Time PCR (RT-PCR) from the pooled total RNA of liver, testis and kidney using the primer pair (DKK1-F1 and DKK1-R1) (Table 1). Sequencing results showed that the amplified DKK1 cDNA fragment is 955 bp long. Further sequence analysis showed that this fragment contained the full-length coding region sequence (789 bp) of ovine DKK1 which encodes a protein of 262 amino acids. The entire coding sequence of DKK1 of Chinese Merino shared 100% nucleotide sequence identity with the recently published Texel sheep DKK1 mRNA sequence (GenBank accession No. XM_012138945.2). The coding sequence of the ovine DKK1 showed 98.10%, 93.61% and 83.96% nucleotide identity with those of caprine, bovine and human DKK1, respectively. The DKK1 deduced amino acid sequence alignment and protein domain analysis are shown in Figure 1. Analysis of the deduced amino acid sequence of ovine DKK1 using SignalP3.0 (http://www.cbs.dtu.dk/services/SignalP) identified a potential signal peptide sequence at its amino terminus positions 1–23, consistent with its role as a secreted protein. The conserved domain analysis showed that ovine DKK1 protein contained an N-terminal cysteine-rich domain and a C-terminal cysteine-rich domain at amino acid positions 87–136 and 188–252 respectively. These two cysteine-rich domains were conserved in six different animal species analyzed. The deduced ovine DKK1 protein showed high sequence similarity to caprine (98.85%), bovine (92.08%) and human (83.90%) DKK1 proteins (Table S2). The phylogenetic analysis based on amino acid sequence of DKK1 protein showed that that Merino sheep was closely clustered with goat and cattle while Human, Chimpanzee and Rhesus monkey formed another closely related group. In contrast, the Atlantic salmon was a distinct group compared with other species (Figure 2).
The genomic sequence of ovine DKK1 was amplified by PCR from the gDNA of Chinese Merino sheep using five different pairs of primer (Table 1) covering the entire DKK1 genomic sequence. The five primer pairs generated five different sized PCR products: 1771 bp (chr22:6668693-6670458), 1107 bp (chr22:6667603-6668709), 2100 bp (chr22:6665566-6667623), 407 bp (chr22:6665250-6665656) and 1966 bp (chr22:6663304-6665269. All PCR products were sequenced and assembled into the ovine DKK1 genomic sequence. The acquired ovine DKK1 genomic sequence was 7326 bp in length and has been deposited in GenBank (accession No. JQ348893).
Alignment of the acquired Merino DKK1 genomic sequence and its cDNA sequence revealed that Merino DKK1 is composed of three introns and four exons (Figure 3). The consensus sequences at the exon/intron boundaries were identified and all the boundaries conformed to the GT–AG rule. A putative polyA signal sequence (AATAAA), was found at 361 to 366 bp downstream of the termination codon (TAA). Sequence alignment analysis showed that our acquired Merino DKK1 genomic sequence displayed high similarity to the recently published Texel sheep DKK1 genomic sequence (GenBank accession No. NC_019479) (97.59%) and bovine DKK1 genomic sequence (94.38%). Comparison of the Texel sheep and Merino DKK1 genomic sequence showed that Merino DKK1 genomic region had a 5 bp insertion in its 5′ flanking region and a 105 bp deletion in 3′ flanking region. Comparison of the ovine and caprine DKK1 genomic structure showed that ovine and caprine DKK1 shared the same numbers and sizes of exons and introns and their exon and intron sequences were highly similar to each other. The DKK1 genomic sequence from the start codon ATG to the terminal codon TAA was 95.77% similar between sheep and goat.

3.2. Bioinformatics Analysis of Ovine DKK1 Promoter

Alignment of the acquired ovine DKK1 genomic sequence (GenBank accession No. JQ348893) and its cDNA sequence (GenBank accession No. XM_012138945.2) identified a 2752 bp genomic sequence upstream of the initiation start codon (ATG) of ovine DKK1. To gain insight into the transcriptional regulation of ovine DKK1, we analyzed this 2752 bp upstream genomic sequence by using promoter prediction software Promoter SCAN (http://www-bimas.cit.nih.gov/molbio/proscan/) and Mulan (https://mulan.dcode.org/). The Promoter SCAN analysis showed that the transcriptional initiation site of ovine DKK1 was at an A residue 515 bp (−515 bp) upstream of the initiation start codon (ATG), its promoter contained a canonical TATA box and a GC box at nucleotide −23 to −30 and −108 to −95 relative to its predicted transcriptional initiation site as revealed by using Promoter SCAN and Mulan software respectively. The TATA box and GC box were conserved in ovine, bovine and caprine DKK1 promoters. Sequence alignment of the 2752 bp genomic sequence and caprine genomic sequence (GenBank accession No. GQ480837) identified a 251 bp sequence containing 94.27% nucleotide identity. This conserved 251 bp region was located at nucleotides −263 to −13 relative to the predicted transcriptional initiation site of ovine DKK1. A number of binding sites for transcription factors including RAR-related orphan receptor A isoform 1 (RORA1), signal transducers and activators of transcription 1 (STAT1), OCT4 (also called POU domain, class 5, transcription factor-1) were predicted at this conserved region, further analysis showed that RORA1, STAT1 and OCT4 binding sites were conserved among sheep, goat, cattle, pig, chimpanzee, human, rhesus monkey, rabbit, house mouse and Norway rat DKKl promoters. In addition, Mulan program predicted a conserved p53 binding sites in sheep, cattle, rabbit and mouse DKK1 promoters; and one conserved TCF/LEF binding site in sheep, cattle, pig, human, rhesus monkey, rabbit, house mouse and Norway rat DKK1 promoters; and nine SP1 in sheep and cattle DKK1 promoters. The high degree of conservation of these transcription factor binding sites in DKK1 promoters between these different animals indicates that the transcriptional regulation of DKK1 may be similar in these animals.

3.3. Identification of SNP in DKK1

By PCR and sequencing, we detected SNPs in the DKK1 genomic region from the pooled gDNA sample. A total of 11 SNPs were identified and named as SNPs1 to 11. The detailed SNP information is summarized in Table 2. Of these 11 SNPs, SNPs1 to 5 were located in intron 2, SNP6 in intron 3, SNP7 in exon 4 which is a silent mutation, SNPs8 and 9 in the 3' UTR and SNPs10 and 11 in the 3′ flanking region of ovine DKK1 (Table 2).

3.4. Allele, Genotype and Haplotype Frequencies of Ovine DKK1

A total of 743 individuals of the six Chinese Merino strains (SF, PW, PM, A, B and U) were genotyped for the 11 identified SNPs using the SBE assay. For SNPs1 to 8, the frequency of the alleles (G of SNP1, C of SNP2, D of SNP3, G of SNP4, G of SNP5, G of SNP6, G of SNP7 and T of SNP8) is predominantly higher than that of the alternative alleles (A of SNP1, A of SNP2, I of SNP3, C of SNP4, T of SNP5, A of SNP6, A of SNP7 and C of SNP8) in all 6 tested Chinese Merino strains (Table S3). The minor allele frequency of these 11 identified SNPs varied from 15.9% to 49.0% and the SNP1 and SNPs6 to 9 were in Hardy-Weinberg equilibrium (Table 2; p > 0.05). The frequencies of the alleles and genotypes are shown in Table S3. The χ2 test results showed that the allele frequencies for these 11 identified SNPs were significantly different among the six strains studied (p < 0.01). Among three genotypes of these 11 identified SNPs in six Chinese Merino sheep strains, only the heterozygous genotype TC of SNP11 was not identified in the U strain. There were 12 haplotypes based on the identified SNPs in all tested individuals. The haplotype frequencies of Ovine DKK1 differed among the Merino strains tested (Table S4).

3.5. Phenotypic and Genetic Correlations of the Wool Production and Quality Traits

Phenotypic and Genetic correlation coefficients were calculated for each tested trait. The results showed that in our studied population, there were moderate negative phenotypic correlations between curvature and MFD and FDSD (−0.41 for both) (Table S5; p < 0.05) and low negative phenotypic correlations between curvature and CVFD, WFL (−0.21 and −0.20, respectively) (Table S5). There was high positive phenotypic correlation between CVFD and FDSD (0.78), moderate positive phenotypic correlation between MFD and FDSD (0.57) (Table S5; p < 0.05) and low positive phenotypic correlation between WFL and FW (0.27) (Table S5; p < 0.05).
Genetic correlations between the traits ranged from −0.79 for curvature-MFD to 0.83 for MFD-FDSD (Table S5). There were high negative genetic correlations between curvature and MFD and FDSD (−0.79 for both) and moderate negative genetic correlation between curvature and CVFD (−0.43) (Table S5). There were high positive genetic correlations between MFD and FDSD (0.83), between WFL and FW (0.70) and between CVFD and FDSD (0.73) (Table S5; p < 0.01) and low positive genetic correlations between CVFD and MFD, FL (0.27 for both).

3.6. Association of the Identified SNPs with Wool Production and Quality in Sheep

Association analysis using JMP 7.0 (SAS Inst. Inc.) showed that, of these 11 identified SNPs, SNP5 was significantly associated with MFD in B, PW and U strains (Table 3; p < 4.55 × 10−3 = 0.05/11). The Genotype GT of SNP5 was significantly associated with lower MFD than genotype GG in B and U strains and the Genotype GG of SNP5 was significantly associated with lower MFD than genotype GT in PW strains. (Table 3; p < 4.55 × 10−3 = 0.05/11). SNP-wide association analysis showed that SNP8 was markedly associated with MFD in A strain and it was also associated with FW in A, PM and SF strains (Table 3; p < 0.05). The Genotype CC of SNP8 was significantly associated with lower MFD and higher FW compared to genotypes TC and TT in A strain (Table 3; p < 0.05). The Genotype CC of SNP8 was significantly associated with higher FW than genotype TT in PM strain and the Genotype TT of SNP 8 was significantly associated with higher FW than genotype TC in SF strain. SNP9 was significantly associated with curvature in B and U strains (Table 3; p < 0.05). The Genotype TC of SNP9 was significantly associated with lower curvature than genotype CC in B strain; and the Genotype TT of SNP9 was significantly associated with lower curvature than genotype CC in U strain. SNP10 was significantly associated with CVFD in A, PW and PM strains and FDSD in A and PM strains (Table 3; p < 0.05). The Genotype TT of SNP10 was significantly associated with lower CVFD than genotype CC in A and PW strains and the Genotype TC of SNP10 was significantly associated with lower CVFD than genotype CC in PM strain. In contrast, SNPs1 to 4, 6, 7, 11 were not found to be associated with the wool production and quality traits in the tested Chinese Merino (Table 3; p > 0.05).

3.7. Association of DKK1 Haplotypes with Wool Quality Traits

We also performed the haplotype association analysis using the same model used for the SNP association analysis. There was a total of 12 haplotypes based on the identified SNPs in all tested individuals. Among these haplotypes, haplotype H5 (27.2%) had the highest proportion. The haplotype association analysis results are summarized in Table 4. Sheep with haplotype H2 had a significantly lower MFD than the sheep with haplotype H5 in B strain. Sheep with haplotype H1 had a significantly lower MFD than the sheep with either haplotype H2 in PW strain or haplotype H5 in PM strain (Table 4; p < 0.05).

4. Discussion

In the present study, we characterized the full-length coding sequence and genomic structure of ovine DKK1 and identified a total of 11 SNPs. The association analysis showed that DKK1 polymorphisms were associated with MFD, FDSD, CVFD, FW and curvature in the tested population (p < 0.05).
The ovine DKK1 genomic structure was found to be identical to that of another mammalian DKK1. The nucleotide and amino acid sequence analysis revealed that DKK1 gene was conserved in mammals. Protein domain analysis showed that the C-terminal cysteine-rich region was conserved in mammalian DKK1 homologs, suggesting that the conserved C-terminal cysteine-rich region is essential for the function of DKK1. It has been reported that the C-terminal cysteine-rich region of DKK1 is involved in binding to low-density lipoprotein receptor-related proteins (LRPs), which act as Wnt coreceptors and inhibits Wnt signaling [31].
The promoter analysis revealed that a GC box and a canonical TATA box were present upstream of ovine DKK1, suggesting ovine DKK1 promoter is a classical promoter. In addition, we observed multiple conserved transcription factor binding sites (RORA1, STAT1, POU5F1, TCF/LEF1, p53 and SP1) in the ovine DKK1 promoter region. Consistently, it has been reported that TCF/LEF-1 [32], p53 [33] and SP1 [34] transcriptionally regulate human DKK1. Determining whether these transcription factors directly regulate ovine DKK1 would lead to a better understanding of the role of ovine DKK1 in hair follicle morphogenesis, cycling and wool production.
In the present study, a total of 11 SNPs were identified in ovine DKK1 genomic region. From these 11 identified SNPs, six SNPs (SNPs2 to 5, 10, 11) were not in the Hardy-Weinberg equilibrium, which may be explained by the following reasons: (1) the alleles may be the predominant alleles during genetic evolution, thus being more conserved and more common than other alleles in this population [35]; (2) The number of sheep examined in each strain was not large enough that genetic drift makes a significant force [36]; (3) The alleles may be tightly linked with an advantageous allele; (4) The economically favorable traits were artificially selected [35].
The positive genetic correlations of MFD with WFL were consistent with the previous studies [37,38], although the genetic correlations were lower than those reported in the previous Merino studies. The previous Merino studies showed that the average genetic correlations of MFD-WFL were 0.19 and 0.29 [33,34]. In Targhee sheep, the genetic correlation of MFD-WFL was 0.30 [39]. The genetic correlation of MFD–FDSD (0.83) in our tested population was higher than that reported by Safari et al. in Merino study [40]. The genetic correlation between FDSD and FDCV (0.73) in this study agreed with the estimated value of 0.76 by Safari et al. [33] but the genetic correlation between MFD and FDCV (0.27) disagreed with the estimate value of −0.16 by Safari et al. [37]. This discrepancy may be due to the differences in sheep age and gender, genetic background and environment.
Our association analysis showed SNPs (SNPs 5, 8, 9 and 10) were significantly associated with wool quality traits in several Chinese Merino strains. The improvement of wool production and quality traits such as MFD, FDSD, CVFD, is one of the important goals in sheep breeding programs. We presume that the beneficial alleles of these four identified SNPs might be used for genetic improvement of wool quality traits in Chinese Merino population, which need to be verified in large sheep populations. Wnt pathway plays an important role in hair follicle morphogenesis and cycling [41,42]. DKK1 has been shown to be associated with hair follicle development [14,43]. Wool is the product of hair follicles, the hair follicle size, cycle and density affect hair or wool length, diameter, etc. [15,16,17]. Consistent with this view, our association analysis indicated that four DKK1 SNPs (SNPs5, 8, 9 and 10) were associated with MFD, curvature, FDSD, CVFD and FW in several of our tested strains.
From the four DKK1 SNPs (SNPs5, 8, 9 and 10) associated with wool quality traits, SNP5 was located in intron 2, SNP8 and SNP9 were located in the DKK1 3′ UTR, while SNP10 was located in the 3′ flanking region. It has been demonstrated that some SNPs, which are located in introns, 3′ UTR and flanking regions, can affect gene expression [44,45,46,47,48,49,50,51]. We cannot exclude the possibility that these four identified SNPs (SNPs5, 8, 9 and 10) are functional and affect DKK1 expression, causing changes in wool production and quality traits. It is worthwhile to further explore whether these SNPs affect DKK1 expression in the future.

5. Conclusions

In the present study, we cloned DKK1 genomic and coding sequences of Merino sheep, an old and influential wool sheep which produce the finest and softest wool. Our results added new insight into ovine DKK1 structure and the identified SNPs might be used as genetic molecular marker for genetic improvement of wool sheep.

Supplementary Materials

The following are available online at www.mdpi.com/2073-4425/8/12/400/s1. Table S1: Information for DKK1 from 16 different animal species, Table S2: The similarities of the deduced amino acids sequence of DKK1 protein in 16 different animal species, Table S3: Genotype and allele frequencies of the SNPs of DKK1 in Chinese Merino, Table S4: Haplotype frequencies of DKK1 in Chinese Merino, Table S5: Genetic (below diagonal) and phenotypic correlation (above diagonal) coefficient between wool production and quality traits, Table S6: A summary of the raw data (phenotypes), Table S7: the least square means of the line effects of SNP in DKK1, Table S8: The allele substitution effect of DKK1 on wool production and quality traits in Chinese Merino, Figure S1: The corresponding quantile–quantile (Q–Q) plots for the association of SNPs of DKK1.

Acknowledgments

This study was supported by Domain-Specific projects for transgenic biological breeding (2014ZX08009-002 and 2009ZX08009-160B).

Author Contributions

Fang Mu, Enguang Rong, Hui Li and Ning Wang conceived and designed the project. Fang Mu, Enguang Rong, Yang Jing, Hua Yang, Yumao Li and Guangwei Ma performed the experiments. Fang Mu, Xiaohong Yan and Zhipeng Wang analyzed the data. Fang Mu, Yang Jing, Hui Li and Ning Wang wrote the manuscript. All authors reviewed and commented on the manuscript.

Conflicts of Interest

The authors declare no conflict of interest.

References

  1. Ling, Y.H.; Xiang, H.; Zhang, G.; Ding, J.P.; Zhang, Z.J.; Zhang, Y.H.; Han, J.L.; Ma, Y.H.; Zhang, X.R. Identification of complete linkage disequilibrium in the DSG4 gene and its association with wool length and crimp in Chinese indigenous sheep. Genet. Mol. Res. 2014, 13, 5617–5625. [Google Scholar] [CrossRef] [PubMed]
  2. Forrest, R.H.; Itenge-Mweza, T.O.; Mckenzie, G.W.; Zhou, H.; Frampton, C.M.; Hickford, J.G.H. Polymorphism of the ovine β3-adrenergic receptor gene (ADRB3) and its association with wool mean staple strength and yield. Anim. Genet. 2009, 40, 958–962. [Google Scholar] [CrossRef] [PubMed]
  3. Glinka, A.; Wu, W.; Delius, H.; Monaghan, A.P.; Blumenstock, C.; Niehrs, C. Dickkopf-1 is a member of a new family of secreted proteins and functions in head induction. Nature 1998, 391, 357–362. [Google Scholar] [CrossRef] [PubMed]
  4. Nusse, R.; Varmus, H.E. Many tumors induced by the mouse mammary tumor virus contain a provirus integrated in the same region of the host genome. Cell 1982, 31, 99–109. [Google Scholar] [CrossRef]
  5. Clevers, H. Wnt/β-catenin signaling in development and disease. Cell 2006, 127, 469–480. [Google Scholar] [CrossRef] [PubMed]
  6. Libro, R.; Bramanti, P.; Mazzon, E. The role of the Wnt canonical signaling in neurodegenerative diseases. Life Sci. 2016, 158, 78–88. [Google Scholar] [CrossRef] [PubMed]
  7. Andl, T.; Reddy, S.T.; Gaddapara, T.; Millar, S.E. WNT signals are required for the initiation of hair follicle development. Dev. Cell 2002, 2, 643–653. [Google Scholar] [CrossRef]
  8. Kandyba, E.; Kobielak, K. Wnt7b is an important intrinsic regulator of hair follicle stem cell homeostasis and hair follicle cycling. Stem Cells 2014, 32, 886–901. [Google Scholar] [CrossRef] [PubMed]
  9. Choi, Y.S.; Zhang, Y.; Xu, M.; Yang, Y.; Ito, M.; Peng, T.; Cui, Z.; Nagy, A.; Hadjantonakis, A.K.; Lang, R.A.; et al. Distinct functions for Wnt/β-catenin in hair follicle stem cell proliferation and survival and interfollicular epidermal homeostasis. Cell Stem Cell 2013, 13, 720–733. [Google Scholar] [CrossRef] [PubMed]
  10. Sick, S.; Reinker, S.; Timmer, J.; Schlake, T. WNT and DKK determine hair follicle spacing through a reaction-diffusion mechanism. Science 2006, 314, 1447–1450. [Google Scholar] [CrossRef] [PubMed]
  11. Becker, M.R.; Choi, Y.S.; Millar, S.E.; Udey, M.C. Wnt signaling influences the development of murine epidermal langerhans cells. J. Investig. Dermatol. 2011, 131, 1861–1868. [Google Scholar] [CrossRef] [PubMed]
  12. Lei, M.; Guo, H.; Qiu, W.; Lai, X.; Yang, T.; Widelitz, R.B.; Chuong, C.M.; Lian, X.; Yang, L. Modulating hair follicle size with Wnt10b/DKK1 during hair regeneration. Exp. Dermatol. 2014, 23, 407–413. [Google Scholar] [CrossRef] [PubMed]
  13. Kwack, M.H.; Kim, M.K.; Kim, J.C.; Sung, Y.K. Dickkopf 1 promotes regression of hair follicles. J. Investig. Dermatol. 2012, 132, 1554–1560. [Google Scholar] [CrossRef] [PubMed]
  14. Kim, B.K.; Lee, H.Y.; Kim, I.; Choi, K.; Park, J.; Yoon, S.K. Increased expression of Dkk1 by HR is associated with alteration of hair cycle in hairpoor mice. J. Dermatol. Sci. 2014, 74, 81–87. [Google Scholar] [CrossRef] [PubMed]
  15. Müller-Röver, S.; Handjiski, B.; van der Veen, C.; Eichmüller, S.; Foitzik, K.; Mckay, I.A.; Stenn, K.S.; Paus, R. A comprehensive guide for the accurate classification of murine hair follicles in distinct hair cycle stages. J. Investig. Dermatol. 2001, 117, 3–15. [Google Scholar] [CrossRef] [PubMed]
  16. Alonso, L.; Fuchs, E. The hair cycle. J. Cell Sci. 2006, 119, 391–393. [Google Scholar] [CrossRef] [PubMed]
  17. Krause, K.; Foitzik, K. Biology of the hair follicle: The basics. Semin. Cutan. Med. Surg. 2006, 25, 2–10. [Google Scholar] [CrossRef] [PubMed]
  18. Shi, G.Q.; Yang, Y.L.; Jian-Hong, N.I.; Wan, P.C.; Dai, R.; Zhou, P.; Zhang, Y.S.; Bai, D.P. Breeding of a new China merino strain with super-fine wool. Grass-Feed. Livest. 2010, 2, 1–7. [Google Scholar]
  19. National Research Council. Guide for the Care and Use of Laboratory Animals; National Academies Press: Washington, DC, USA, 2010. [Google Scholar]
  20. McGregor, B. Comparative productivity and grazing behaviour of Huacaya alpacas and Peppin Merino sheep grazed on annual pastures. Small Rumin. Res. 2002, 44, 219–232. [Google Scholar] [CrossRef]
  21. Sambrook, J.; Russell, D.W. Purification of nucleic acids by extraction with phenol: Chloroform. Cold Spring Harb. Protoc. 2006, 2006. [Google Scholar] [CrossRef]
  22. Chun, J. Computer Assisted Classification and Identification of Actinomycetes. Ph.D. Thesis, University of Newcastle upon Tyne, Newcastle upon Tyne, UK, 1995. [Google Scholar]
  23. Kimura, M. A simple method for estimating evolutionary rates of base substitutions through comparative studies of nucleotide sequences. J. Mol. Evol. 1980, 16, 111–120. [Google Scholar] [CrossRef] [PubMed]
  24. Rong, E.G.; Yang, H.; Zhang, Z.W.; Wang, Z.P.; Yan, X.H.; Li, H.; Wang, N. Association of methionine synthase gene polymorphisms with wool production and quality traits in Chinese Merino population. J. Anim. Sci. 2015, 93, 4601–4609. [Google Scholar] [CrossRef] [PubMed]
  25. Mukhopadhyay, A.; Acharya, M.; Mukherjee, S.; Ray, J.; Choudhury, S.; Khan, M.; Ray, K. Mutations in MYOC gene of Indian primary open angle glaucoma patients. Mol. Vis. 2002, 8, 442–448. [Google Scholar] [PubMed]
  26. Thomas, R.K.; Baker, A.C.; Debiasi, R.M.; Winckler, W.; Laframboise, T.; Lin, W.M.; Wang, M.; Feng, W.; Zander, T.; MacConaill, L.; et al. High-throughput oncogene mutation profiling in human cancer. Nat. Genet. 2007, 39, 347–351. [Google Scholar] [CrossRef] [PubMed]
  27. Gabriel, S.; Ziaugra, L.; Tabbaa, D. SNP genotyping using the Sequenom MassARRAY iPLEX platform. Curr. Protoc. Hum. Genet. 2009, 60, 2.12.1–2.12.18. [Google Scholar]
  28. Gilmour, A.; Gogel, B.; Cullis, B.; Thompson, R. ASReml User Guide Release 2.0; VSN International Ltd.: Hemel Hempstead, UK, 2006. [Google Scholar]
  29. Falconer, D.S.; Mackay, T.F.C. Introduction to quantitative genetics. Q. Rev. Biol. 1996, 49, 223–226. [Google Scholar]
  30. Buchanan, J.W.; Reecy, J.M.; Garrick, D.J.; Duan, Q.; Beitz, D.C.; Mateescu, R.G. Genetic parameters and genetic correlations among triacylglycerol and phospholipid fractions in Angus cattle. J. Anim. Sci. 2015, 93, 522–528. [Google Scholar] [CrossRef] [PubMed]
  31. Brott, B.K.; Sokol, S.Y. Regulation of Wnt/LRP signaling by distinct domains of Dickkopf proteins. Mol. Cell. Biol. 2002, 22, 6100–6110. [Google Scholar] [CrossRef] [PubMed]
  32. Chamorro, M.N.; Schwartz, D.R.; Vonica, A.; Brivanlou, A.H.; Cho, K.R.; Varmus, H.E. FGF-20 and DKK1 are transcriptional targets of β-catenin and FGF-20 is implicated in cancer and development. EMBO J. 2005, 24, 73–84. [Google Scholar] [CrossRef] [PubMed]
  33. Wang, J.; Shou, J.; Chen, X. Dickkopf-1, an inhibitor of the Wnt signaling pathway, is induced by p53. Oncogene 2000, 19, 1843–1848. [Google Scholar] [CrossRef] [PubMed]
  34. Peng, H.; Li, Y.; Liu, Y.; Zhang, J.; Chen, K.; Huang, A.; Tang, H. HBx and SP1 upregulate DKK1 expression. Acta Biochim. Pol. 2017, 64, 35–39. [Google Scholar] [CrossRef] [PubMed]
  35. Qin, N.; Liu, Q.; Zhang, Y.Y.; Fan, X.C.; Xu, X.X.; Lv, Z.C.; Wei, M.L.; Jing, Y.; Mu, F.; Xu, R.F. Association of novel polymorphisms of forkhead box L2 and growth differentiation factor-9 genes with egg production traits in local Chinese Dagu hens. Poult. Sci. 2015, 94, 88–95. [Google Scholar] [CrossRef] [PubMed]
  36. Zhang, Y.R.; Li, Y.K.; Fu, C.Z.; Wang, J.L.; Wang, H.B.; Zan, L.S. Effects of bovine SMO gene polymorphisms on the body measurement and meat quality traits of Qinchuan cattle. Genet. Mol. Res. 2014, 13, 8105–8117. [Google Scholar] [CrossRef] [PubMed]
  37. Safari, E.; Fogarty, N.M.; Gilmour, A.R. A review of genetic parameter estimates for wool, growth, meat and reproduction traits in sheep. Livest. Prod. Sci. 2005, 92, 271–289. [Google Scholar] [CrossRef]
  38. Di, J.; Zhang, Y.; Tian, K.C.; Lazate; Liu, J.F.; Xu, X.M.; Zhang, Y.J.; Zhang, T.H. Estimation of (co)variance components and genetic parameters for growth and wool traits of Chinese superfine merino sheep with the use of a multi-trait animal model. Livest. Sci. 2011, 138, 278–288. [Google Scholar] [CrossRef]
  39. Notter, D.; Kuehn, L.; Kott, R. Genetic analysis of fibre characteristics in adult Targhee ewes and their relationship to breeding value estimates derived from yearling fleeces. Small Rumin. Res. 2007, 67, 164–172. [Google Scholar] [CrossRef]
  40. Safari, E.; Fogarty, N.; Gilmour, A.R.; Atkins, K.; Mortimer, S.; Swan, A.; Brien, F.; Greeff, J.; Van Der Werf, J. Genetic correlations among and between wool, growth and reproduction traits in Merino sheep. J. Anim. Breed. Genet. 2007, 124, 65–72. [Google Scholar] [CrossRef] [PubMed]
  41. Liu, G.; Liu, R.; Li, Q.; Tang, X.; Yu, M.; Li, X.; Cao, J.; Zhao, S. Identification of microRNAs in wool follicles during anagen, catagen and telogen phases in Tibetan sheep. PLoS ONE 2013, 8, e77801. [Google Scholar] [CrossRef] [PubMed]
  42. Cui, K.; Yang, Z.; Darwish, H.; Zhang, Y.; Ge, Y.; Zhang, X.; Li, R.; Deng, X. Molecular cloning and characterization of the β-catenin gene from fine-wool sheep. Gene 2014, 546, 277–282. [Google Scholar] [CrossRef] [PubMed]
  43. Kawano, Y.; Kypta, R. Secreted antagonists of the Wnt signalling pathway. J. Cell Sci. 2003, 116, 2627–2634. [Google Scholar] [CrossRef] [PubMed]
  44. Sano, R.; Nakajima, T.; Takahashi, K.; Kubo, R.; Yazawa, S.; Kominato, Y. The 3′ flanking region of the human ABO histo-blood group gene is involved in negative regulation of gene expression. Legal Med. 2011, 13, 22–29. [Google Scholar] [CrossRef] [PubMed]
  45. Mizuta, I.; Takafuji, K.; Ando, Y.; Satake, W.; Kanagawa, M.; Kobayashi, K.; Nagamori, S.; Shinohara, T.; Ito, C.; Yamamoto, M. YY1 binds to α-synuclein 3′-flanking region SNP and stimulates antisense noncoding RNA expression. J. Hum. Genet. 2013, 58, 711–719. [Google Scholar] [CrossRef] [PubMed]
  46. Maiti, G.P.; Ghosh, A.; Mondal, P.; Baral, A.; Datta, S.; Samadder, S.; Nayak, S.P.; Chakrabarti, J.; Biswas, J.; Sikdar, N. The SNP rs1049430 in the 3′-1 UTR of SH3GL2 regulates its expression: Clinical and 2 prognostic implications in head and neck squamous cell carcinoma. Biochim. Biophys. Acta 2015, 1852, 1059–1067. [Google Scholar] [CrossRef] [PubMed]
  47. Fan, Y.; Qian, X.; Zhang, C. U/G SNP rs111904020 in 3′ UTR of STAT3 regulated by miR-214 promotes hepatocellular carcinoma development in Chinese population. Tumor Biol. 2016, 37, 14629–14635. [Google Scholar] [CrossRef] [PubMed]
  48. Ryan, B.M.; Robles, A.I.; McClary, A.C.; Haznadar, M.; Bowman, E.D.; Pine, S.R.; Brown, D.; Khan, M.; Shiraishi, K.; Kohno, T. Identification of a functional SNP in the 3′ UTR of CXCR2 that is associated with reduced risk of lung cancer. Cancer Res. 2015, 75, 566–575. [Google Scholar] [CrossRef] [PubMed]
  49. Popp, N.A.; Yu, D.; Green, B.; Chew, E.Y.; Ning, B.; Chan, C.C.; Tuo, J. Functional single nucleotide polymorphism in IL-17A 3′ untranslated region is targeted by miR-4480 in vitro and may be associated with age-related macular degeneration. Environ. Mol. Mutagen. 2016, 57, 58–64. [Google Scholar] [CrossRef] [PubMed]
  50. Le, H.H.; Nott, A.; Moore, M.J. How introns influence and enhance eukaryotic gene expression. Trends Biochem. Sci. 2003, 28, 215. [Google Scholar] [CrossRef]
  51. Seo, S.; Takayama, K.; Uno, K.; Ohi, K.; Hashimoto, R.; Nishizawa, D.; Ikeda, K.; Ozaki, N.; Nabeshima, T.; Miyamoto, Y. Functional analysis of deep intronic SNP rs13438494 in intron 24 of PCLO gene. PLoS ONE 2013, 8, e76960. [Google Scholar] [CrossRef] [PubMed]
Figure 1. Alignment of the deduced amino acid sequences and major domains of sheep and other mammalian Dickkopf-1 (DKK1) proteins. * (asterisk), : (colon) and . (dot) mean identical amino acid residues, similar alternate amino acid residues and dissimilar alternate amino acid residues, respectively. Cys1 and Cys2 show N-terminal cysteine-rich domain and C-terminal cysteine-rich domain. Darker gray indicates greater homology; the degree of homology is indicated by shading.
Genes 08 00400 g001
Figure 2. Phylogenetic analysis based on amino acid sequences of DKK1 in various animal species. The phylogenetic rooted tree was inferred using the same units as those of the evolutionary distance with branch lengths to scale. The Information for DKK1 amino acid sequences in 16 different animal species are listed in Table S1.
Genes 08 00400 g002
Figure 3. The genomic structure of the ovine DKK1. Exons: boxes. Introns: lines. The initiation codon (ATG) and the transcription starting site (TSS) are located in exon 1 and the stop codon (TAA) is located in exon 4.
Genes 08 00400 g003
Table 1. List of PCR primers used in the study.
Primer NameCoverageSequence (5′-3′)Size (bp)Annealing Temperature (°C)
DKK1-F1 GCAAAGCGACACTCCTCC95559.0
DKK1-R1GCTCTTACACCCCAGATTTTCGG
DKK1-F2chr22:6668693-6670458ATGAAACCGAACTCTTGACTTA177158.6
DKK1-R2AACTTGATTAGGCAGACACG
DKK1-F3chr22:6667603-6668709GTCTGCYTAATCAAGTTCATCTAC110756.2
DKK1-R3GGTTCTTGATV4GCGTTGGAAT
DKK1-F4chr22:6665566-6667623ATTCCAACGCB1ATCAAGAACC210056.2
DKK1-R4CAGR2CCTTCY3CCRCAGTAACA
DKK1-F5chr22:6665250-6665656TCTCAAGGAAGGTCAAGTGT40752.0
DKK1-R5GGTTGCATTTACAGGTAAGT
DKK1-F6chr22:6663304-6665269ACTTACCTGTAAATGCAACC196646.9
DKK1-R6TTATCCTACAACTATATCAGCAC
F: forward primer; R: reverse primer. Degenerate bases: B1, C/G/T; R2, A/G; Y3, C/T; V4, A/C/G.
Table 2. Identification and nomenclature of Dickkopf-1 (DKK1) Single Nucleotide Polymorphisms (SNPs).
SNP IDLocationdb SNP rs # ID 1AllelesNomenclature 2MAF 3HW P 4
SNP1Intron 2rs424404921G > Ag.909 G > A0.2170.0546
SNP2Intron 2rs411273297C > Ag.927 C > A0.2170.0223
SNP3Intron 2rs592810220Del CTGg.1049 Del CTG0.2352.9 × 10−37
SNP4Intron 2rs409382156G > Cg.1147 G > C0.2160.0070
SNP5Intron 2rs419857384G > Tg.1321 G > T0.1591.2 × 10−10
SNP6Intron 3rs419902277G > Ag.2018 G > A0.3850.4416
SNP7exon 4rs401363941G > Ag.2062 G > A0.3270.948
SNP83′ UTRrs428450289T > Cg.3093 T > C0.2170.2552
SNP93′ UTRrs415015281C > Tg.3329 C > T0.4900.4864
SNP103′ Flanking RegionnovelT > Cg.4123 T > C0.3551.2 × 10−19
SNP113′ Flanking RegionnovelT > Cg.4443 T > C0.4711.3 × 10−139
1 db, database; rs #, reference SNP #; 2 Nomenclature, according to SNP position on the obtained DKK1 DNA sequence (GenBank accession No. JQ348893); 3 MAF, minor allele frequency; 4 HW, Hardy–Weinberg test.
Table 3. Effects of DKK1 genotypes on wool production and quality traits (least square means ± SE) 1.
LinesSNP5SNP8SNP9SNP10
GenotypeMFD (μm)GenotypeMFD (μm)FW (kg)GenotypeCurvature (/2.5 cm)GenotypeFDSD (μm)CVFD
AGG21.08 ± 0.380 cCC18.33 ± 1.362 d,e,f5.45 ± 0.515 a,cCC11.56 ± 0.487 b,c,d,eCC4.56 ± 0.150 a,b21.41 ± 0.608 a
GT20.72 ± 0.522 c,d,eTC22.31 ± 0.531 a4.97 ± 0.191 a,bTC11.11 ± 0.514 e,fTC4.30 ± 0.144 a,b,c,d20.62 ± 0.585 a,b,c
TT21.12 ± 0.823 b,c,d,eTT20.36 ± 0.463 c,d,e4.44 ± 0.185 c,d,eTT11.52 ± 0.681 b,c,d,e,fTT4.09 ± 0.247 c,d,e19.56 ± 1.002 b,c,d,e,f
BGG21.54 ± 0.471 b,cCCNENECC13.50 ± 0.954 a,bCC4.07 ± 0.193 c,d,e,g19.41 ± 0.784 b,c,d,e,f
GT19.08 ± 0.817 e,fTC19.78 ± 0.946 c,d,e,f4.95 ± 0.371 a,b,c,dTC11.06 ± 0.639 c,e,fTC4.12 ± 0.192 b,c,d,e20.03 ± 0.778 a,b,c,d,e
TT19.89 ± 1.234 c,d,e,fTT20.90 ± 0.489 b,c,d4.95 ± 0.186 a,bTT13.56 ± 1.022 a,b,cTT4.00 ± 0.247 b,c,d,e,f,g20.11 ± 1.002 a,b,c,d,e,f
PWGG21.05 ± 0.454 c,dCC22.59 ± 1.284 a,b,c4.58 ± 0.489 a,b,c,d,e,fCC10.45 ± 0.765 e,fCC4.64 ± 0.179 a20.76 ± 0.725 a,b,c,d
GT22.86 ± 0.693 a,bTC22.09 ± 0.631 a,b4.64 ± 0.250 a,b,c,d,eTC11.35 ± 0.409 d,e,fTC4.27 ± 0.157 a,b,c,d19.33 ± 0.637 c,d,e,f
TTNETT21.29 ± 0.514 a,b,c4.56 ± 0.196 a,b,c,d,eTT11.61 ± 0.856 b,c,d,e,fTT4.10 ± 0.268 a,b,c,d,e,f,g18.04 ± 1.086 e,f
PMGG20.74 ± 0.504 c,d,eCC20.73 ± 1.047 a,b,c,d,e,f4.19 ± 0.400 a,b,c,d,e,fCC11.98 ± 0.687 b,c,d,eCC4.41 ± 0.118 a,b,c21.09 ± 0.480 a,b
GT19.73 ± 1.373 c,d,e,fTC21.56 ± 0.655 a,b,c3.67 ± 0.252 f,gTC10.97 ± 0.564 e,fTC3.73 ± 0.276 d,e,f,g17.20 ± 1.120 f
TTNETT21.03 ± 0.482 a,b,c,d3.29 ± 0.191 gTT12.17 ± 0.505 b,c,d,eTTNENE
UGG23.74 ± 0.701 aCCNENECC8.88 ± 1.198 fCCNENE
GT19.86 ± 1.307 c,d,e,fTC22.06 ± 0.744 a,b,c4.17 ± 0.283 d,e,fTC14.62 ± 1.640 a,b,dTCNENE
TTNETT20.21 ± 1.070 a,b,c,d,e,f4.10 ± 0.407 b,d,e,f,gTT17.15 ± 1.771 aTTNENE
SFGG18.79 ± 0.297 fCCNENECC15.44 ± 0.600 aCC3.61 ± 0.129 f19.04 ± 0.522 d,e,f
GT19.86 ± 1.307 c,d,e,fTC19.24 ± 0.494 e,f4.07 ± 0.198 e,fTC15.32 ± 0.434 aTC3.75 ± 0.159 e,f,g19.45 ± 0.644 c,d,e,f
TT20.09 ± 1.275 b,c,d,e,fTT18.81 ± 0.359 f4.66 ± 0.139 a,b,c,dTT14.74 ± 0.523 aTT3.59 ± 0.168 f,g19.37 ± 0.682 c,d,e,f
p value0.0037 2 0.01390.0456 0.0186 0.03630.0053
The complete trait data are only included for the traits associated with the identified SNPs; 1 Least square means within columns that do not share a lower-case superscript letter (a, b, c, d, e, f, g) are different, p < 0.05; MFD, means mean fiber diameter; FW, fleece weight; FDSD, standard deviation of the mean fiber diameter; CVFD, coefficient of variation of the mean fiber diameter; 2 p value was evaluated based on threshold gene-wide (p < 4.55 × 10−3 = 0.05/11) using Bonferroni correction; NE stands for not estimable.
Table 4. The influence of DKK1 haplotypes on several wool quality traits.
LinesHaplotypeMFD (μm)
AH1: AAICGAGCCCCNE
H2: AAICTAATCTT20.97 ± 0.628 a,b,c,d,e,g
H3: GCDGGAATCTT22.43 ± 0.739 a,b
H4: GCDGGGGCCCCNE
H5: GCDGGGGTTCC21.43 ± 0.670 a,b,c,d,e
BH1: AAICGAGCCCCNE
H2: AAICTAATCTT18.43 ± 0.811 f
H3: GCDGGAATCTT19.68 ± 0.654 d,e,f,g
H4: GCDGGGGCCCC18.58 ± 1.369 d,e,f,g
H5: GCDGGGGTTCC21.30 ± 0.881 a,b,c,d,e
PWH1: AAICGAGCCCC20.10 ± 1.024 b,d,e,f,g
H2: AAICTAATCTT23.21 ± 1.363 a,c
H3: GCDGGAATCTT21.45 ± 0.627 a,b,c,d
H4: GCDGGGGCCCC20.44 ± 1.624 a,b,c,d,e,f,g
H5: GCDGGGGTTCC20.41 ± 0.811 a,b,c,d,e,f,g
PMH1: AAICGAGCCCC18.43 ± 1.106 f,g
H2: AAICTAATCTT21.05 ± 1.380 a,b,c,d,e,f,g
H3: GCDGGAATCTT20.34 ± 0.692 c,d,e,f,g
H4: GCDGGGGCCCC20.18 ± 0.678 d,e,f,g
H5: GCDGGGGTTCC21.09 ± 0.679 a,b,c,d,e
UH1: AAICGAGCCCCNE
H2: AAICTAATCTTNE
H3: GCDGGAATCTTNE
H4: GCDGGGGCCCCNE
H5: GCDGGGGTTCCNE
SFH1: AAICGAGCCCC19.81 ± 0.722 d,e,f,g
H2: AAICTAATCTT20.16 ± 0.519 d,e,f,g
H3: GCDGGAATCTT18.81 ± 0.538 f
H4: GCDGGGGCCCCNE
H5: GCDGGGGTTCC19.89 ± 0.424 e,f,g
p value0.014
Before the association analysis of the identified haplotypes with wool quality traits. That is, if the number of one haplotype was fewer than 5% × the total number of samples, we removed the data for this haplotype. Only traits associated with the identified haplotypes are presented; a,b,c,d,e,f,g Mean within a column with no common superscript are different (p < 0.05); NE stands for not estimable.

