Article

The Complete Chloroplast Genome Sequences of Six Rehmannia Species

Key Laboratory of Resource Biology and Biotechnology in Western China (Ministry of Education), College of Life Science, Northwest University, Xi’an, 710069, China
*
Author to whom correspondence should be addressed.
Genes 2017, 8(3), 103; https://doi.org/10.3390/genes8030103
Submission received: 12 January 2017 / Revised: 4 March 2017 / Accepted: 9 March 2017 / Published: 15 March 2017
(This article belongs to the Section Plant Genetics and Genomics)

Abstract

:
Rehmannia is a non-parasitic genus in Orobanchaceae including six species mainly distributed in central and north China. Its phylogenetic position and infrageneric relationships remain uncertain due to potential hybridization and polyploidization. In this study, we sequenced and compared the complete chloroplast genomes of six Rehmannia species using Illumina sequencing technology to elucidate the interspecific variations. Rehmannia plastomes exhibited typical quadripartite and circular structures with good synteny of gene order. The complete genomes ranged from 153,622 bp to 154,055 bp in length, including 133 genes encoding 88 proteins, 37 tRNAs, and 8 rRNAs. Three genes (rpoA, rpoC2, accD) have potentially experienced positive selection. Plastome size variation of Rehmannia was mainly ascribed to the expansion and contraction of the border regions between the inverted repeat (IR) region and the single-copy (SC) regions. Despite of the conserved structure in Rehmannia plastomes, sequence variations provide useful phylogenetic information. Phylogenetic trees of 23 Lamiales species reconstructed with the complete plastomes suggested that Rehmannia was monophyletic and sister to the clade of Lindenbergia and the parasitic taxa in Orobanchaceae. The interspecific relationships within Rehmannia were completely different with the previous studies. In future, population phylogenomic works based on plastomes are urgently needed to clarify the evolutionary history of Rehmannia.

1. Introduction

Rehmannia Libosch. ex Fisch. et Mey. is a small genus consisting of six species, among which five (Rehmannia chingii, Rehmannia henryi, Rehmannia elata, Rehmannia piasezkii, Rehmannia solanifolia) are endemic to China, while Rehmannia glutinosa, a famous and valuable species in Chinese traditional medicine, extends its distribution range from North China to Korea and Japan [1]. The systematic position of Rehmannia has been debated for years. It was traditionally placed in Scrophulariaceae based on morphological traits. Recently, molecular evidence indicated that Scrophulariaceae was polyphyletic [2]. Rehmannia was then transferred to Plantaginaceae [3] and later placed in Orobanchaceae as the second non-parasitic branch [4,5] or treated as an independent family [6]. Besides the uncertain familial placement of Rehmannia, interspecific relationships within the genus are also unsolved. Despite of the differences in some flower traits, the two tetraploid species R. glutinosa and R. solanifolia share identical chloroplast and nuclear haplotypes [7,8], inferring the possibility of the symnonym of one species. Similarly, evidence from morphology, pollen, allozyme, chemical composition, and molecular data support the theory that R. piasezkii and R. elata should also be considered one species [7,9,10]. Moreover, interspecific phylogenetic relationships are incongruent when constructed by different DNA fragments. Chloroplast fragments supported R. chingii was the basal taxon of the genus [5] while R. piasezkii was confirmed as the sister group to the remaining taxa within the genus by nuclear data [7,8].
The controversy in systematic position and interspecific relationships of Rehmannia partly lies in the lack of sufficiently effective data. Traditional morphological classification based on limited selected characters is often deeply affected by environmental and developmental factors of samples. For example, bracteoles absence or presence, considered as the critical trait to discriminate R. piasezkii from R. chingii, are not species-specific and variable among intraspecific individuals [9]. Although molecular data such as chloroplast and/or nuclear DNA fragments provide some information for the taxonomy of Rehmannia [5,7,8], phylogenetic analysis based on these limited data are usually unreliable for their low resolution.
Most chloroplast (cp) genomes have a typical quadripartite structure with a pair of inverted repeats (IRs) separated by a large single-copy region (LSC) and a small single-copy region (SSC), and the genome size ranged from 120 to 160 Kb in length [11]. Previous studies indicated that the complete chloroplast genome sequences could improve the resolution at lower taxonomic level [12,13,14]. The Next Generation Sequencing (NGS) technique has enabled generating large amounts of sequence data at relatively low cost [15,16,17]. Up to now, approximately 644 plastid genomes in Viridiplantae have been sequenced and deposited in the National Center for Biotechnology Information (NCBI) Organelle Genome Resources. These massive data, together with the conservation of cp sequences, made it become a more increasingly used and effective tool for plant phylogenomic analysis than nuclear and mitochondrial genomes.
In this study, we sequenced, assembled, and characterized the plastomes of six Rehmannia species to verify the familial placement and evaluate the interspecific variation within the genus. These analyses will not only improve our understanding of the evolutionary mechanism of Rehmannia plastome and but also aid to clarify the ambiguous phylogenetic position of Rehmannia.

2. Materials and Methods

2.1. DNA Extraction and Sequencing

All samples used in the study were transplanted from their native habitats and cultivated in the greenhouse of Northwest University. No specific permits are required for sampling (Table 1). Healthy and fresh leaves from a single individual of the Rehmannia species were collected for DNA extraction.
The organelle-enriched DNAs of R. glutinosa were isolated using Percoll gradient centrifugation method [18] and CTAB extraction method. The DNA concentration was quantified using a NanoDrop spectrophotometer (Thermo Scientific, Carlsbad, CA, USA). -The DNA with concentration >30ng/μL was fragmented by mechanical interruption (ultrasonic), using PCR amplification to form a sequencing library. We sequenced the complete chloroplast genome of R. glutinosa with Illumina MiSeq platform at Sangon Biotech Co. (shanghai, China). A paired-end (PE) library with 265-bp insert size was constructed. Total genomic DNAs of other five Rehmannia species (R. solanifolia, R. chingii, R. piasezkii, R. elata, and R. henryi) were extracted with simplified CTAB protocol [19]. A paired-end (PE) library with 126-bp insert size was constructed using the Illumina PE DNA library kit and sequenced using an Illumina Hiseq 2500 by Biomarker technologies CO. (Beijing, China).

2.2. Chloroplast Genome Assembling and Annotation

Raw reads of R. glutinosa were trimmed to remove the potential low quality bases. Chloroplast genome was assembled using Velvet Assembler version 1.2.07 [20] and SPAdes [21]. Gaps and ambiguous (N) bases of the plastome were corrected using SSPACE premium version 2.2 [22]. The annotation of the plastome was performed with online tool CpGAVAS (http://www.herbalgenomics.org/cpgavas) and the gene homologies were confirmed by comparing with the NCBI’s non-redundant (Nr) protein database, Cluster of Orthologous Group (COG), CDD (https://www.ncbi.nlm.nih.gov/Structure/cdd/cdd.shtml), PFAM (http://xfam.org), SWISS-PROT (http://web.expasy.org/docs/swiss-prot_guideline.html), and TREMBL (http://www.bioinfo.pte.hu/more/TrEMBL.htm) databases. The raw reads of five other Rehmannia species were quality-trimmed using CLC Genomics Workbench v7.5 (CLC bio, Aarhus, Denmark) with default parameters. Reference-guided assembly was then performed to reconstruct the chloroplast genomes with the program MITObim v1.7 [23] using R. glutinosa as the reference. The cpDNA annotation was conducted using the program GENEIOUS R8 (Biomatters Ltd., Auckland, New Zealand), and used the plastome of R. glutinosa as the reference, coupled with manual adjustment for start/stop codons and for intron/exon borders. Transfer RNAs (tRNAs), ribosomal RNAs (rRNAs), and coding sequences were further confirmed, and in some cases, manually adjusted after BLAST searches. The circle maps of six Rehmannia plastomes were obtained using Organellar Genome DRAW software (OGDRAW, http://ogdraw.mpimp-golm.mpg.de) [24]. Ambiguous (N) bases and large insertion/deletion fragment (rpoC2) were validated by PCR amplification and Sanger sequencing (Table S1).

2.3. Sequence Analysis and Repeat Structure

Multiple alignments of six Rehmannia plastomes were carried out using MAFFT version 7.017 [25]. Full alignments with annotation were visualized using the mVISTA software [26]. Genetic divergence parameter (p-distance) was calculated by MEGA 6.0 [27]. The percentage of variable characters for each noncoding region with an aligned length >200 bp in the genome was calculated as described in Zhang et al. [28]. Dispersed, tandem and palindromic repeats were determined by the program REPuter [29] (http://bibiserv.techfak.uni-bielefeld.de/reputer/manual.html) with a minimal size of 30 bp and >90% identity (Hamming distance equal to 3) between the two repeats. Gap size between palindromic repeats was restricted to a maximal length of 3 kb. Overlapping repeats were merged into one repeat motif whenever possible. Tandem Repeats Finder [30] (http://tandem.bu.edu/trf/trf.html) was used to identify tandem repeats in the six Rehmannia plastomes with default settings. A given region in the genome was designated as only one repeat type, and tandem repeat was prior to dispersed repeat if one repeat motif could be identified as both tandem and dispersed repeats.

2.4. Selective Pressure Analysis

Signals of natural selection were evaluated for all chloroplast genes located outside of IR region. Selective pressures, nonsynonymous to synonymous ratios (Ka/Ks), were computed with codeml tool of PAML package [31].

2.5. Comparative Genome Analysis

The whole plastomes of Rehmannia and 17 representatives of Lamiales species, including six Lamiaceae species, five Orobanchaceae species, and five species from other families (Table 2), were aligned separately by using MAUVE as implemented in Geneious with default settings [32] to test and visualize the presence of genome rearrangements and inversions

2.6. Phylogenomic Analyses

The chloroplast genome sequences of six Rehmannia species, together with 17 Lamiales species (Table 2), were aligned with the program MAFFT version 7.017 [25] and adjusted manually when necessary. In order to test the utility of different cp regions, phylogenetic analyses were performed based on the following four datasets: (1) the complete cp DNA sequences, (2) a set of the common protein coding genes (PCGs), (3) the large single copy region, and (4) the small single copy region. Maximum likelihood (ML) analyses were implemented in RAxML version 7.2.6 [33]. RAxML searches relied on the general time reversible (GTR) model of nucleotide substitution with the gamma model of rate heterogeneity. Non-parametric bootstrapping test was implemented in the ‘‘fast bootstrap’’ algorithm of RAxML with 1000 replicates. Bayesian analyses were performed using the program MrBayes version 3.1.2 [34]. The best-fitting models were determined by the Akaike Information Criterion [35] as implemented in the program Modeltest 3.7 [36]. The Markov chain Monte Carlo (MCMC) algorithm was run for 200,000 generations with trees sampled every 10 generations for each data partition. The first 25% of trees from all runs were discarded as burn-in, and the remaining trees were used to construct majority-rule consensus tree. In all analyses, Olea europaea was set as an outgroup.

3. Results

3.1. Genome Sequencing, Assembly, and Validation

Illumina paired-end sequencing generated 1 Gb raw reads for R. glutinosa, accounting for 91.1% of the total reads with average length of 265 bp. The sequencing depth and coverage were approximately 6600 and 1583.5, respectively. Using the Illumina Hiseq 2500 system (Biomarker technologies CO.), five other Rehmannia species produced large data for each species from 25,724,095 (R. chingii) to 31,171,142 (R. henryi) clean reads (126 bp in average reads length). All paired-end reads were mapped to the reference plastome of R. glutinosa with the mean coverage of 119.6× to 141.8× (Table 1). Gaps were validated by using PCR-based sequencing with seven pairs of primers (Table S1). All six Rehmannia plastome sequences were deposited in GenBank (accession numbers: KX426347, KX636157- KX636161) (Table 1, Table 2).

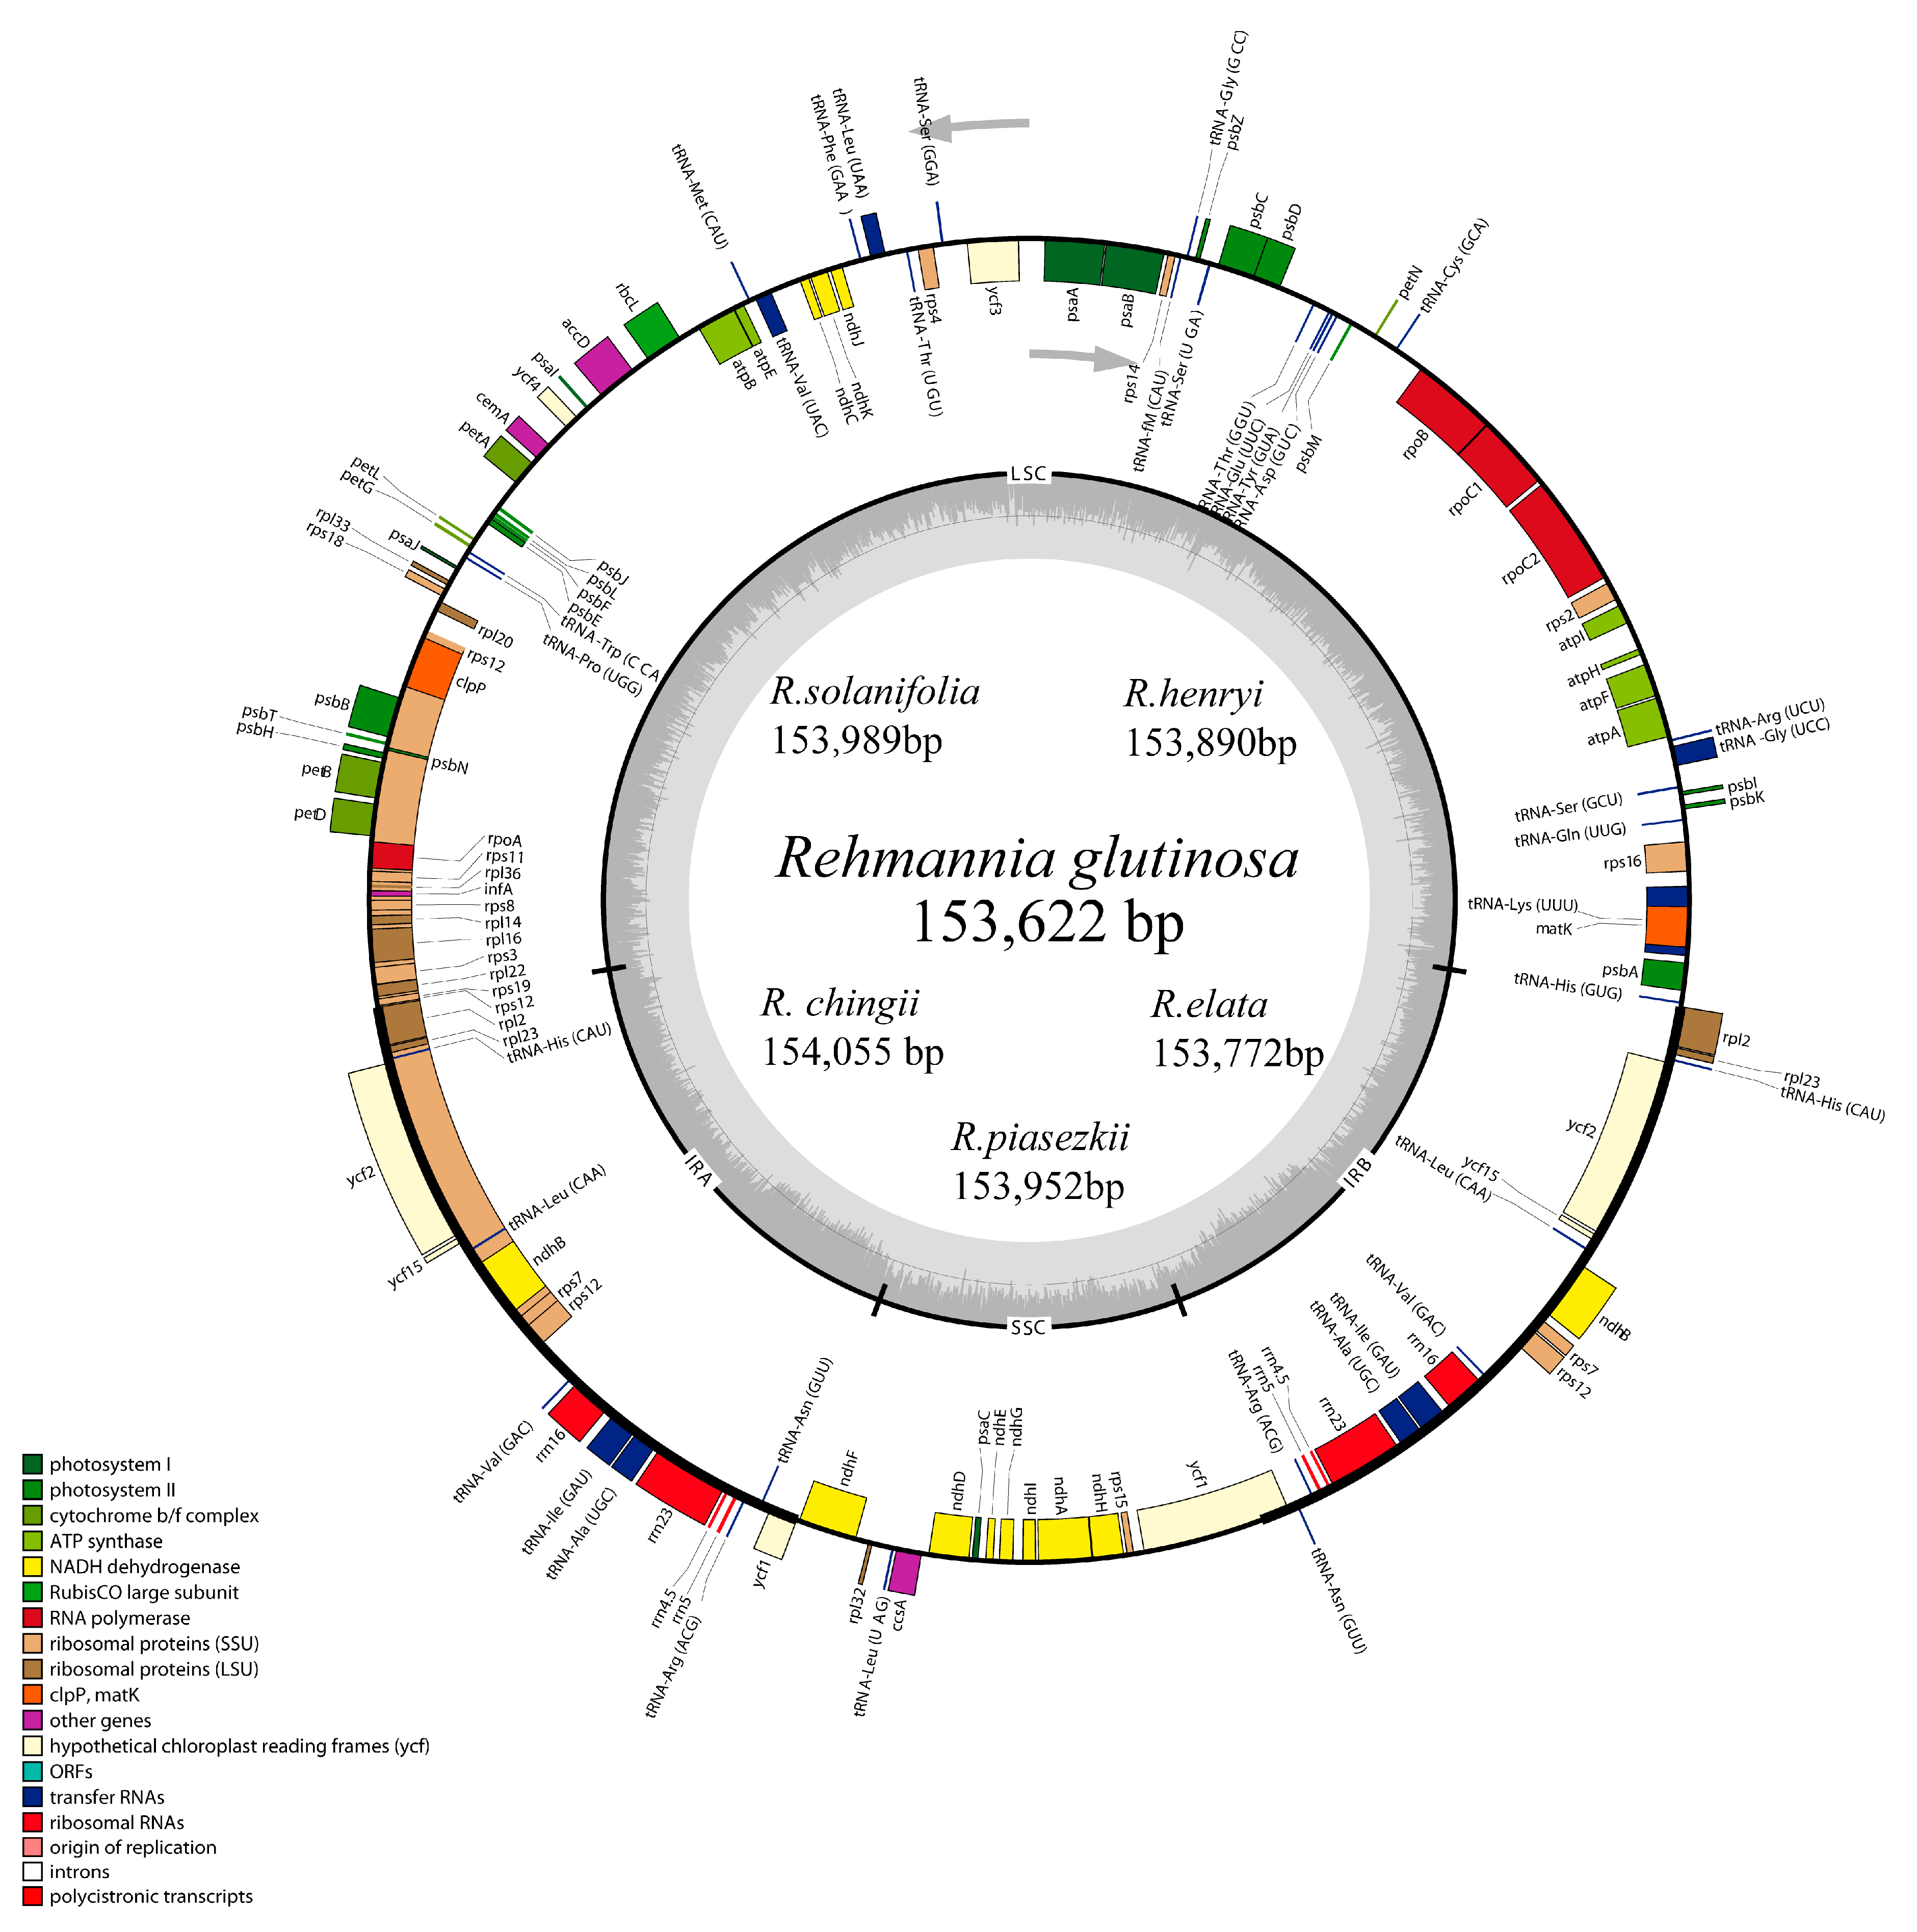
3.2. Complete Chloroplast Genomes of Rehmannia Species

The six chloroplast genomes of Rehmannia ranged in size from 153,622 bp (R. glutinosa) to 154,055 bp (R. chingii). All of them exhibited a typical quadripartite structure consisting of a pair of IRs (25,666–25,735 bp) separated by the LSC (84,605–84,966 bp) and SSC (17,579–17,680 bp) regions (Figure 1). These six plastomes are highly conserved in gene content, gene order, and intron number. The overall GC content was about 38.0%, almost identical with each other among Rehmannia species (Table 2). The Rehmannia plastomes contained 133 genes, of which 115 occurred as a single copy and 18 were duplicated in the IR regions (Table 3). The predicted functional genes of each species were comprised of 88 protein-coding genes, 37 tRNA genes, and eight rRNA genes (Table 2). Sixteen genes (rpl2, ndhB, petD, petB, ndhA, ndhB, rpl16, rpoC1, atpF1, rps16, trnA-UGC, trnG-GCC, trnI-GAU, trnK-UUU, trnL-UAA, and trnV-UAC) had one intron, while three genes (rps12, clpP, and ycf3) contained two introns (Table 3). The rps12 gene was a unique gene with 3′ end exon and intron located in the IR region, and the 5′ end exon in the LSC region. Unusual initiator codons were observed in ndhD with ATC and rps19 with GTG in Rehmannia plastomes. Overlaps of adjacent genes were found in the complete genome, for example, rps3-rpl22, atpB-atpE, and psbD-psbC had a 16 bp, 4 bp, and 53 bp overlapping region, respectively. Large indels were detected in the rpoC2 gene, which caused the gene size to vary from 2916 bp to 4185 bp among the six species (Figure S1).

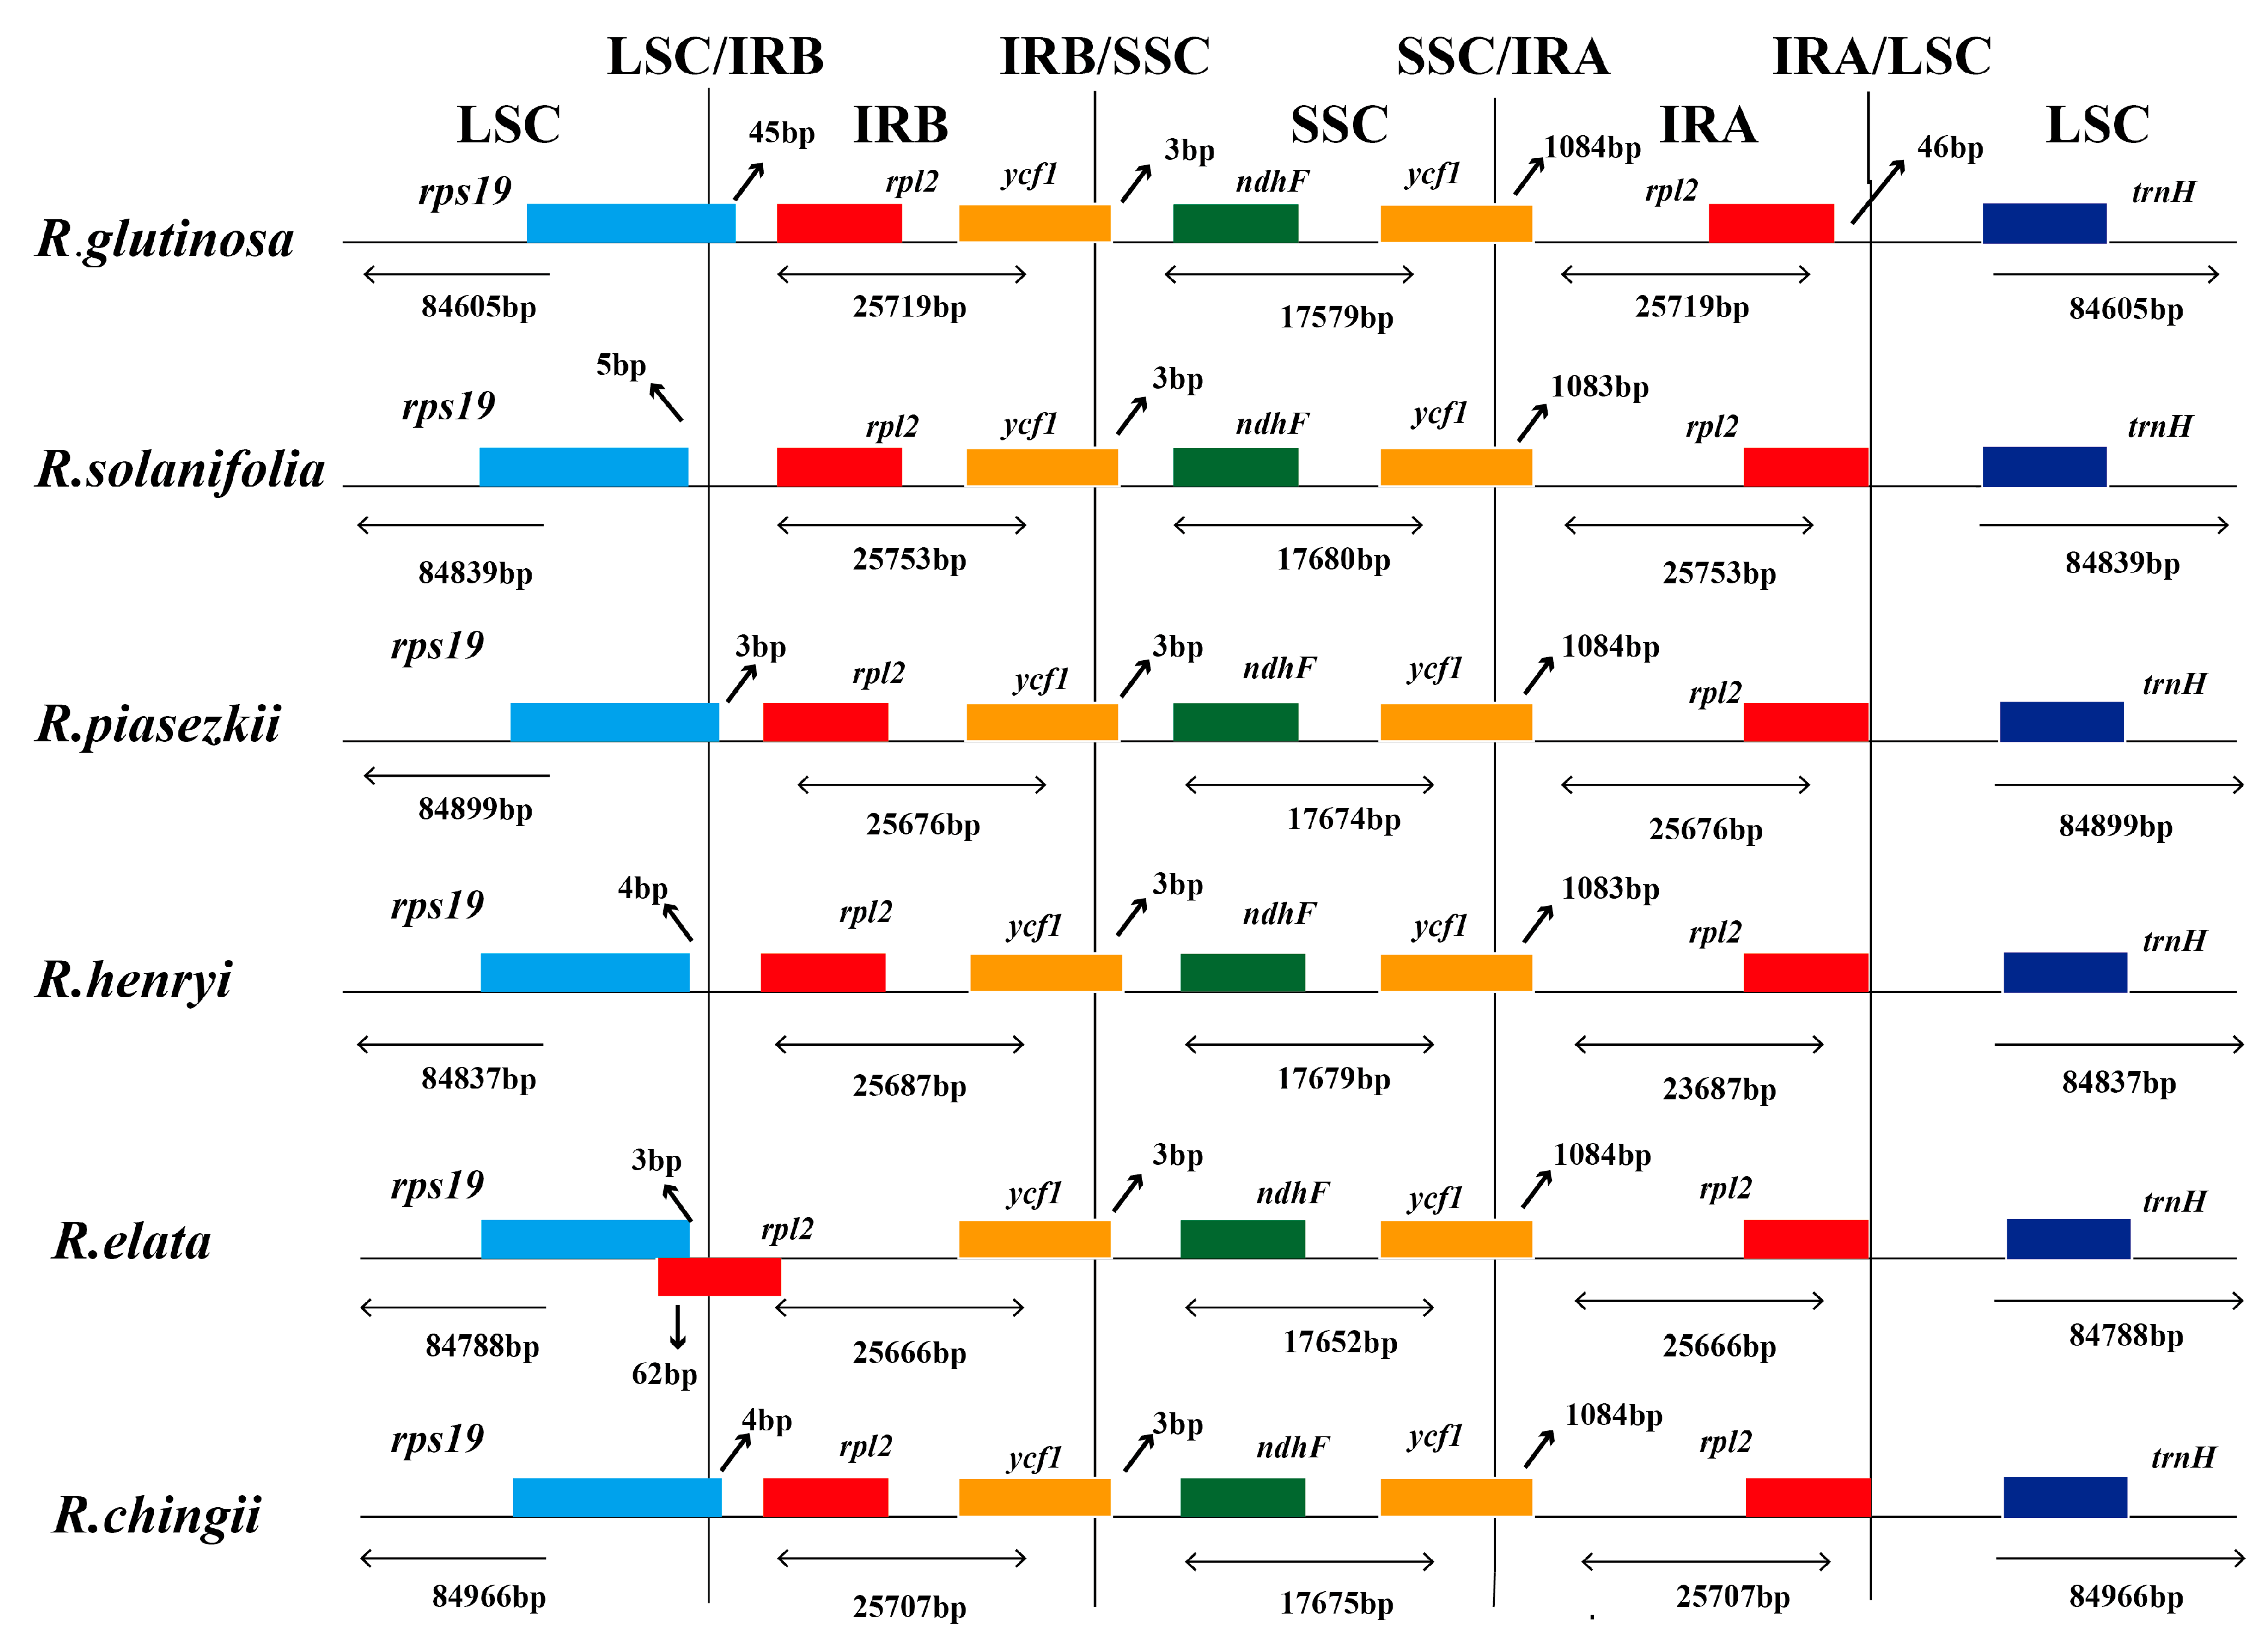
3.3. IR Boundary Changes and Gene Rearrangement

The IR region of six Rehmannia chloroplast genomes was highly conserved, but structure variation was still found in the IR/SC boundary regions. To elucidate the potential contraction and expansion of IR regions, we compared the gene variation at the IR/SSC and IR/LSC boundary regions of the six plastomes. The genes rps19-rp12-trnH and ycf1-ndhF were located in the junctions of LSC/IR and SSC/IR regions. Two copies of the ycf1 gene crossed SSC/IRa and SSC/IRb with 3 bp in the SSC region and 1083/1084 bp in the IRa region, respectively (Figure 2). Compared to the relatively fixed location of the ycf1 and trnH gene in all chloroplast genomes, the LSC/IR boundary regions were more variable. The rps19 gene in R. glutinosa, R. piasezkii, and R. chingii crossed the LSC/IRb region with 45 bp, 3 bp, and 4 bp located at the IRb region while the intergenic spacer of rps19-rps12 extended 3 bp, 4 bp, or 5 bp to the LSC region in R. elata, R. henryi, and R. solanifolia, respectively. The rpl2 gene of R. elata, commonly located in the IRb region in Rehmannia, extended 65 bp into the LSC region and overlapped with the rps19 gene by 62 bp. To identify the potential genome rearrangements and inversions, the chloroplast genome sequences of six Rehmannia species, Arabidopsis thaliana and 16 core Lamiales taxa, were selected for synteny analyses (Table 2). No gene rearrangement and inversion events were detected in Rehmannia, except Cistanche deserticola with structure variation of a 4 kb fragment. (Supplementary Figure S2).

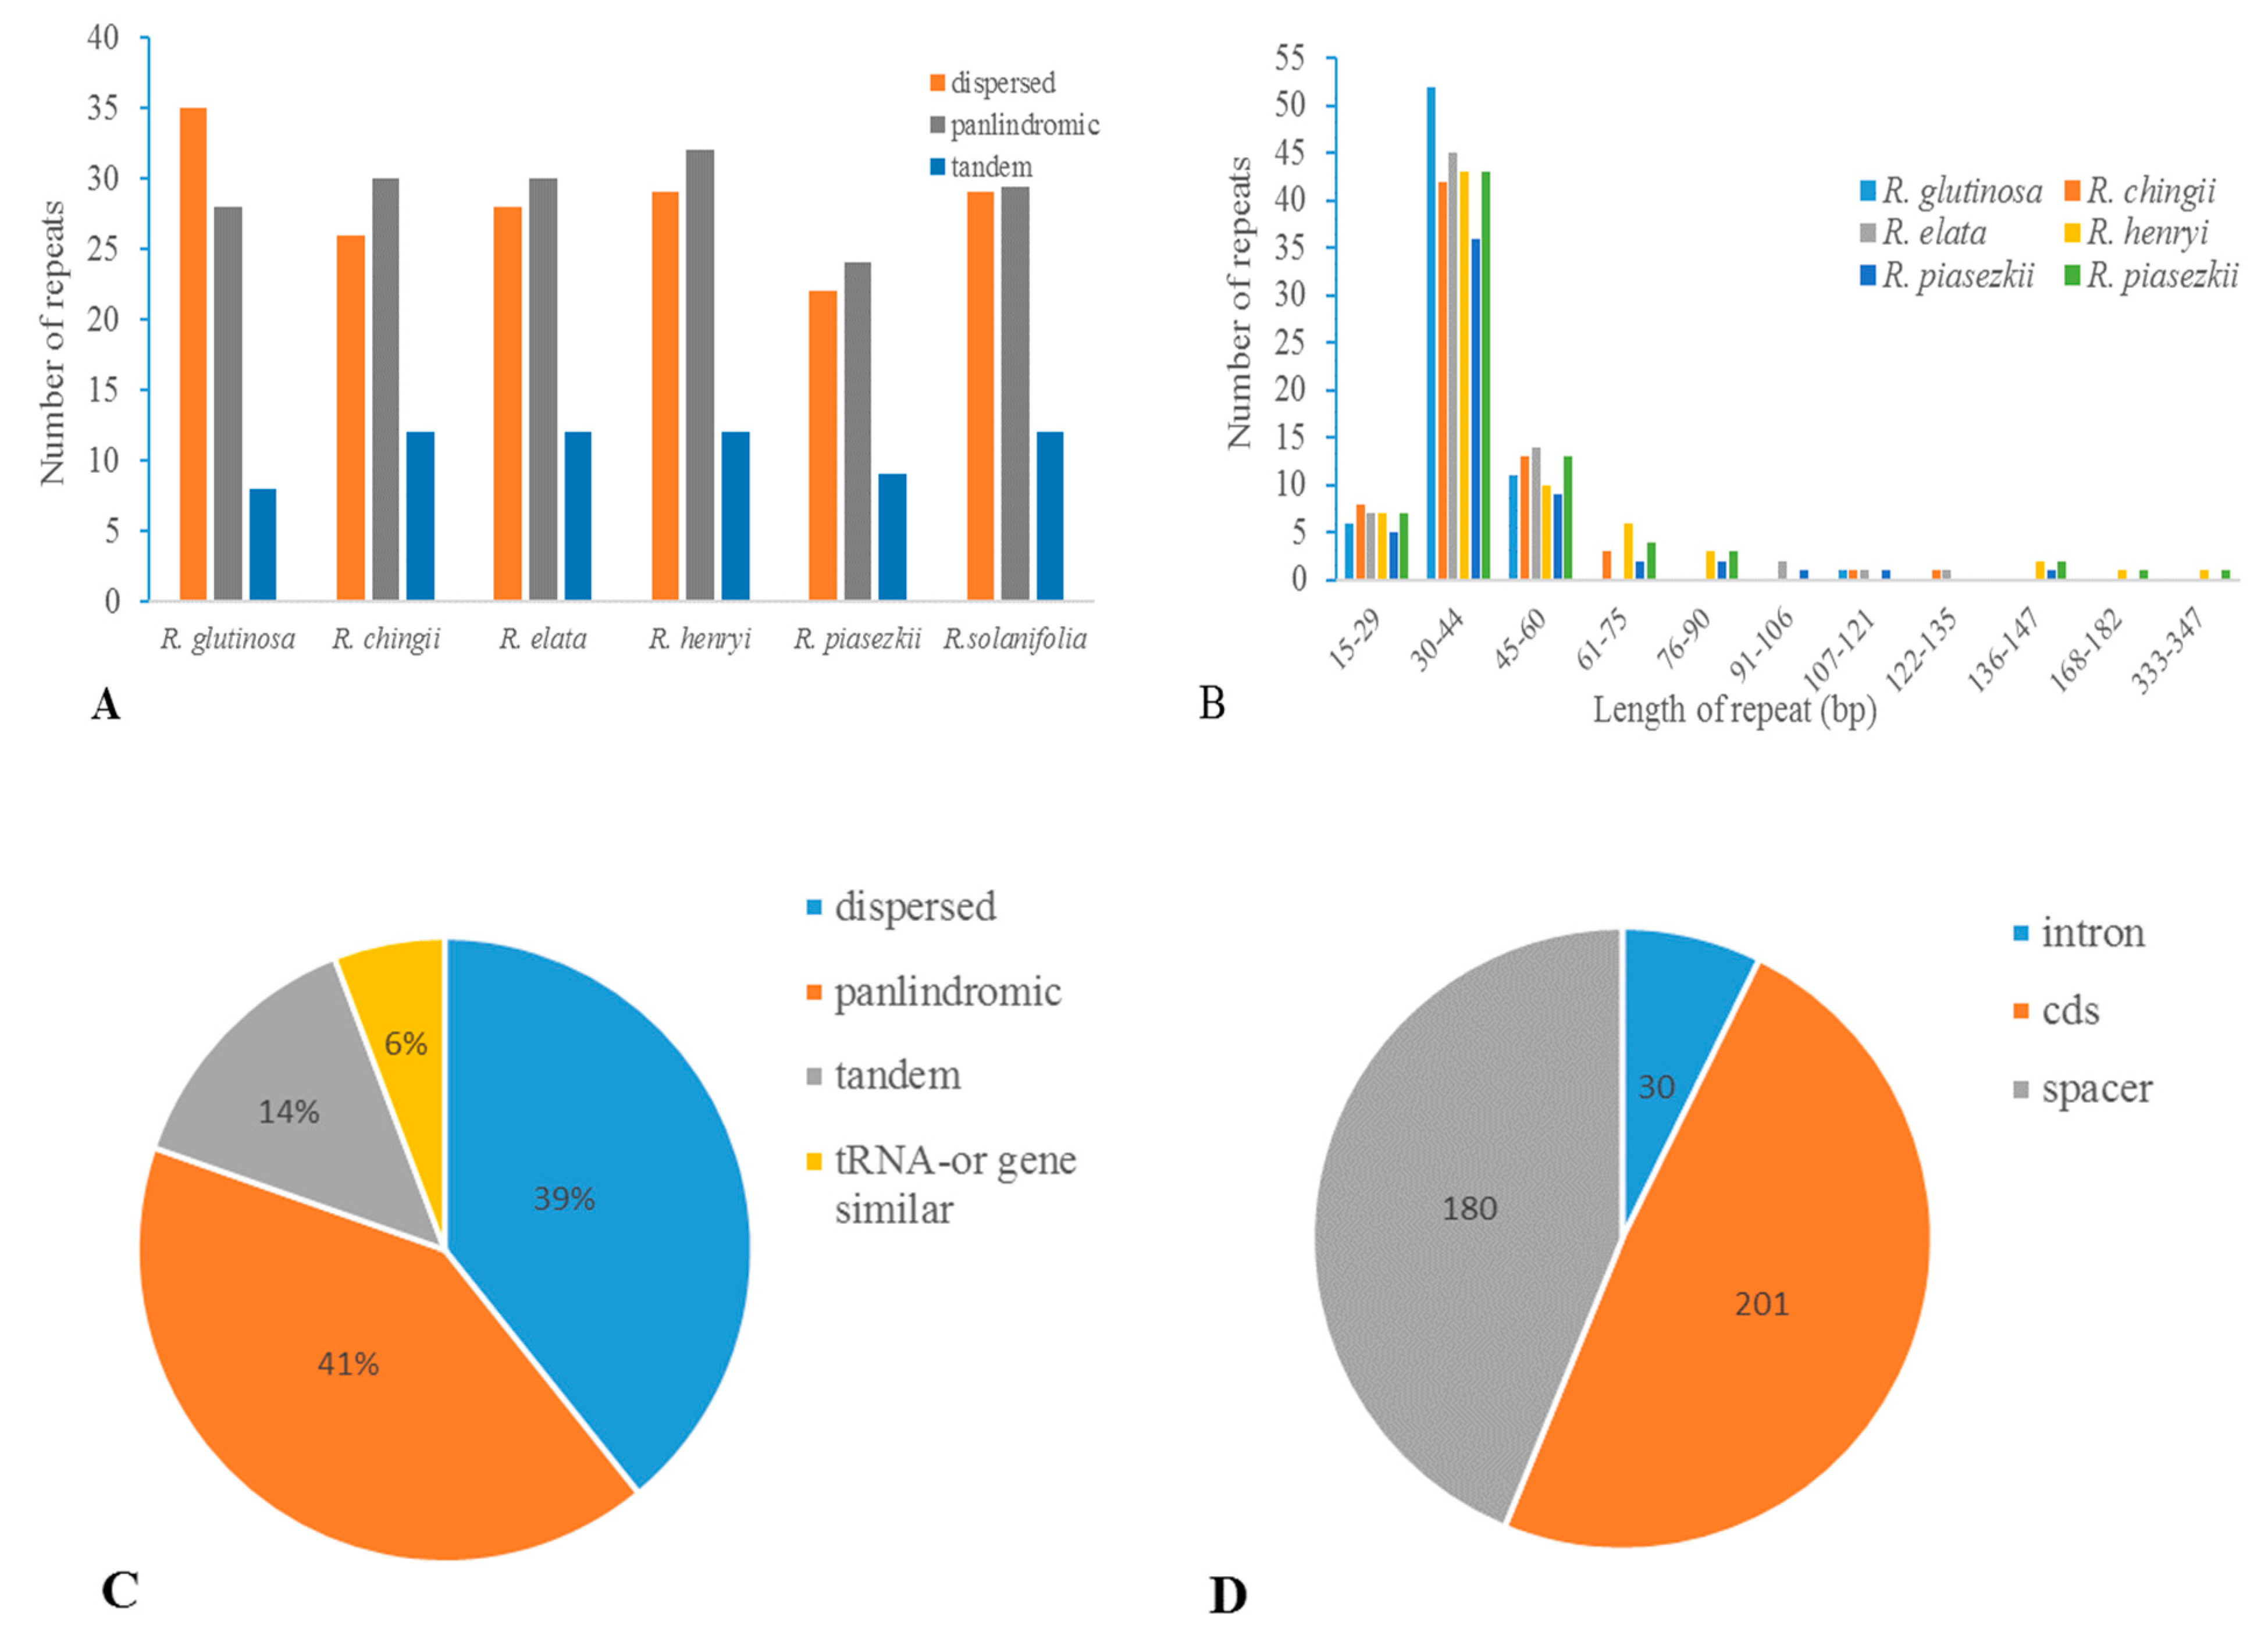
3.4. Repetitive Sequences

We classified sequence repeat motifs into three categories: dispersed, tandem, and palindromic repeats. For all repeat types, the minimal cut-off identity between two copies was set to 90%. The minimal repeat size investigated were 30 bp for dispersed, 15 bp for tandem and 20 bp for palindromic repeats, respectively. In total, 411 repeats were detected in Rehmannia plastomes (see Supplementary Table S2, Figure 3). Among these repeats, 24 were verified to be associated with two copies of tRNA (e.g., trnG-UCC) or gene duplication (e.g., psaA/psaB) and subsequently considered as tRNA or gene similarity repeats [37] due to their similarity in gene functions. Numbers of the three repeat types were similar among these six plastomes (Figure 3A) and their overall distribution in the plastome was highly conserved. Generally, palindromic repeats were the most common, while tandem repeats were the least in Rehmannia except R. glutinosa with dispersal repeats as the most common. The majority of repeats ranged in size from 30 bp to 44 bp (Figure 3B), even though the defined smallest size is 15 bp and 30 bp for tandem and dispersed repeats, respectively. The longest repeat is a palindromic repeat of 341 bp in R. henryi and R. solanifolia. Dispersed repeats had a wider size range (from 30 to 126 bp) than other repeat types. Palindromic repeat, accounting for 41% of total repeats, was the most common, followed by dispersed (39%), tandem (14%), and tRNA or gene similarity (6%) types (Figure 3C). A minority of repeats was found in intron (7.3%), while the majority were located in coding regions (48.9%) (such as gene ycf2, rps18, rps11 and rpoC2) and intergenic spacers (43.8%) (Figure 3D).

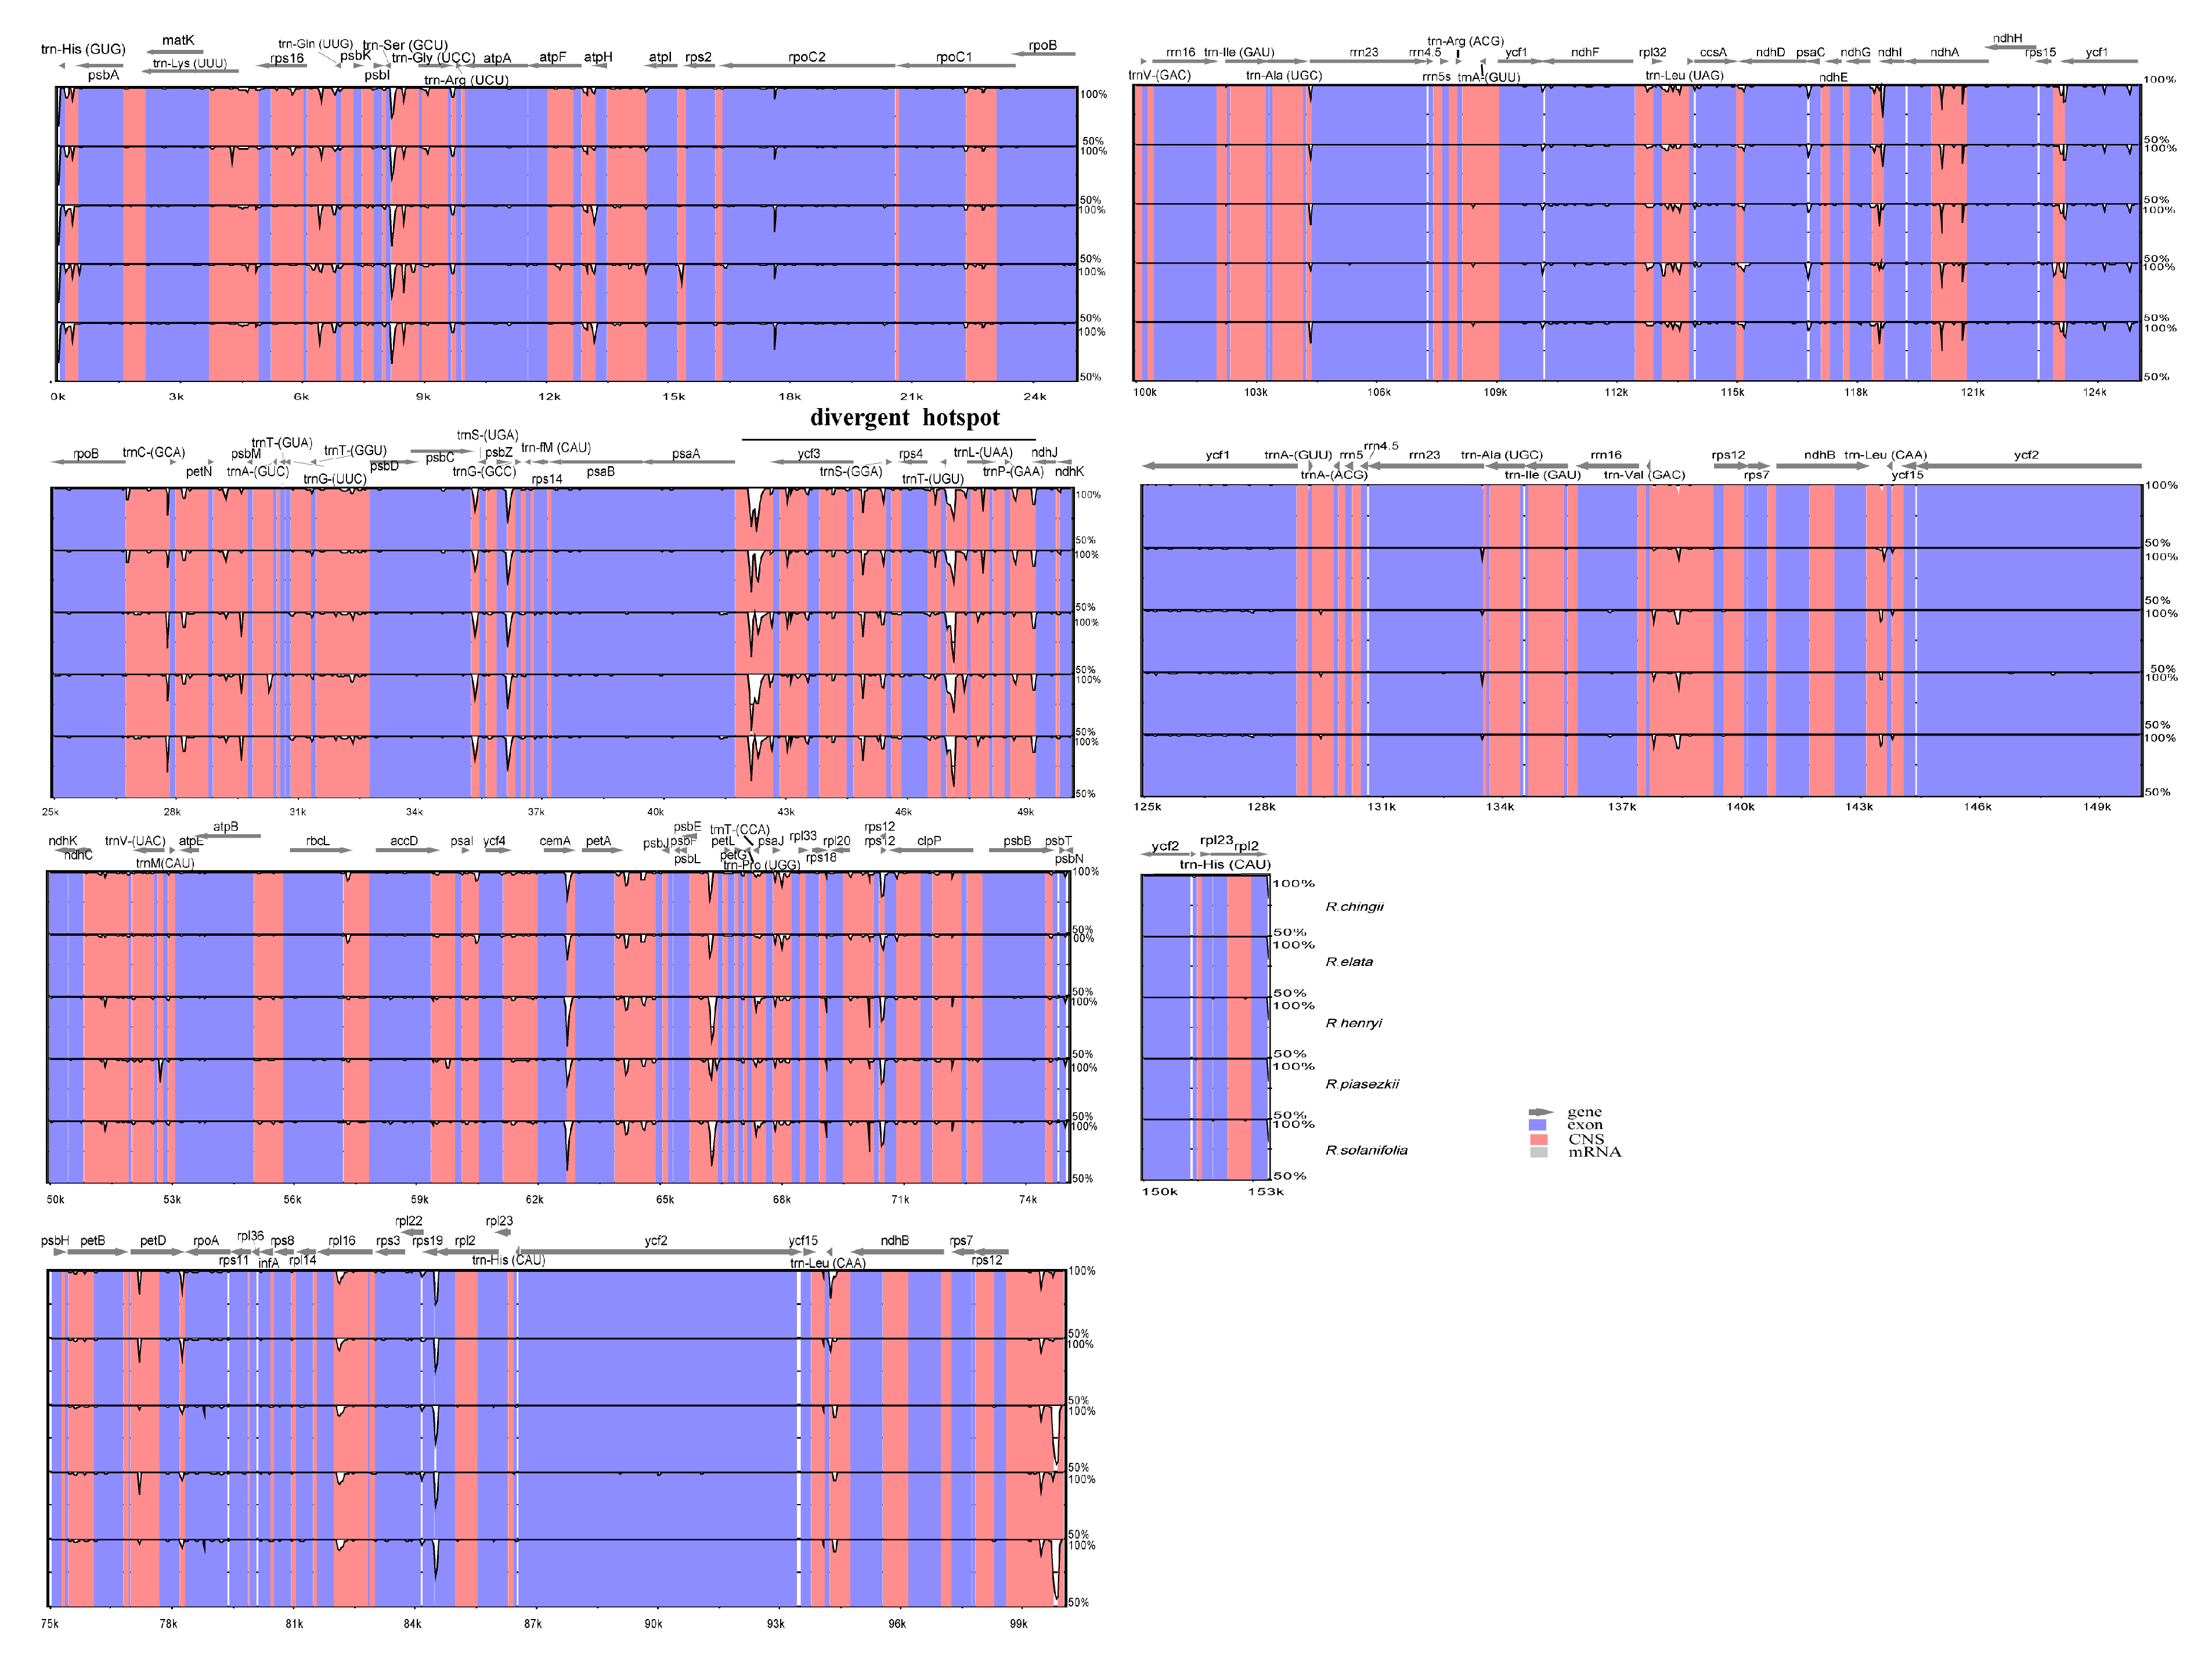
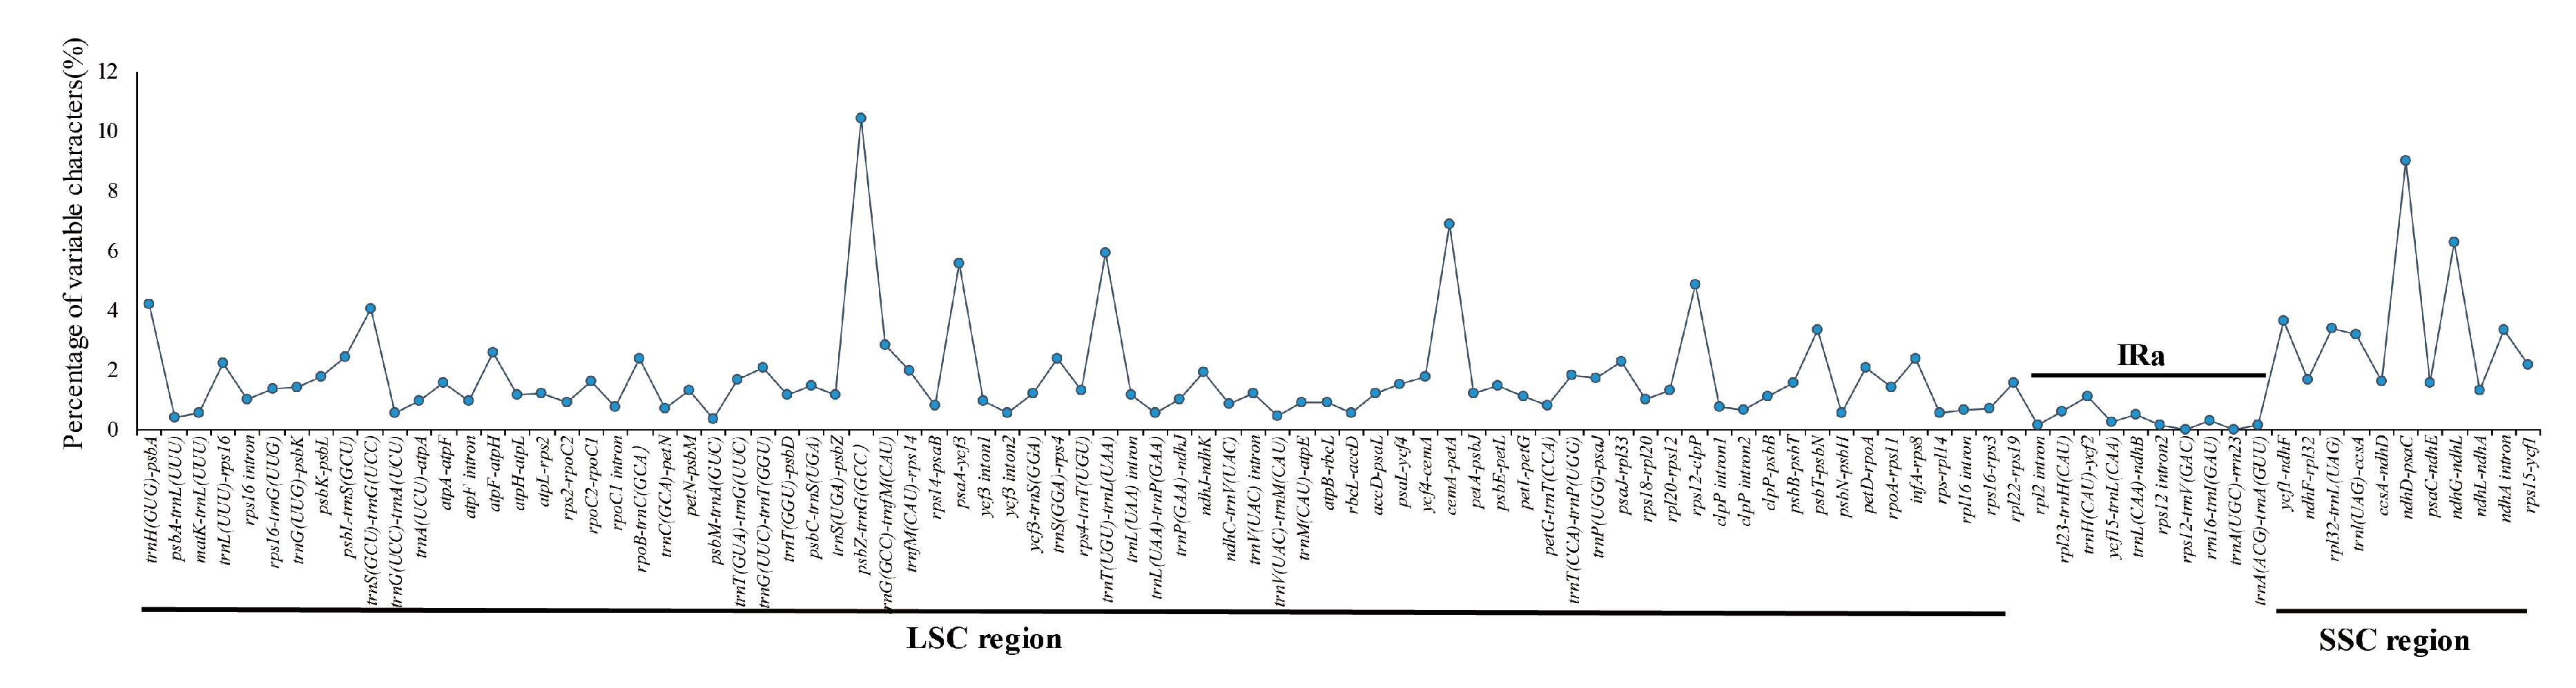
3.5. Sequence Divergence and Divergence Hotspot

To elucidate the level of the genome divergence, sequence identity among Rehmannia cpDNAs were plotted using the program mVISTA with R. glutinosa as a reference. The whole aligned sequences showed high similarities with only a few regions below 90%, suggesting that Rehmannia plastomes were rather conserved (Figure 4). As expected, the IRs regions were more conserved than the single-copy regions, and the coding regions were less divergent than the non-coding regions. One divergent hotspot region in LSC (psbA-ndhJ) region was identified (Figure 4). The complete plastome sequence divergence of six species, estimated by p-distance, ranged from 0.002 to 0.004 with the average value of 0.0028. We also compared the sequence divergence among the different noncoding regions. Among the 98 noncoding regions, the percentage of variation ranged from 0 to 10.41% with an average of 1.7. Nine noncoding regions had over 4% variability proportions, such as trnH(GUG)-psbA, trnS(GCU)-trnG(UCC), psbZ-trnG(GCC), psaA-ycf3, trnT(UGU)-trnL(UAA), cemA-petA, rps12-clpP, nhdD-psaC, and ndhG-ndhL (Figure 5). These divergence hotspot regions provided abundant information for marker development in phylogenetic analyses of Rehmannia species.

3.6. Selective Pressure Analysis

To estimate selection pressures among Rehmannia species, ratios of nonsynonymous (Ka) versus synonymous (Ks) substitutions were calculated for 79 protein-coding genes, generating 241 pairwise valid combinations (Table S3). The Ka/Ks ratios of the remaining comparisons were not available for Ks = 0. Three genes (accD, rpoA, rpoC2) located in the LSC region had Ka/Ks ratios above 1.0, which might indicate positive selection (Table S3).

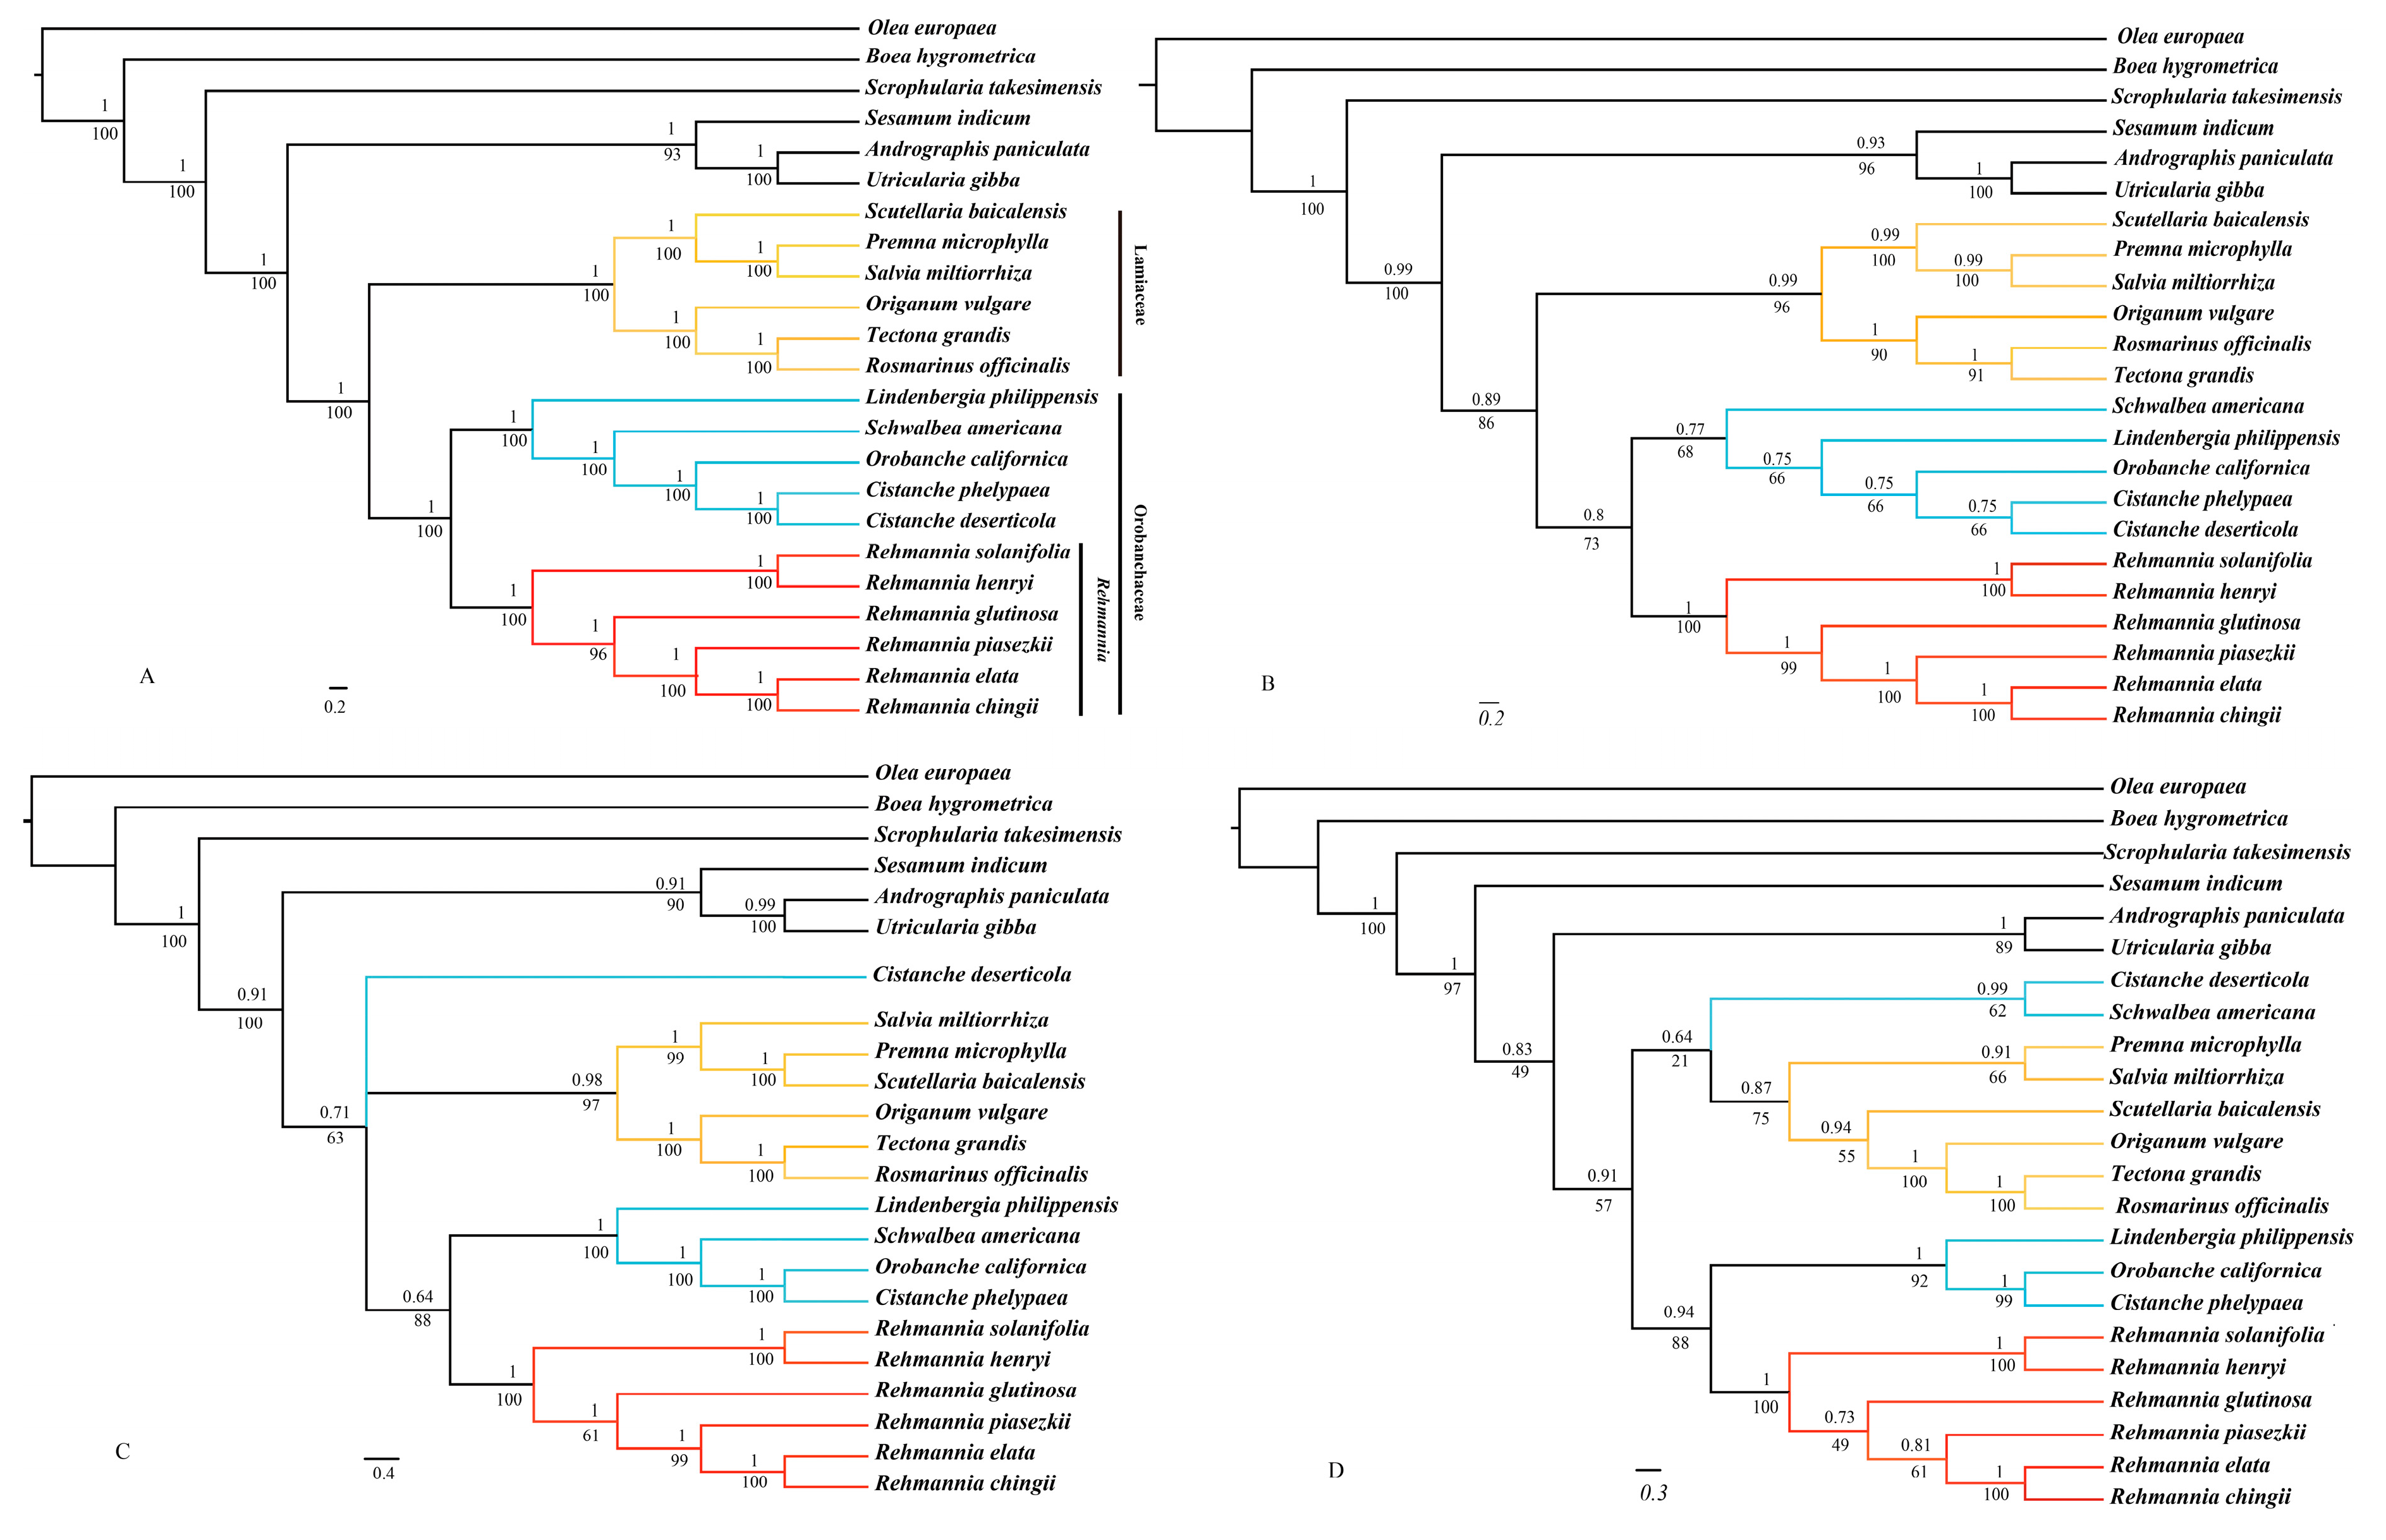
3.7. Phylogenomic Analysis

To identify the phylogenetic position of Rehmannia within the Lamiales, four datasets (PCGs, the LSC region, the SSC region, and the whole plastome with one IR region removed) from the six Rehmannia plastomes and 17 published plastomes were used to reconstruct phylogenetic relationships with O. europaea as an outgroup (Table 2). These 22 ingroups represented seven core families in Lamiales [36]. The phylogenetic tree based on the same dataset using ML and Bayesian method had the identical topological structure with possibly different support values (Figure 6). There were no obvious conflicts between phylogenetic trees built by different partitions of the plastomes. Familial relationships based on the complete plastomes were quite identical to those with rapid evolving cp fragments as previously reported [38]. Along with the increase of sequence length, resolution power of main branches was dramatically improved. Each lineage of the phylogenetic tree with the whole plastome was well-supported with 100% bootstrap value or the Bayesian posterior probability of one (Figure 6A). Phylogenetic status of the parasitic species in Orobanchaceae was contradictive in trees based on PCGs and the LSC/SSC region (Figure 6B–D). But when all plastomes were used, parasitic species formed a monophyletic group sister to Lindenbergia, the non-parasitic species in Orobanchaceae (Figure 6). In all phylogenetic trees, six Rehmannia species were clustered into one monophyletic group sister to other Orobanchaceae taxa with high support value (Figure 6). Trees based on PCGs and the whole plastomes indicated that the Orobanchaceae clade including Rehmannia was sister to the Lamiaceae group. In terms of interspecific relationships of Rehmannia, four phylogenetic trees based on different datasets consistently showed the same topology with moderate to high support values: R. solanifolia and R. henryi were grouped into one branch sister to the remain species. R. glutinosa and R. piasezkii were successive sisters to R. elata-R. chingii clade (Figure 6).

4. Discussion

4.1. Genome Characteristics and Sequence Differences

Here we determined the complete plastid genome sequences from six Rehmannia species using Illumina sequencing technology. Although plastomes were highly conserved in terms of genomic structure and size, the IR/SC junction position variation was observed in Rehmannia. This may be caused by the contraction or expansion of the IR region, a common evolutionary phenomenon in plants [39,40,41]. As for gene contents, the same set of 88 protein-coding genes were shared by six species of Rehmannia species and highly conserved in aspect of gene number, gene function, gene order, and GC-content. Noncanonical start codons observed in this study could be also found in other angiosperms [42] and tree fern plants [43].
The presence of repeats in plastomes, especially in intergenic spacer regions, has been reported in all published angiosperm lineages. Compared with other angiosperm species, the number of repeats in Rehmannia is rather high. In all, more than 400 repeats were detected in Rehmannia plastomes. Previous researches have suggested that repeat sequences may play roles in rearranging sequences and producing variation through illegitimate recombination and slipped-strand mispairing [37,44,45]. However, we detected no structural rearrangements or gene loss-and-gain events in Rehmannia plastomes. But the regions with high divergence were generally rich in repeat units. For example, variable types of repeats could be found within the noncoding region of psbZ-trnG (GCC), psaA-ycf3 and trnS(GCU)-trnG(UCC) gene. Lamiales has the highest diversification rates among angiosperms [46]. Thus the high repeat number in Rehmannia might be ascribed to the increased evolutionary rates.
Sequences of Rehmannia plastomes were conserved in most of regions with sequence identities above 90%. As expected, the noncoding regions exhibited higher divergent levels than the coding regions, and the single copy regions had higher variation than the IR regions. The rpoC2 gene is an exception with lower sequence identity due to various indels, as also reported in grasses [47]. One divergent hotspot region associated with a tRNA cluster in LSC (trnS(GGA)-trnP(GAA)) region was identified, which is inconsonant to other herb plastomes [47,48]. We also found nine highly variable noncoding regions with variation percentages above 2%. Previous studies have also shown that noncoding regions of plastomes could be successfully used for phylogenetic studies in angiosperms [49,50]. Additional work is still necessarily needed to verify whether these highly variable regions could potentially be used as molecular targets for future phylogenetic and/or population genetics studies of Rehmannia species.
Our analysis indicated that three genes (accD, rpoA and rpoC2) were under positive selection, of which, rpoA and rpoC2 were reported in Annonaceae [51]. The accD gene encodes a plastid-coded subunit of heteromeric acetyl-CoA carboxylase (ACCase), a key enzyme involved in fatty acid biosynthesis in plants [52]. The genes rpoA and rpoC2 encode α and β” subunit of plastid-encoded plastid RNA polymerase (PEP), respectively, a key protein responsible for most photosynthetic gene expression [53]. Field works and photosynthetic physiological study suggested that the six species of Rehmannia might have divergent habitats and adapt to different light intensity (unpublished data). These genes experienced natural selection might play an important role in the evolution and divergence of Rehmannia.

4.2. Phylogenetic Implications

Rehmannia was traditionally placed in Scrophylariaceae s.l. In our study, phylogenetic trees based on four plastome datasets generated similar topological structures except for the SSC dataset, possibly due to fewer informative sites than others. All Rehmannia species were clustered into a monophyletic group with high support value (BI = 1, BS = 100%), and sister to the clade of the parasitic Orobanchaceae species and Lindenbergia philippehsis rather than a genus of Scrophulariaceae. Chloroplast fragments analyses also suggested that Rehmannia, together with Triaenophora, represented the branch sister to Orobanchaceae s.l (including Lindenbergia), or a new familial clade [5]. The phylogenetic placement of Rehmannia-Orobanchaceae clade in Lamiales remains uncertain because of the contradictive results of this clade and its related taxa of Paulowniaceae and Phrymaceae from cp fragments data [5,38]. For the lack of plastome information of Paulowniaceae and Phrymaceae species, the status of Rehmannia-Orobanchaceae is still unresolved in our study. But familial relationships of Lamiales taxa in this study were definite and identical to those verified by the rapid evolving cp gene fragments [38]. Therefore, analyses of the entire plastomes significantly contribute to species identification and phylogenetic studies of angiosperms [14,54,55].
Recent studies using chloroplast or nuclear gene fragments indicated that two pairs of species groups, R. elata-R. piasezkii, R. glutinosa-R. solanifolia, had completely identical sequences, respectively and could be treated as two species [7,9,10]. R. chingii [5] or R. piasezkii [7,8] were considered as the basal taxon of the genus. But our phylogenetic analyses of Rehmannia plastomes were inconsistent with any of these works, inferring all Rehmannia taxa as separate species (Figure 6). This might be ascribed to the insufficient informative characters of cp/nuclear gene fragments generating the phylogenetic trees with low support values. Of course, the entire plastomes with massive characters may also result in strong systematic biases for limited sampling [56,57,58]. In future, we plan to analyze plastomes at population level to elucidate the phylogenetic relationships of Rehmannia species. These comparative genomic analyses will not only provide insights into the chloroplast genome evolution of Rehmannia, but also offer valuable genetic markers for population phylogenomic study of Rehmannia and its close lineages.

Supplementary Materials

The following supplementary materials can be found at www.mdpi.com/2073-4425/8/3/103/s1, Table S1: Primers used for gap closure and rpoC2 gene verification; Table S2: Repetitive sequence statistics; Table S3: Ka/Ks ratio between pairwise of species protein coding sequences in six Rehmannia species; Figure S1: Alignment of rpoC2 fragments from all six species of Rehmannia. Large indels were detected in the rpoC2 gene, which cause the gene size vary from 2916 bp to 4185 bp among the six species; Figure S2: The Mauve alignment between plastomes of Arabidopsis thaliana and Rehmannia species (A) and between those of A. thaliana and core Lamiales taxa (B).

Acknowledgments

This work was financially supported by the National Natural Science Foundation of China (31670219, 31370353), the Natural Science Basic Research Plan in Shaanxi Province, China (2015JM3106), and the Shaanxi Provincial Education Department (11JS093).

Author Contributions

Zhan-Lin Liu and Shuyun Zeng conceived and designed the experiments. Shuyun Zeng, Tao Zhou, Kai Han, and Yanci Yang performed the experiments and analyzed the data. Jianhua Zhao prepared the samples. Shuyun Zeng wrote the paper. Zhan-Lin Liu and Tao Zhou help to revise the paper. All authors read and approved the final manuscript.

Conflicts of Interest

The authors declare no conflict of interest.

References

  1. Rix, M. The genus Rehmannia. Plantsman 1987, 8, 193–195. [Google Scholar]
  2. Olmstead, R.G.; DePamphilis, C.W.; Wolfe, A.D.; Young, N.D.; Elisons, W.J.; Reeves, P.A. Disintegration of the Scrophulariaceae. Am. J. Bot. 2001, 88, 348–361. [Google Scholar] [CrossRef] [PubMed]
  3. The Angiosperm Phylogeny Group. An update of the Angiosperm Phylogeny Group classification for the orders and families of flowering plants: APG II. Bot. J. Linn. Soc. 2003, 141, 399–436. [Google Scholar]
  4. The Angiosperm Phylogeny Group. An update of the Angiosperm Phylogeny Group classification for the orders and families of flowering plants: APG IV. Bot. J. Linn. Soc. 2016, 181, 1–20. [Google Scholar]
  5. Xia, Z.; Wang, Y.-Z.; Smith, J.F. Familial placement and relations of Rehmannia and Triaenophora (Scrophulariaceae s.l.) inferred from five gene regions. Am. J. Bot. 2009, 96, 519–530. [Google Scholar] [CrossRef] [PubMed]
  6. Reveal, J.L.; Chase, M.W. APG III: Bibliographical Information and Synonymy of Magnoliidae. Phytotaxa 2011, 19, 64. [Google Scholar] [CrossRef]
  7. Huang, J.; Zeng, S.-Y.; Zhao, J.-H.; Han, K.; Li, J.; Li, Z.; Liu, Z.-L. Genetic variation and phylogenetic relationships among Rehmannia (Scrophulariaceae) species as revealed by a novel set of single-copy nuclear gene markers. Biochem. Syst. Ecol. 2016, 66, 43–49. [Google Scholar] [CrossRef]
  8. Liu, Z.-L.; Li, J.-F. Molecular phylogeny analysis of Rehmannia. Acta Bot. Bor. Occid. Sin. 2014, 34, 77–82. [Google Scholar]
  9. Li, X.; Li, J. Morphology characters of leaf epidermis of the genera Rehmannia and Triaenophora. J. Plant Sci. 2006, 24, 559–564. [Google Scholar]
  10. Yan, K.; Zhao, N.; Li, H.Q. Systematic relationships among Rehmannia (Scrophulariaceae) species. Acta Bot. Boreal. Occident Sin. 2007, 27, 1112–1120. [Google Scholar]
  11. Sugiura, M. The chloroplast genome. Plant Mol. Biol. 1992, 19, 149–168. [Google Scholar] [CrossRef] [PubMed]
  12. Bewick, A.J.; Chain, F.J.J.; Heled, J.; Evans, B.J. The Pipid Root. Syst. Biol. 2012, 61, 913–926. [Google Scholar] [CrossRef] [PubMed]
  13. Carbonell-Caballero, J.; Alonso, R.; Ibañez, V.; Terol, J.; Talon, M.; Dopazo, J. A Phylogenetic Analysis of 34 Chloroplast Genomes Elucidates the Relationships between Wild and Domestic Species within the Genus Citrus. Mol. Biol. Evol. 2015, 32, 2015–2035. [Google Scholar] [CrossRef] [PubMed]
  14. Jansen, R.K.; Cai, Z.; Raubeson, L.A.; Daniell, H.; dePamphilis, C.W.; Leebens-Mack, J.; Müller, K.F.; Guisinger-Bellian, M.; Haberle, R.C.; Hansen, A.K.; et al. Analysis of 81 genes from 64 plastid genomes resolves relationships in angiosperms and identifies genome-scale evolutionary patterns. Proc. Natl. Acad. Sci. USA 2007, 104, 19369–19374. [Google Scholar] [CrossRef] [PubMed]
  15. Uribe-Convers, S.; Duke, J.R.; Moore, M.J.; Tank, D.C. A Long PCR–Based Approach for DNA Enrichment Prior to Next-Generation Sequencing for Systematic Studies. Appl. Plant Sci. 2014, 2. [Google Scholar] [CrossRef] [PubMed]
  16. Qiao, J.; Cai, M.; Yan, G.; Wang, N.; Li, F.; Chen, B.; Gao, G.; Xu, K.; Li, J.; Wu, X. High-throughput multiplex cpDNA resequencing clarifies the genetic diversity and genetic relationships among Brassica napus, Brassica rapa and Brassica oleracea. Plant Biotechnol. J. 2016, 14, 409–418. [Google Scholar] [CrossRef] [PubMed]
  17. Ruhsam, M.; Rai, H.S.; Mathews, S.; Ross, T.G.; Graham, S.W.; Raubeson, L.A.; Mei, W.; Thomas, P.I.; Gardner, M.F.; Ennos, R.A.; et al. Does complete plastid genome sequencing improve species discrimination and phylogenetic resolution in Araucaria? Mol. Ecol. Resour. 2015, 15, 1067–1078. [Google Scholar] [CrossRef] [PubMed]
  18. Sandbrink, J.M.; Vellekoop, P.; Van Ham, R.; Van Brederode, J. A method for evolutionary studies on RFLP of chloroplast DNA, applicable to a range of plant species. Biochem. Syst. Ecol. 1989, 17, 45–49. [Google Scholar] [CrossRef]
  19. Doyle, J.J. A rapid DNA isolation procedure for small quantities of fresh leaf tissue. Phytochem. Bull. 1987, 19, 11–15. [Google Scholar]
  20. Zerbino, D.R.; Birney, E. Velvet: Algorithms for de novo short read assembly using de Bruijn graphs. Genome Res. 2008, 18, 821–829. [Google Scholar] [CrossRef] [PubMed]
  21. Bankevich, A.; Nurk, S.; Antipov, D.; Gurevich, A.A.; Dvorkin, M.; Kulikov, A.S.; Lesin, V.M.; Nikolenko, S.I.; Pham, S.; Prjibelski, A.D.; et al. SPAdes: A New Genome Assembly Algorithm and Its Applications to Single-Cell Sequencing. J. Comput. Biol. 2012, 19, 455–477. [Google Scholar] [CrossRef] [PubMed]
  22. Boetzer, M.; Henkel, C.V.; Jansen, H.J.; Butler, D.; Pirovano, W. Scaffolding pre-assembled contigs using SSPACE. Bioinformatics 2011, 27, 578–579. [Google Scholar] [CrossRef] [PubMed]
  23. Hahn, C.; Bachmann, L.; Chevreux, B. Reconstructing mitochondrial genomes directly from genomic next-generation sequencing reads—A baiting and iterative mapping approach. Nucleic Acids Res. 2013, 41, e129. [Google Scholar] [CrossRef] [PubMed]
  24. Lohse, M.; Drechsel, O.; Kahlau, S.; Bock, R. OrganellarGenomeDRAW—A suite of tools for generating physical maps of plastid and mitochondrial genomes and visualizing expression data sets. Nucleic Acids Res. 2013, 41, W575–W581. [Google Scholar] [CrossRef] [PubMed]
  25. Katoh, K.; Standley, D.M. MAFFT Multiple Sequence Alignment Software Version 7: Improvements in Performance and Usability. Mol. Biol. Evol. 2013, 30, 772–780. [Google Scholar] [CrossRef] [PubMed]
  26. Frazer, K.A.; Pachter, L.; Poliakov, A.; Rubin, E.M.; Dubchak, I. VISTA: Computational tools for comparative genomics. Nucleic Acids Res. 2004, 32 (Suppl. 2), W273–W279. [Google Scholar] [CrossRef] [PubMed]
  27. Tamura, K.; Stecher, G.; Peterson, D.; Filipski, A.; Kumar, S. MEGA6: Molecular Evolutionary Genetics Analysis Version 6.0. Mol. Biol. Evol. 2013, 30, 2725–2729. [Google Scholar] [CrossRef] [PubMed]
  28. Zhang, Y.-J.; Ma, P.-F.; Li, D.-Z. High-Throughput Sequencing of Six Bamboo Chloroplast Genomes: Phylogenetic Implications for Temperate Woody Bamboos (Poaceae: Bambusoideae). PLoS ONE 2011, 6, e20596. [Google Scholar] [CrossRef] [PubMed]
  29. Kurtz, S.; Choudhuri, J.V.; Ohlebusch, E.; Schleiermacher, C.; Stoye, J.; Giegerich, R. REPuter: The manifold applications of repeat analysis on a genomic scale. Nucleic Acids Res. 2001, 29, 4633–4642. [Google Scholar] [CrossRef] [PubMed]
  30. Benson, G. Tandem repeats finder: A program to analyze DNA sequences. Nucleic Acids Res. 1999, 27, 573–580. [Google Scholar] [CrossRef] [PubMed]
  31. Yang, Z. PAML 4: Phylogenetic Analysis by Maximum Likelihood. Mol. Biol. Evol. 2007, 24, 1586–1591. [Google Scholar] [CrossRef] [PubMed]
  32. Darling, A.E.; Mau, B.; Perna, N.T. progressiveMauve: Multiple Genome Alignment with Gene Gain, Loss and Rearrangement. PLOS ONE 2010, 5, e11147. [Google Scholar] [CrossRef] [PubMed]
  33. Stamatakis, A. RAxML-VI-HPC: Maximum likelihood-based phylogenetic analyses with thousands of taxa and mixed models. Bioinformatics 2006, 22, 2688–2690. [Google Scholar] [CrossRef] [PubMed]
  34. Ronquist, F.; Huelsenbeck, J.P. MrBayes 3: Bayesian phylogenetic inference under mixed models. Bioinformatics 2003, 19, 1572–1574. [Google Scholar] [CrossRef] [PubMed]
  35. Posada, D.; Buckley, T.R. Model Selection and Model Averaging in Phylogenetics: Advantages of Akaike Information Criterion and Bayesian Approaches over Likelihood Ratio Tests. Syst. Biol. 2004, 53, 793–808. [Google Scholar] [CrossRef] [PubMed]
  36. Posada, D.; Crandall, K.A. Modeltest: Testing the model of DNA substitution. Bioinformatics 1998, 14, 817–818. [Google Scholar] [CrossRef] [PubMed]
  37. Timme, R.E.; Kuehl, J.V.; Boore, J.L.; Jansen, R.K. A comparative analysis of the Lactuca and Helianthus (Asteraceae) plastid genomes: Identification of divergent regions and categorization of shared repeats. Am. J. Bot. 2007, 94, 302–312. [Google Scholar] [CrossRef] [PubMed]
  38. Schäferhoff, B.; Fleischmann, A.; Fischer, E.; Albach, D.C.; Borsch, T.; Heubl, G.; Müller, K.F. Towards resolving Lamiales relationships: Insights from rapidly evolving chloroplast sequences. BMC Evol. Biol. 2010, 10, 352. [Google Scholar] [CrossRef] [PubMed]
  39. Hansen, D.R.; Dastidar, S.G.; Cai, Z.; Penaflor, C.; Kuehl, J.V.; Boore, J.L.; Jansen, R.K. Phylogenetic and evolutionary implications of complete chloroplast genome sequences of four early-diverging angiosperms: Buxus (Buxaceae), Chloranthus (Chloranthaceae), Dioscorea (Dioscoreaceae), and Illicium (Schisandraceae). Mol. Phylogenet. Evol. 2007, 45, 547–563. [Google Scholar] [CrossRef] [PubMed]
  40. Huang, H.; Shi, C.; Liu, Y.; Mao, S.-Y.; Gao, L.-Z. Thirteen Camelliachloroplast genome sequences determined by high-throughput sequencing: Genome structure and phylogenetic relationships. BMC Evol. Biol. 2014, 14, 151. [Google Scholar] [CrossRef] [PubMed]
  41. Kim, K.J.; Lee, H.L. Complete chloroplast genome sequences from Korean ginseng (Panax schinseng Nees) and comparative analysis of sequence evolution among 17 vascular plants. DNA Res. 2004, 11, 247–261. [Google Scholar] [CrossRef] [PubMed]
  42. Bortiri, E.; Coleman-Derr, D.; Lazo, G.R.; Anderson, O.D.; Gu, Y.Q. The complete chloroplast genome sequence of Brachypodium distachyon: Sequence comparison and phylogenetic analysis of eight grass plastomes. BMC Res. Notes 2008, 1, 61. [Google Scholar] [CrossRef] [PubMed]
  43. Cahoon, A.B.; Sharpe, R.M.; Mysayphonh, C.; Thompson, E.J.; Ward, A.D.; Lin, A. The complete chloroplast genome of tall fescue (Lolium arundinaceum; Poaceae) and comparison of whole plastomes from the family Poaceae. Am. J. Bot. 2010, 97, 49–58. [Google Scholar] [CrossRef] [PubMed]
  44. Asano, T.; Tsudzuki, T.; Takahashi, S.; Shimada, H.; Kadowaki, K. Complete nucleotide sequence of the sugarcane (Saccharum officinarum) chloroplast genome: A comparative analysis of four monocot chloroplast genomes. DNA Res. 2004, 11, 93–99. [Google Scholar] [CrossRef] [PubMed]
  45. Cavalier-Smith, T. Chloroplast evolution: Secondary symbiogenesis and multiple losses. Curr. Biol. 2002, 12, R62–R64. [Google Scholar] [CrossRef]
  46. Zwickl, D.J.; Hillis, D.M. Increased taxon sampling greatly reduces phylogenetic error. Syst. Biol. 2002, 51, 588–598. [Google Scholar] [CrossRef] [PubMed]
  47. Diekmann, K.; Hodkinson, T.R.; Wolfe, K.H.; van den Bekerom, R.; Dix, P.J.; Barth, S. Complete Chloroplast Genome Sequence of a Major Allogamous Forage Species, Perennial Ryegrass (Lolium perenne L.). DNA Res. 2009, 16, 165–176. [Google Scholar] [CrossRef] [PubMed]
  48. Maier, R.M.; Neckermann, K.; Igloi, G.L.; Kössel, H. Complete Sequence of the Maize Chloroplast Genome: Gene Content, Hotspots of Divergence and Fine Tuning of Genetic Information by Transcript Editing. J. Mol. Biol. 1995, 251, 614–628. [Google Scholar] [CrossRef] [PubMed]
  49. Nie, X.; Lv, S.; Zhang, Y.; Du, X.; Wang, L.; Biradar, S.S.; Tan, X.; Wan, F.; Weining, S. Complete Chloroplast Genome Sequence of a Major Invasive Species, Crofton Weed (Ageratina adenophora). PLoS ONE 2012, 7, e36869. [Google Scholar] [CrossRef] [PubMed]
  50. Wu, F.-H.; Chan, M.-T.; Liao, D.-C.; Hsu, C.-T.; Lee, Y.-W.; Daniell, H.; Duvall, M.; Lin, C.-S. Complete chloroplast genome of Oncidium Gower Ramsey and evaluation of molecular markers for identification and breeding in Oncidiinae. BMC Plant Biol. 2010, 10, 68. [Google Scholar] [CrossRef] [PubMed]
  51. Blazier, J.C.; Ruhlman, T.A.; Weng, M.-L.; Rehman, S.K.; Sabir, J.S. M.; Jansen, R.K. Divergence of RNA polymerase α subunits in angiosperm plastid genomes is mediated by genomic rearrangement. Sci. Rep. 2016, 6, 24595. [Google Scholar] [CrossRef] [PubMed]
  52. Nakkaew, A.; Chotigeat, W.; Eksomtramage, T.; Phongdara, A. Cloning and expression of a plastid-encoded subunit, beta-carboxyltransferase gene (accD) and a nuclear-encoded subunit, biotin carboxylase of acetyl-CoA carboxylase from oil palm (Elaeis guineensis Jacq.). Plant Sci. 2008, 175, 497–504. [Google Scholar] [CrossRef]
  53. Hajdukiewicz, P.T.J.; Allison, L.A.; Maliga, P. The two RNA polymerases encoded by the nuclear and the plastid compartments transcribe distinct groups of genes in tobacco plastids. EMBO J 1997, 16, 4041–4048. [Google Scholar] [CrossRef] [PubMed]
  54. Leebens-Mack, J.; Raubeson, L.A.; Cui, L.Y.; Kuehl, J.V.; Fourcade, M.H.; Chumley, T.W.; Boore, J.L.; Jansen, R.K.; dePamphilis, C.W. Identifying the basal angiosperm node in chloroplast genome phylogenies: Sampling one's way out of the Felsenstein zone. Mol. Biol. Evol. 2005, 22, 1948–1963. [Google Scholar] [CrossRef] [PubMed]
  55. Moore, M.J.; Bell, C.D.; Soltis, P.S.; Soltis, D.E. Using plastid genome-scale data to resolve enigmatic relationships among basal angiosperms. Proc. Natl. Acad. Sci. USA 2007, 104, 19363–19368. [Google Scholar] [CrossRef] [PubMed]
  56. Parks, M.; Cronn, R.; Liston, A. Increasing phylogenetic resolution at low taxonomic levels using massively parallel sequencing of chloroplast genomes. BMC Biol. 2009, 7, 84. [Google Scholar] [CrossRef] [PubMed]
  57. Suzuki, Y.; Glazko, G.V.; Nei, M. Overcredibility of molecular phylogenies obtained by Bayesian phylogenetics. Proc. Natl. Acad. Sci. USA 2002, 99, 16138–16143. [Google Scholar] [CrossRef] [PubMed]
  58. Wortley, A.H.; Rudall, P.J.; Harris, D.J.; Scotland, R.W. How much data are needed to resolve a difficult phylogeny? Case study in Lamiales. Syst. Biol. 2005, 54, 697–709. [Google Scholar] [CrossRef] [PubMed]
Figure 1. Gene map of Rehmannia chloroplast genomes. Genes shown outside the outer circle are transcribed clockwise and those inside are transcribed counterclockwise. Genes belonging to different functional groups are color coded. Dashed area in the inner circle indicates the GC content of the chloroplast genome. ORF: open reading frame.
Genes 08 00103 g001
Figure 2. Comparison of the borders of large single-copy (LSC), small single-copy (SSC), and inverted repeat (IR) regions among the chloroplast genomes of six Rehmannia species. The location of two parts of inverted repeat region (IRA and IRB) was referred to Figure 1.
Genes 08 00103 g002
Figure 3. Analyses of repeated sequences in Rehmannia plastomes. (A) Number of three repeat types in the six chloroplast genomes; (B) Frequency of repeat sequences by length; (C) Frequency of repeat types; (D) Location of the all repeats from six species.
Genes 08 00103 g003
Figure 4. Visualization of alignment of the six Rehmannia species chloroplast genome sequences. VISTA-based identity plots showed sequence identity of six sequenced chloroplast genomes with R. glutinosa as a reference. The sequence similarity of the aligned regions is shown as horizontal bars indicating the average percent identity between 50% and 100% (shown on the y-axis of the graph). The x-axis represents the coordinate in the chloroplast genome. The divergent hotspot region is indicated in the chloroplast genome. Genome regions are color coded as protein coding, rRNA coding, tRNA coding or conserved noncoding sequences (CNS).
Genes 08 00103 g004
Figure 5. Percentage of variable characters in aligned noncoding regions of the six plastid genomes.
Genes 08 00103 g005
Figure 6. Phylogenetic trees of 23 species as determined from different data partitions. Support values are shown for nodes as Bayesian inference posterior probability (above branches)/maximum likelihood bootstrap (below branches). Branch lengths were calculated through Bayesian analysis, and scale bar denotes substitutions per site. (A) the whole chloroplast genomes; (B) Protein coding genes; (C) LSC region; (D) SSC region. Red represents Rehmannia species; Blue represents other species of Orobanchaceae; Orange represents Lamiaceae species.
Genes 08 00103 g006
Table 1. Sample information of six Rehmannia species in this study.
SpeciesLocationLongitudeLatitudeClean readsMean coverage
R. glutinosaYulin, Shaanxi, China110.5737.773,721,8461583.5×
R. henryiYichang, Hubei, China10.6831.3131,171,142119.6×
R. elataAmsterdam, Holland4.8852.3626,976,944137.1×
R. piasezkiiShiquan, Shaanxi, China108.6332.0426,815,865125.3×
R. chingiiLishui, Zhejiang, China120.1528.6425,724,095131.5×
R. solanifoliaChengkou, Chongqing, China108.621.5429,076,484141.8×
Table 2. Summary of chloroplast (cp) genomic data of all Lamiales taxa used in the study. The numbers in parenthesis indicate the genes duplicated in the inverted repeat (IR) regions.
TaxonSpeciesGenBankLengthLSCSSCIRGenePCGtRNArRNAGC (%)
OrobanchaceaeRehmannia glutinosa (Gaetn.) Libosch. ex Fisch. et Mey.KX6361571536228460517579257191338837 (7)8 (4)38
Rehmannia chingii Li.KX4263471540558496617675257071338837 (7)8 (4)38
Rehmannia henryi N.E. BrownKX6361581538908483717679256871338837 (7)8 (4)37.9
Rehmannia elata N.E. BrownKX6361611537728478817652256661338837 (7)8 (4)38
Rehmannia piasezkii Maxim.KX6361601539528489917674256761338837 (7)8 (4)37.9
Rehmannia solanifolia Tsoong et ChinKX6361591539898483917680257351338837 (7)8 (4)37.9
Cistanche phelypaea (L.) CoutinhoNC_0256429438032648864626543993042 (9)8 (4)36.6
Cistanche deserticola MaKC_128846102657491308819223541063136 (7)8 (4)36.8
Orobanche californica Cham. & Schltdl.NC_025651120840620008516251621234541 (6)8 (4)36.7
Lindenbergia philippensis (Cham.) Benth.NC_0228591551038559417885258121378537 (7)8 (4)37.8
Schwalbea americana L.HG_7388661609108475618899286271288237 (7)8 (4)38.1
LamiaceaeRosmarinus officinalis L.KR_2325661524628335517969255691348637 (7)8 (4)38
Salvia miltiorrhiza Bge.NC_0200981539538531817741254471348637 (7)8 (4)37.9
Origanum vulgare L.JX_8800221519358313517727255331348637 (7)8 (4)37.8
Tectona grandis L.F.NC_0204311513288269517555255391338737 (7)8 (4)38
Premna microphyllaTurczNC_0262911552938607817689257631338737 (7)8 (4)37.9
Scutellaria baicalensis GeorgiKR_2331631527318394617477256541328736 (7)8 (4)38.4
ScrophulariaceaeScrophularia takesimensis NakaiKM_5909831524258553117938234781328836 (6)8 (4)38.1
GesneriaceaeBoea hygrometrica (Bunge) R. Br.NC_0164681534938469817903254461458536 (7)8 (4)37.6
AcanthaceaeAndrographis paniculata (Burm. f.) NeesNC_0224511502498245917110253401328737 (7)8 (4)38.3
LentibulariaceaeUtricularia gibba L.NC_0214491521138181814187279041338737 (6)8 (4)37.6
PedaliaceaeSesamum indicum Linn.JN_6377661533248517017872251411348737 (7)8 (4)38.2
OleaceaeOlea europaea L.GU_9318181558898661417791257421338737 (7)8 (4)37.8
LSC: large single-copy; SSC: small single-copy; PCG: protein coding genes; tRNA: transfer RNA; rRNA: ribosomal RNA
Table 3. Gene list of plastomes of six Rehmannia species.
CategoryGroupName
Photosynthesis related genesRubiscorbcL
Photosystem IpsaA, psaB, psaC, psaI, psaJ
Assembly/stability of photosystem I** ycf3
Photosystem IIpsbA, psbB, psbC, psbD, psbE, psbF, psbH, psbI, psbJ, psbK, psbL, psbM, psbN, psbT, psbZ
ATP synthaseatpA, atpB, atpE, * atpF, atpH, atpI
cytochrome b/f complexpetA, * petB, * petD, petG, petL, petN
cytochrome c synthesisccsA
NADPH dehydrogenase* ndhA, *,a ndhB, ndhC, ndhD, ndhE, ndhF, ndhG, ndhH, ndhI, ndhJ, ndhK
Transcription and translation related genestranscriptionrpoA, rpoB, *rpoC1, rpoC2
ribosomal proteinsrps2, rps3, rps4, a rps7, rps8, rps11, ** rps12, rps14, rps15, *rps16, rps18, rps19, *,arpl2, rpl14, * rpl16, rpl20, rpl22, a rpl23, rpl32, rpl33, rpl36
translation initiation factorinfA
RNA genesribosomal RNAarrn5, a rrn4.5, a rrn16, a rrn23
transfer RNA*,a trnA-UGC, # trnA-ACG, trnL-UAG, atrnA-GUU, *,atrnI-GAU, a trnV-(GAC), a trnL-CAA, a trnH-CAU, trnP-UGG, trnT-CCA, trnM-CAU, * trnV-UAC, trnP-GAA, * trnL-UAA, trnT-UGU, trnS-GGA, trnfM-CAU, trnG-GCC, trnS-UGA, trnT-GGU, trnG-UUC, trnT-GUA, trnA-GUC, trnC-GCA, trnA-UCU, * trnG-UCC, trnS-GCU, trnG-UUG, * trnL -UUU, trnH-GUG, trnA-GUU
Other genesRNA processingmatK
carbon metabolismcemA
fatty acid synthesisaccD
proteolysis** clpP
Genes of unknown functionconserved reading framesa ycf1, a ycf2, ycf4, a ycf15
* gene with one intron, ** gene with two introns, a gene with two copies.

