Article

Fine Mapping and Transcriptome Analysis Reveal Candidate Genes Associated with Hybrid Lethality in Cabbage (Brassica Oleracea)

Institute of Vegetables and Flowers, Chinese Academy of Agricultural Sciences, Key Laboratory of Biology and Genetic Improvement of Horticultural Crops, Ministry of Agriculture, No. 12 Zhongguancun South Street, Beijing 100081, China
*
Authors to whom correspondence should be addressed.
Genes 2017, 8(6), 147; https://doi.org/10.3390/genes8060147
Submission received: 4 April 2017 / Revised: 8 May 2017 / Accepted: 15 May 2017 / Published: 5 June 2017
(This article belongs to the Special Issue Evolution and Biodiversity of the Plant Genome Architecture)

Abstract

:
Hybrid lethality is a deleterious phenotype that is vital to species evolution. We previously reported hybrid lethality in cabbage (Brassica oleracea) and performed preliminary mapping of related genes. In the present study, the fine mapping of hybrid lethal genes revealed that BoHL1 was located on chromosome C1 between BoHLTO124 and BoHLTO130, with an interval of 101 kb. BoHL2 was confirmed to be between insertion-deletion (InDels) markers HL234 and HL235 on C4, with a marker interval of 70 kb. Twenty-eight and nine annotated genes were found within the two intervals of BoHL1 and BoHL2, respectively. We also applied RNA-Seq to analyze hybrid lethality in cabbage. In the region of BoHL1, seven differentially expressed genes (DEGs) and five resistance (R)-related genes (two in common, i.e., Bo1g153320 and Bo1g153380) were found, whereas in the region of BoHL2, two DEGs and four R-related genes (two in common, i.e., Bo4g173780 and Bo4g173810) were found. Along with studies in which R genes were frequently involved in hybrid lethality in other plants, these interesting R-DEGs may be good candidates associated with hybrid lethality. We also used SNP/InDel analyses and quantitative real-time PCR to confirm the results. This work provides new insight into the mechanisms of hybrid lethality in cabbage.

1. Introduction

Hybrid lethality (HL), a postzygotic reproductive isolation phenomenon, plays important roles in species formation and integrity [1]. In plants, this type of genetic incompatibility occurs in the seedling or adult stage and is often associated with symptoms such as wilting, chlorosis, stunted growth, and lethality [2]. In recent years, HL cases have been reported in interspecific and intraspecific plant hybrids involving taxa such as wheat (Triticum aestivum), tobacco (Nicotiana tabacum), and cotton (Gossypium) [3,4,5,6]. HL not only represents a barrier to interspecific hybridization, but also remains a serious adverse event in the agricultural exploitation of wild species as a genetic resource for breeding [1,7]. Thus, studies on HL can help us better understand the evolution of species and improve crop breeding.
Several scholars have proposed hybrid lethality genetic models. These include the Dobzhansky-Muller (DM) genetic model, which is the most widely accepted model, and a dual site and unit interaction model, both of which preliminarily explain the molecular mechanism of HL [8,9]. Research on HL has been conducted in Arabidopsis [10,11] and lettuce [12]. This research has demonstrated that a specific allelic combination at two interacting loci is responsible for HL and that HL results from combinations of resistance (R) proteins that activate the autoimmune response, leading to lethality. These findings support the DM genetic model.
Cabbage is an important vegetable crop and is cultivated worldwide. Previously, we identified HL in cabbage, and the genetic analyses supported a DM model for the HL genes BoHL1 and BoHL2 [13,14]. The recent publication of the ‘02-12’ [15] and ‘TO1000’ [16] Brassica oleracea reference genomes has enhanced cabbage studies. Using the ‘02-12’ reference genome, Hu et al. performed genetic analysis and mapping of HL genes in cabbage and reported that BoHL1 and BoHL2 were on chromosome C01 of cabbage line 09-211 and chromosome C04 of cabbage line 09-222, respectively [14].
However, we found some problems in subsequent fine-mapping work that were likely caused by errors in the genome assembly of ‘02-12’ [17]. Thus, in the current study, we finely mapped the HL genes of cabbage based on the ‘TO1000’ reference genome using additional InDel markers and newly built segregating populations. RNA-Seq, an effective approach for detecting differentially expressed genes (DEGs) over a broad dynamic range [18], was also adopted to obtain a better understanding of the molecular basis of HL in cabbage. After combining the results of mapping and transcriptome analysis, we identified genes that are candidates for BoHL1 and BoHL2, which are involved in HL in cabbage.

2. Materials and Methods

2.1. Plant Materials

Six cabbage lines were used in this study: (1) 09-211 and 09-222, carrying the HL genes BoHL1 and BoHL2, respectively, were used. The hybrid plants of 09-211 and 09-222 appeared normal at the initial growth stage, but exhibited 100% seedling mortality at a later stage of growth (Figure 7A). However, the parents and F1 hybrids from crosses between other inbred lines (87-534, 11-196, 96-109, and 96-100) all produced normal plants. Moreover, according to the DM model, the genotypes of 09-211, 09-222, and the F1 hybrid (09-222 × 09-211) were ‘AAbb’, ‘aaBB’, and ‘AaBb’, respectively; (2) Four other inbred lines, 87-534, 11-196, 96-109, and 96-100, all sharing the same genotype, ‘aabb’, which do not carry any lethality genes, as confirmed by hybrid tests, were also used.
Five descendant populations of three-way cross were employed to map the lethal genes. Two segregating populations, population A (09-211 × 87-534) × 09-222 and population B (09-222 × 87-534) × 09-211, consisting of 300 and 2855 individuals, respectively, were used to map the BoHL1 gene. The segregating population strategies are shown in Figure 1B. The other three segregating populations, population C (09-222 × 87-534) × 09-211, population D (09-222 × 11-196) × 09-211, and population E (09-222 × 96-100) × 09-211, were generated to map the BoHL2 gene. The segregating population strategy is shown in Figure 1C.

2.2. Phenotyping

The lethal symptoms in cabbage performance, e.g., retarded growth, wilting, and chlorosis, gradually appeared; most lethal individuals died at the four-leaf stage, and the remaining ones died before the rosette stage, consistent with that observed by Hu et al. [14]. According to the lethal time, we identified individuals with visually lethal symptoms at the rosette stage (approximately 30 days after germination). The segregation ratios of the descendant populations of three-way cross were analyzed with a Chi-square test using SAS software (SAS Institute, Inc., Cary, NC, USA).

2.3. Genotyping

2.3.1. Genotyping InDel Primer Development

InDel primers were designed using re-sequencing data from 09-211 and 09-222, which were deposited into the NCBI sequence read archive (SRA) under BioSample accessions (SAMN06841129, SAMN06841130). The genomic DNA of the parent lines was subjected to whole-genome re-sequencing using the sequencing-by-synthesis method with ‘TO1000’ as the reference genome. In total, 9.3 Gb of Illumina paired-end reads were generated for both 09-211 and 09-222. Primers were designed as follows: product lengths were 150–250 bp, GC contents were 40–50%, and Tm values were 52–56 °C. Some InDel primers of previous studies [14] were also used to compare and confirm the mapping results.

2.3.2. DNA Extraction

The genomic DNA of all individuals was extracted from young leaves according to the modified CTAB protocol [19]. The concentration of DNA was determined using an ND-1000 (NanoDrop Technologies, Inc., Wilmington, DE, USA) and was diluted to 40–50 ng/μL.

2.3.3. Bulked Segregation Analysis (BSA)

To construct the normal and lethal pools for mapping BoHL1, equal amounts (50 ng/µL) of DNA from each of 12 normal and 12 lethal descendant populations of three-way cross individuals were combined into two single pooled samples for genotyping to perform the BSA [20]. The same BSA strategy was then used to map BoHL2. The polymorphic InDel markers between the parents were used to screen the pools, and the polymorphic markers between the pools were used to examine recombination with all of the normal individuals in the descendant populations of three-way cross.

2.3.4. PCR Amplification and Electrophoresis

The 20 µL PCR mixture consisted of 4 µL of DNA template (40–50 ng/µL), 2 µL of 10 × PCR buffer, 1.6 µL of dNTP, 0.8 µL of each primer (10 µM), 0.4 µL of Taq DNA polymerase (Invitrogen, Shanghai, China) (2.5 U/µL), and 10.4 µL of ddH2O. The reactions were performed in a thermal cycler (Applied Biosystems Inc., Foster City, CA, USA) as follows: 94 °C for 5 min; 35 cycles of 94 °C for 30 s, 55 °C for 30 s, and 72 °C for 45 s; and a final cycle of 72 °C for 10 min. The PCR products were separated by 8% (polyacrylamide gel electrophoresis) PAGE at 160 V for 1.5 h, followed by silver staining [21].

2.4. Sampling, RNA Isolation and RNA-Seq

The F1 hybrids (09-222 × 09-211) were sown in a steady-temperature (25 °C) growth chamber (12 h light and 12 h dark photoperiod, light intensity of 65 μmol/m2/s1). Based on the lethality time, we sampled young leaves at the two-leaf stage before lethality and again when lethality had just begun to appear; the sampled leaves at these two stages were denoted ‘F1_N’ and ‘F1_W’, respectively. Three plants were randomly sampled from each treatment group, with three biological repetitions per treatment. All samples were immediately deep-frozen in liquid nitrogen and stored at −80 °C until use.
Total RNA was extracted using TRIzol reagent (Invitrogen, Carlsbad, CA, USA) according to the manufacturer’s instructions. RNA purity was assessed utilizing a NanoPhotometer spectrophotometer (IMPLEN, Westlake Village, CA, USA). RNA integrity was assessed using the RNA Nano 6000 Assay Kit for the Agilent Bioanalyzer 2100 system (Agilent Technologies, Santa Clara, CA, USA). The cDNA library preparation and sequencing were conducted by the Allwegene Technology Company in Beijing, China. All libraries were sequenced on the Illumina HiSeq 4000TM platform (Illumina, Inc., San Diego, CA, USA). Clean reads were acquired after steps of raw sequence data processing. Before mapping the sequencing reads, adapter sequences were filtered from the raw reads. Low-quality reads (>50% bases with quality scores ≤5) and unknown bases (>10% N bases) were filtered from each dataset to obtain more reliable results. The Trinity program was used for the de novo transcriptome assembly of the high-quality clean reads [22].

2.5. RNA-Seq Data Analysis

We mapped sequencing reads to the ‘TO1000’ reference genome using TopHat [23]. To analyze and optimize the gene structure, the mapped sequencing reads were assembled and compared with known gene sequences using Cufflinks [24]. Gene expression levels were analyzed by employing the fragments per kilobase of exon model per million mapped reads (FPKM) algorithm, a commonly used method to measure the level of gene expression [25]. The DESeq package (ver. 2.1.0) [26] was employed to detect DEGs between the ‘F1_N’ and ‘F1_W’ samples. A false discovery rate (FDR)-adjusted p-value (q-value) ≤ 0.05 was used in this study as the threshold for identifying significant differences in gene expression, with biological repetitions [27]. In addition, all of the detected DEGs were compared with the non-redundant protein (NR) database [28], the cluster of orthologous groups (COG) database [29], the Kyoto encyclopedia of genes and genomes (KEGG) pathway database [30], and the Gene Ontology (GO) database [31]. Lastly, GO seq [32] and KOBAS software [33] programs were used to perform DEG functional classification and enrichment analyses to view the distribution of gene functions.

2.6. Fine-Mapping Results and Candidate Gene Analysis

For each marker, individuals with normal phenotypes and matching normal genotypes were recorded as ‘a’, whereas individuals with normal phenotypes but lethal genotypes were recorded as ‘h’. The Kosambi mapping function was used to calculate the genetic distances between markers [34], and the genetic map was constructed using MapDraw [35].
Since the quality of the ‘TO1000’ reference genome assembly is relatively better than that of the ‘02-12’ reference genome assembly [17], we used the former as the reference, unlike the previous mapping study by Hu et al. [14]. The genes sequence data in the mapping region were downloaded from the ‘TO1000’ reference genome, including the gene ID, gene position, and functional annotation data. These genes were also subjected to GO analysis to identify any interesting genes that might be associated with HL.
To further analyse polymorphisms of these candidate genes between 09-211 and 09-222, the Single-Nucleotide Polymorphisms (SNPs) and InDels in the coding sequence of candidate genes among 09-211, 09-222, and 96-100 were analyzed by re-sequencing data. SNPs and InDels were detected by SAMtools [36] and filtered low-quality (Phred Score < 20) reads. In the candidate genes of BoHL1, SNPs and InDels in the coding sequence of genes were compared between 09-211 with BoHL1, and 09-222 and 96-100 without BoHL1. Additionally, in the candidate genes of BoHL2, SNPs and InDels in the coding sequence of genes were compared between 09-222 with BoHL2, and 09-211 and 96-100 without BoHL2.

2.7. Quantitative Real-Time RT-PCR (qRT-PCR) Validation

All candidate genes were selected for validation using qRT-PCR. The gene-specific primers that were designed according to the gene sequences from the ‘TO1000’ reference genome by Primer Premier software, version 5.0 (Premier Biosoft International, Palo Alto, CA, USA) are listed in Table S1. First-strand cDNA was synthesized using the PrimeScript RT Reagent Kit (TAKARA BIO, Inc., Shiga, Japan). qRT-PCR was performed using SYBR Premix Ex Taq II (Tli RNase HPlus; TAKARA BIO, Inc., Shiga, Japan) on an ABI Prism® 7900HT (Applied Biosystems, Carlsbad, CA, USA) according to the manufacturer’s instructions. The conditions for amplification were as follows: 15 min denaturation at 95 °C; 40 cycles of 95 °C for 10 s and 60 °C for 20 s; and 72 °C for 25 s. Three technical replicates were performed for each gene. The relative changes in gene expression levels were normalized to the expression of the Medicago actin gene (AF044573) and calculated using the 2−ΔΔCT method [37].

3. Results

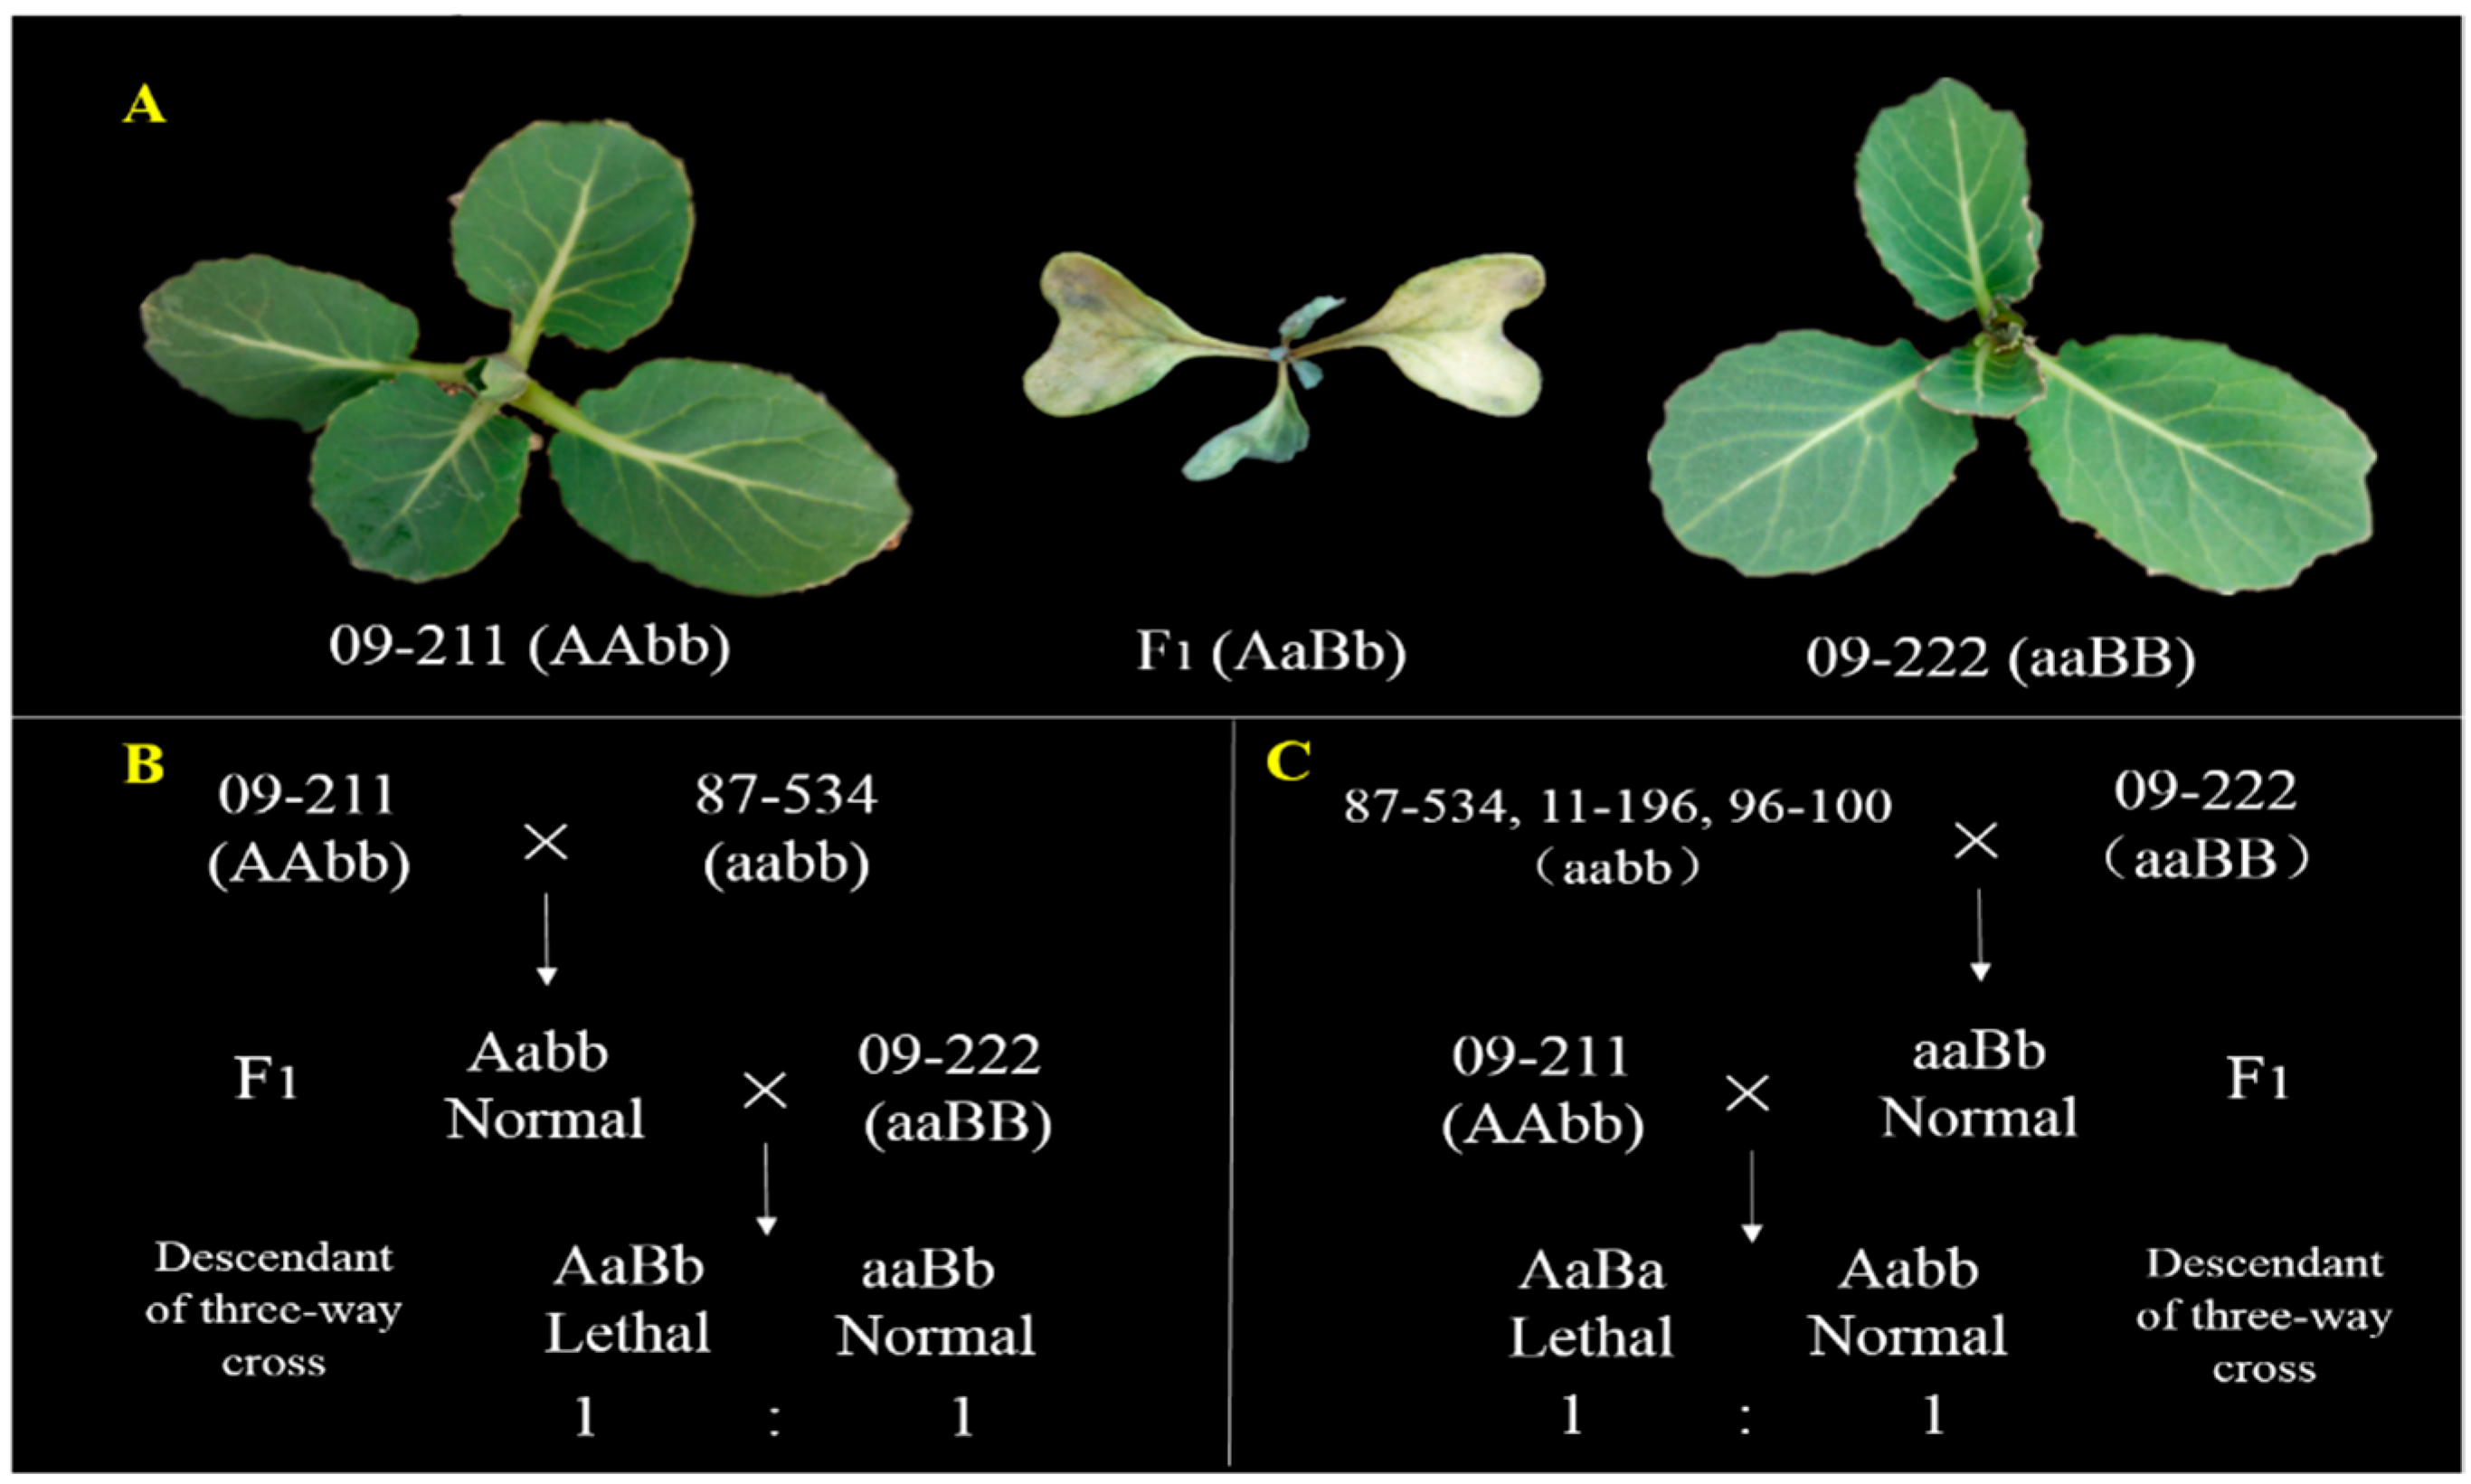
3.1. Genetic Analysis of BoHL1 and BoHL2 with New Populations

In the autumn of 2016, the seedlings of the segregating population were cultivated in the greenhouse. F1 individuals of 09-211 × 87-534, 09-222 × 87-534, 09-222 × 11-196, and 09-222 × 96-100 produced normal plants, but several individuals of five descendant populations of three-way cross presented lethal symptoms (Figure 1A). In population A, 142 of 300 individuals showed lethality, and 158 showed normal growth; the lethality ratio did not differ from 1:1 (χ20.05 = 0.85), as determined by the Chi-square test. Similarly, in segregating population B, 1422 of 2855 individuals showed lethality, whereas the other individuals were normal; the lethality ratio did not differ from 1:1 (χ2 = 0.04), as determined by the Chi-square test. For the other three populations segregating for BoHL2, i.e., populations C, D, and E, the lethality ratio was also confirmed to be 1:1, as shown in Table S2. The results confirm that the lethal phenotype in cabbage is controlled by two dominant genes: BoHL1 from 09-211 and BoHL2 from 09-222, in accordance with the DM model.

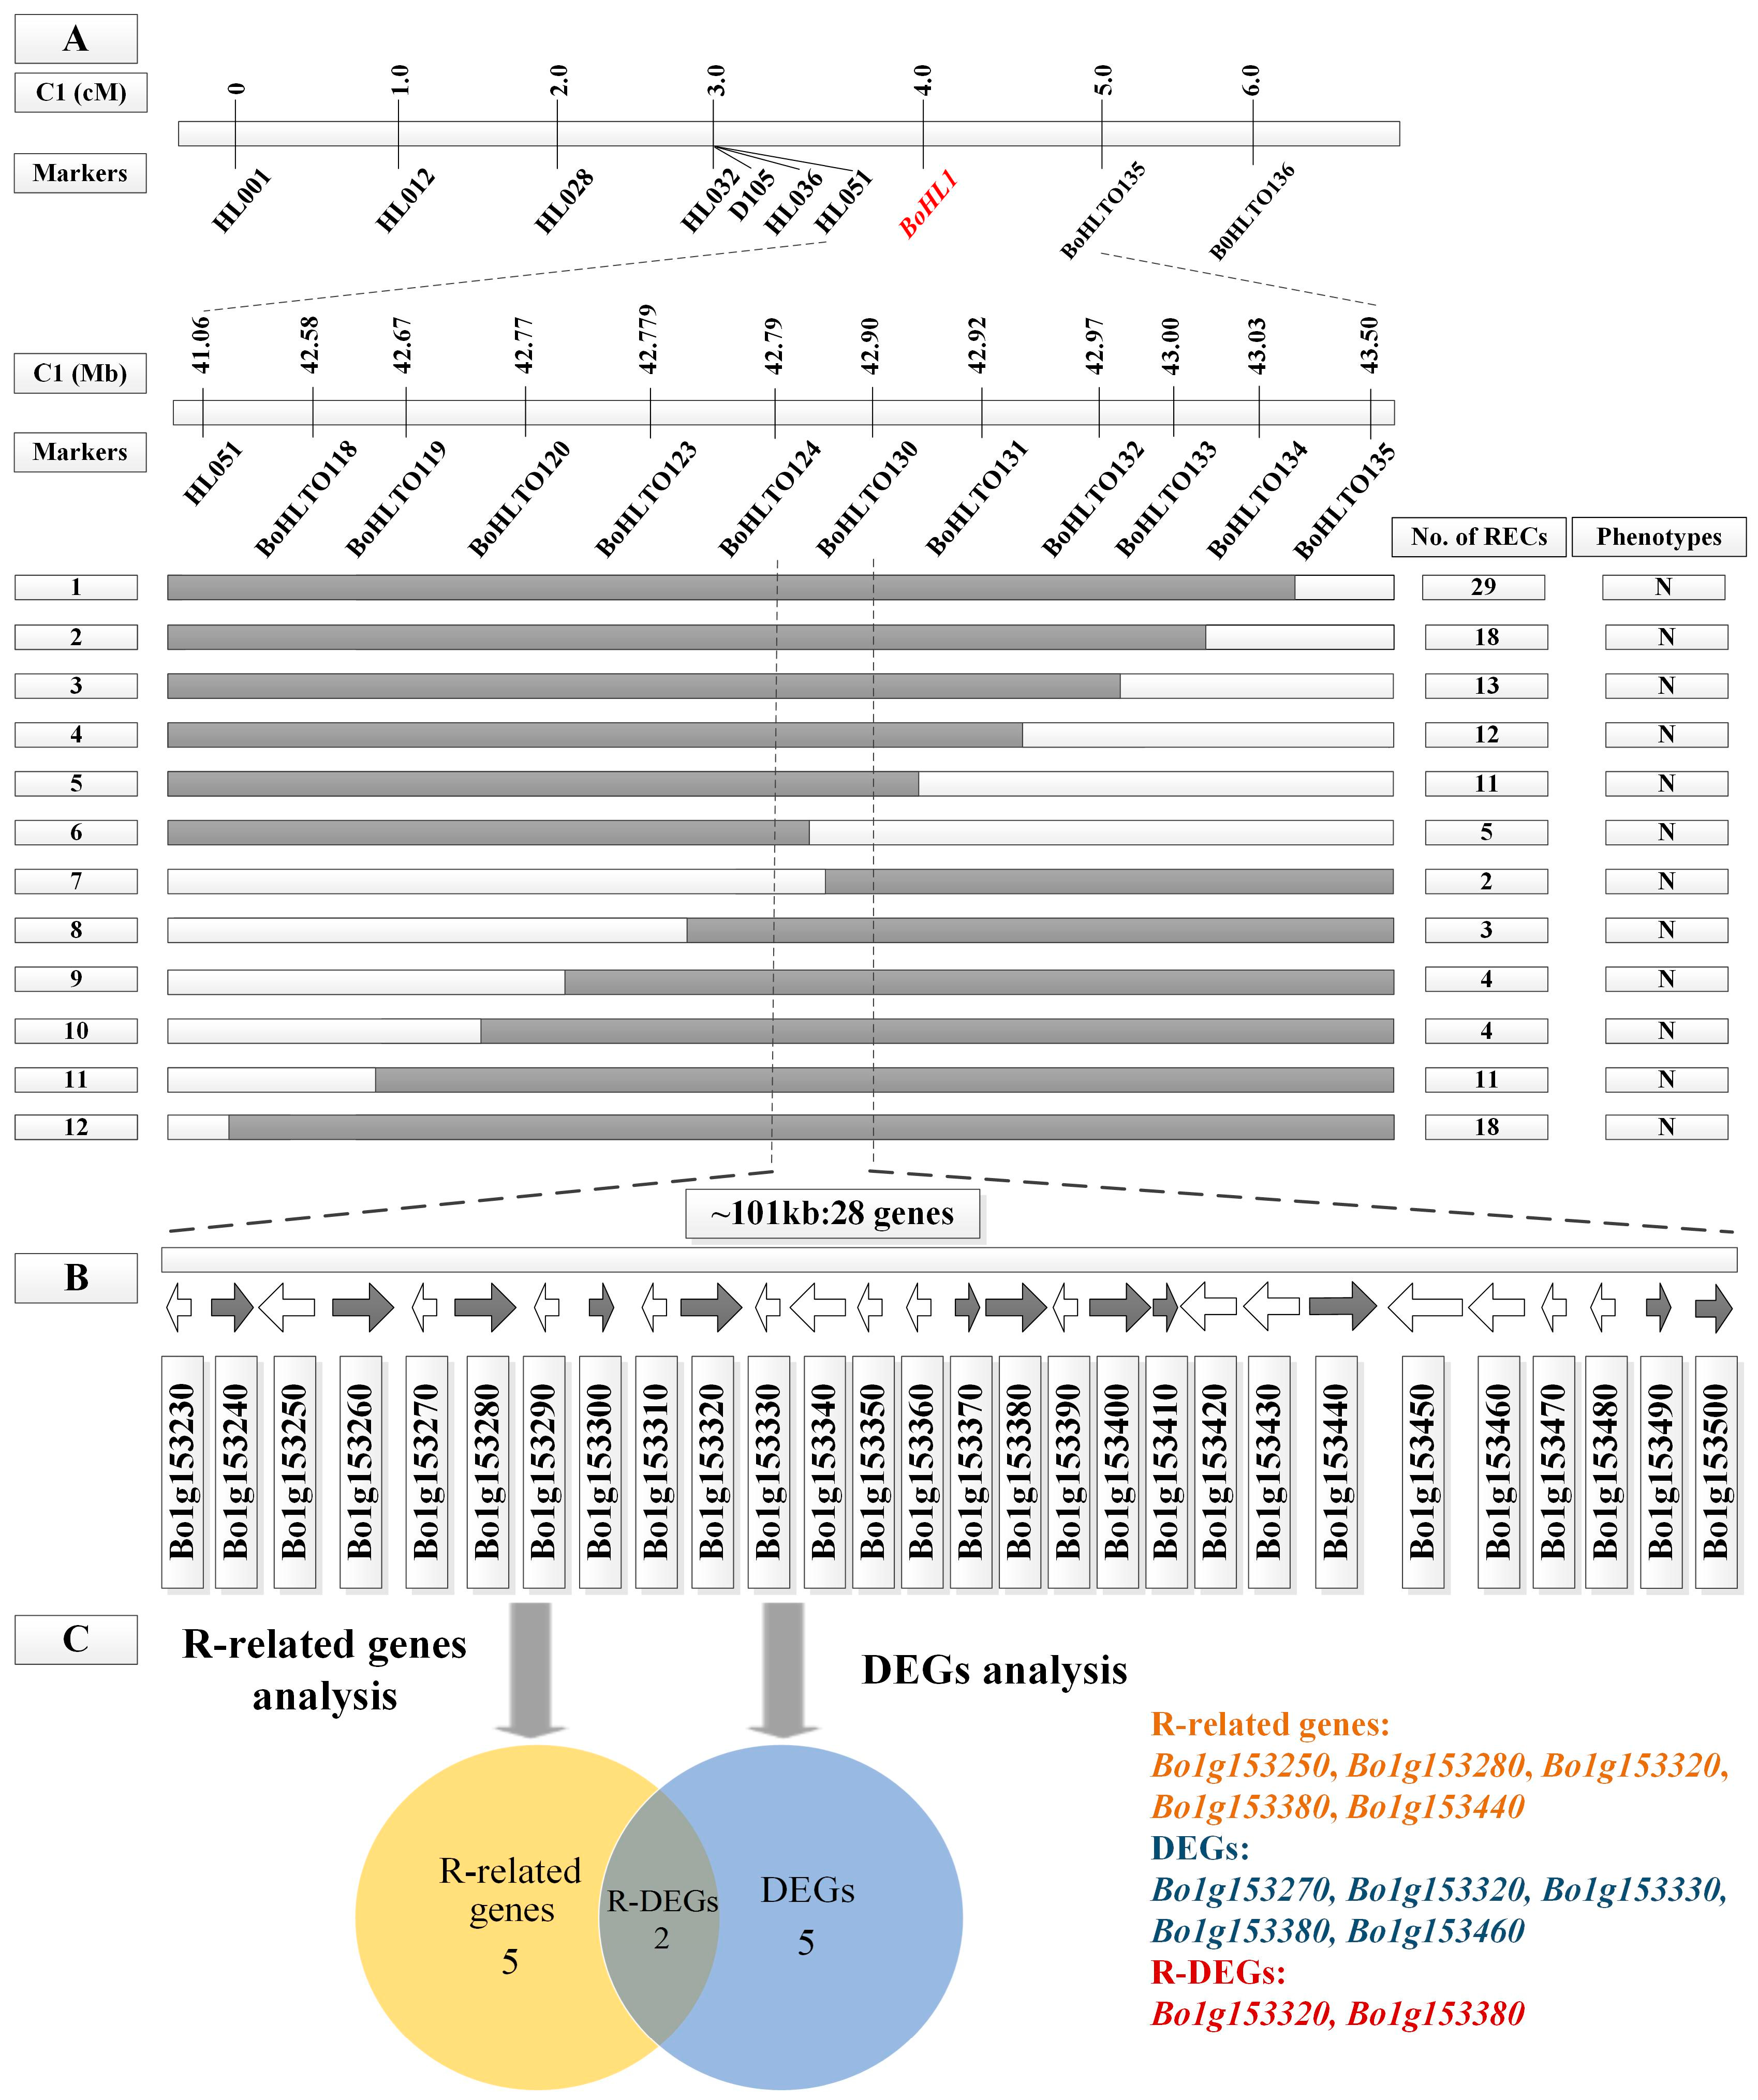
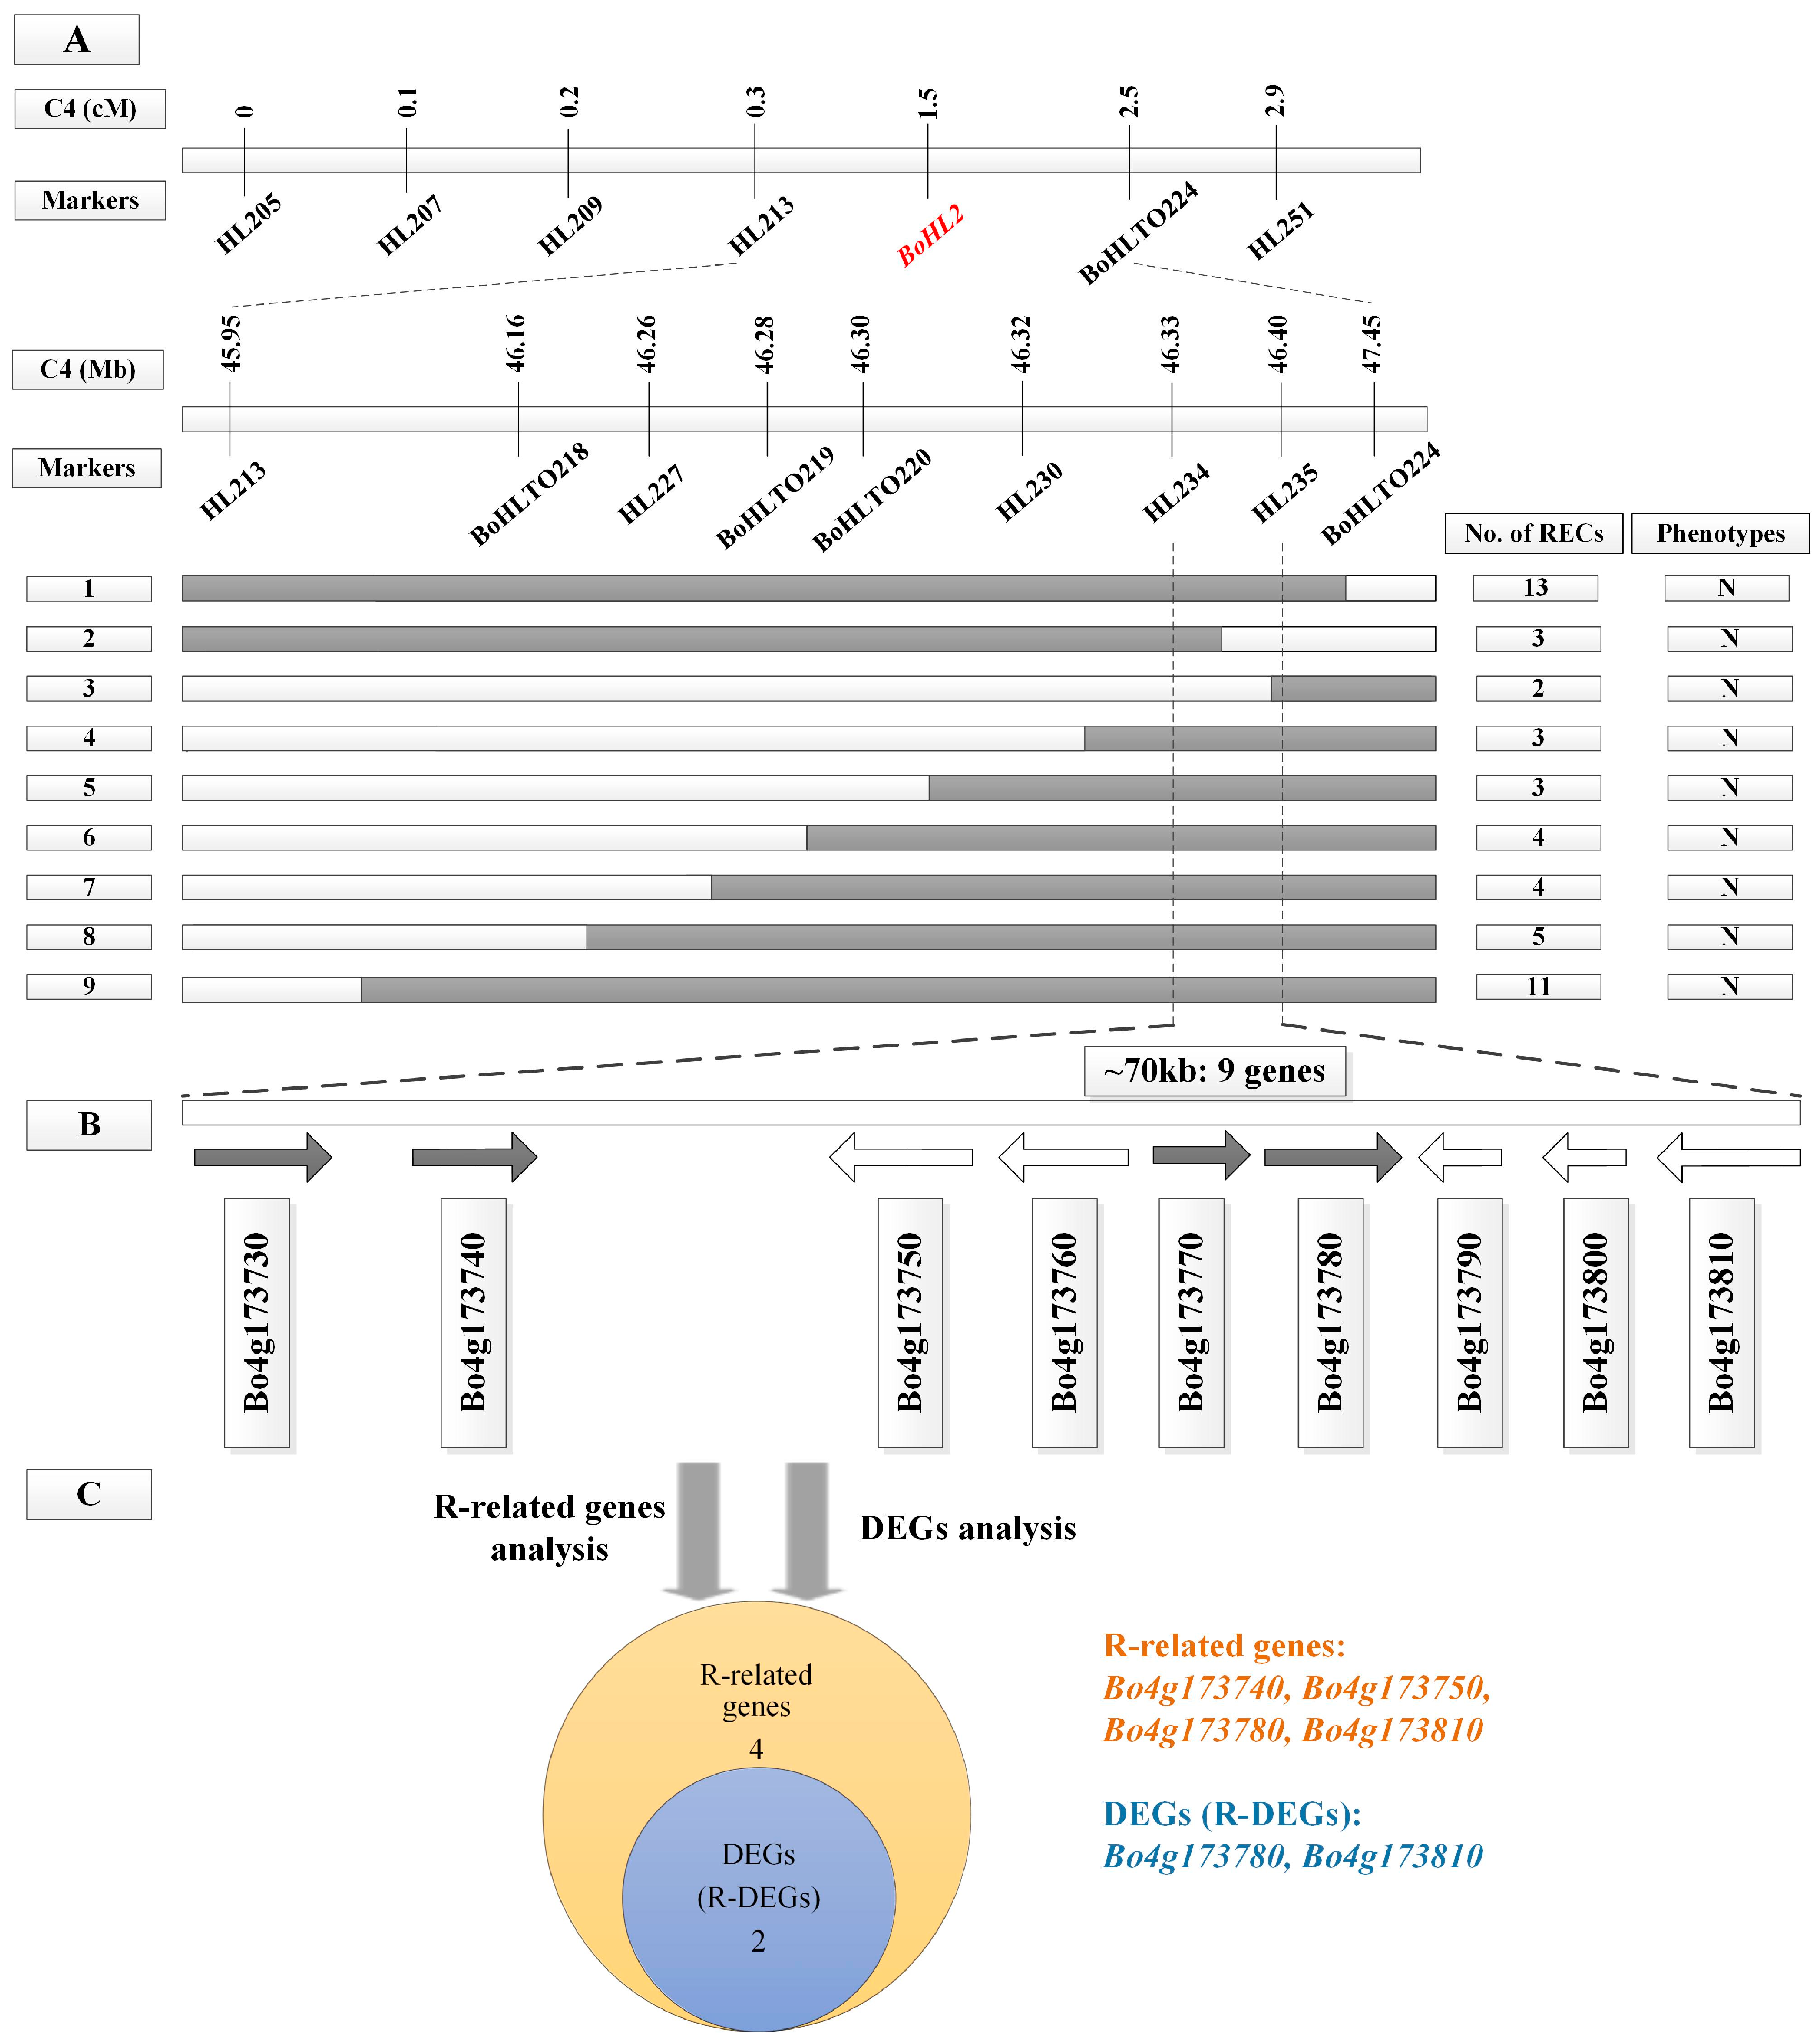
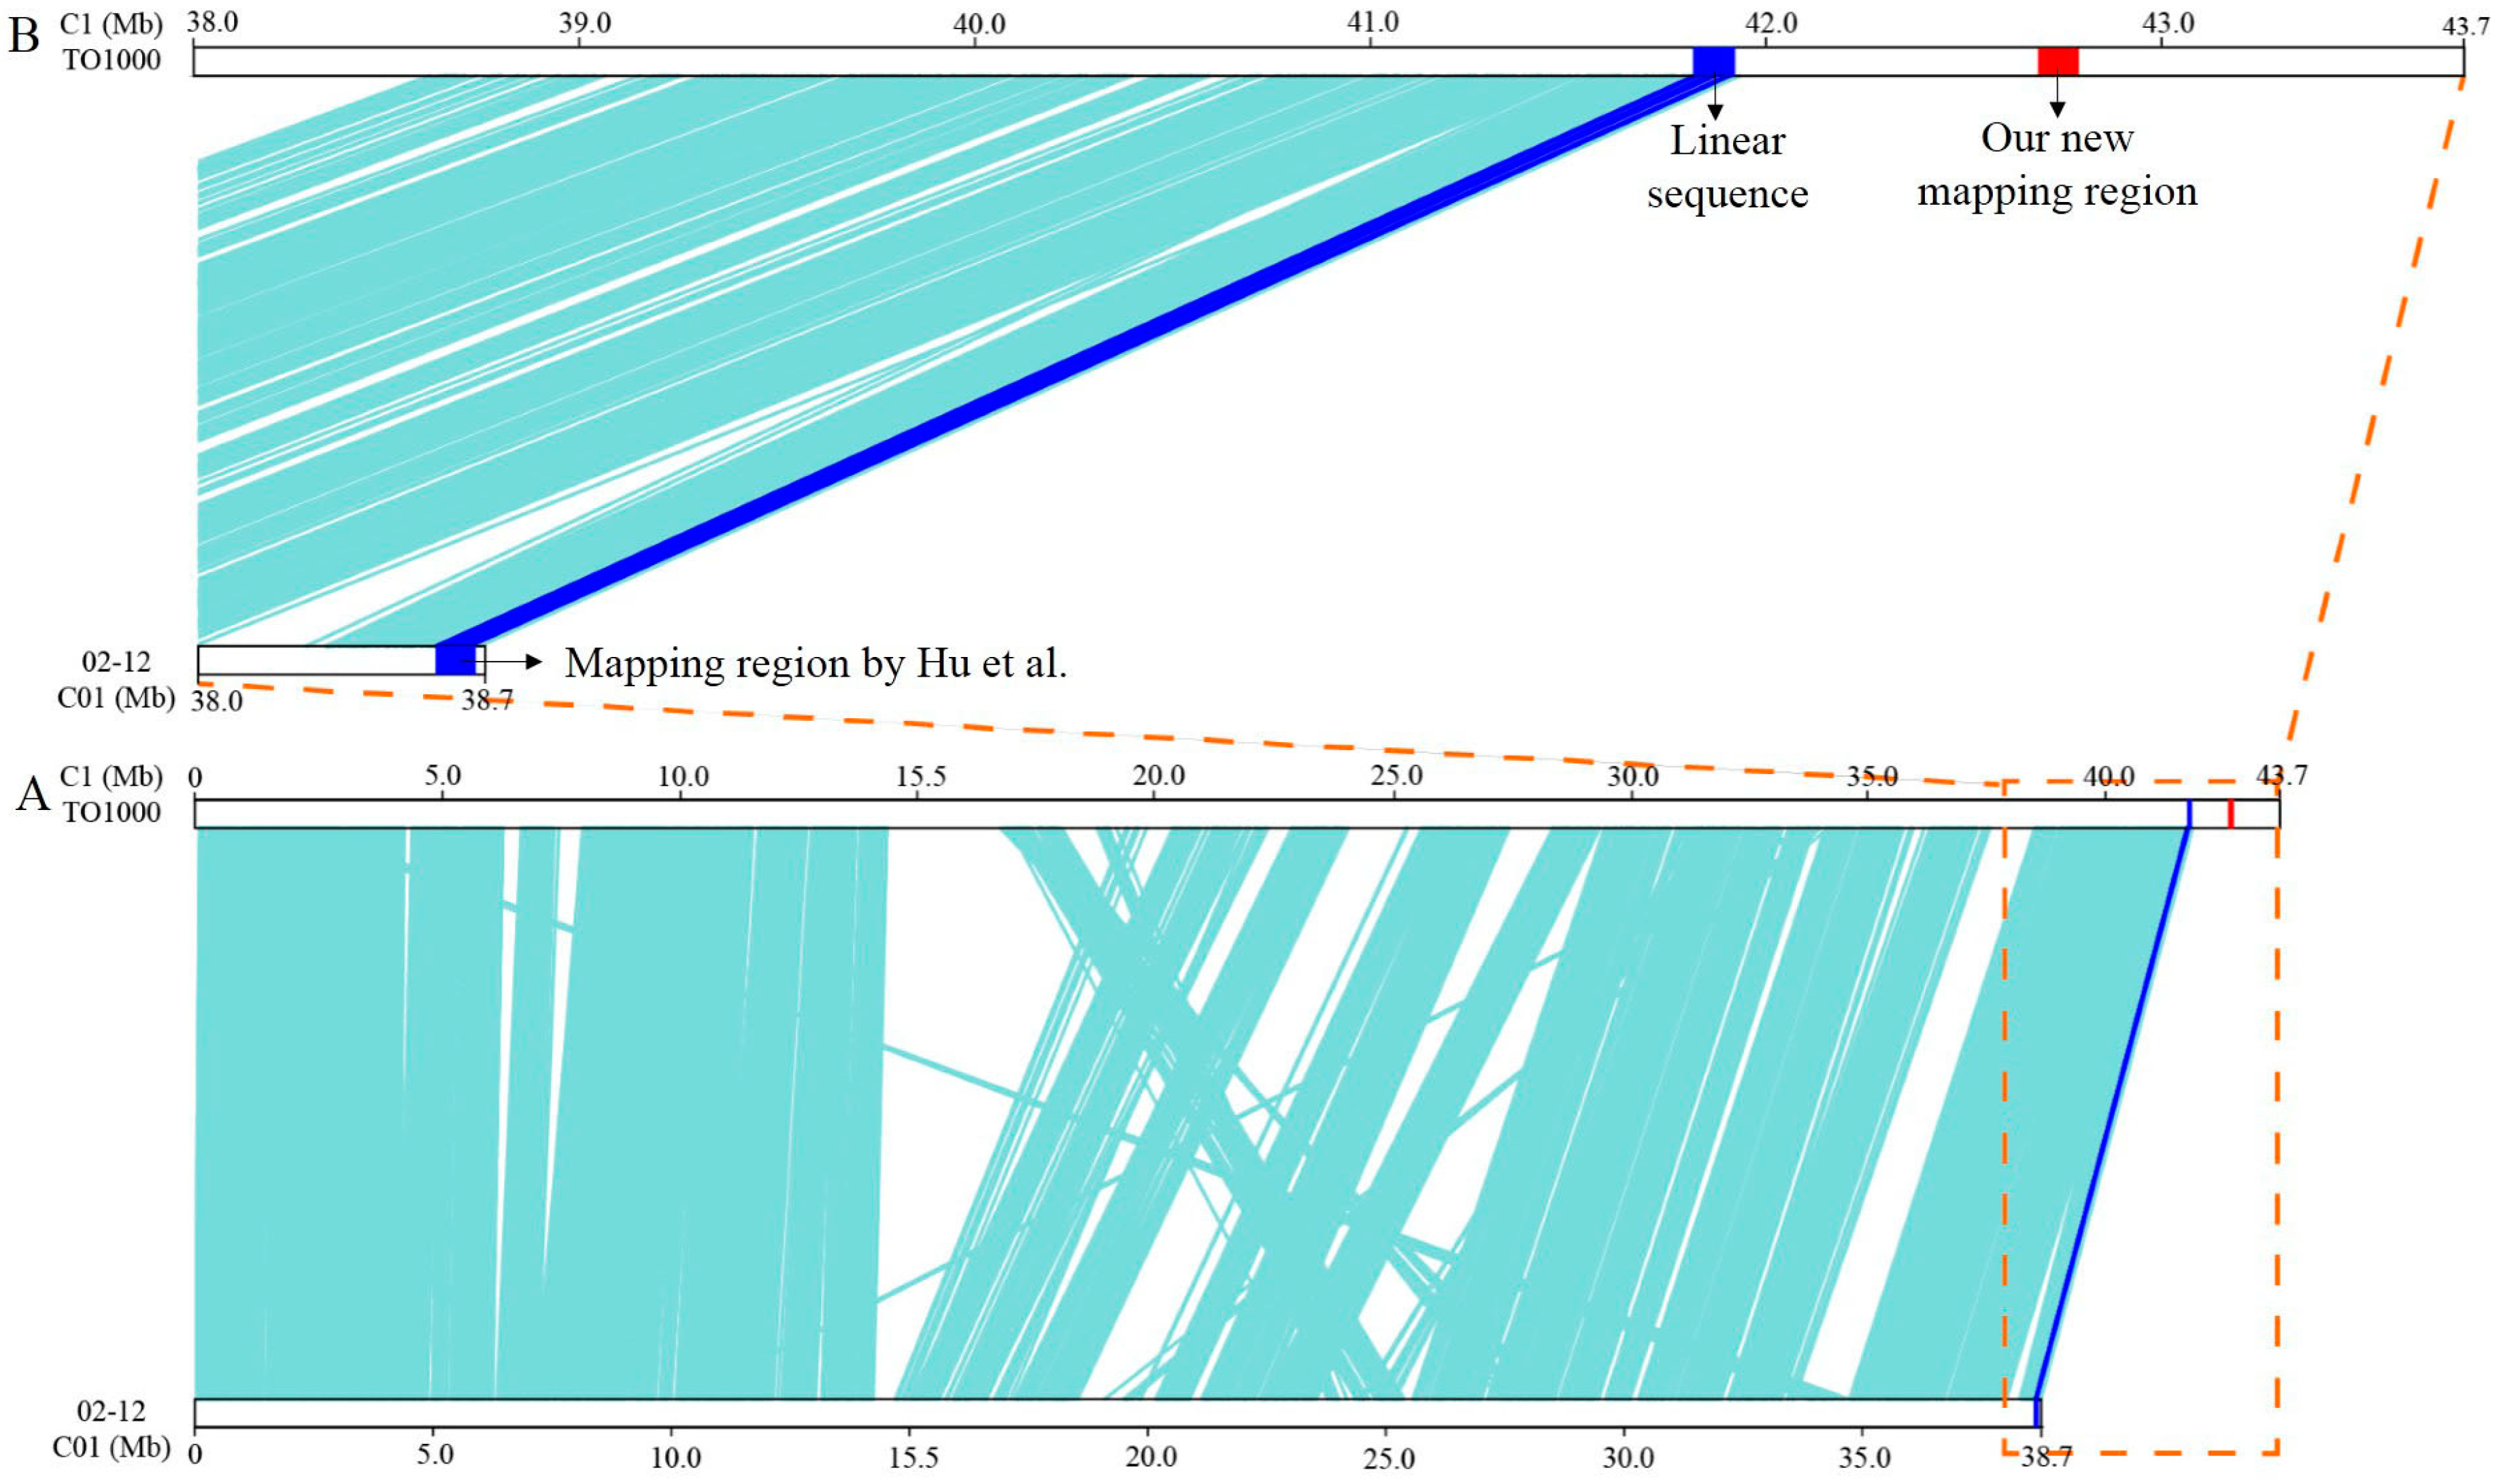
3.2. Fine Mapping of BoHL1 and BoHL2

First, 50 newly designed InDel primers for chromosome C1 were used to screen the polymorphic markers linked to the BoHL1 gene in the parents. By including some primers from Hu et al. [14], nine pairs of polymorphic InDel primers were identified in the pooled DNA samples from the normal and lethal plants. The nine primer pairs were then screened in population A. The results of screening revealed that the markers HL051 and BoHLTO135 were most closely linked to BoHL1, with one and one recombination events identified, respectively. Based on this mapping result, additional InDel markers were designed to identify marker loci that were closely linked to BoHL1. Eleven pairs of polymorphic primers were subsequently screened in population B. The InDel markers BoHLTO124 and BoHLTO130 were the markers closest to BoHL1, flanking the gene at genetic distances of 0.1 and 0.3 cM, respectively. A genetic map and corresponding physical map were then constructed (Figure 2A). The interval between the two markers was 101 kb (C1: 42,793,815–42,905,646 bp). This mapping result is different to that in the region of BoHL1 reported by Hu et al. [14]; little similarity is observed between the two mapping regions. All the InDel primers used for mapping BoHL1 are shown in Table S3A.
The same strategy was used to map the BoHL2 gene. A total of 25 pairs of InDel primers (Table S3B) on chromosome C4 showed polymorphisms, and fine mapping was performed with populations C, D, and E. The BoHL2 gene was located between markers HL234 and HL235, which confirms the mapping position of BoHL2 determined by Hu et al. [14]. The InDel markers HL234 and HL235 were closest to BoHL2, flanking the gene at genetic distances of 0.2 and 0.3 cM, respectively. A genetic map and corresponding physical map were constructed (Figure 3A). The marker interval was 70 kb (C4: 46,336,754–46,408,921).

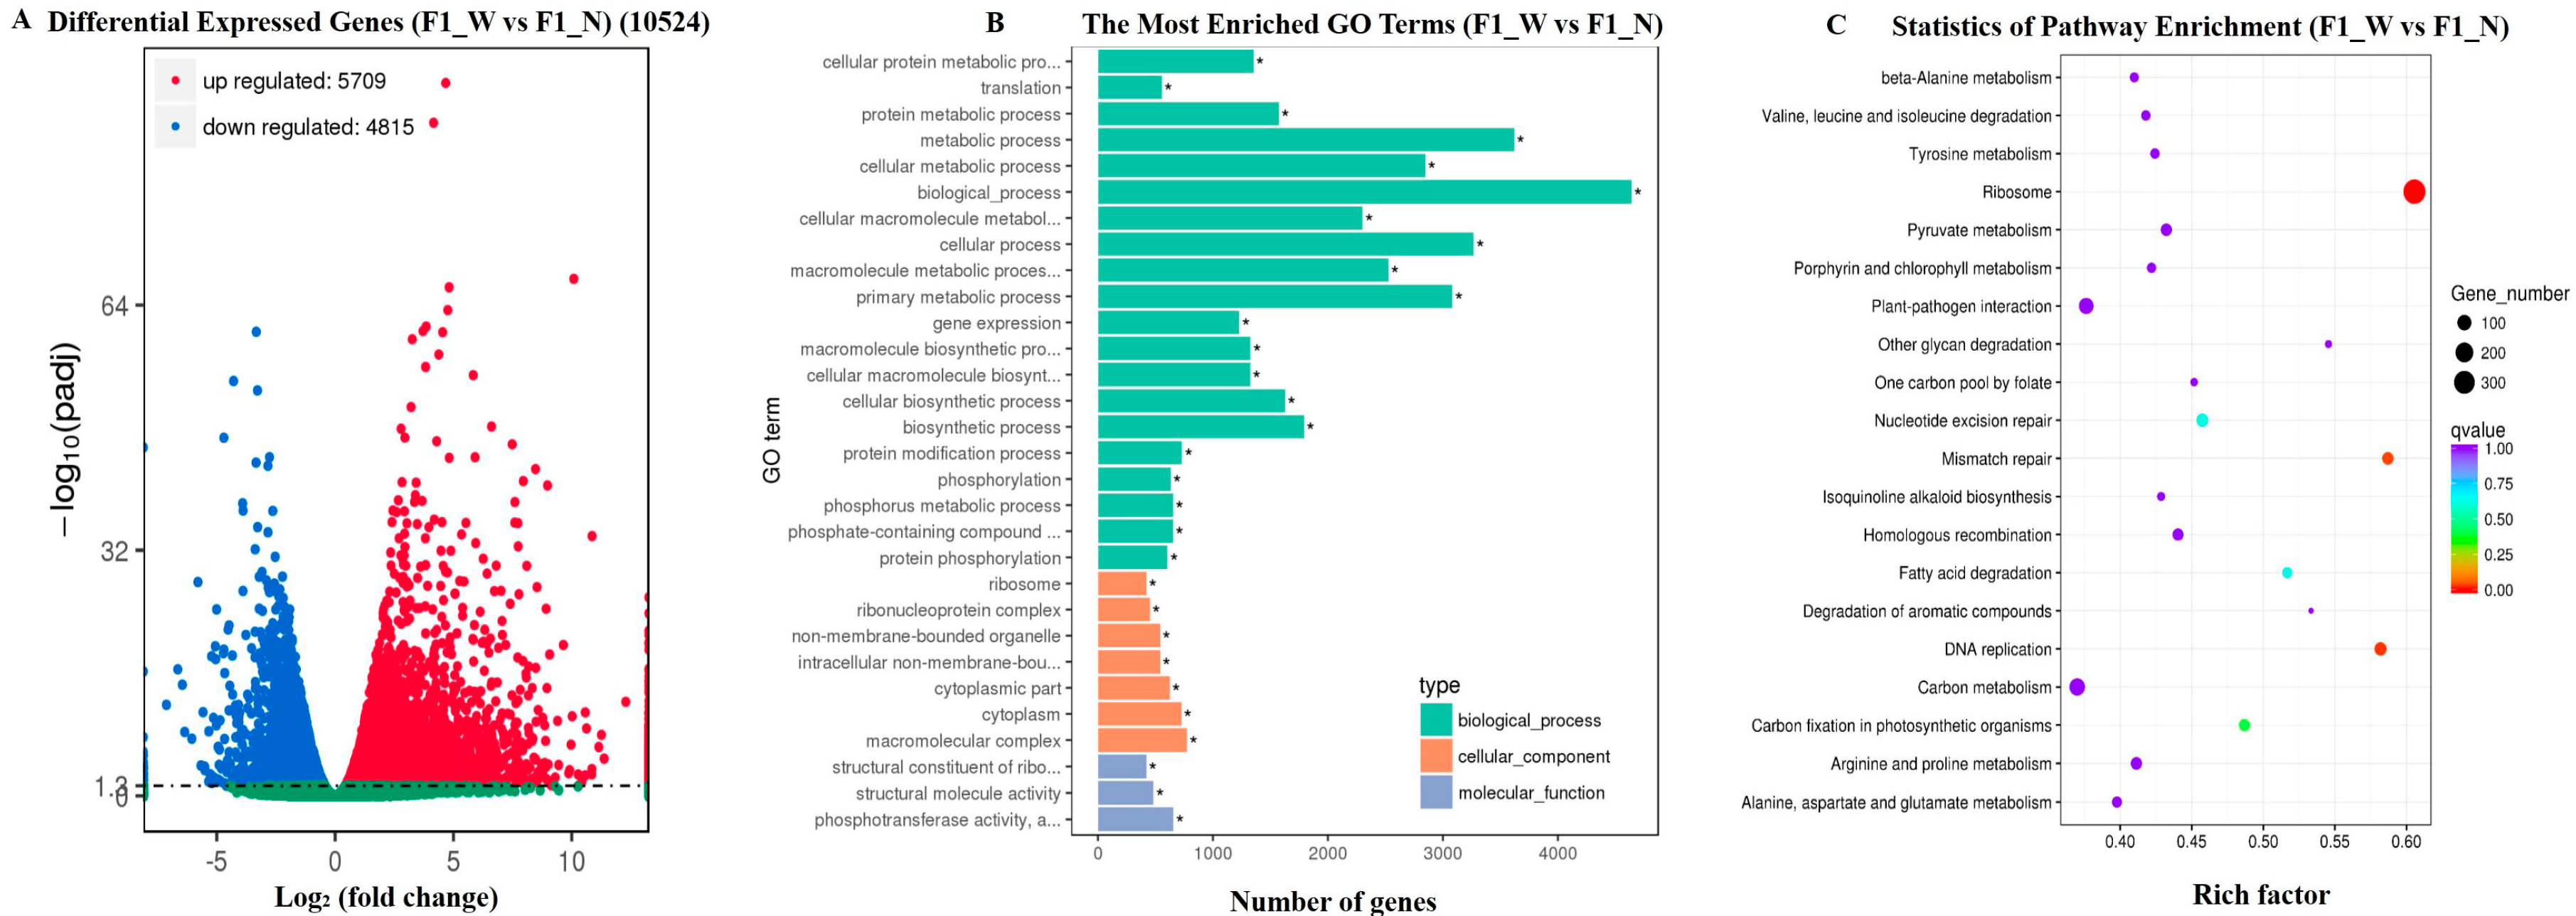
3.3. RNA-Seq Data Assembly and Analysis

A total of 284,924,630 raw read pairs were generated by PE150 sequencing from six cDNA libraries (‘F1_N_1’, ‘F1_N_2’, ‘F1_N_3, F1_W_1’, ‘F1_W_2’, and ‘F1_W_3’). After quality control, 275,378,950 clean read pairs were available (Table S4). The error rates of the sequence data from the six libraries were all 1~2%. In addition, the Q20 values (i.e., reads with average quality scores >20) were all >96%, and the Q30 values (i.e., reads with average quality scores >30) were all >92%. The GC contents were all 45~47%. These results indicate that the accuracy and quality of the sequencing data were sufficient for further analysis. Approximately 70% of the clean read pairs were mapped to the ‘TO1000’ reference genome. In addition, the mapped reads were aligned to each region, including the exon, intergenic, and intron regions. The percentage of reads mapped to the exons was highest for both ‘F1_N’ (90.61%) and ‘F1_W’ (92.1%), which indicated that our reference genome was largely complete. The sequencing data has been deposited into the NCBI sequence read archive (SRA) under BioProject accession PRJNA384517 (alias: SUB2611813).
Based on the comparison of gene expression levels between the two stages, genes according to the strict ‘q-value < 0.05’ criterion were defined as DEGs; 10,524 (5709 up-regulated and 4815 down-regulated) DEGs of ‘F1_W vs. F1_N’ were detected (Figure 4A). The DEGs are listed in Table S5. To determine the functions of the DEGs, all 10,524 genes were subjected to GO enrichment analysis, which grouped them into three main categories (Figure 4B). In the biological process category, DEGs were highly represented by the terms ‘biological process’ (4642), ‘metabolic process’ (3620), and ‘cellular process’ (3268). In the cellular category, the most represented terms were ‘cellular component’ (2817), ‘cell’ (2696), and ‘cell part’ (2696). In addition, ‘molecular function’ (5201), ‘catalytic activity’ (2683), and ‘binding’ (2683) were among the most commonly represented molecular function terms.
All of the DEGs were analyzed using the KEGG pathway databases to identify the biological pathways. According to the richness factor value, a total of 10,524 DEGs were assigned to 122 KEGG pathways (Table S6). The pathway ‘Ribosome’ was the most common term, containing 353 DEGs, followed by ‘DNA replication’ (64), ‘Mismatch repair’ (54), ‘Carbon fixation in photosynthetic organisms’ (55), and ‘Nucleotide excision repair’. The top 20 KEGG pathways with the highest representation of DEGs are shown in Figure 4C.
Considering the opinion that HL results from combinations of resistance (R) gene products [11,12,13], we analyzed an associated term ‘Plant-pathogen interaction’ (Figure 5), which is regarded as a complex process that is controlled by the genotype and determined by the interaction of resistance genes and the corresponding virulence [38]. Moreover, it is one of the most significant in our analysis of KEGG pathway enrichment, suggesting that this pathway may play an important role in HL in cabbage. As observed in the figure, this pathway term is relevant to some complex biological processes, including the hypersensitive response (HR), programmed cell death, and immune response; some crucial genes, such as Rin4 and WRKY; and R proteins. It is worth mentioning that Rin4 is one of the two interacting genes in interspecific lettuce hybrids [12]. The Rin4 homologous gene is Bo3g083790, which is an up-regulated gene, while dangerous mix 1 (DM1) and dangerous mix 2 (DM2) have a low homology in cabbage. In addition, this category supports our conclusion that HL might result from the immune response activated by combinations of R proteins. Moreover, this category may help us comprehensively analyze the close links among these processes. The DEGs in this category are shaded green in Figure 5, and a list of DEGs is provided in Table S7. Although these DEGs were not located in our mapping region, they might be downstream targets or pathways associated with the HL response.

3.4. Candidate Gene Analysis

3.4.1. Gene Analysis for the Candidate Regions

Based on the ‘TO1000’ reference genome, 28 genes were located in the mapping region of BoHL1, and nine genes were located in the mapping region of BoHL2 (Figure 2B and Figure 3B). According to ‘Gene Ontologies’ and ‘Protein Summary’ from the ‘TO1000’ reference genome, 24 of 28 genes in the mapping region of BoHL1 and seven of nine genes in the mapping region of BoHL2 were annotated, which are shown in Table 1 and Table 2, respectively. Considering the opinion that HL results from combinations of R gene products [11,12,13], the annotation analysis of these genes indicated that five genes in the mapping region of BoHL1 and four genes in that of BoHL2 are most likely related to R genes. These genes included Bo1g153250, Bo1g153280, Bo1g153320, and Bo1g153380 (these genes contain the Toll/interleukin-1 receptor homology (TIR) domain and the leucine-rich repeat domain, which is the most commonly conserved domain of R proteins) [39,40]; Bo4g173810 (the gene contains the nucleic acid-binding site (NBS), which is widely found in plant disease-resistance genes and has a high homology with genes related to apoptosis regulation) [41]; Bo1g153440, Bo4g173750, and Bo4g173780 (these genes contain an important part of R protein, the protein kinase-like domain) [42]; and Bo4g173740 (the gene contains the F-box domain, which is a protein-protein interaction motif) [43] (Figure 2C and Figure 3C). Thus, in total, there are nine R-related genes (five genes for BoHL1 and four genes for BoHL2) that might be associated with HL in cabbage.

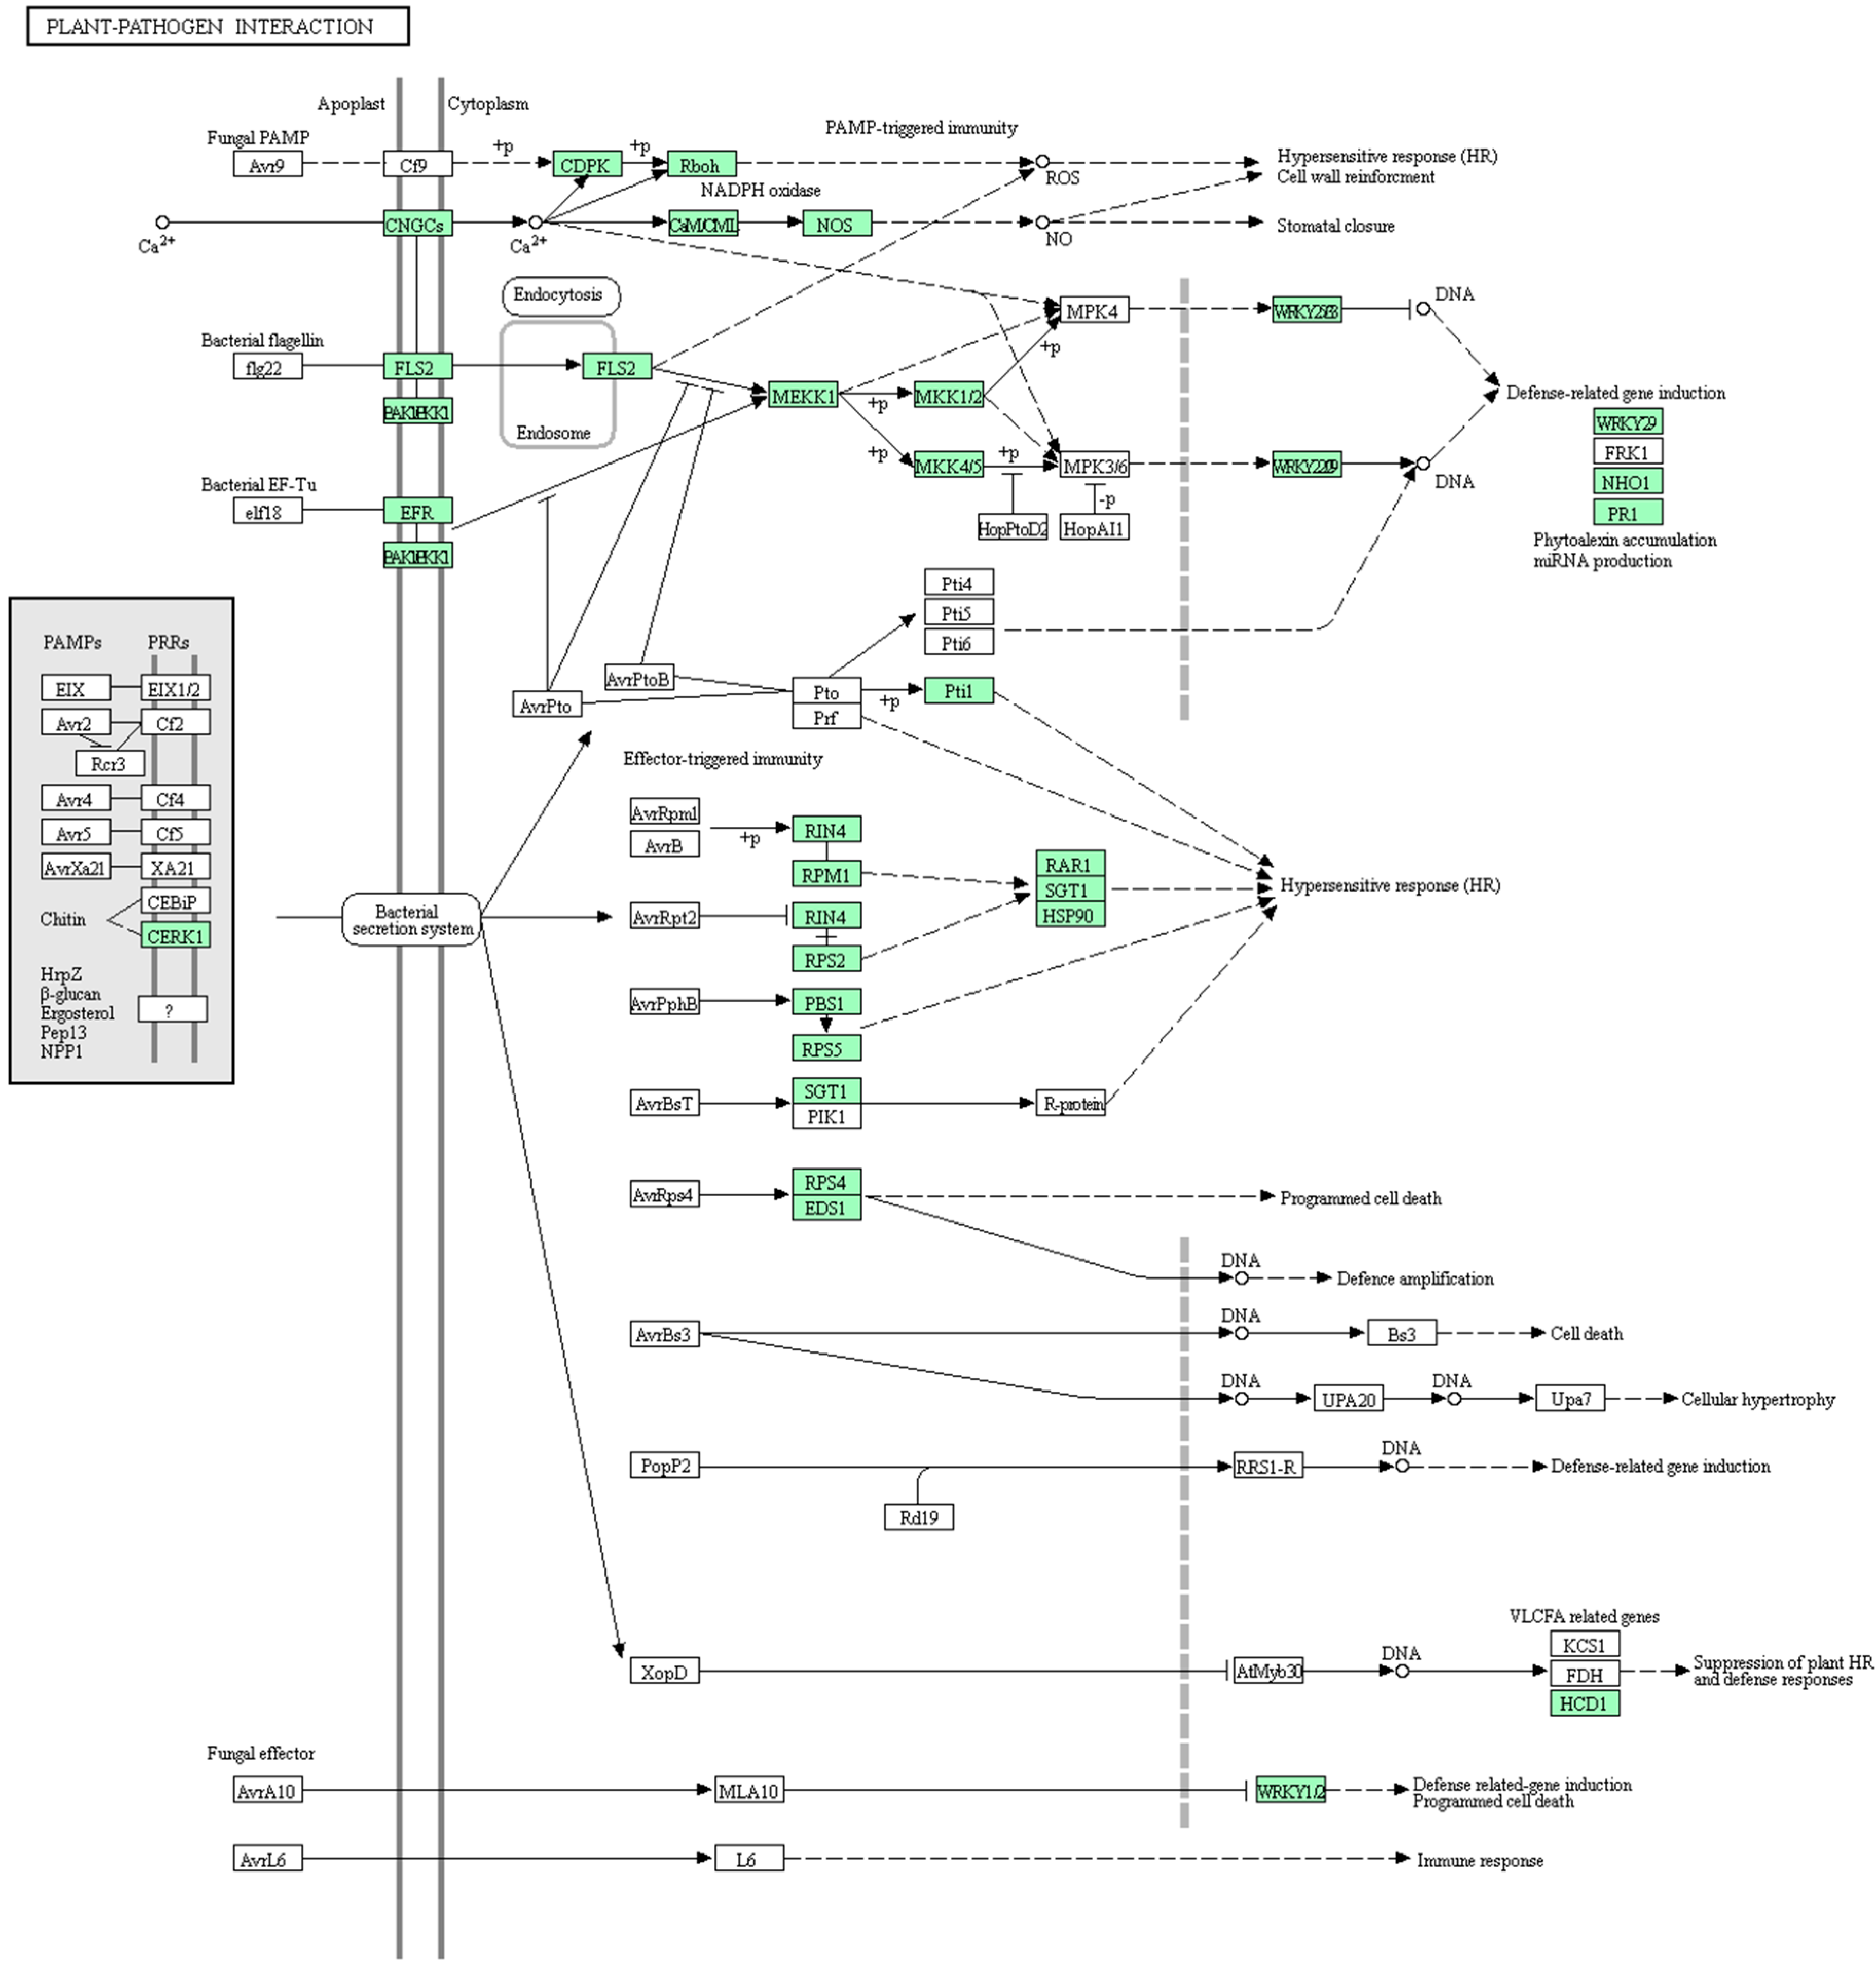
3.4.2. DEG Analysis for the Candidate Regions

We also analyzed the expression levels of genes in the mapping region using transcriptome data. The ‘q-value’ and significance of these genes in ‘F1_W vs. F1_N’ are shown in Table 1 and Table 2, respectively. Five (Bo1g153270, Bo1g153320, Bo1g153330, Bo1g153380, and Bo1g153460) and two (Bo4g173780 and Bo4g173810) DEGs in the mapping regions of BoHL1 and BoHL2 were detected, respectively. Interestingly, the five DEGs of BoHL1 were all up-regulated, and the two DEGs of BoHL2 were all down-regulated. However, no study has shown whether the gene expression levels involved in HL are up- or down-regulated (Figure 2C and Figure 3C). Therefore, a total of seven DEGs (five genes for BoHL1 and two genes for BoHL2) are interesting genes that might be involved in HL in cabbage.
As such, by combining annotation information and transcriptome analysis, in region 1, for BoHL1, there are seven DEGs and five R-related genes (two in common, i.e., Bo1g153320 and Bo1g153380) (Figure 2C), while in region 2, for BoHL2, there are two DEGs and four R-related genes (two in common, i.e., Bo4g173780 and Bo4g173810) (Figure 3C). Thus, we focused on all of these candidate genes (eight R genes or DEGs for BoHL1 and four for BoHL2) for further analysis, especially the R-DEGs (two for BoHL1 and two for BoHL2).

3.4.3. Candidate Genes Analysis Using Re-Sequencing Data

In total, we identified 365 SNPs in the coding sequence of all 12 candidate genes (eight R genes or DEGs for BoHL1 and four for BoHL2). Besides, no InDel was detected for them. Among the SNPs, 364 were found for the candidate genes of BoHL1 (Bo1g153250, Bo1g153270, Bo1g153280, Bo1g153320, and Bo1g153380) (Table S8A); one was found for candidate genes of BoHL2 (Bo4g173780) (Table S8B). Moreover, 363 SNPs resulted in synonymous or non-synonymous mutations, from which we could not infer whether the gene functions were altered subsequently. However, we did find two significant SNPs in the candidate genes for BoHL1, including one stop-gain SNP in Bo1g153280: exon4: c-T1791A: p-Y597X, one stop-gain SNP in Bo1g153380: exon5: c-G2728T: p-E910X, which may lead to functional consequences due to protein truncation [44]. The results provide further evidence that Bo1g153280 and Bo1g153380 might be related to HL.

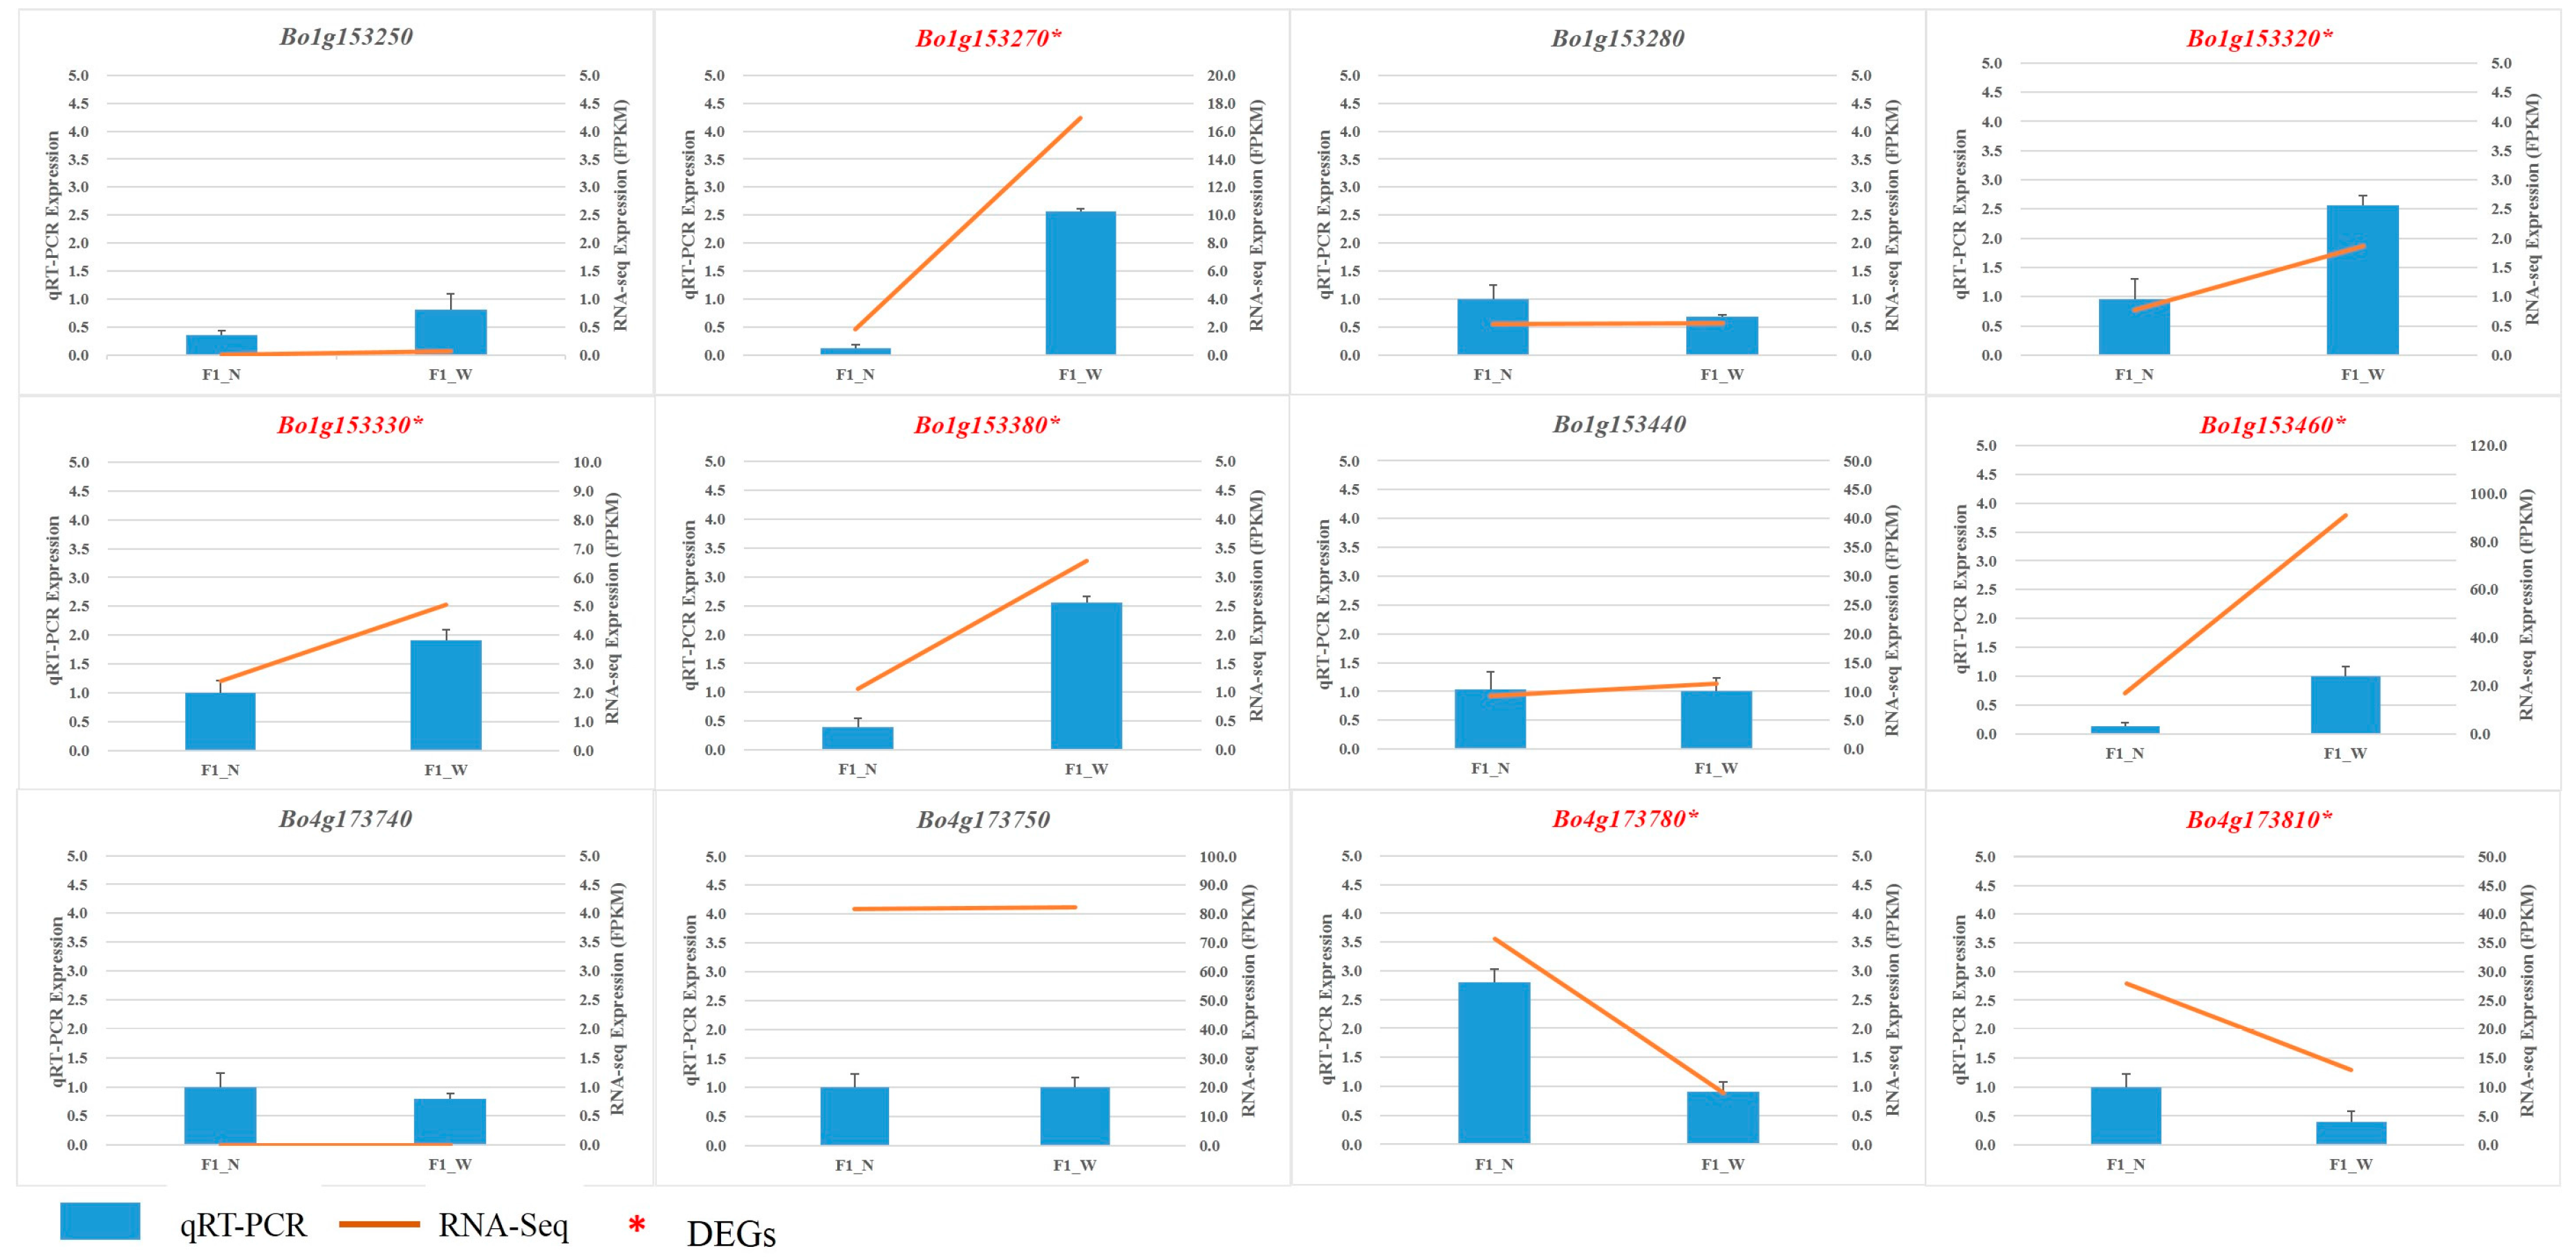
3.5. RNA Sequencing Validation by qRT-PCR

To assess the reliability of our transcriptome data, the expression fold changes of the DEGs and R-related genes (12 genes) in the mapping regions were determined using qRT-PCR and compared with those obtained using the RNA-Seq data. The FPKM values of the transcriptome data exhibited similar expression trends before and after lethal expression compared with the qRT-PCR results (Figure 6), confirming the reliability of RNA-Seq expression results. The results also confirmed that some R-DEGs might be involved in HL, such as Bo1g153320, Bo1g153380, Bo4g173780, and Bo4g173810.

4. Discussion

4.1. Omics Technologies Promote Molecular Genetics Research in B. oleracea

The application of omics technology is becoming increasingly common and provides an opportunity to intensively study the complexity of genetic and molecular processes at the genomic, transcriptomic, proteomic, and metabolomic levels [45]. The advantages of omics technology have already been discussed elsewhere.
For example, Lv et al. reported candidate genes for cabbage Fusarium wilt resistance using fine mapping and RNA-Seq [46]. Kawashima et al. reported that they cloned a Phakopsora pachyrhizi resistance gene, CcRpp1, from pigeonpea (Cajanus cajan), and they showed that CcRpp1 conferred full resistance to P. pachyrhizi in soybean by applying map-based cloning approaches and transcriptome analysis [47].
Comparative genomics analyses also allow us to identify mapping errors due to problems in genome assembly. Lee et al. demonstrated that the ‘02-12’ reference genome showed a low frequency of recombination in genetic maps and low densities of SNPs and bins on each pseudochromosome compared with the ‘TO1000’ reference genome [17]. Additionally, Liu et al. identified an incorrect insertion in the ‘02-12’ reference genome following the fine mapping and analysis of a gene conferring the glossy trait Cgl1 in cabbage [48]. Lee et al. selected ‘TO1000’ rather than ‘02-12’ as a reference genome for their quantitative trait loci (QTL) mapping of black rot resistance because the sizes of the nine pseudochromosomes of ‘TO1000’ (446.9 Mb) are larger than those of ‘02-12’ (388.8 Mb) [49].
In the present study, we also encountered difficulties when fine mapping the HL genes: the markers’ positions in the linkage maps did not match their physical positions. To determine the source of the problem, we performed collinearity analysis of the C1 chromosome in the ‘TO1000’ and the ‘02-12’ reference genomes. The C1 chromosome in the ‘TO1000’ reference genome was 5 Mb larger than that in ‘02-12’, with some regions showing poor collinearity, as shown in Figure 7A. In addition, the previous mapping position of BoHL1 was at the end of C01, based on the ‘02-12’ reference genome. Considering that the TO1000 pseudochromosomes were larger and had fewer errors, as discovered in our previous study and confirmed in the current study, we selected ‘TO1000’ for further fine-mapping study. BoHL1 was mapped to the end of chromosome C1 (C1: 42,793,815–42,905,646 bp), which was a non-assembly chromosome part in ‘02-12’. The physical position and collinearity analysis of the two mapping positions are shown in Figure 7B. Thus, the assembly errors in the ‘02-12’ reference genome may have resulted in the incorrect mapping location of BoHL1 by Hu et al. [14]. The ‘TO1000’ reference genome was valuable for gene mapping in the present study. Our study also represents the first application of the RNA-Seq approach to the study of HL, and we identified some DEGs related to HL. However, further work is needed to delimit the region and confirm the candidate genes by performing function analysis.

4.2. Mechanisms of HL In Plants

To date, studies on HL are rare, and the molecular mechanisms remain poorly understood. Cloning of the causal genes is a crucial step to clarify these molecular mechanisms. To date, two loci causing genetic incompatibility in Arabidopsis have been cloned: DM1, a nucleotide-binding site–leucine-rich repeat (NB-LRR, NLR) gene [10], and DM2, a highly variable cluster of nucleotide-binding domain and leucine-rich repeat (NLR) genes [11]. Chae et al. suggested that deleterious interactions of immune receptors limit the combinations of favorable disease-resistance alleles that are accessible to plant genomes [11]. Jeuken et al. observed hybrid necrosis in interspecific lettuce hybrids and found that one of the two interacting genes was Rin4 based on transient expression and silencing experiments [12]. This gene is one of the most important genes in the plant genome, and some responses of R genes can resist infections by pathogenic microorganisms [50]. In addition, Abramovitch et al. noted that resistance proteins that are encoded by this type of R gene can directly or indirectly induce the immune response and cause a hypersensitive response during effector-triggered-immunity (ETI) [51]. The HR, an important process in programmed cell death (PCD), plays an important role in plant disease resistance [52]. In addition, Pontier et al. argued that the HR results from the internal procedures of plant-activated genes [53]. These studies suggest that HL may be involved in the HR that is triggered by the immune response, which is tightly related to R genes.
In our current study, we further analyzed the relationship between these candidate genes and HL in cabbage. For instance, these R-DEGs (Bo1g153320, Bo1g153380) and R-related genes (Bo1g153250, Bo1g153280) encode the Leucine-rich repeat domain (LRR), and Rothberg et al. suggested that genes containing LRRs are associated with a variety of biological processes, including disease resistance, apoptosis, and the immune response in Drosophila, and these motifs have been implicated in protein-protein interactions as part of an extracellular domain in a variety of other proteins, which is accordant with the DM model [54]; The R-DEG Bo1g173780 encodes the protein kinase-like domain, which is involved in a number of fundamental cellular processes such as apoptosis, proliferation, motility, and adhesion [55]. These results show that our candidate genes might be closely relevant to HL in cabbage, especially the R-DEGs.
The present study used fine mapping and candidate gene analyses to further understand HL in plants; however, more work is needed to clarify the molecular mechanisms.

5. Conclusions

In conclusion, we used five descendant populations of three-way cross to finely map BoHL1 and BoHL2 based on the ‘TO1000’ reference genome. BoHL1 was located on chromosome C1, as indicated by InDels BoHLTO124 and BoHLTO130, with an interval between the two markers of 101 kb. BOHL2 was also confirmed to occur between InDel markers HL234 and HL235 on C4. We investigated the changes in transcripts involved in HL by RNA-Seq, including a gene expression level analysis and the functional enrichment of DEGs. From combining the annotation information and transcriptome analysis based on the fine-mapping results, seven DEGs and five R-related genes were found in region 1 for BoHL1 (two in common, i.e., Bo1g153320 and Bo1g153380), and two DEGs and four R-related genes were found in region 2 for BoHL2 (also two in common, i.e., Bo4g173780 and Bo4g173810). We also used SNP/InDel analyses and qRT-PCR to confirm the results. This work can inform future analyses of the functional mechanisms of HL in cabbage.

Supplementary Materials

The following are available online at www.mdpi.com/2073-4425/8/6/147/s1. Table S1 Information on the primers used for qRT-PCR; Table S2 Chi-square goodness-of-fit test ratios of segregating populations; Table S3 Polymorphic primers used for fine map. (A) Polymorphic primers used for BoHL1 fine mapping. (B) Polymorphic primers used for BoHL2 fine mapping; Table S4 Sequencing and assembly statistics for the six transcriptome datasets in ‘F1_N’ and ‘F1_W’; Table S5 List of DEGs from ‘F1_W vs. F1_N’. Listed are 10,524 (5709 up-regulated and 4815 down-regulated) DEGs of ‘F1_W vs. F1_N’; Table S6 122 List of the KEGG pathways of DEGs; Table S7 DEGs in the pathway category ‘Plant-pathogen interaction’; Table S8A the SNPs in the coding sequence of candidate genes for BoHL1 among 09-211, 09-222 and 96-100; Table S8B the SNPs in the coding sequence of candidate genes for BoHL2 among 09-211, 09-222 and 96-100.

Acknowledgments

This work was financially supported by the grants from the National Key Research and Development Program of China (2016YFD0100307, 2016YFD0100204), the National Natural Science Foundation of China (31572139), the Science and Technology Innovation Program of the Chinese Academy of Agricultural Sciences (CAAS-ASTIP-IVFCAAS), and the earmarked fund for the Modern Agro-Industry Technology Research System, China (nycytx-35-gw01). The work reported here was performed in the Key Laboratory of Biology and Genetic Improvement of Horticultural Crops, Ministry of Agriculture, Beijing 100081, China.

Author Contributions

Z.X. developed the descendant populations of three-way cross, performed the experiments, analyzed the data, and wrote and revised the manuscript. H.L. and M.Z. designed the research and critically edited the manuscript. Z.X., Y.H., Y.X., X.L. and Z.L. isolated the samples. Z.F., L.Y., Y.Z., Y.L. and Z.L. critically reviewed the manuscript. All authors read and approved the final manuscript.

Conflicts of Interest

The authors declare no conflicts of interest.

Abbreviations

HLHybrid lethality
DMDobzhansky-Muller
InDelInsertion-deletion
SNPSingle nucleotide polymorphisms
COGCluster of orthologous groups
KEGGKyoto encyclopedia of genes and genomes
qRT-PCRQuantitative real-time RT-PCR
DEGsDifferentially expressed genes
BSABulked segregant analysis
TIRToll/interleukin-1 receptor homology
QTLQuantitative trait loci
PAGEPolyacrylamide gel electrophoresis
NBS-LRRNucleotide binding site-leucine rich repeat
ETIEffector-triggered-immunity
HRHypersensitive response
PCDProgrammed cell death
SNPSingle nucleotide polymorphism
FPKMFragments per kilobase of exon model per million mapped reads
DM1Dangerous mix 1
DM2Dangerous mix 2

References

  1. Orr, H.A.; Presgraves, D.C. Speciation by postzygotic isolation: Forces, genes and molecules. Bioessays 2000, 22, 1085–1094. [Google Scholar] [CrossRef]
  2. Bomblies, K.; Weigel, D. Hybrid necrosis: Autoimmunity as a potential gene-flow barrier in plant species. Nat. Rev. Genet. 2007, 8, 382–393. [Google Scholar] [CrossRef] [PubMed]
  3. Wiebe, G.A. Complementary factors in barley giving a lethal progeny. J. Hered. 1934, 25, 273–274. [Google Scholar] [CrossRef]
  4. Tezuka, T.; Kuboyama, T.; Matsuda, T.; Marubashi, W. Seven of eight species in Nicotiana section Suaveolentes have common factors leading to hybrid lethality in crosses with Nicotiana tabacum. Ann. Bot. 2010, 106, 267–276. [Google Scholar] [CrossRef] [PubMed]
  5. Watanabe, H.; Marubashi, W. Temperature-dependent programmed cell death detected in hybrids between Nicotiana langsdorffii and N. tabacum expressing lethality. Plant Biotechnol. J. 2004, 21, 151–154. [Google Scholar] [CrossRef]
  6. Stephens, S.G. The genetics of corky; the New World alleles and their possible role as an interspecific isolating mechanism. J. Genet. 1946, 47, 150–161. [Google Scholar] [CrossRef] [PubMed]
  7. Yamada, T.; Marubashi, W. Overproduced ethylene causes programmed cell death leading to temperature-sensitive lethality in hybrid seedlings from the cross Nicotiana suaveolens x N. tabacum. Planta 2003, 217, 690–698. [Google Scholar] [CrossRef] [PubMed]
  8. Dobzhansky, T. Genetics and the Origin of Species; Columbia University Press: New York, NY, USA, 1937. [Google Scholar]
  9. Muller, H.J. Isolating mechanisms, evolution and temperature. Biol. Symp. 1942, 6, 71–125. [Google Scholar]
  10. Bomblies, K.; Lempe, J.; Epple, P.; Warthmann, N.; Lanz, C.; Dangl, J.L.; Weigel, D. Autoimmune response as a mechanism for a Dobzhansky-Muller-type incompatibility syndrome in plants. PLoS Biol. 2007, 5, e236. [Google Scholar] [CrossRef] [PubMed]
  11. Chae, E.; Bomblies, K.; Kim, S.T.; Karelina, D.; Zaidem, M.; Ossowski, S.; Martín-Pizarro, C.; Laitinen, R.A.; Rowan, B.A.; Tenenboim, H. Species-wide genetic incompatibility analysis identifies immune genes as Hot Spots of deleterious epistasis. Cell 2014, 159, 1341–1351. [Google Scholar] [CrossRef] [PubMed]
  12. Jeuken, M.J.W.; Zhang, N.W.; Mchale, L.K.; Pelgrom, K.; Boer, E.D.; Lindhout, P.; Michelmore, R.W.; Visser, R.G.; Niks, R.E. Rin4 causes hybrid necrosis and race-specific resistance in an interspecific lettuce hybrid. Plant Cell 2009, 21, 3368. [Google Scholar] [CrossRef] [PubMed]
  13. Zhuang, M.; Zhang, Y.Y.; Fang, Z.Y.; Xue, Y.Q.; Liu, Y.M.; Yang, L.M. A preliminary study on hybrid seeding lethality in cabbage (Brassica oleracea, L.). Acta Hortic Sin 2012, 39, 2660. (In Chinese) [Google Scholar]
  14. Hu, Y.; Xue, Y.Q.; Liu, J.S.; Fang, Z.Y.; Yang, L.M.; Zhang, Y.Y; Lv, H.H.; Liu, Y.M.; Li, Z.S.; Zhuang, M. Hybrid lethality caused by two complementary dominant genes in cabbage (Brassica oleracea, L.). Mol. Breed. 2016, 36, 73. [Google Scholar] [CrossRef]
  15. Cheng, F.; Liu, S.; Wu, J.; Fang, L.; Sun, S.; Liu, B.; Li, P.; Hua, W.; Wang, X. Brassica database. Available online: http://brassicadb.org/brad/ (accessed on 18 May 2017).
  16. Parkin, I.A.; Koh, C.; Tang, H.; Robinson, S.J.; Kagale, S.; Clarke, W.E.; Town, C.D.; Nixon, J.; Krishnakumar, V.; Bidwell, S.L.; et al. TO1000DH genome. Available online: http://plants.ensembl.org/Brassica_oleracea/ (accessed on 18 May 2017).
  17. Lee, J.; Izzah, N.K.; Choi, B.S.; Joh, H.J.; Lee, S.C.; Perumal, S.; Seo, J.; Ahn, K.; Jo, E.J.; Choi, G.J.; et al. Genotyping-by-sequencing map permits identification of clubroot resistance QTLs and revision of the reference genome assembly in cabbage (Brassica oleracea L.). DNA Res. 2016, 23, 29. [Google Scholar] [CrossRef] [PubMed]
  18. Blencowe, B.J.; Ahmad, S.; Lee, L.J. Current-generation high-throughput sequencing: Deepening insights into mammalian transcriptomes. Gene Dev. 2009, 23, 1379–1386. [Google Scholar] [CrossRef] [PubMed]
  19. Murray, M.G.; Thompson, W.F. Rapid isolation of high molecular weight plant DNA. Nucleic Acid. Res. 1980, 8, 4321. [Google Scholar] [CrossRef] [PubMed]
  20. Michelmore, R.W.; Paran, I.; Kesseli, R.V. Identification of markers linked to disease-resistance genes by bulked segregant analysis: A rapid method to detect markers in specific genomic regions by using segregating populations. Proc. Natl. Acad. Sci. USA 1991, 88, 9828–9832. [Google Scholar] [CrossRef] [PubMed]
  21. Lv, H.H.; Wang, Q.B.; Han, F.Q.; Liu, X.; Fang, Z.Y.; Yang, L.M.; Zhuang, M.; Liu, Y.M.; Li, Z.S.; Zhang, Y.Y. Genome-wide indel/SSR scanning reveals significant loci associated with excellent agronomic traits of a cabbage (Brassica oleracea) elite parental line ‘01–20’. Sci. Rep. 2017, 7, 41696. [Google Scholar] [CrossRef] [PubMed]
  22. Grabherr, M.G.; Haas, B.J.; Yassour, M.; Levin, J.Z.; Thompson, D.A.; Amit, I.; Adiconis, X.; Fan, L.; Raychowdhury, R.; Zeng, Q. Full-length transcriptome assembly from RNA-Seq data without a reference genome. Nat. Biotechnol. 2011, 29, 644. [Google Scholar] [CrossRef] [PubMed]
  23. Trapnell, C.; Pachter, L.; Salzberg, S.L. TopHat: Discovering splice junctions with RNA-Seq. Bioinformatics 2009, 25, 1105–1111. [Google Scholar] [CrossRef] [PubMed]
  24. Trapnell, C.; Roberts, A.; Goff, L.; Pertea, G.; Kim, D.; Kelley, D.R.; Pachter, L. Corrigendum: Differential gene and transcript expression analysis of RNA-seq experiments with TopHat and Cufflinks. Nat. Protoc. 2012, 7, 562–578. [Google Scholar] [CrossRef] [PubMed]
  25. Mortazavi, A.; Williams, B.A.; Mccue, K.; Schaeffer, L.; Wold, B. Mapping and quantifying mammalian transcriptomes by RNA-Seq. Nat. Methods 2008, 5, 621–628. [Google Scholar] [CrossRef] [PubMed]
  26. Anders, S.; Huber, W. Differential expression analysis for sequence count data. Genome Biol. 2010, 11, R106. [Google Scholar] [CrossRef] [PubMed]
  27. Deng, Y.Y.; Li, J.Q.; Wu, S.F.; Zhu, Y.P.; Chen, Y.W.; He, F.C. Integrated NR database in protein annotation system and its localization. Comput. Eng. 2006, 32, 71–72. [Google Scholar]
  28. Benjamini, Y.; Hochberg, Y. Controlling the false discovery rate—A practical and powerful approach to multiple testing. J. Roy. Stat. Soc. A 1995, 57, 289–300. [Google Scholar]
  29. Tatusov, R.L.; Galperin, M.Y.; Natale, D.A.; Koonin, E.V. The COG database: A tool for genome-scale analysis of protein functions and evolution. Nucleic Acids Res. 2000, 28, 33–36. [Google Scholar] [CrossRef] [PubMed]
  30. Kanehisa, M.; Goto, S.; Kawashima, S.; Okuno, Y.; Hattori, M. The KEGG resource for deciphering the genome. Nucleic Acid. Res. 2004, 32, 277–280. [Google Scholar] [CrossRef] [PubMed]
  31. Ashburner, M.; Ball, C.A.; Blake, J.A.; Botstein, D.; Butler, H.; Cherry, M.J.; Davis, A.P.; Dolinski, K.; Dwight, S.S.; Eppig, J.T.; et al. Gene ontology: Tool for the unification of biology. Nat. Genet. 2000, 25, 25–29. [Google Scholar] [CrossRef] [PubMed]
  32. Young, M.D.; Wakefield, M.J.; Smyth, G.K.; Oshlack, A. Gene ontology analysis for RNA-seq: Accounting for selection bias. Genome Biol. 2010, 11, 1–12. [Google Scholar] [CrossRef] [PubMed]
  33. Xie, C.; Mao, X.; Huang, J.; Ding, Y.; Wu, J.M.; Dong, S.; Kong, L.; Gao, G.; Li, C.Y.; Wei, L.P. KOBAS 2.0: A web server for annotation and identification of enriched pathways and diseases. Nucleic Acids Res. 2011, 39, 316–322. [Google Scholar] [CrossRef] [PubMed]
  34. Kosambi, D.D. The estimation of map distances from recombination values. Ann. Eugen. 1943, 12, 172–175. [Google Scholar] [CrossRef]
  35. Liu, R.H.; Meng, J.L. MapDraw: A microsoft excel macro for drawing genetic linkage maps based on given genetic linkage data. Hereditas 2003, 25, 317–321. [Google Scholar] [PubMed]
  36. Li, H.B.; Handsaker, B.; Wysoker, A.; Fennell, T.; Ruan, J.; Homer, N.; Marth, G.; Abecasis, G.; Durbin, R. Genome Project Data Processing S: The Sequence Alignment/Map format and SAMtools. Bioinformatics 2009, 25, 2078–2079. [Google Scholar] [CrossRef] [PubMed]
  37. Livak, K.J.; Schmittgen, T.D. Analysis of relative gene expression data using real-time quantitative PCR and the 2 −ΔΔ c t Method. Methods 2001, 25, 402–408. [Google Scholar] [CrossRef] [PubMed]
  38. Flor, H.H. Current status of the gene-for-gene concept. Annu. Rev. Phytopathol. 2003, 9, 275–296. [Google Scholar] [CrossRef]
  39. Hulbert, S.H.; Webb, C.A.; Smith, S.M.; Sun, Q. Resistance gene complexes: Evolution and utilization. Annu. Rev. Phytopathol. 2003, 39, 285. [Google Scholar] [CrossRef] [PubMed]
  40. Meyers, B.C.; Dickerman, A.W.; Michelmore, R.W.; Sivaramakrishnan, S.; Sobral, B.W.; Young, N.D. Plant disease resistance genes encode members of an ancient and diverse protein family within the nucleotide-binding superfamily. Plant J. 1999, 20, 317–332. [Google Scholar] [CrossRef] [PubMed]
  41. Ea, V.D.; Jones, J.D. The NB-ARC domain: A novel signalling motif shared by plant resistance gene products and regulators of cell death in animals. Curr. Biol. 1998, 8, 226–227. [Google Scholar]
  42. Luo, M.; Zhu, Y.; Yu, C.; Wu, Z.; Zou, Y. Cloning of the plant resistance genes and their structure and function. Hereditas 2000, 22, 429–433. [Google Scholar]
  43. Bai, C.; Sen, P.; Hofmann, K.; Ma, L.; Goebl, M.; Harper, J.W.; Elledge, S.J. SKP1 connects cell cycle regulators to the ubiquitin proteolysis machinery through a novel motif, the F-box. Cell 1996, 86, 263–274. [Google Scholar] [CrossRef]
  44. Nagy, E.; Maquat, L.E. A rule for termination-codon position within intron-containing genes: When nonsense affects RNA abundance. Trends Biochem. Sci. 1998, 23, 198. [Google Scholar] [CrossRef]
  45. Francisco, M.; Soengas, P.; Velasco, P.; Bhadauria, V.; Cartea, M.E.; Rodríguez, V.M. Omics approach to identify factors involved in Brassica disease resistance. Curr. Issues Mol. Biol. 2015, 19, 31–42. [Google Scholar] [PubMed]
  46. Lv, H.H.; Fang, Z.Y.; Yang, L.M.; Zhang, Y.Y.; Wang, Q.B.; Liu, Y.M.; Zhuang, M.; Yang, Y.H.; Xie, B.Y.; Liu, B.; et al. Mapping and analysis of a novel candidate Fusarium wilt resistance gene FOC1 in Brassica oleracea. BMC Genom. 2014, 15, 1094. [Google Scholar] [CrossRef] [PubMed]
  47. Kawashima, C.G.; Guimarães, G.A.; Nogueira, S.R.; MacLean, D.; Cook, D.R.; Steuernagel, B.; Baek, J.; Bouyioukos, C.; V A Melo, B.D.; Tristão, G.; et al. A pigeonpea gene confers resistance to Asian soybean rust in soybean. Nat. Biotechnol. 2016, 34, 661–665. [Google Scholar] [CrossRef] [PubMed]
  48. Liu, Z.; Fang, Z.; Zhuang, M.; Zhang, Y.; Lv, H.; Liu, Y.; Li, Z.; Sun, P.; Tang, J.; Liu, D.; et al. Fine-mapping and analysis of Cgl1, a gene conferring glossy trait in cabbage (Brassica oleracea L.var. capitata). Front. Plant Sci. 2017, 8, 239. [Google Scholar] [PubMed]
  49. Lee, J.; Izzah, N.K.; Jayakodi, M.; Perumal, S.; Joh, H.J.; Lee, H.J.; Lee, S.C.; Park, J.Y.; Yang, K.W.; Nou, I.S.; et al. Genome-wide SNP identification and QTL mapping for black rot resistance in cabbage. BMC Plant Biol. 2015, 15, 32. [Google Scholar] [CrossRef] [PubMed]
  50. Sun, X.H.; Li, T.G.; Jia, S.R.; Huang, D.F. Bioinformatic analysis of the LRR-NBS gene family in rice. Sci. Agric. Sin. 2004, 37, 1–7. [Google Scholar]
  51. Abramovitch, R.B.; Anderson, J.C.; Martin, G.B. Bacterial elicitation and evasion of plant innate immunity. Nat. Rev. Mol. Cell. Biol. 2006, 7, 601–611. [Google Scholar] [CrossRef] [PubMed]
  52. Heath, M.C. Hypersensitive response-related death. Plant Mol. Biol. 2000, 44, 321–334. [Google Scholar] [CrossRef] [PubMed]
  53. Pontier, D.; Balagué, C.; Roby, D. The hypersensitive response. A programmed cell death associated with plant resistance. Comptes Rendus De Lacadémie Des Sciences Série III Sciences De La Vie 1998, 321, 721–734. [Google Scholar] [CrossRef]
  54. Rothberg, J.M.; Jacobs, J.R.; Goodman, C.S.; Artavanis-Tsakonas, S. Slit: An extracellular protein necessary for development of midline glia and commissural axon pathways contains both EGF and LRR domains. Gene Dev. 1990, 4, 2169–2187. [Google Scholar] [CrossRef] [PubMed]
  55. Manning, G.; Plowman, G.D.; Hunter, T.; Sudarsanam, S. Evolution of protein kinase signaling from yeast to man. Trends Biochem. Sci. 2002, 27, 514–520. [Google Scholar] [CrossRef]
Figure 1. Phenotypes of the parental lines and F1 hybrids and the segregating population strategy. (A) Phenotypes of the parental lines 09-211 and 09-222 and the F1 hybrids; (B) Segregating population strategies used to map BoHL1; (C) Segregating population strategies used to map BoHL2.
Genes 08 00147 g001
Figure 2. Fine mapping and analysis of BoHL1. (A) A genetic map and corresponding physical map of BoHL1. The BoHL1 gene was delimited to an interval between BoHLTO124 and BoHLTO130, with an estimated length of 101 kb. N: normal phenotype; (B) Twenty-eight genes were annotated in the ‘TO1000’ reference genome; (C) R-related gene analysis and differentially expressed genes (DEG) analysis for 28 genes.
Genes 08 00147 g002
Figure 3. Fine mapping and analysis of BoHL2. (A) A genetic map and corresponding physical map of BoHL2. The BoHL2 gene was delimited to an interval between HL234 and HL235, with an estimated length of 70 kb. N: normal phenotype; (B) Nine genes were annotated in the ‘TO1000’ reference genome; (C) R-related gene analysis and DEG analysis for nine genes.
Genes 08 00147 g003
Figure 4. Screening of DEGs and DEG functional analysis. (A) Significantly up-or down-regulated genes using the q-value threshold of <0.05; (B) GO enrichment analysis of the DEGs; (C) The top 20 Kyoto encyclopedia of genes and genomes (KEGG) pathways with the highest representation of DEGs.
Genes 08 00147 g004
Figure 5. Schematic of the pathway category ‘Plant-pathogen interaction’.
Genes 08 00147 g005
Figure 6. Validation of RNA-Seq data by qRT-PCR. Twelve genes were selected for validation and showed the same tendencies as revealed by the RNA-Seq data. FPKM: Fragments per kilobase of exon model per million mapped reads.
Genes 08 00147 g006
Figure 7. Collinearity analysis. (A) Collinearity analysis of the C1 chromosome in the ‘TO1000’ and ‘02-12’ reference genomes. (B) The physical position and collinearity analysis of the two mapping positions of BoHL1.
Genes 08 00147 g007
Table 1. Annotations and changes in gene expression in the mapping region of BoHL1.
Gene ID aGene Position on C1 bFunctional Annotation cq-value dSignificant e
Bo1g15323042,792,977–42,794,726Catalytic activity0.22844FALSE
Bo1g15324042,799,211–42,800,882MYB domain0.57873FALSE
Bo1g15325042,801,727–42,803,329Toll/interleukin-1 receptor homology (TIR) domain0.56028FALSE
P-loop containing nucleoside triphosphate hydrolase
Winged helix-turn-helix DNA-binding domain
Bo1g15326042,805,899–42,808,534Ubiquitin-related domain0.74850FALSE
Bo1g15327042,809,711–42,810,514Secondary shoot formation0.00123TRUE
Strigolactone biosynthetic process
Bo1g15328042,812,792–42,816,443Toll/interleukin-1 receptor homology (TIR) domain0.87254FALSE
P-loop-containing nucleoside triphosphate hydrolase
Leucine-rich repeat domain, L domain-like
Bo1g15329042,816,826–42,818,076NAD(P)-binding domain1FALSE
Glucose/ribitol dehydrogenase
Bo1g15330042,819,805–42,820,996NAD(P)-binding domain0.84117FALSE
Bo1g15331042,823,170–42,823,680NAD(P)-binding domainN/ANA
Bo1g15332042,828,669–42,832,299Toll/interleukin-1 receptor homology (TIR) domain0.00778TRUE
P-loop containing nucleoside triphosphate hydrolase
Leucine-rich repeat domain, L domain-like
Bo1g15333042,832,541–42,833,708Oxidoreductase activity0.00825TRUE
Oxidation-reduction process
NAD(P)-binding domain
Bo1g15334042,835,185–42,836,860Harbinger transposase-derived proteinN/AN/A
Bo1g153350428,376,66–42,838,484Myb-like domainN/AN/A
Bo1g15336042,838,840–42,839,506No commentN/AN/A
Bo1g15337042,843,786–42,845,295Agenet domain, plant typeN/AN/A
Bo1g15338042,846,297–42,849,389Toll/interleukin-1 receptor homology (TIR) domain1.43E–07TRUE
Ploop-containing nucleoside triphosphate hydrolase
Winged helix-turn-helix DNA-binding domain
Leucine-rich repeat domain, L domain-like
Bo1g15339042,849,475–42,850,408NAD(P)-binding domain0.04255FALSE
Glucose/ribitol dehydrogenase
Bo1g15340042,852,450–428,54,117Armadillo-type foldN/AN/A
Bo1g15341042,854,711–42,855,688No comment0.96769FALSE
Bo1g15342042,858,540–42,861,395T-complex protein 1, theta subunit0.40463FALSE
Bo1g15343042,862,213–42,864,216YTH domain0.93226FALSE
Bo1g15344042,869,749–42,873,374Protein kinase-like domain0.09861FALSE
Bo1g15345042,881,692–42,883,434NAD(P)-binding domain0.74443FALSE
Bo1g15346042,891,683–42,892,718No comment2.55E–32TRUE
Bo1g15347042,894,992–42,896,857Thioredoxin-like fold0.53912FALSE
Bo1g15348042,898,263–42,899,388No comment0.87865FALSE
Bo1g15349042900,367–42,900,597Response to auxin0.92167FALSE
Bo1g15350042,901,824–42,905,154GDP-fucose protein O-fucosyltransferase0.25833FALSE
a Genes ID (in ‘TO1000’) in the candidate region; b The physical positions of 28 genes on chromosome C1 (in ‘TO1000’); c Functional annotation of 28 genes; d q-value of 28 genes. N/A: no expression of the gene was detectable; e TRUE: significantly different; FALSE: no significant difference.
Table 2. Annotations and changes in the expression of genes in the mapping region of BoHL2.
Gene ID aGene Position on C4 bFunctional Annotation cq-value dSignificant e
Bo4g17373046,336,886–46,339,234Biosynthetic process0.44732FALSE
Catalytic activity
Bo4g17374046,341,684–46,342,808F-box domainN/AN/A
Bo4g17375046,364,288–46,367,249Protein kinase-like domain0.69186FALSE
Bo4g17376046,369,761–46,371,466Protein of unknown function DUF6880.37224FALSE
Bo4g17377046,376,730–46,377,865Domain of unknown function DUF1985N/AN/A
Bo4g17378046,383,190–46,387,379Protein kinase-like domain3.13E–08TRUE
Serine-threonine/tyrosine-protein
Kinase catalytic domain
Bo4g17379046,388,006–46,389,868No comment0.13635FALSE
Bo4g17380046,395,063–46,395,976No comment0.07896FALSE
Bo4g17381046,405,666–46,407,281Nucleic acid-binding, OB-fold0.00004TRUE
a Genes ID (in ‘TO1000’) in the candidate region; b The physical positions of nine genes on chromosome C4 (in ‘TO1000’); c Functional annotation of nine genes; d q-value of nine genes. N/A: no expression of the gene was detectable; e TRUE: significantly different; FALSE: no significant difference.

