
Identification, Characterization and Expression Profiling of Stress-Related Genes in Easter Lily (Lilium formolongi)
by
 ,
,
Jewel Howlader
1, 
Jong-In Park
1,
Arif Hasan Khan Robin
1 ,
,
Kanij Rukshana Sumi
2 and
Ill-Sup Nou
1,* 1
Department of Horticulture, Sunchon National University, 255, Jungang-ro, Suncheon, Jeonnam 57922, Korea
2
Department of Fisheries Science, Chonnam National University, 50, Daehak-ro, Yeosu, Jeonnam 59626, Korea
*
Author to whom correspondence should be addressed.
Genes 2017, 8(7), 172; https://doi.org/10.3390/genes8070172
Submission received: 4 May 2017
/
Revised: 8 June 2017
/
Accepted: 21 June 2017
/
Published: 27 June 2017
(This article belongs to the Special Issue Genetic Regulation of Abiotic Stress Responses)
Abstract
:Biotic and abiotic stresses are the major causes of crop loss in lily worldwide. In this study, we retrieved 12 defense-related expressed sequence tags (ESTs) from the NCBI database and cloned, characterized, and established seven of these genes as stress-induced genes in Lilium formolongi. Using rapid amplification of cDNA ends PCR (RACE-PCR), we successfully cloned seven full-length mRNA sequences from L. formolongi line Sinnapal lily. Based on the presence of highly conserved characteristic domains and phylogenetic analysis using reference protein sequences, we provided new nomenclature for the seven nucleotide and protein sequences and submitted them to GenBank. The real-time quantitative PCR (qPCR) relative expression analysis of these seven genes, including LfHsp70-1, LfHsp70-2, LfHsp70-3, LfHsp90, LfUb, LfCyt-b5, and LfRab, demonstrated that they were differentially expressed in all organs examined, possibly indicating functional redundancy. We also investigated the qPCR relative expression levels under two biotic and four abiotic stress conditions. All seven genes were induced by Botrytis cinerea treatment, and all genes except LfHsp70-3 and LfHsp90 were induced by Botrytis elliptica treatment; these genes might be associated with disease tolerance mechanisms in L. formolongi. In addition, LfHsp70-1, LfHsp70-2, LfHsp70-3, LfHsp90, LfUb, and LfCyt-b5 were induced by heat treatment, LfHsp70-1, LfHsp70-2, LfHsp70-3, LfHsp90, and LfCyt-b5 were induced by cold treatment, and LfHsp70-1, LfHsp70-2, LfHsp70-3, LfHsp90, LfCy-b5, and LfRab were induced by drought and salt stress, indicating their likely association with tolerance to these stress conditions. The stress-induced candidate genes identified in this study provide a basis for further functional analysis and the development of stress-resistant L. formolongi cultivars.
1. Introduction
Lily (Lilium L., 2n = 2x = 24), comprising members of the Liliaceae family, is one of the most popular groups of ornamental bulbous monocot outcrossing perennial herbs worldwide due to their incomparable beauty and commercial importance [1]. The Lilium genus contains nearly 110 to 115 species, which are primarily distributed in the cold and temperate regions of the Northern Hemisphere (10° N to 60° N), particularly Asia, North America, and Europe [2,3]. Among Asian countries, China, Nepal, Korea, and Japan are renowned centers of diversity of this genus worldwide [4]. Lily is one of the most important cut flowers in Korea. In 2011, the total cultivation area of Korean lily was 215 ha in the major growing regions of Gangwon, Jeju, and Chungcheongnam provinces with an annual production value of US$34 million according to the Ministry of Agriculture, Food, and Rural Affairs of the Republic of Korea [5]. The main export market of Korean cut lilies is Japan, totaling more than US$3 million in 2012 [6], but these flowers are also exported to the United States, China, and The Netherlands.
Like many other crops, lily faces a wide range of abiotic and biotic stresses. For example, substantial economic losses in lily production are attributed to leaf blight caused by Botrytis infection [7,8,9]. In addition, abiotic stresses, such as high and low temperature, drought, and salinity cause considerable degradation of lily flower quality and severely affect plant growth and development, resulting in reduced total production worldwide [10,11,12]. Furthermore, the ecological distribution of naturally grown Korean Lilium spp. has changed due to the adverse effects of climate change, resulting in a gradual decline in Lilium germplasm resources [13]. Therefore, it is important to develop lily cultivars with biotic and abiotic stress resistance to protect and conserve lily resources worldwide.
Efforts to explore potential resistance genes have helped speed the development of plant varieties with resistance to Botrytis spp., as well as to various abiotic stresses. Expressed sequence tag (EST) analysis provides a basis for selecting resistance-related genes [14]. Previously, published functional role categories of defense-related ESTs from L. longiflorum generative cells are available for further analysis [15]. ESTs are incomplete, unedited, randomly selected single-pass sequences derived from complementary DNA (cDNA) libraries and are highly valuable for further molecular analysis [16]. Rapid amplification of cDNA ends-PCR (RACE-PCR) can be used to obtain the full-length cDNA (mRNA) and protein sequences of stress-induced candidate EST genes [14].
Plants contain several types of stress-induced proteins, including HSP70 proteins, HSP90 proteins, ubiquitin proteins, cytochrome-b5 heme/steroid binding proteins, and RAB domain containing proteins. HSPs play an important role in maintaining cellular homeostasis under normal and various stress conditions in both prokaryotic and eukaryotic cells [17]. Ubiquitin proteins function through the ubiquitination of other proteins, especially HSPs. Under stress conditions, plants increase their ubiquitination capacity, which affects hormone biosynthesis, hormonal signaling cascades, and plant defense mechanisms [18,19]. In addition, cytochrome-b5 acts as an electron-transfer component in the desaturation reaction [20], which alters membrane fluidity, thereby enhancing adaptation to the environment [21]. Another type of stress-induced protein, the RAB, is conserved from yeast to animals. These proteins are linked to intracellular vesicle trafficking and play a vital role in plant resistance to pathogen and environmental stresses [22,23].
Little is known about biotic and abiotic stress-induced resistance genes in Lilium formolongi, whereas various molecular techniques, especially EST analysis, have been widely used to identify genes that function in biotic and abiotic stress responses in other plant species [24,25,26,27]. In the current study, we identified full-length stress-related candidate genes using ESTs from L. formolongi under various stress conditions to facilitate the development of stress-resistant L. formolongi varieties. We validated the stress-induced candidate genes through real-time quantitative PCR (qPCR) expression analysis of the stress-treated samples. Finally, we analyzed the deduced protein and nucleotide sequences of these genes in silico. This study lays the foundation for future plant breeding studies of stress resistance genes in the Liliaceae family.
2. Materials and Methods
2.1. Defense-Related EST Sequence Retrieval
The sequences of 12 defense-related EST genes identified from EST sequence analysis from L. longiflorum generative cells [15] were obtained from the National Center for Biotechnology Information (NCBI) database [28] and subjected to nucleotide BLAST searches using the Basic Local Alignment Search Tool (BLAST) from NCBI [29] to detect similarity with defense-related genes from other crop species.
2.2. Plant Materials
Seeds of L. formolongi line Sinnapal lily, which is susceptible to Botrytis spp., were germinated in plastic pots filled with disinfected soil mixture. The seedlings were grown in growth chambers at 22 °C under a 16 h light/8 h dark photoperiod with a photon flux density of 140 μmol m−2 s−1 at the Department of Horticulture, Sunchon National University, South Korea for both biotic and abiotic stress treatments. The relative humidity was maintained between 65% and 75%. Fresh roots, stems, leaves at the 5–6 leaf stage (two months), peduncles, tepals, stamens, and pistils of L. formolongi were harvested for organ-specific expression analysis, immediately frozen in liquid nitrogen, and stored at −80 °C for subsequent organ-specific expression analysis via qPCR.
2.3. Molecular Cloning of EST Sequences
The 12 defense-related EST nucleotide sequences retrieved from the NCBI database were designated L. formolongi 1–12 (Lf1–Lf12) (Table S1). Based on qPCR relative expression levels of 12 ESTs genes under biotic and abiotic stress conditions in L. formolongi in this study (data not shown), attempts were made to clone all 12 EST sequences, but only seven ESTs were successfully cloned (Lf6–Lf12) to obtain full length mRNA sequences (Table S1). For EST sequencing, total RNA was extracted from Lilium formolongi ‘Sinnapal lily’ control leaves using an RNeasy mini kit (Qiagen, Hilden, Germany) and treated with RNase-free DNase (Promega, Madison, WI, USA) to synthesize the 3′ ends of cDNA using a 3′ FULL RACE Core Set (Takara, Shiga, Japan) with Oligo dT-3 sites Adaptor Primer (AP) (5′-CTGATCTAGAGGTACCGGATCC-3′) and AMV reverse transcriptase XL. The PCR conditions for cDNA synthesis were the following: 30 °C for 10 min, 50 °C for 30 min, 95 °C for 5 min, and 5 °C for 5 min. To obtain the 3′ sequences of the genes, gene-specific primers were designed and ligated to the Oligo dT 3-sites AP sequence following the manufacturer’s protocol (Table S2). The PCR conditions were as follows: 30 cycles at 94 °C for 30 s, 55 °C for 30 s, and 72 °C for 5 min using Takara LA Taq (Takara, Shiga, Japan). The amplified DNA fragments from RT-PCR were purified using a Gel Extraction kit (Promega, Madison, WI, USA), cloned into the pTOP TA V2 vector, and transformed into competent Escherichia coli DH5α cells (Enzynomics, Daejeon, Korea). Plasmid DNA was extracted using a Plasmid Mini kit (Qiagen, Hilden, Germany) and sequenced by Standard-Sequencing (Macrogen, Seoul, Korea). The sequenced RACE products were checked by overlapping with the proper initial cDNA fragments. The sequence data were analyzed using the BLAST program from NCBI. To amplify the 5′ terminal region of cDNA, 5′ RACE PCR was performed based on the 3′ cloned sequences. The cDNA for 5′ RACE PCR was synthesized by RT-PCR of total RNA from control leaf tissue using 5' end-phosphorylated RT primer (Table S3) and a 5′ FULL RACE Core Set (Takara, Shiga, Japan) following the manufacturer’s instructions. Two-step PCR was performed using two sets of gene-specific forward and reverse primers with Takara LA Taq (Takara, Shiga, Japan) at the specified annealing temperature. After the second PCR step, amplified products were ligated into PCR 2.4 vectors (TOPO-TA Cloning kit, Invitrogen, Carlsbad, CA, USA) and sequenced as described above. The sequenced RACE products were combined by overlapping with the initial cloned cDNA fragments, followed by BLAST analysis using nucleotide and deduced protein sequences from NCBI.
2.4. Sequence Analysis of mRNA and Deduced Proteins
A protein homology study was carried out for the seven genes successfully cloned from ESTs using BLASTP from the NCBI database [29] (Table S4). The web tool SMART from European Molecular Biology Laboratories (EMBL) [30] was used to identify the different domains in the putative proteins. The primary structures of the genes were analyzed using ProtParam [31], and subcellular protein localization within the cell was determined using ProtComp version 9.0 from SoftBerry [32]. A multiple protein sequence alignment was conducted using Clustal Omega [33,34]. Editing and visualization of the sequence alignment were performed with Jalview, version 2.10.1 [35]. A multiple nucleotide sequence comparison was conducted with ClustalW [36]. Protein-protein interaction using molecular action networks were obtained using STRING software version 10.0 [37].
2.5. Phylogenetic Relationship and Motif Analysis
Proteins of L. formolongi with the reference proteins including Arabidopsis AtHsp70 [38] and AtHsp90 [39] retrieved from NCBI database were aligned by ClustalW program [36] and phylogenetic trees were constructed using the neighbor joining (NJ) algorithm in MEGA 6.06 [40,41]. A bootstrap analysis with 1000 replicates was used to evaluate the significance of the nodes. Pairwise gap deletion mode was considered to confirm that the divergent domains could contribute to the topology of the tree.
Multiple EM for Motif Elicitation (MEME) software (Version 4.11.2) was used to investigate the conserved motifs of the protein sequences [42]. The MEME search setting was developed to acquire the maximum number of motifs (10) with the optimum motif width range (6 to 50).
2.6. Biotic Stress Treatments with Botrytis Spp.
Two Botrytis spp., Botrytis cinerea and Botrytis elliptica, were cultured on Petri dishes containing potato dextrose agar (PDA) medium at 20 °C under near-UV light for 10 days until sufficient conidia appeared [7]. The conidia were collected by lightly vortexing in Tween-20 solution (0.05% Tween 20 in sterilized distilled water) [43], and sticky spores were removed from the agar medium with sterilized brushes. Suspended conidia were collected with sterilized pipettes and filtered through four layers of sterile Miracloth (Cat: 475855-1R, Calbiochem®, Billerica, MA, USA). The concentration of the conidial suspension was measured with a hemocytometer and adjusted to 5 × 10⁴ conidia/mL with sterile distilled water [43]. Four-month-old L. formolongi seedlings were evenly sprayed with B. cinerea or B. elliptica conidial suspension until the spore solution ran off of the leaf surface. Control and mock plants for both fungi were sprayed separately with pathogen-free distilled water. Botrytis-treated and mock-treated plants were transferred into separate polythene protected systems in a growth chamber and provided with mist to maintain 100% relative humidity for the first 48 h. Samples were harvested from infected and mock-treated plants at 0 h, 8 h, 1 d, 2 d, 3 d, 4 d, 5 d, and 7 days post inoculation (dpi) for B. cinerea and B. elliptica treatments. The youngest 2–3 leaves without midribs were harvested, snap-frozen in liquid nitrogen, and stored at −80 °C until use for RNA extraction. The disease progress index (%) for both fungi was recorded by visual scoring on a time-course basis.
2.7. Abiotic Stress Treatments
For abiotic stress treatments, L. formolongi seeds were surface disinfected with 70% ethanol for 30 s [44], followed by 1% NaClO plus 0.1% Tween-20 for 10 min in 5 mL Falcon tubes with gentle inversion, and rinsed three times with distilled water [44]. The surface-sterilized seeds were incised with a scalpel at both edges without disturbing the cotyledon to accelerate germination [44]. The sterilized, incised seeds were aseptically grown on fresh liquid half-strength MS medium (MSH) [45] in a culture room under a 16 h light photoperiod at 25 °C. After two months of growth, the seedlings were transferred to freshly prepared liquid MSH and were subjected to four different abiotic stress treatments: cold, heat, drought, and salt. To induce cold and heat stress, the seedlings were incubated at 4 °C and 37 °C for 48 h, respectively [46]. Drought treatment was applied by incubating the seedlings on 150 mm qualitative filter paper (Advantec®, Tokyo, Japan) in a culture room under a 16 h light photoperiod at 25 °C for up to 48 h [47]. For salt treatment, the roots of seedlings were soaked in 200 mM NaCl solution at 25 °C for up to 48 h [46]; mock-treated plants were treated with water. The youngest 2–3 leaves and roots were sampled separately at 0 h, 2 h, 8 h, 16 h, 24 h, and 48 h after stress treatments, frozen immediately in liquid nitrogen, and stored at –80 °C for RNA isolation.
2.8. RNA Extraction from Various Plant Organs and Stress-Treated (Biotic and Abiotic) Samples
Total RNA was extracted from the roots, stems, leaves, peduncles, tepals, stamens, and pistils of control plants, whereas only leaf samples were collected from mock and stress-treated plants. Total RNA was extracted using an RNeasy mini kit (Qiagen, Hilden, Germany), followed by treatment with RNase-free DNase (Promega, Madison, WI, USA) to remove any traces of genomic DNA contaminants. The cDNA synthesis performed using a Superscript® III First-Strand Synthesis kit (Invitrogen, Carlsbad, CA, USA) according to the manufacturer’s instructions. The relative expression levels among different tissues are compared with the transcript level of roots tissue similar to Khatun et al. [48,49].
2.9. Real-Time Quantitative PCR Expression Analysis of Different Organs and Stress-Treated Samples
Gene-specific primers for all seven genes were used for qPCR, whereas the housekeeping Ll-Actin primers from L. longiflorum (DQ019459) was used as the internal control in all analyses [50]. The qPCR was performed for the seven genes using 1 μL cDNA from all seven tissues including roots, stems, leaves, peduncles, tepals, stamens, and pistils of control; and mock and stress-treated L. formolongi separately in a 20 μL reaction volume containing 2× qPCR BIO SyGreen Mix Lo-Rox SYBR® Green Super-mix with ROX (PCR Biosystems Ltd., London, UK). The qPCR conditions were as follows: pre-incubation at 95 °C for 10 min, followed by three-step amplifications at 95 °C for 20 s, 58 °C for 20 s, and 72 °C for 25 s for 40 cycles. The melting conditions were 95 °C for 10 s, 65 °C for 60 s, and 97 °C for 1 s as a default setting. For quantification, the fluorescence was recorded following the last step of each cycle, and three replicates (n = 3) were averaged per sample. Amplification, detection, and data analysis were carried out using a LightCycler96 system (Roche, Mannheim, Germany). The relative gene expression levels were calculated using the 2−∆∆ct method [51].
2.10. Statistical Analyses
Gene expression levels obtained by qPCR were analyzed using a general linear model (GLM) with a completely randomized design (CRD) for analysis of variance (ANOVA). A Tukey test was conducted to identify differences between and among treatments and sampling points. A p-value less than 0.05 was considered to indicate statistical significance. All analyses were carried out using Statistical Analysis System (SAS) version 9.1 [52].
3. Results
3.1. Sequence Analysis of Defense-Related ESTs from L. formolongi
We retrieved 12 defense related ESTs from NCBI and designated them as L. formolongi 1–12 (Lf1–Lf12) (Table S1). NCBI nucleotide BLAST analysis showed that the putative stress-related proteins share high sequence similarity with defense-related proteins from various plant species (Table S1) [53,54,55,56,57,58,59,60,61]. The sequence similarity of ESTs with homologs from other plant species ranged from 75 to 85% (Table S1).
3.2. Molecular Cloning and Sequence Analysis of Stress-Related Genes
We successfully cloned and obtained the full-length mRNA sequence of seven EST genes using RACE PCR and submitted them to the NCBI under the GenBank accession numbers of KX683995–KX684001 (Table 1 and Figure S1). NCBI BLAST analysis of the deduced protein sequences including LfHsp70-1, LfHsp70-2, and LfHsp70-3 share 92% to 94% similarity with HSP70 reference proteins from other species (Table S4) [57,62,63,64,65,66,67,68,69,70,71,72,73]. Protein domain organization and multiple alignment with the reference proteins showed that all three LfHsp70 proteins contain a highly conserved HSP70 domain (heat shock family protein 70) (Table 1 and Figure S2). Therefore, we renamed these three proteins L. formolongi heat shock protein 70-1 (LfHsp70-1), LfHsp70-2, and LfHsp70-3 (Table 1). The fourth protein, LfHsp90 (Lf9 EST), shares 90–93% similarity with HSP90 reference proteins (Table S4) and contains a highly conserved HATPase, and an HSP90 domains (heat shock family protein 90) (Table 1 and Figure S3), so we renamed this protein L. formolongi heat shock family protein 90 (LfHsp90). The fifth protein on the list, LfUb, shares 62–73% similarity with the reference ubiquitin domain containing proteins (Table S4) and contains three characteristic conserved domains namely an ubiquitin homolog domain (UBQ), two ubiquitin-associated domains (UBA), and stress-inducible phosphoprotein motif (STI1) (Table 1 and Figure S4) and thus, we renamed this protein L. formolongi ubiquitin domain containing protein (LfUb). The sixth protein, LfHsp70 protein, shares 63–73% similarity with the reference cytochrome-b5 domain containing proteins (Table S4). Protein domain organization and multiple alignment revealed that LfHsp70 contains a conserved transmembrane region and a cytochrome-b5 heme/steroid binding domain (Table 1 and Figure S5) and hence, we renamed this protein L. formolongi cytochrome-b5 steroid binding domain containing protein (LfCytb5). Finally, the seventh protein, LfRab, shares 92–95% similarity with the reference proteins (Table S4) and contains a conserved RAB domain (Table 1 and Figure S6) and thus, we renamed this protein L. formolongi Rab domain containing protein (LfRab). The predicted molecular weights (MW) of the deduced proteins ranged from 22.86 to 80.23 kD, and their isoelectric points (pIs) ranged from 4.55 to 6.51 (Table 1). LfHsp70-1, LfHsp70-2, and LfHsp70-3 were predicted to be localized to the cytoplasm and nucleus, whereas LfHsp90 is seemed to be localized to the cytoplasm and membranes (Table 1). LfUb appeared to be localized in both cytoplasm and nucleus (Table 1), whereas LfCytb5 is expected to be localized to the plasma membrane, and LfRab is seemed to be localized to the cytoplasm, Golgi, and endoplasmic reticulum (Table 1).
3.3. Phylogenetic Relatedness and Motif Distribution of Defense-Related Proteins
The phylogenetic relatedness showed that the three putative proteins LfHsp70-1, LfHsp70-2, and LfHsp70-3; and LfHsp90 were distributed with the cytosolic reference proteins with strong bootstrap support (Figure 1A,B and Table S4) [38,39]. Stress-related protein LfUb was related with the ubiquitin domain containing protein (Figure 1C and Table S4); LfCytb5 was related with the cytochrome b5 domain containing protein (Figure 1D and Table S4); and LfRab was related with the Rab domain containing protein (Figure 1E and Table S4), with strong bootstrap support. GenBank accession numbers of the abbreviated reference proteins used to construct the trees are listed in Table S4.
Analysis of motif distribution compared with reference proteins showed that LfHsp70-1 and LfHsp70-3 contain nine identical conserved motifs, whereas LfHsp70-2 contains five identical conserved motifs, each containing 29–50 amino acids (Figure S7A) and LfHsp90 has 10 conserved motifs, each containing 50 amino acids (Figure S7B). LfUb contains 10 motifs ranging from 11–50 amino acids long (Figure S7C), whereas LfHsp70 has five conserved motifs ranging in size from 6–50 amino acids (Figure S7D). Finally, LfRab has six out of 10 conserved motifs, each comprising 11–50 amino acids (Figure S7E).
3.4. Organ-Specific Expression Analysis of Defense-Related Genes
We investigated the organ-specific expression patterns of seven genes viz., LfHsp70-1, LfHsp70-2, LfHsp70-3, LfHsp90, LfUb, LfCyt-b5, and LfRab using different tissues including roots, stems, leaves, peduncles, tepals, stamens, and pistils of L. formolongi line ‘Sinnapal lily’ by qPCR (Figure 2). The maximum expression (up-regulated between 1.7- and 5-fold) were observed at peduncle tissue for LfHsp70-1, LfHsp70-2, LfUb, and LfRab (Figure 2). The LfHsp70-3 showed the maximum expression (up-regulated 3.5-fold) in leaf whereas the LfCyt-b5 showed the highest expression (up-regulated 2.5-fold) in stamen (Figure 2). The LfHsp90 displayed the down-regulation in all tissues giving the minimum expression (down-regulated 6-fold) in stamen (Figure 2).
3.5. B. elliptica Is More Virulent than B. cinerea
Water-soaked lesions first formed at one day post inoculation (dpi) with both B. elliptica and B. cinerea. However, the leaf area occupied by lesions was greater under B. elliptica infection (55%) than under B. cinerea infection (45%) at 7 dpi (p < 0.05) (Figure 3).
3.6. qPCR Expression Analysis after Biotic Stress
3.6.1. Gene Expression in B. cinerea-Inoculated Susceptible L. formolongi
All seven genes (LfHsp70-1, LfHsp70-2, LfHsp70-3, LfHsp90, LfUb, LfCyt-b5, and LfRab) were markedly up-regulated upon B. cinerea inoculation compared to both control and mock-treated samples (Figure 4). The maximum expression levels (up-regulated between 3.8- and 25-fold versus the control) were observed at three days post inoculation for LfHsp70-1, LfHsp70-2, LfHsp70-3, and LfHsp90 (Figure 4). Two other genes, LfCyt-b5 and LfRab, displayed the highest expression levels at 7 dpi (up-regulated between 8.2- and 5-fold compared to the control; Figure 4). LfUb exhibited the highest expression level at 3 dpi (up-regulated 2.3-fold compared to the control; Figure 4).
3.6.2. Gene Expression in B. elliptica-Inoculated Susceptible L. formolongi
Five genes (LfHsp70-1, LfHsp70-2, LfUb, LfCyt-b5, and LfRab) were up-regulated under B. elliptica inoculation compared to both control and mock-treated samples (Figure 5). The highest expression levels (3- to 3.2-fold versus the control) were observed at 4 dpi for LfHsp70-1 and LfHsp70-2, respectively compared to the control (Figure 5). LfUb was up-regulated 3.7-fold at 4 dpi, whereas LfCyt-b5 and LfRab showed the highest levels of up regulation (3.1- and 3.4-fold, respectively versus the control) at 5 dpi (Figure 5). By contrast, LfHsp70-3 and LfHsp90 were down-regulated at almost all time points compared to the control (Figure 5).
3.7. Gene Expression under Abiotic Stress Conditions
3.7.1. Gene Expression under Heat Stress
Six genes (LfHsp70-1, LfHsp70-2, LfHsp70-3, LfHsp90, LfUb, and LfCyt-b5) were up-regulated at various time points after heat-stress treatment compared to both control and mock-treated samples (Figure 6). LfHsp70-1, LfHsp70-2, LfHsp70-3, and LfHsp90 were up regulated 8.5-, 8.0-, 5-, and 1.8-fold, respectively, at 2 h after heat-stress treatment compared to the control (Figure 6). LfUb and LfCyt-b5 were up-regulated 1.4-fold at 8 h after heat-stress treatment and 1.7-fold at 48 h after stress treatment, respectively, compared to the control (Figure 6). Finally, LfRab was down regulated at 16 and 24 h after heat-stress treatment compared to the control (Figure 6).
3.7.2. Gene Expression under Cold Stress
Under cold treatment, five genes (LfHsp70-1, LfHsp70-2, LfHsp70-3, LfHsp90, and LfCyt-b5) were up-regulated at different time points after cold-stress treatment compared to both control and mock-treated samples (Figure 7). LfHsp70-1, LfHsp70-2, LfHsp70-3, LfHsp90, and LfCyt-b5 were up-regulated (1.4-, 1.5-, 5.8-, 2.1-, and 1.8-fold, respectively) at 48 h after cold-stress treatment compared to the control (Figure 7). The two remaining genes, LfUb and LfRab, were not induced in cold stress-treated plants compared to the control (Figure 7).
3.7.3. Gene Expression under Drought Stress
Six genes (LfHsp70-1, LfHsp70-2, LfHsp70-3, LfHsp90, LfCyt-b5, and LfRab were up-regulated at different time points after drought-stress treatment compared to both control and mock-treated samples (Figure 8). LfHsp70-1, LfHsp70-2, and LfRab were up-regulated 4.9-, 3.7-, and 1.7-fold, respectively, at 8 h after drought-stress treatment compared to the control (Figure 8). LfHsp70-3 and LfCyt-b5 showed the highest levels of upregulation (4.8- and 1.5-fold, respectively, compared to the control) at 2 h after drought-stress treatment (Figure 8). By contrast, LfUb was not up-regulated in drought stress-treated plants compared to the control (Figure 8).
3.7.4. Gene Expression under Salt Stress
Five genes (LfHsp70-1, LfHsp70-2, LfHsp70-3, LfCyt-b5, and LfRab) were up-regulated at different time points after salt-stress treatment compared to both control and mock-treated samples (Figure 9). LfHsp70-1, LfHsp70-2, and LfHsp70-3 were highly expressed (up-regulated 3.9-, 3.1-, and 3.1-fold, respectively) at 8 h after salt-stress treatment compared to the control (Figure 9). LfRab and LfCyt-b5 exhibited the highest levels of upregulation (1.6- and 2.5-fold) at 2 h after stress treatment, respectively, compared to the control (Figure 9). LfHsp90 was up regulated only at 2 h after salt-stress treatment, followed by down regulation, while LfUb was down-regulated in salt stress-treated plants compared to the control at all time points (Figure 9).
3.8. Analysis of Stress-Related Protein Interactions
We investigated the physical and molecular action networks of the seven stress-related L. formolongi proteins and their association with the top-10 Arabidopsis proteins (Figure 10). LfHsp70-1, LfHsp70-2, and LfHsp70-3 are highly homologous to Arabidopsis Hsp70-3 (AT3G09440), which stabilizes pre-existent proteins against aggregation and mediates the folding of newly translated polypeptides in the cytosol and within organelles [74]. The Arabidopsis Hsp70-3 homolog closely interacts with the Hsp70-2 isoform, indicating that these isoforms are functionally similar (Figure 10A). Therefore, different isoforms of LfHsp70 might interact and function as co-activators during plant growth, development, and stress defense responses (Figure 10A) [74]. LfHsp90 is highly homologous to Arabidopsis Hsp81.4, which associates with proteins such as hormone receptors and some classes of kinases and is implicated in signal transduction and development (Figure 10B) [75]. Again, Arabidopsis Hsp81.4 positively interacts with Hsp70-3 (AT3G09440) during various developmental phases in cells [75]. Similarly, LfHsp90 might play an important role in plant signal transduction [39]. LfUb is highly homologous to RAD23C (RADIATION SENSITIVE 23C), which might be involved in nucleotide excision repair (Figure 10C). RAD23C also interacts with RPN1A, which is required during embryogenesis [76] and for optimal plant growth and stress responses [77]. Hence, LfUb might interact with different functional partners in various growth, development, and stress-response mechanisms. LfCy-b5 is highly homologous to MSBP1 (membrane steroid binding protein 1) that modulates cell elongation and brassinosteroid signaling and may function as a co-receptor with BAK1, resulting in increased endocytosis [78]. This protein also interacts with CYP51G1 (cytochrome P450 51G1) by binding with UBQ10 (polyubiquitin 10), which is induced by salicylic acid (Figure 10D), suggesting that it might be involved in providing defense against stress. LfRab is highly homologous to RABB1C (RAB GTPase homolog B1C), which functions in intracellular vesicle trafficking and protein transport (Figure 10E). Again, RABB1C binds to fls2 (FLAGELLIN-SENSITIVE 2), comprising the pattern-recognition receptor (PPR), which recognizes flagellin (flg22), a potent elicitor of the defense response, leading to pathogen-associated molecular pattern (PAMP)-triggered immunity.
4. Discussion
Based on stress-induced expression profiling of 12 defense-related EST genes under stress conditions in this study (data not shown), we successfully cloned seven defense-related candidate genes from L. formolongi line Sinnapal (Table 1). We then obtained seven complete mRNAs corresponding to the seven selected EST genes via RACE-PCR. Seven genes and their deduced protein sequences were analyzed in silico. We conducted a relative expression analysis by qPCR of these seven genes in various organ tissues of control plants; and under B. cinerea, B. elliptica infection, and four abiotic stress including heat-, cold-, drought-, and salt-treated leaf tissues to explore the stress-responsive expression patterns of these genes in L. formolongi.
4.1. Importance of Sequence Variation in Defense-Related Proteins
Protein sequence alignment revealed that all three LfHsp70 isoforms, namely LfHsp70-1, LfHsp70-2, and LfHsp70-3, contain highly conserved, N-terminal ATPase domains [79] and C-terminal peptide-binding domains [80] followed by a substrate-binding consensus nuclear localization signal ‘GTPIEEVD’ (Figure S2) [38]. The intrinsic ATPase activity of Hsp70 is required for it to form hetero-complexes with co-chaperones such as DnaJ/Hsp40 and GrpE and is involved in the successive cycles of substrate binding and release [81]. Therefore, hetero-complex activity might vary due to the various deletions of N-terminal amino acids in LfHsp70-1, LfHsp70-2, and LfHsp70-3 (Figure S2). Moreover, higher protein similarity of these proteins suggests that they might be functionally redundant [56]. At least three cytoplasmic Hsp70s exist in plants [82]. Phylogenic analysis indicated that similar to Hsp70 family members of Arabidopsis, AtHsp70 (AtHsp70-1 to AtHsp70-5; AtHsp70-18), lily Hsp70 genes LfHsp70-1, LfHsp70-2, and LfHsp70-3 could be localized in cytoplasm (Figure 1A) [38]. Similar to Hsp90 of Arabidopsis AtHsp90 (AtHsp90-1 to AtHsp90-4), LfHsp90 could also be localized in cytoplasm (Figure 1B) [39,83]. LfHsp90 contains a highly conserved N-terminal ATP binding domain attached to a highly conserved C-terminal region by a “charged linker”, which varies in length and composition among species and isoforms (Figure S3) [84]. Importantly, conformational changes occur in Hsp90s due to the intrinsic ATPase activity (Figure S3) [85]. LfHsp90 contains a leucine zipper motif in the middle of the polypeptide shared with the five reference members (Figure S3), which might contribute to its specificity and stability during the dimerization process with several transcription factors [86]. Sequence alignment showed that LfUb contains a highly conserved UBQ domain (Figure S4) [87], which might interact with other proteins through its post-translational attachment (ubiquitination) and modify their functions, locations, or trafficking patterns [88]. Two other UBA domains are separated by STI1, and N- and C-termini of STI1 can bind to Hsp70 and Hsp90, respectively, which might facilitate the trafficking of a variety of proteins through the cytoplasm Figure S4 [89] or may function as chaperone complexes [90]. Plasma membrane-localized LfHsp70 protein includes cytochrome-b5 heme/steroid binding domains found in a diverse range of proteins (Figure S5). However, LfRab along with other Rab domain containing proteins vary mostly at their carboxyl termini, which function in subcellular targeting due to the well-conserved guanine-nucleotide binding region (Figure S6) [22].
4.2. L. formolongi Defense-Related Genes Are Active in All Organs
We investigated the expression patterns of LfHsp70-1, LfHsp70-2, LfHsp70-3, LfHsp90, LfUb, LfHsp70, and LfRab in various organs including roots, stems, leaves, peduncles, tepals, stamens, and pistils (Figure 2). Differential expression patterns of LfHsp70-1, LfHsp70-2 and LfHsp70-3 in different tissues indicate that various isoforms of LfHsp70 genes are expressed constitutively and are functionally redundant. Accumulating evidence shows that various Hsp70 family members and LfHsp90 play constitutive but functionally distinct roles in growth and development in different plants [74,82,91,92]. Differential upregulated expression of three other family genes, LfUb, LfCyt-b5, and LfRab, in all organs suggests that they might be involved in growth and developmental processes in lily (Figure 2). Reports revealed that Rab family genes are up-regulated during growth and development in legumes [93].
4.3. Expression Analysis of L. formolongi Defense-Related Genes under Botrytis Infection
Since plants are continuously challenged by a variety of biotic and abiotic stresses, they have evolved many stress-tolerance and defense mechanisms to reduce damage [94]. Botrytis spp. secretes an elicitor that triggers a series of rapid host responses in lily, including the production of transient Ca+2 ion fluxes, followed by the production of reactive oxygen species (ROS), resulting in plant death [95,96]. Conversely, ROS can function as a cross-linking agent during the hypersensitive response (HR), as well as activating cytosolic Ca2+ signaling cascades to induce R-gene-mediated disease-resistance mechanisms [96]. In Arabidopsis, an immune response is regulated by cytosolic Hsp70, together with SGT1 (suppressor of G2 allele kinetochore protein), under pathogenic stress conditions [97] and is involved in the stability of R proteins, cell death, and the positive regulation of immunity [98,99]. Hsp90, together with SGT1 and RAR1 (required for Mla12 resistance), likely regulate the activity and stability of R proteins, which accumulate due to the recognition of pathogen-derived effectors, resulting R-mediated disease resistance in Arabidopsis [100,101]. In addition, silencing of Hsp90 reduces the accumulation of R proteins in tomato, confirming its role in R-mediated disease resistance [99]. In the current study, LfHsp70-1, LfHsp70-2, LfHsp70-3, and LfHsp90 were strongly induced by B. cinerea, whereas LfHsp70-1 and LfHsp70-2 were specifically induced by B. elliptica, suggesting that all three members of the cytosolic LfHsp70 family and the cytosolic LfHsp90 protein are not equally active and do not regulate the accumulation of R proteins during the R-gene mediated disease resistance response under various pathogen stresses, specifically Botrytis spp (Figure 4 and Figure 5). LfUb was more responsive to B. elliptica than to B. cinerea at later time points (Figure 4 and Figure 5). Since a glucan fungal elicitor secreted by Phytophthora megasperma up- regulates ubiquitin transcripts in soybean cells [99], we speculate that effectors secreted by B. elliptica might increases LfUb transcript levels more strongly than those of B. cinerea, resulting in a stronger resistance interaction. Two other genes, LfCyt-b5 and LfRab, were more responsive to B. cinerea than to B. elliptica (Figure 4 and Figure 5). Cytochrome-b5 increases plant adaptation to stress by maintaining membrane fluidity through the desaturation of fatty acids under adverse environmental conditions [21]. Furthermore, cytochrome-b5, along with cytochrome P450 enzymes, are thought to be a source of ROS [20,102] under biotic stress conditions, which might contribute to disease tolerance in lily [103,104,105]. However, in Arabidopsis AtRabG3e (Rab7) is induced during biotic stresses due to infection by B. cinerea, leading to hypersensitive cell death [106,107]. AtRabGTPases are involved in intracellular vesicle trafficking, resulting in plant adaptation to pathogen stress [23,107].
4.4. Expression Analysis of L. formolongi Defense-Related Genes under Heat Stress
Six genes, LfHsp70-1, LfHsp70-2, LfHsp70-3, LfHsp90, LfUb, and LfCyt-b5, were significantly induced under heat treatment (Figure 6). In this study, the cytosolic chaperone gene LfHsp90 was expressed at much lower levels compared to the other LfHsp70 genes under heat-stress conditions during the same stress periods (Figure 6), suggesting that LfHsp70 is more responsive to heat stress than LfHsp90 in lily [108]. Importantly, the up-regulation of Hsp70 increases tolerance to endogenous oxidative damage under heat-stress conditions in transgenic chrysanthemum [105] and Arabidopsis [109]. Although the exact mechanism remains to be determined, Hsps might transmit heat shock signals through the Ca2+-CaM (calmodulin) pathway in lily; wheat plants under heat-stress conditions generate high levels of cytoplasmic Ca2+, which activates CaM production, subsequently stimulating the DNA-binding activity of heat-shock factor (HSF). The DNA-binding activity of HSF initiates the transcription and translation of Hsp genes, which regulates cellular homeostasis and plant tolerance to heat-stress [17,110]. LfUb was also induced by heat-stress conditions at 8 h after treatment (Figure 6). The ubiquitination capacity of plants increases under heat-stress conditions, which mediates plant defense mechanisms [18,19]. In addition, the heat shock chaperonin-binding motif STI1 of LfUb is a key component of Hsp70 or Hsp90 immune hetero-complexes, which regulate plant defense mechanisms [90]. Conversely, LfCyt-b5 was significantly induced at 48 h after stress treatment, suggesting that it might function in the heat stress response at later stages of treatment (Figure 6).
4.5. Expression Analysis of L. formolongi Defense-Related Genes under Cold Stress
Five genes, LfHsp70-1, LfHsp70-2, LfHsp70-3, LfHsp90, and LfCyt-b5, exhibited variable levels of induction under cold-stress conditions (Figure 7). LfHsp70-3 was the most highly induced, followed by LfHsp70-2, whereas almost no induction was observed for LfHsp70-1 at 48 h after cold stress treatment, indicating that LfHsp70 family genes are stimulated to varying degrees at later stages of cold stress compared to the early stages of heat stress (Figure 6 and Figure 7). These data also suggest that all LfHsp70 members are not equally responsive to cold-stress conditions. Indeed, some but not all Hsp70 genes are induced under cold stress in Arabidopsis [74], spinach, and tomato [82,108]. Conversely, LfHsp90 was significantly induced at 8 h after treatment compared to the two LfHsp70 members (Figure 7). Cytosolic Hsp90 in Brassica napus [111] and rice [112] are also induced by low temperature and like these genes, LfHsp90 might be essential for cold tolerance in lily. Although LfCyt-b5 remained almost inactive up to 24 h after stress treatment, this gene was significantly induced at 48 h after stress treatment, suggesting that it might functions in cold tolerance mechanisms at later stages in lily (Figure 7).
4.6. Expression Analysis of L. formolongi Defense-Related Genes under Drought Stress
Six genes, namely LfHsp70-1, LfHsp70-2, LfHsp70-3, LfHsp90, LfCytb5-like, and LfRab, were significantly induced under drought treatment (Figure 8). Importantly, all three LfHsp70 genes were induced to varying degrees, but their expression levels were higher than that of LfHsp90, indicating that all LfHsp70 genes play a more active role in drought tolerance than LfHsp90 (Figure 8). Increasing Hsp70 expressing under drought stress enhances drought resistance in transgenic tobacco [113] and chrysanthemum [105] by preventing endogenous oxidative stress. Based on their molecular chaperone and regulatory functions, the drought stress response might be mediated by two different Hsp mechanisms [113]. LfCyt-b5 was significantly induced at 2 h after stress treatment, suggesting that it might function under drought stress at early stages in lily. The upregulation of LfRab similar to Rab family gene AtRabG3e (Rab7) in transgenic Arabidopsis plants under drought conditions, suggests that this family gene might be involved in drought-stress tolerance [107].
4.7. Expression Analysis Defense-Related of L. formolongi Genes Under Salt Stress
Six genes, LfHsp70-1, LfHsp70-2, LfHsp70-3, LfHsp90, LfCyt-b5, and LfRab, were significantly induced under salt treatment (Figure 9). All three LfHsp70 genes, LfHsp70-1, LfHsp70-2, and LfHsp70-3, were significantly induced at 8 h after salt-stress treatment, which indicates that they are responsive at an early stage of stress but are not equally involved in the salt tolerance response (Figure 9). The up-regulation of Hsp70 increases tolerance against endogenous oxidative damage under salt-stress conditions in transgenic chrysanthemum [105] and transgenic tobacco [114]. Again, LfHsp90 was induced at 2 h after salt-stress treatment, but the fold-change in expression was quite low compared to the LfHsp70 genes under salt treatment (Figure 9). However, this gene was down-regulated at the end of the stress period, indicating that it may become active at the early stage of the post-stress period but may become inactive at the later stage (Figure 9). The significant up regulation of LfCyt-b5 at 48 h indicates its responsiveness to salt-stress condition at the later stage of the treatment period (Figure 9). LfRab was also significantly induced at 24 h after salt-stress treatment (Figure 9), indicating its possible association with the salt tolerance mechanism. Arabidopsis AtRabG3e (Rab7) [107] and rice OsRab7 [23] are highly induced under salt-stress conditions, suggesting that this gene family functions in salt tolerance. Indeed, overexpressing these genes increases salt tolerance in plants by enhanced vesicle trafficking.
5. Conclusions
Of the 12 defense-related ESTs genes in L. formolongi (Easter lily) identified from published data, we successfully cloned seven candidate ESTs by RACE-PCR and obtained their complete mRNA sequences. Sequence alignment of the seven deduced proteins with the reference proteins showed that the respective characteristic domains are well-conserved among proteins. Protein-protein interaction analysis showed that all seven proteins interact with different stress-related proteins, suggesting that they are stress-responsive. The qPCR analysis revealed that these defense-related genes are differentially expressed in all organs, suggesting that they are involved in growth and development. All seven genes were induced by B. cinerea inoculation and five genes were induced by B. elliptica inoculation, indicating their possible association with disease resistance mechanisms against the respective Botrytis spp. Six genes were induced by heat-stress treatment, five were induced by cold-stress treatment, and six were induced by drought and salt stress, suggesting they play multiple roles in stress responses in L. formolongi. The seven stress-induced lily genes seem to have a possible involvement in stress-related mechanisms, however they need to be studied further to see if their characterization proves any direct involvement in the increased resistance to biotic and abiotic stress and thus could be candidates to be used in genetic improvement.
Supplementary Materials
The following are available online at www.mdpi.com/2073-4425/8/7/172/s1. Table S1: Nucleotide homology analysis of 12 EST genes from Lilium formolongi. Table S2: Specific ligated primer sequences used for 3´ RACE PCR amplification of seven stress-related genes from L. formolongi. Table S3: Specific primer sequences used for cDNA synthesis and 5´ RACE PCR amplification of seven stress-related genes from L. formolongi. Table S4: Protein homology analysis of stress-related genes in L. formolongi. Table S5: Nucleotide sequence relatedness among the seven stress-related genes from L. formolongi. Table S6. Specific primer sequences used for qPCR amplification of EST genes from L. formolongi. Figure S1: Nucleotide and deduced amino acid sequences of seven stress-related genes in L. formolongi. Figure S2: Sequence alignment of three putative L. formolongi Hsp70 proteins. Figure S3: Sequence alignment of putative L. formolongi Hsp90 protein. Figure S4: Sequence alignment of putative L. formolongi ubiquitin domain containing protein. Figure S5: Sequence alignment of putative L. formolongi cytochrome-b5 domain containing protein. Figure S6: Sequence alignment of putative L. formolongi RAB domain containing protein. Figure S7: Schematic representation of the motifs identified in the seven putative L. formolongi proteins.
Acknowledgments
This research was supported by the Center for Horticultural Seed Development (Golden Seed Project Grant No. 213007-05-01-SB110), Ministry of Agriculture, Food and Rural Affairs, Republic of Korea. Seeds were kindly provided by Cheon-Young Song, Korea National College of Agriculture and Fisheries and fungus isolate was supplied by Gyung Ja Choi, Korea research Institute of Chemical Energy, Daejeon, Republic of Korea.
Author Contributions
I.-S.N. and J.-I.P. conceived and planned the work. J.H. designed and conducted all experiments under the supervision of I.S.N and J.-I.P., analyzed the data and wrote the manuscript. K.R.S. assisted J.H. with experimentation and analyzed the sequencing data. A.H.K.R. critically revised the manuscript and gave suggestions for improving it. All authors read and agreed to the final manuscript contents.
Conflicts of Interest
The authors declare that they have no conflict of interest.
References
- Shahin, A.; Kaauwen, M.V.; Esselink, D.; Bargsten, J.W.; van Tuyl, J.M.; Visser, R.G.; Arens, P. Generation and analysis of expressed sequence tags in the extreme large genomes. Lilium Tulipa. BMC Genom. 2012, 13, 640. [Google Scholar] [CrossRef]
- McRae, E.A. Lily species. In Lilies: A Guide for Growers and Collectors; Timber Press: Portland, OR, USA, 1998; pp. 105–204. [Google Scholar]
- Liang, S.Y.; Tamura, M. Flora of China; Wu, Z.Y., Raven, P.H., Eds.; Science Press/Missouri Botanical Garden Press: Beijing, China, 2000; Volume 24, pp. 135–159. [Google Scholar]
- Lim, K.B.; Barba-Gonzalez, R.; Zhou, S.; Ramanna, M.S.; Tuyl, J.M. Interspecific Hybridization in Lily (Lilium): Taxonomic and Commercial Aspects of Using Species Hybrids in Breeding. In Floriculture, Ornamental and Plant Biotechnology; Teixeira da Silva, J.A., Ed.; Global Science Books: Isleworth, UK, 2008; Volume V. [Google Scholar]
- Ministry of Agriculture, Food and Rural Affairs (MAFRA). Statistics for Floricultural Industry in 2011. 2012. Available online: http://www.mafra.go.kr/list.jsp?id=28564&pageNo=1&NOW_YEAR=2012&group_id=2&menu_id=52&link_menu_id=&division=B&board_kind=C&board_skin_id=C1&parent_code=34&link_url=&depth=2 (accessed on 31 July 2012).
- Korea International Trade Association (KITA). Available online: http://www.kita.net (accessed on 1 April 2016).
- Doss, R.P.; Chastagner, G.A.; Riley, K.L. Techniques for inoculum production and inoculation of lily leaves with Botrytis elliptica. Plant Dis. 1984, 68, 854–856. [Google Scholar] [CrossRef]
- Hahm, S.S.; Lee, K.H.; Lee, J.W.; Lee, H.D.; Yu, S.H. Control and incidence of leaf blight on lily with different cultural systems. Res. Plant Dis. 2007, 13, 152–156. [Google Scholar] [CrossRef]
- Cho, W.D.; Shin, H.D. List of Plant Disease in Korea, 5th ed.; Korean Society of Plant Pathology (KSPP): Suwon, Korea, 2009; p. 853. [Google Scholar]
- Bray, E.A.; Bailey-Serres, J. Plant Responses to abiotic stresses. In Biochemistry and Molecular Biology of Plants; Gruissem, W., Buchannan, B., Jones, R., Eds.; American Society of Plant Physiologists: Rockville, MD, USA, 2000; pp. 1158–1249. [Google Scholar]
- Wang, W.; Vinocur, B.; Altman, A. Plant responses to drought, salinity and extreme temperatures: Towards genetic engineering for stress tolerance. Planta 2003, 218, 1–14. [Google Scholar] [CrossRef] [PubMed]
- Kaoru, U.; Yukio, K.; Motoaki, S.; Kazuo, S. Omics: Analyses of regulatory networks in plant abiotic stress responses. Curr. Opin. Plant Biol. 2010, 13, 132–138. [Google Scholar] [CrossRef]
- Park, J.T.; Hwang, Y.J.; Lee, H.I.; Younis, A.; Lim, K.B. Ecological analysis of Lilium tsingtauense native in Korea. Hort. Environ. Biotechnol. 2014, 55, 230–236. [Google Scholar] [CrossRef]
- Mao, M.; Fu, G.; Wu, J.S.; Zhang, Q.H.; Zhou, J.; Kan, L.X. Identification of genes expressed in human CD34+ hematopoietic stem/progenitor cells by expressed sequence tags and efficient full-length cDNA cloning. Proc. Natl. Acad. Sci. USA 1998, 95, 8175–8180. [Google Scholar] [CrossRef] [PubMed]
- Okada, T.; Bhalla, P.L.; Singh, M.B. Expressed sequence tag analysis of Lilium longiflorum generative cells. Plant Cell Physiol. 2006, 47, 698–705. [Google Scholar] [CrossRef] [PubMed]
- Nagaraj, S.H.; Gasser, R.B.; Ranganathan, S. A hitchhiker’s guide to expressed sequence tag (EST) analysis. Brief Bioinform. 2007, 8, 6–21. [Google Scholar] [CrossRef] [PubMed]
- Wang, W.; Vinocur, B.; Shoseyov, O.; Altman, A. Role of plant heat shock proteins and molecular chaperones in the abiotic stress response. Trends Plant Sci. 2004, 9, 244–252. [Google Scholar] [CrossRef]
- Takizawa, M.; Goto, A.; Watanabe, Y. The tobacco ubiquitin activating enzymes NtE1A and NtE1B are induced by tobacco mosaic virus, wounding and stress hormones. Mol. Cells 2005, 19, 228–231. [Google Scholar] [PubMed]
- Dreher, K.; Callis, J. Ubiquitin, hormones and biotic stress in plants. Ann. Bot. 2007, 99, 787–822. [Google Scholar] [CrossRef] [PubMed]
- Schenkman, J.B.; Jansson, I. The many roles of cytochrome b5. Pharmacol. Ther. 2003, 97, 139–152. [Google Scholar] [CrossRef]
- Gostinčar, C.; Turk, M.; Gunde-Cimerman, N. The Evolution of Fatty Acid Desaturases and Cytochrome b5 in Eukaryotes. J. Membr. Biol. 2010, 233, 63–72. [Google Scholar] [CrossRef] [PubMed]
- Stenmark, H.; Olkkonen, V.M. The RabGTPase family. Genome Biol 2001, 2, reviews 3007.1–reviews 3007.7. [Google Scholar] [CrossRef] [PubMed]
- Peng, X.; Ding, X.; Chang, T.; Wang, Z.; Liu, R.; Zeng, X.; Cai, Y.; Zhu, Y. Overexpression of a vesicle trafficking gene, OsRab7, enhances salt tolerance in rice. Sci. World J. 2014, 2. [Google Scholar] [CrossRef] [PubMed]
- Ohlrogge, J.; Benning, C. Unraveling plant metabolism by EST analysis. Curr. Opin. Plant Biol. 2000, 3, 224–228. [Google Scholar] [CrossRef]
- White, J.A.; Todd, J.; Newman, T.; Focks, N.; Girke, T.; de Ilarduya, O.M.; Jaworski, J.G.; Ohlrogge, J.B.; Benning, C. A new set of Arabidopsis expressed sequence tags from developing seeds. The metabolic pathway from carbohydrates to seed oil. Plant Physiol. 2000, 124, 1582–1594. [Google Scholar] [CrossRef] [PubMed]
- Brandle, J.E.; Richman, A.; Swanson, A.K.; Chapman, B.P. Leaf ESTs from Stevia rebaudiana: A resource for gene discovery in diterpene synthesis. Plant Mol. Biol. 2002, 50, 613–622. [Google Scholar] [CrossRef] [PubMed]
- Arasan, S.K.T.; Park, J.I.; Ahmed, N.U.; Jung, H.J.; Lee, I.H.; Cho, Y.G.; Lim, Y.P.; Kang, K.K.; Nou, I.S. Gene ontology based characterization of Expressed Sequence Tags (ESTs) of Brassica rapa cv. Osome. Indian J. Exp. Biol. 2013, 51, 522–530. [Google Scholar] [PubMed]
- National Center for Biotechnology Information (NCBI) genetic database. Available online: http://www.ncbi.nlm.nih.gov/gene (accessed on 25 January 2017).
- Basic Local Alignment Search Tool (BLAST) from NCBI. Available online: http://www.ncbi.nlm.nih.gov/BLAST/ (accessed on 25 January 2017).
- Letunic, I.; Doerks, T.; Bork, P. SMART: recent updates, new developments and status in 2015. Nucleic Acids Res. 2015, 43, D257–D260. [Google Scholar] [CrossRef] [PubMed]
- Gasteiger, E.; Hoogland, C.; Gattiker, A.; Duvaud, S.; Wilkins, M.R.; Appel, R.D.; Bairoch, A. Protein Identification and Analysis Tools on the ExPASy Server; Walker, J.M., Ed.; The Proteomics Protocols Handbook, Humana Press: New York, NY, USA, 2005; pp. 571–607. [Google Scholar]
- MolQuest–Bioinformatics Toolbox for analysis of biomedical data. Available online: http://linux1.softberry.com/berry.phtml (accessed on 25 January 2017).
- Sievers, F.; Wilm, A.; Dineen, D.; Gibson, T.J.; Karplus, K.; Li, W.; Lopez, R.; McWilliam, H.; Remmert, M.; Söding, J.; et al. Fast, scalable generation of high-quality protein multiple sequence alignments using Clustal Omega. Mol. Syst. Biol. 2011, 7, 539. [Google Scholar] [CrossRef] [PubMed]
- Alva, V.; Nam, S.Z.; Söding, J.; Lupas, A.N. The MPI bioinformatics Toolkit as an integrative platform for advanced protein sequence and structure analysis. Nucleic Acids Res. 2016, 44, W410–W415. [Google Scholar] [CrossRef] [PubMed]
- Waterhouse, A.M.; Procter, J.B.; Martin, D.M.A.; Clamp, M.; Barton, G.J. Jalview Version 2—A multiple sequence alignment editor and analysis workbench. Bioinformatics 2009, 25, 1189–1191. [Google Scholar] [CrossRef] [PubMed]
- Thompson, J.D.; Gibson, T.J.; Plewniak, F.; Jeanmougin, F.; Higgins, D.G. The CLUSTAL_X windows interface: Flexible strategies for multiple sequence alignment aided by quality analysis tools. Nucleic Acids Res. 1997, 25, 4876–4882. [Google Scholar] [CrossRef] [PubMed]
- Szklarczyk, D.; Franceschini, A.; Wyder, S.; Forslund, K.; Heller, D.; Huerta-Cepas, J.; Simonovic, M.; Roth, A.; Santos, A.; Tsafou, K.P.; et al. STRING v10: Protein-protein interaction networks, integrated over the tree of life. Nucleic Acids Res. 2015, 43, D447–D452. [Google Scholar] [CrossRef] [PubMed]
- Lin, B.L.; Wang, J.S.; Liu, H.C.; Chen, R.W.; Meyer, Y.; Barakat, A.; Delseny, M. Genomic analysis of the Hsp70 superfamily in Arabidopsis thaliana. Cell Stress Chaperon. 2001, 6, 201–208. [Google Scholar] [CrossRef]
- Krishna, P.; Gloor, G. The Hsp90 family of proteins in Arabidopsis thaliana. Cell Stress Chaperones 2001, 6, 238–246. [Google Scholar] [CrossRef]
- Tamura, K.; Dudley, J.; Nei, M.; Kumar, S. MEGA4: Molecular evolutionary genetics analysis (MEGA) software version 4.0. Mol. Biol. Evol. 2007, 24, 1596–1599. [Google Scholar] [CrossRef] [PubMed]
- Saitou, N.; Nei, M. The neighbor-joining method: A new method for reconstructing phylogenetic trees. Mol. Biol. Evol. 1987, 4, 406–425. [Google Scholar] [PubMed]
- Bailey, T.L.; Williams, N.; Misleh, C.; Li, W.W. MEME: Discovering and analyzing DNA and protein sequence motifs. Nucleic Acids Res. 2006, 34, 369–373. [Google Scholar] [CrossRef] [PubMed]
- Lu, Y.Y.; Chen, C.Y. Molecular analysis of lily leaves in response to salicylic acid effective towards protection against Botrytis elliptica. Plant Sci. 2005, 169, 1–9. [Google Scholar] [CrossRef]
- Mori, S.; Adachi, Y.; Horimoto, S.; Suzuki, S.; Nakano, M. Callus formation and plant regeneration in various Lilium species and cultivars. In vitro Cell Dev. Biol. Plant. 2005, 41, 783–788. [Google Scholar] [CrossRef]
- Kedra, M.; Bach, A. Morphogenesis of Lilium martagon L. explants in callus culture. Acta Biol. Cracov. Ser. Bot. 2005, 47, 65–73. [Google Scholar]
- Wang, J.; Wang, Q.; Yang, Y.; Liu, X.; Gu, J.; Li, W.; Ma, S.; Lu, Y. De novo assembly and characterization of stress transcriptome and regulatory networks under temperature, salt and hormone stresses in Lilium lancifolium. Mol. Biol. Rep. 2014, 41, 8231–8245. [Google Scholar] [CrossRef] [PubMed]
- Ahmed, N.U.; Park, J.I.; Junga, H.J.; Kang, K.K.; Limc, Y.P.; Hurd, Y.; Nou, I.-S. Molecular characterization of thaumatin family genes related to stresses in Brassica rapa. Sci. Hort. 2013, 152, 26–34. [Google Scholar] [CrossRef]
- Khatun, K.; Robin, A.H.K.; Park, J.-I.; Nath, U.K.; Kim, C.K.; Lim, K.-B.; Nou, I.S.; Chung, M.-Y. Molecular Characterization and Expression Profiling of Tomato GRF Transcription Factor Family Genes in Response to Abiotic Stresses and Phytohormones. Int. J. Mol. Sci. 2017, 18, 1056. [Google Scholar] [CrossRef] [PubMed]
- Khatun, K.; Robin, A.H.K.; Park, J.-I.; Kim, C.K.; Lim, K.-B.; Kim, M.-B.; Lee, D.-J.; Nou, I.S.; Chung, M.-Y. Genome-Wide Identification, Characterization and Expression Profiling of ADF Family Genes in Solanum lycopersicum L. Genes 2016, 7, 79. [Google Scholar] [CrossRef] [PubMed]
- Xin, H.; Zhang, H.; Chen, L.; Li, X.; Lian, Q.; Yuan, X.; Hu, X.; Cao, L.; He, X.; Yi, M. Cloning and characterization of HsfA2 from Lily (Lilium longiflorum). Plant Cell Rep. 2010, 29, 875–885. [Google Scholar] [CrossRef] [PubMed]
- Livak, K.J.; Schmittgen, T.D. Analysis of relative gene expression data using real-time quantitative PCR and the 2 −∆∆ct method. Methods 2001, 25, 402–408. [Google Scholar] [CrossRef] [PubMed]
- SAS. SAS/STAT. Statistical Analysis Systems for Windows, Release 9.1; SAS Institute Inc.: Cary, NC, USA, 2004. [Google Scholar]
- Mochida, K.; Uehara-Yamaguchi, Y.; Takahashi, F.; Yoshida, T.; Sakurai, T.; Shinozaki, K. Large-Scale Collection and Analysis of Full-Length cDNAs from Brachypodium distachyon and Integration with Pooideae Sequence Resources. PLoS ONE 2013, 8, e75265. [Google Scholar] [CrossRef] [PubMed]
- Cooper, B.; Clarke, J.D.; Budworth, P.; Kreps, J.; Hutchison, D.; Park, S.; Guimil, S.; Dunn, M.; Luginbühl, P.; Ellero, C.; Goff, S.A.; Glazebrook, J. A network of rice genes associated with stress response and seed development. Proc. Natl. Acad. Sci. USA 2003, 100, 4945–4950. [Google Scholar] [CrossRef] [PubMed]
- Cha, J.Y.; Su’udi, M.; Kim, W.Y.; Kim, D.R.; Kwak, Y.S.; Son, D. Functional characterization of orchardgrass cytosolic Hsp70 (DgHsp70) and the negative regulation by Ca2+/AtCaM2 binding. Plant Physiol. Biochem. 2012, 58, 29–36. [Google Scholar] [CrossRef] [PubMed]
- Kudla, J.; Xu, Q.; Harter, K.; Gruissem, W.; Luan, S. Genes for calcineurin B-like proteins in Arabidopsis are differentially regulated by stress signals. Proc. Natl. Acad. Sci. USA 1999, 96, 4718–4723. [Google Scholar] [CrossRef] [PubMed]
- Salanoubat, M.; Lemcke, K.; Rieger, M.; Ansorge, W.; Unseld, M.; Fartmann, B.; Valle, G.; Blöcker, H.; Perez-Alonso, M.; Obermaier, B.; et al. Sequence and analysis of chromosome 3 of the plant Arabidopsis thaliana. Nature 2000, 408, 820–822. [Google Scholar] [CrossRef] [PubMed]
- Li, Q.B.; Anderson, J.V.; Guy, C.L. A cDNA clone encoding a spinach 70-kiloDalton heat-shock cognate. Plant Physiol. 1994, 105, 457–458. [Google Scholar] [CrossRef] [PubMed]
- Yabe, N.; Takahashi, T.; Komeda, Y. Analysis of Tissue-Specific Expression of Arabidopsis thaliana HSP90-Family Gene. Plant Cell Physiol. 1994, 35, 1207–1219. [Google Scholar] [CrossRef] [PubMed]
- Christensen, A.H.; Sharrock, R.A.; Quail, P.H. Maize polyubiquitin genes: Structure, thermal perturbation of expression and transcript splicing, and promoter activity following transfer to protoplasts by electroporation. Plant Mol. Biol. 1992, 18, 675–689. [Google Scholar] [CrossRef] [PubMed]
- Motamayor, J.C.; Mockaitis, K.; Schmutz, J.; Haiminen, N.; Livingstone, D., 3rd; Cornejo, O.; Findley, S.D.; Zheng, P.; Utro, F.; Royaert, S.; et al. The genome sequence of the most widely cultivated cacao type and its use to identify candidate genes regulating pod color. Genome Biol. 2013, 14, r53. [Google Scholar] [CrossRef] [PubMed]
- Rice Chromosomes 11 and 12 Sequencing Consortia. The Sequence of Rice Chromosomes 11 and 12, Rich in Disease Resistance Genes and Recent Gene Duplications. BMC Biol. 2005, 3. [Google Scholar] [CrossRef]
- Wang, Q.; Fang, R. Structure and expression of a rice hsp70 gene. Sci. China C Life Sci. 1996, 39, 291–299. [Google Scholar] [PubMed]
- Tuskan, G.A.; Difazio, S.; Jansson, S.; Bohlmann, J.; Grigoriev, I.; Hellsten, U.; Putnam, N.; Ralph, S.; Rombauts, S.; Salamov, A.; et al. The genome of black cottonwood Populus trichocarpa (Torr. & Gray). Science 2006, 313, 1596–1604. [Google Scholar] [CrossRef] [PubMed]
- Tang, H.; Krishnakumar, V.; Bidwell, S.; Rosen, B.; Chan, A.; Zhou, S.; Gentzbittel, L.; Childs, K.L.; Yandell, M.; Gundlach, H.; et al. An improved genome release (version Mt4.0) for the model legume Medicago truncatula. BMC Genom. 2014, 15, 312. [Google Scholar] [CrossRef] [PubMed]
- Wang, G.F.; Wei, X.; Fan, R.; Zhou, H.; Wang, X.; Yu, C.; Dong, L.; Dong, Z.; Wang, X.; Kang, Z.; et al. Molecular analysis of common wheat genes encoding three types of cytosolic heat shock protein 90 (Hsp90): Functional involvement of cytosolic Hsp90s in the control of wheat seedling growth and disease resistance. New Phytol. 2011, 191, 418–431. [Google Scholar] [CrossRef] [PubMed]
- Aoki, K.; Yano, K.; Suzuki, A.; Kawamura, S.; Sakurai, N.; Suda, K.; Kurabayashi, A.; Suzuki, T.; Tsugane, T.; Watanabe, M.; et al. Large-scale analysis of full-length cDNAs from the tomato (Solanum lycopersicum) cultivar Micro-Tom, a reference system for the Solanaceae genomics. BMC Genom. 2010, 11, 210. [Google Scholar] [CrossRef] [PubMed]
- Mendonça, Y.A.; Ramos, C.H. Cloning, purification and characterization of a 90kDa heat shock protein from Citrus sinensis (sweet orange). Plant Physiol. Biochem. 2012, 50, 87–94. [Google Scholar] [CrossRef] [PubMed]
- Fukushima, K.; Hasebe, M.; Fang, X. Genome of the pitcher plant Cephalotus reveals genetic changes associated with carnivory. Nat. Ecol. Evol. 2017, 1. [Google Scholar] [CrossRef]
- Schnable, P.S.; Ware, D.; Fulton, R.S.; Stein, J.C.; Wei, F.; Pasternak, S.; Liang, C.; Zhang, J.; Fulton, L.; Graves, T.A.; et al. The B73 maize genome: Complexity, diversity, and dynamics. Science 2009, 326, 1112–1115. [Google Scholar] [CrossRef] [PubMed]
- Zapata, L.; Ding, J.; Willing, E.M.; Hartwig, B.; Bezdan, D.; Jiao, W.B. Chromosome-level assembly of Arabidopsis thaliana Ler reveals the extent of translocation and inversion polymorphisms. Proc. Natl. Acad. Sci. USA 2016, 113, E4052–E4060. [Google Scholar] [CrossRef] [PubMed]
- Mayer, K.; Schüller, C.; Wambutt, R.; Murphy, G.; Volckaert, G.; Pohl, T.; Düsterhöft, A.; Stiekema, W.; Entian, K.D.; Terryn, N.; et al. Sequence and analysis of chromosome 4 of the plant Arabidopsis thaliana. Nature 1999, 402, 769–7777. [Google Scholar] [CrossRef] [PubMed]
- Olsen, J.L.; Rouzé, P.; Verhelst, B.; Lin, Y.C.; Bayer, T.; Collen, J. The genome of the seagrass Zostera marina reveals angiosperm adaptation to the sea. Nature 2016, 530, 331–335. [Google Scholar] [CrossRef] [PubMed]
- Sung, D.Y.; Vierling, E.; Guy, C.L. Comprehensive expression profile analysis of the Arabidopsis Hsp70 gene family. Plant Physiol. 2001, 126, 789–800. [Google Scholar] [CrossRef] [PubMed]
- Xu, Z.S.; Li, Z.Y.; Chen, Y.; Chen, M.; Li, L.C.; Ma, Y.Z. Heat shock protein 90 in plants: Molecular mechanisms and roles in stress responses. Int. J. Mol. Sci. 2012, 13, 15706–15723. [Google Scholar] [CrossRef] [PubMed]
- Brukhin, V.; Gheyselinck, J.; Gagliardini, V.; Genschik, P.; Grossniklaus, U. The RPN1 subunit of the 26S proteasome in Arabidopsis is essential for embryogenesis. Plant Cell. 2005, 17, 2723–2737. [Google Scholar] [CrossRef] [PubMed]
- Wang, S.; Kurepa, J.; Smalle, J.A. The Arabidopsis 26S Proteasome Subunit RPN1a Is Required for Optimal Plant Growth and Stress Responses. Plant Cell Physiol. 2009, 50, 1721–1725. [Google Scholar] [CrossRef] [PubMed]
- Song, L.; Shi, Q.M.; Yang, X.H.; Xu, Z.H.; Xue, H.W. Membrane steroid-binding protein 1 (MSBP1) negatively regulates brassinosteroid signaling by enhancing the endocytosis of BAK1. Cell Res. 2009, 19, 864–876. [Google Scholar] [CrossRef] [PubMed]
- Flaherty, K.M.; DeLuca-Flaherty, C.; McKay, D.B. Three-dimensional structure of the ATPase fragment of the 70 K heat-shock cognate protein. Nature 1990, 346, 623–628. [Google Scholar] [CrossRef] [PubMed]
- Zhu, X.; Zhao, X.; Burkholder, W.F.; Gragerov, A.; Ogata, C.M.; Gottesman, M.E.; Hendrickson, W.A. Structural analysis of substrate binding by the molecular chaperone Dnak. Science 1996, 272, 1606–1614. [Google Scholar] [CrossRef] [PubMed]
- Bukau, B.; Horwich, A.L. The Hsp70 and Hsp60 chaperone machines. Cell. 1998, 92, 351–366. [Google Scholar] [CrossRef]
- Guy, C.L.; Li, Q.B. The organization and evolution of the spinach stress 70 molecular chaperone gene family. Plant Cell. 1998, 10, 539–556. [Google Scholar] [CrossRef] [PubMed]
- Milioni, D.; Hatzopoulos, P. Genomic organization of Hsp90 gene family in Arabidopsis. Plant Mol. Biol. 1997, 35, 955–961. [Google Scholar] [CrossRef] [PubMed]
- Pearl, L.H.; Prodromou, C. Structure and in vivo function of Hsp90. Curr. Opin. Struct. Biol. 2000, 10, 46–51. [Google Scholar] [CrossRef]
- Panaretou, B.; Prodromou, C.; Roe, S.M.; O’Brien, R.; Ladbury, J.E.; Piper, P.W.; Pearl, L.H. ATP binding and hydrolysis are essential to the function of the Hsp90 molecular chaperone in vivo. EMBO J. 1998, 17, 4829–4836. [Google Scholar] [CrossRef] [PubMed]
- Kouzarides, T.; Ziff, E. Leucine zippers of fos, jun and GCN4 dictate dimerization specificity and thereby control DNA binding. Nature 1989, 340, 568–571. [Google Scholar] [CrossRef] [PubMed]
- Lee, J.H.; Kim, W.T. Regulation of abiotic stress signal transduction by E3 ubiquitin ligases in Arabidopsis. Mol. Cells. 2011, 31, 201–208. [Google Scholar] [CrossRef] [PubMed]
- Burger, A.M.; Seth, A.K. The ubiquitin-mediated protein degradation pathway in cancer: Therapeutic implications. Eur. J. Cancer 2004, 40, 2217–2229. [Google Scholar] [CrossRef] [PubMed]
- Pratt, W.B.; Toft, D.O. Steroid receptor interactions with heat shock protein and immunophilin chaperones. Endocr. Rev. 1997, 18, 306–360. [Google Scholar] [CrossRef] [PubMed]
- Lässle, M.; Blatch, G.L.; Kundra, V.; Takatoriand, T.; Zetter, B.R. Stress-inducible, murine protein mSTI1 characterization of binding domains for heat shock proteins and in vitro phosphorylation by different kinases. J. Biol. Chem. 1997, 272, 1876–1884. [Google Scholar] [CrossRef] [PubMed]
- Liu, Y.; Burch-Smith, T.; Schiff, M.; Feng, S.; Dinesh-Kumar, S.P. Molecular chaperone Hsp90 associates with resistance protein N and its signaling proteins SGT1 and Rar1 to modulate an innate immune response in plants. J. Biol. Chem. 2004, 279, 2101–2108. [Google Scholar] [CrossRef] [PubMed]
- Sangster, T.A.; Bahrami, A.; Wilczek, A.; Watanabe, E.; Schellenberg, K.; McLellan, C.; Kelley, A.; Kong, S.W.; Queitsch, C.; Lindquist, S. Phenotypic diversity and altered environmental plasticity in Arabidopsis thaliana with reduced Hsp90 levels. PLoS ONE 2007, 2, e648. [Google Scholar] [CrossRef] [PubMed]
- Marcote, M.J.; Gu, F.; Gruenberg, J.; Aniento, F. Membrane transport in the endocytic pathway: Animal versus plant cells. Protoplasma 2000, 210, 123–132. [Google Scholar] [CrossRef]
- Lee, J.H.; Yun, H.S.; Kwon, C. Molecular communications between plant heat shock responses and disease resistance. Mol. Cells 2012, 34, 109–116. [Google Scholar] [CrossRef] [PubMed]
- Van Baarlen, P.; Staats, M.; van Kan, J.A.L. Induction of programmed cell death in lily by the fungal pathogen Botrytis elliptica. Mol. Plant Pathol. 2004, 5, 559–574. [Google Scholar] [CrossRef] [PubMed]
- Govrin, E.M.; Rachmilevitch, S.; Tiwari, B.S.; Solomon, M.; Levine, A. An elicitor from Botrytis cinerea induces the hypersensitive response in Arabidopsis thaliana and other plants and promotes the gray mold disease. Phytopathol 2006, 96, 299–307. [Google Scholar] [CrossRef] [PubMed]
- Park, C.J.; Seo, Y.S. Heat shock proteins: A review of the molecular chaperones for plant immunity. Plant Pathol. J. 2015, 31, 323–333. [Google Scholar] [CrossRef] [PubMed]
- Liu, J.Z.; Whitham, S.A. Overexpression of a soybean nuclear localized type-III DnaJ domain-containing HSP40 reveals its roles in cell death and disease resistance. Plant J. 2013, 74, 110–121. [Google Scholar] [CrossRef] [PubMed]
- Van Ooijen, G.; Lukasik, E.; Van Den Burg, H.A.; Vossen, J.H.; Cornelissen, B.J.; Takken, F.L. The small heat shock protein 20 RSI2 interacts with and is required for stability and function of tomato resistance protein I-2. Plant J. 2010, 63, 563–572. [Google Scholar] [CrossRef] [PubMed]
- Shirasu, K. The HSP90-SGT1 chaperone complex for NLR immune sensors. Annu. Rev. Plant Biol. 2009, 60, 139–164. [Google Scholar] [CrossRef] [PubMed]
- Takahashi, A.; Casais, C.; Ichimura, K.; Shirasu, K. HSP90 interacts with RAR1 and SGT1, and is essential for RPS2-mediated disease resistance in Arabidopsis. Proc. Natl. Acad. Sci. USA 2003, 100, 11777–11782. [Google Scholar] [CrossRef] [PubMed]
- Dostalek, M.; Hardy, K.D.; Milne, G.L.; Morrow, J.D.; Chen, C.; Gonzalez, F.J.; Gu, J.; Ding, X.; Johnson, D.A.; Johnson, J.A. Development of Oxidative Stress by Cytochrome P450 Induction in Rodents Is Selective for Barbiturates and Related to Loss of Pyridine Nucleotide-dependent Protective Systems. J. Biol. Chem. 2008, 283, 17147–17157. [Google Scholar] [CrossRef] [PubMed]
- Sun, J.; Gu, J.; Zeng, J.; Han, S.; Song, A.; Chen, F.; Fang, W.; Jiang, J.; Chen, S. Changes in leaf morphology, antioxidant activity and photosynthesis capacity in two different drought-tolerant cultivars of chrysanthemum during and after water stress. Sci. Hortic. 2013, 161, 249–258. [Google Scholar] [CrossRef]
- Rivero, R.M.; Mestre, T.C.; Mittler, R.; Rubio, F.; Garcia-Sanchez, F.; Martinez, V. The combined effect of salinity and heat reveals a specific physiological, biochemical and molecular response in tomato plants. Plant Cell Environ. 2014, 37, 1059–1073. [Google Scholar] [CrossRef] [PubMed]
- Song, A.; Zhu, X.; Chen, F.; Gao, H.; Jiang, J.; Chen, S. A chrysanthemum heat shock protein confers tolerance to abiotic stress. Int. J. Mol. Sci. 2014, 15, 5063–5078. [Google Scholar] [CrossRef] [PubMed]
- Govrin, E.M.; Levine, A. The hypersensitive response facilitates plant infection by the necrotrophic pathogen Botrytis cinerea. Curr. Biol. 2000, 10, 751–757. [Google Scholar] [CrossRef]
- Mazel, A.; Leshem, Y.; Tiwari, B.S.; Levine, A. Induction of salt and osmotic stress tolerance by overexpression of an intracellular vesicle trafficking protein AtRab7 (AtRabG3e). Plant Physiol. 2004, 134, 118–128. [Google Scholar] [CrossRef] [PubMed]
- Li, Q.B.; Haskell, D.W.; Guy, C.L. Coordinate and non-coordinate expression of the stress 70 family and other molecular chaperones at high and low temperature in spinach and tomato. Plant Mol. Biol. 1999, 39, 21–34. [Google Scholar] [CrossRef] [PubMed]
- Sung, D.Y.; Guy, C.L. Physiological and molecular assessment of altered expression of Hsc70-1 in Arabidopsis. Evidence for pleiotropic consequences. Plant Physiol. 2003, 132, 979–987. [Google Scholar] [CrossRef] [PubMed]
- Liu, H.T.; Li, B.; Shang, Z.L.; Li, X.Z.; Mu, R.L.; Sun, D.; Zhou, R.G. Calmodulin is involved in heat shock signal transduction in wheat. Plant Physiol. 2003, 132, 1186–1195. [Google Scholar] [CrossRef] [PubMed]
- Krishna, P.; Sacco, M.; Cherutti, J.F.; Hill, S. Cold-induced accumulation of hsp90 transcripts in Brassica napus. Plant Physiol. 1995, 107, 915–923. [Google Scholar] [CrossRef] [PubMed]
- Pareek, A.; Singla, S.L.; Grover, A. Immunological evidence for accumulation of two high-molecular-weight (104 and 90 kDa) HSPs in response to different stresses in rice and in response to high temperature stress in diverse plant genera. Plant Mol. Biol. 1995, 29, 293–301. [Google Scholar] [CrossRef] [PubMed]
- Alvim, F.C.; Carolino, S.M.; Cascardo, J.C.; Nunes, C.C.; Martinez, C.A.; Otoni, W.C.; Fontes, E.P. Enhanced accumulation of BiP in transgenic plants confers tolerance to water stress. Plant Physiol. 2001, 126, 1042–1054. [Google Scholar] [CrossRef] [PubMed]
- Sugino, M.; Hibino, T.; Tanaka, Y.; Nii, N.; Takabe, T. Overexpression of DnaK from a halotolerant cyanobacterium Aphanothece halophytica acquires resistance to salt stress in transgenic tobacco plants. Plant Sci. 1999, 146, 81–88. [Google Scholar] [CrossRef]
Figure 1.
Phylogenetic analysis of seven putative stress-related Lilium formolongi proteins (highlighted in bold font; (A) Hsp70 family protein, (B) Hsp90 family protein, (C) Ubiquitin domain containing protein, (D) Cytochrome-b5 domain containing protein, and (E) RAB domain containing protein) with the respective reference proteins from other plant species. The phylogenetic trees were constructed with MEGA 6.06 using the neighbor-joining method. The results were confirmed using bootstrap analysis, with support values at the nodes representing percentages from 1000 repetitions. The scale represents the frequency of amino acid substitutions between sequences, as determined by the Poisson evolutionary distance method.
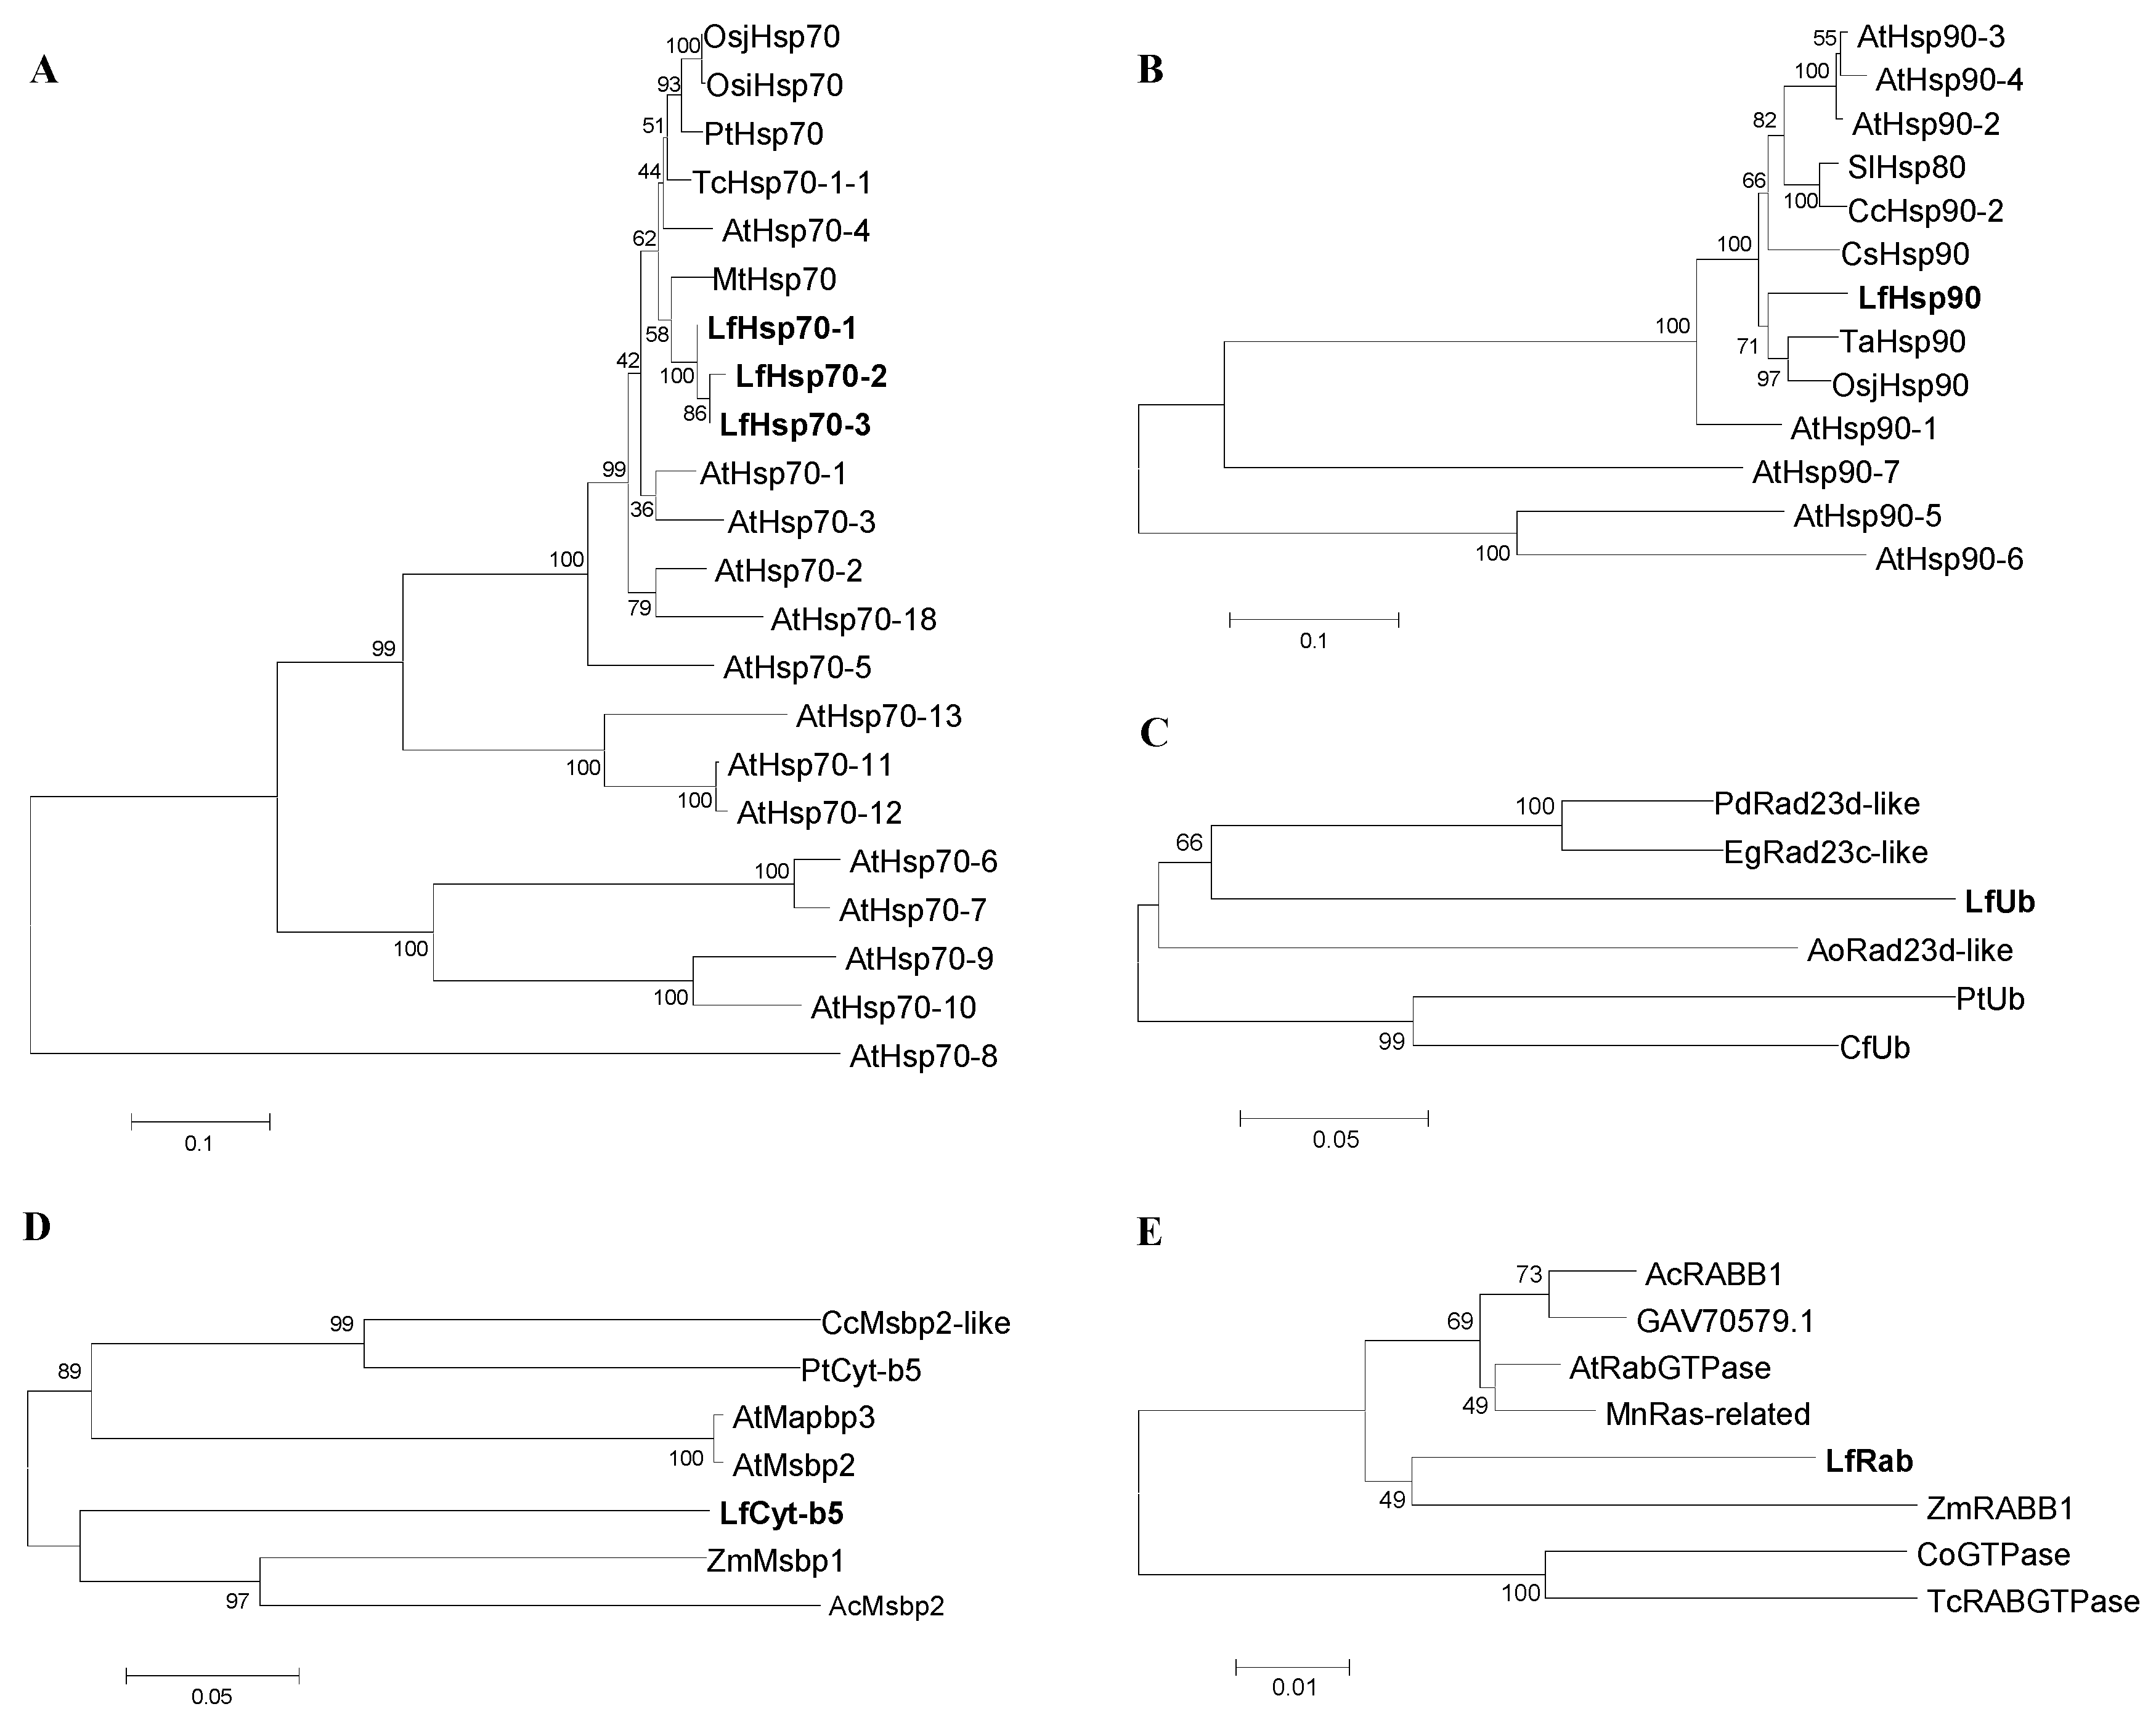
Figure 2.
Real-time quantitative PCR analysis of seven stress-related genes in different L. formolongi tissues. The error bars represent the standard error of the means of three independent replicates. Different letters (a, b, c, d, e, f, g) obtained from Tukey’s pairwise comparison test indicate statistically significant differences (p < 0.05) in relative expression of each gene at different time-points after treatment.
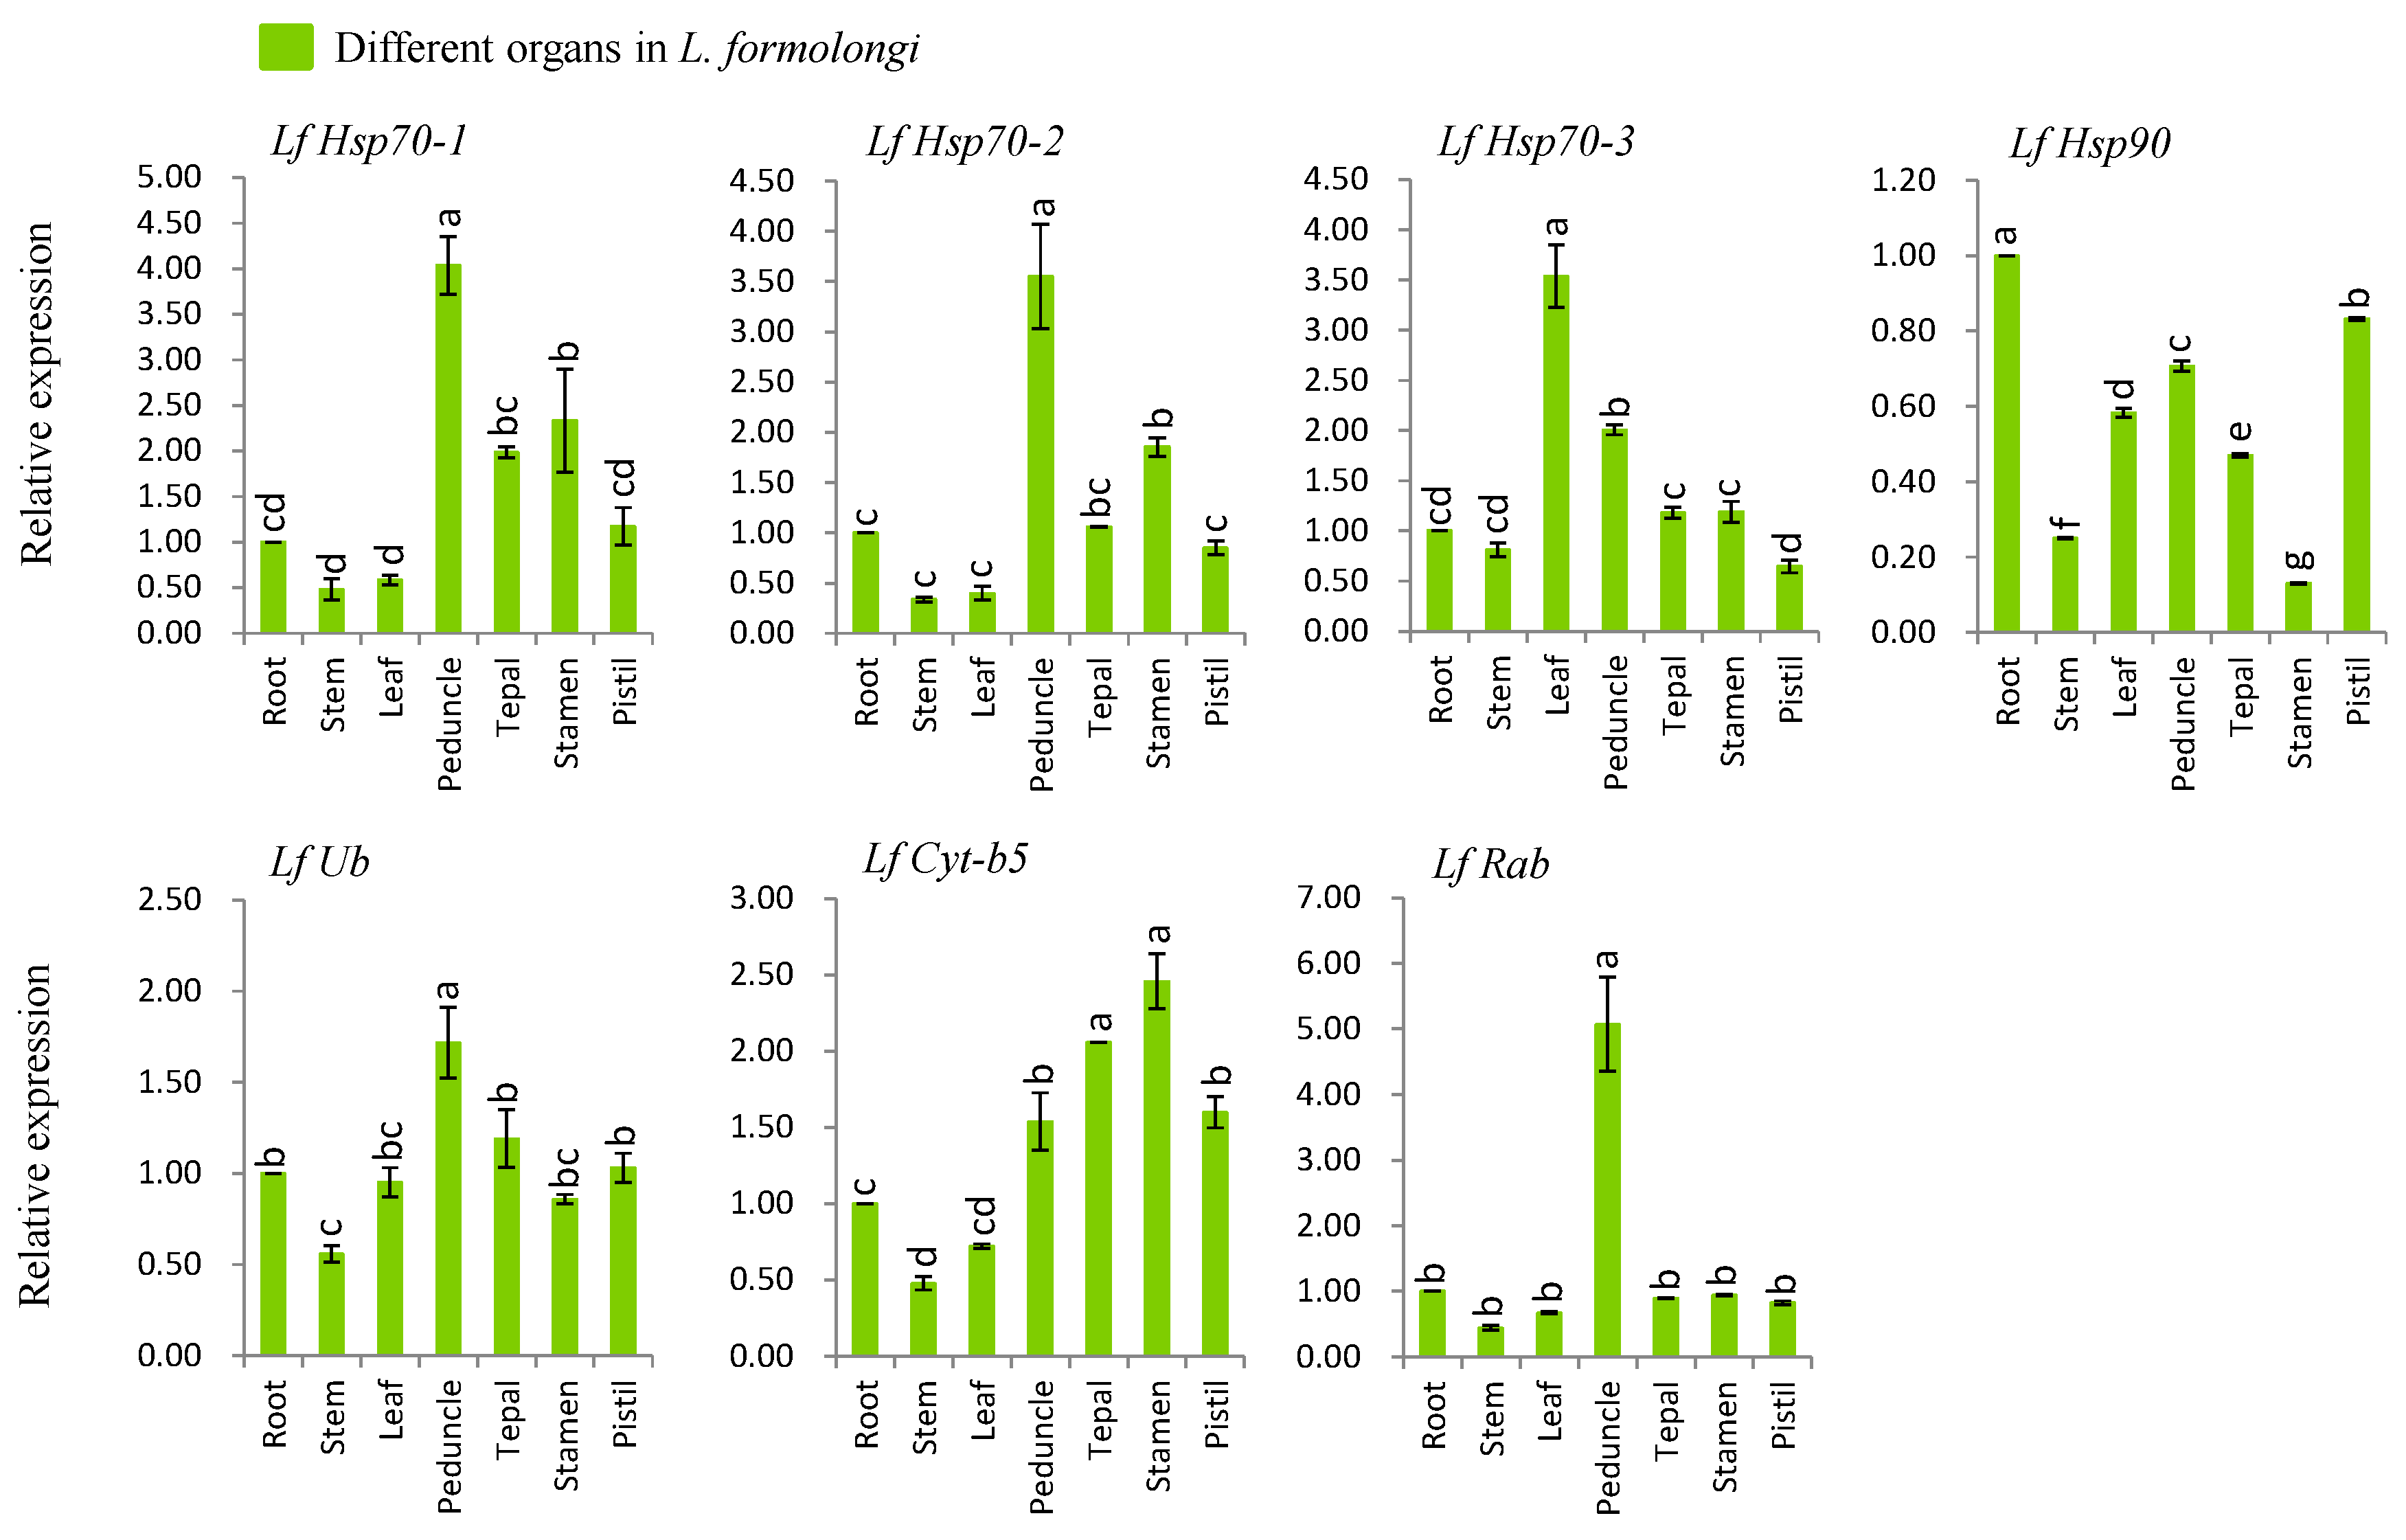
Figure 3.
Botrytis elliptica- and Botrytis cinerea-inoculated susceptible L. formolongi line Sinnapal lily showing disease progression at different time points.
Figure 3.
Botrytis elliptica- and Botrytis cinerea-inoculated susceptible L. formolongi line Sinnapal lily showing disease progression at different time points.

Figure 4.
Real-time quantitative PCR to investigate the relative expression of seven stress-induced genes in L. formolongi line Sinnapal lily infected by B. cinerea. The error bars represent the standard error of the means of three independent replicates. Different letters (a, b, c, d, e) obtained from Tukey’s pairwise comparison test indicate statistically significant differences (p < 0.05) in relative expression of each stress-induced gene at different time-points after treatment.

Figure 5.
Real-time quantitative PCR to investigate the relative expression of stress-induced genes in susceptible L. formolongi line Sinnapal lily infected by B. elliptica. The error bars represent the standard error of the means of three independent replicates. Different letters (a, b, c, d, e) obtained from Tukey’s pairwise comparison test indicate statistically significant difference (p < 0.05) in relative expression of each stress-induced gene at different time-points after treatment.

Figure 6.
Real-time quantitative PCR to investigate the relative expression of stress-induced genes in response to heat stress treatments in L. formolongi line Sinnapal lily. The error bars represent the standard error of the means of three independent replicates. Different letters (a, b, c, d) obtained from Tukey’s pairwise comparison test indicate statistically significant differences (p < 0.05) in relative expression of each stress-induced gene at different time-points after treatment.
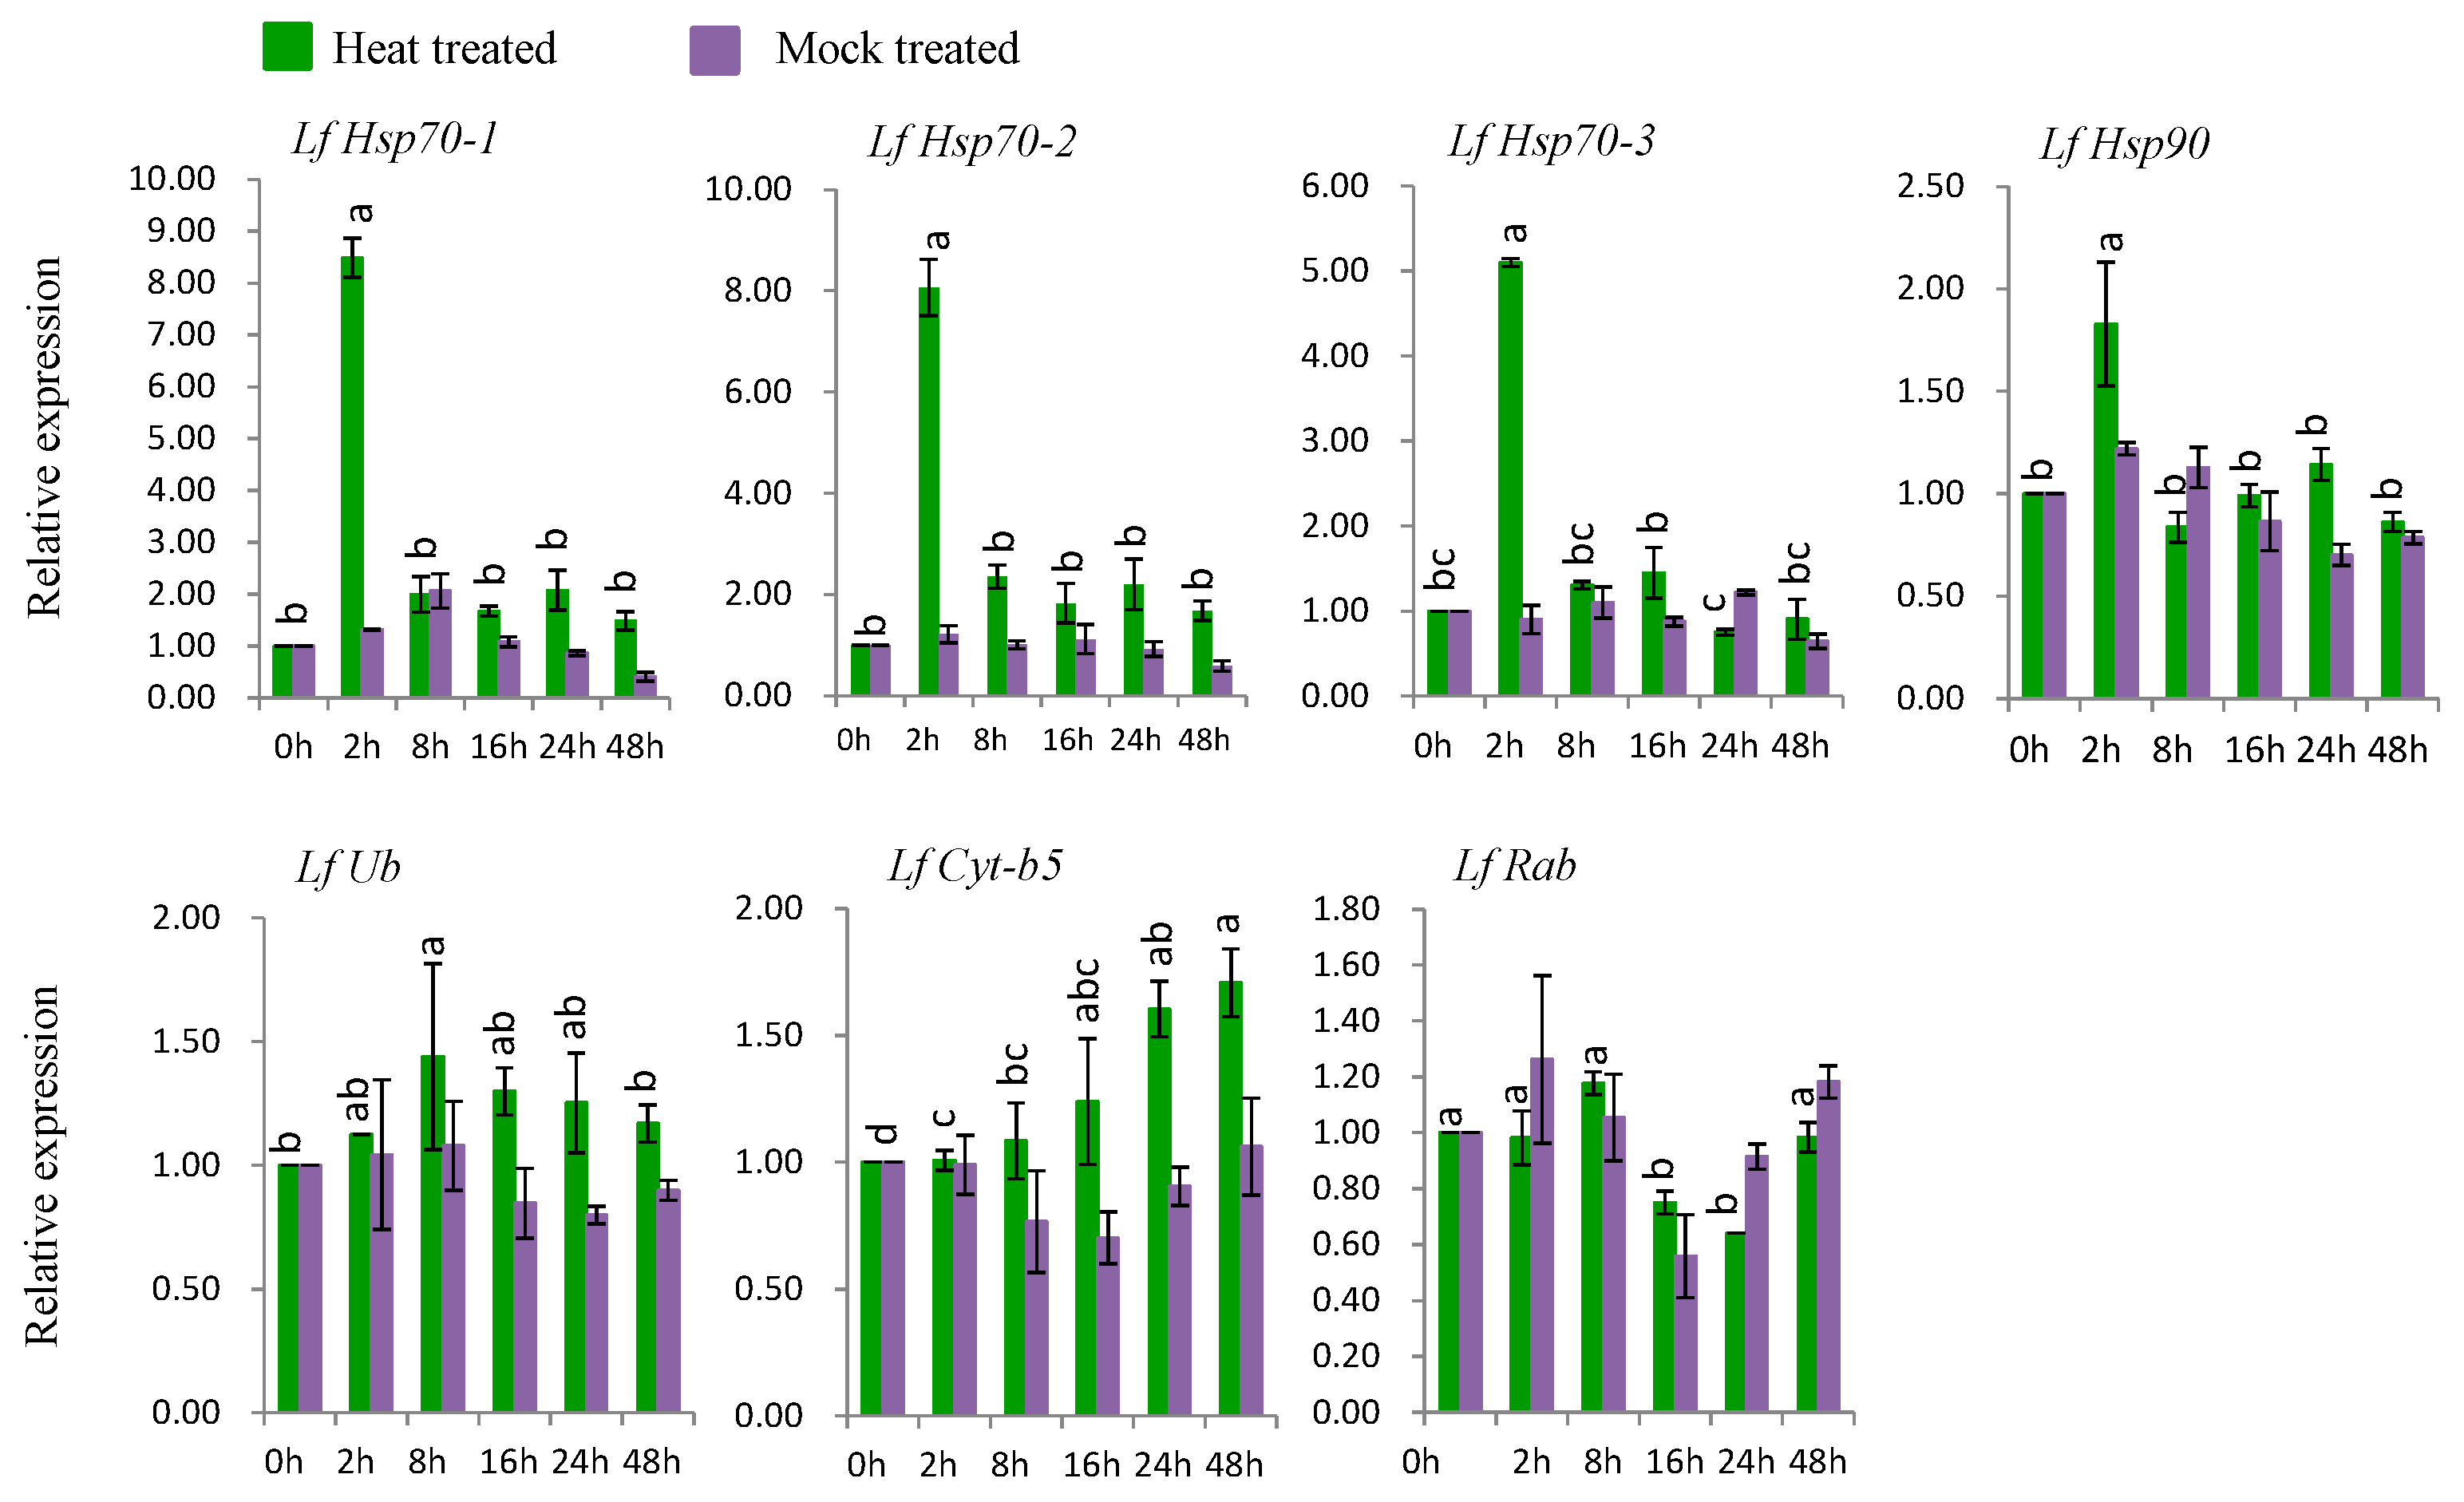
Figure 7.
Real-time quantitative PCR to investigate the relative expression of stress-induced genes in response to cold stress treatments in L. formolongi line Sinnapal lily. The error bars represent the standard error of the means of three independent replicates. Different letters (a, b, c, d) obtained from Tukey’s pairwise comparison test indicate statistically significant differences (p < 0.05) in relative expression of each stress-induced gene at different time-points after treatment.
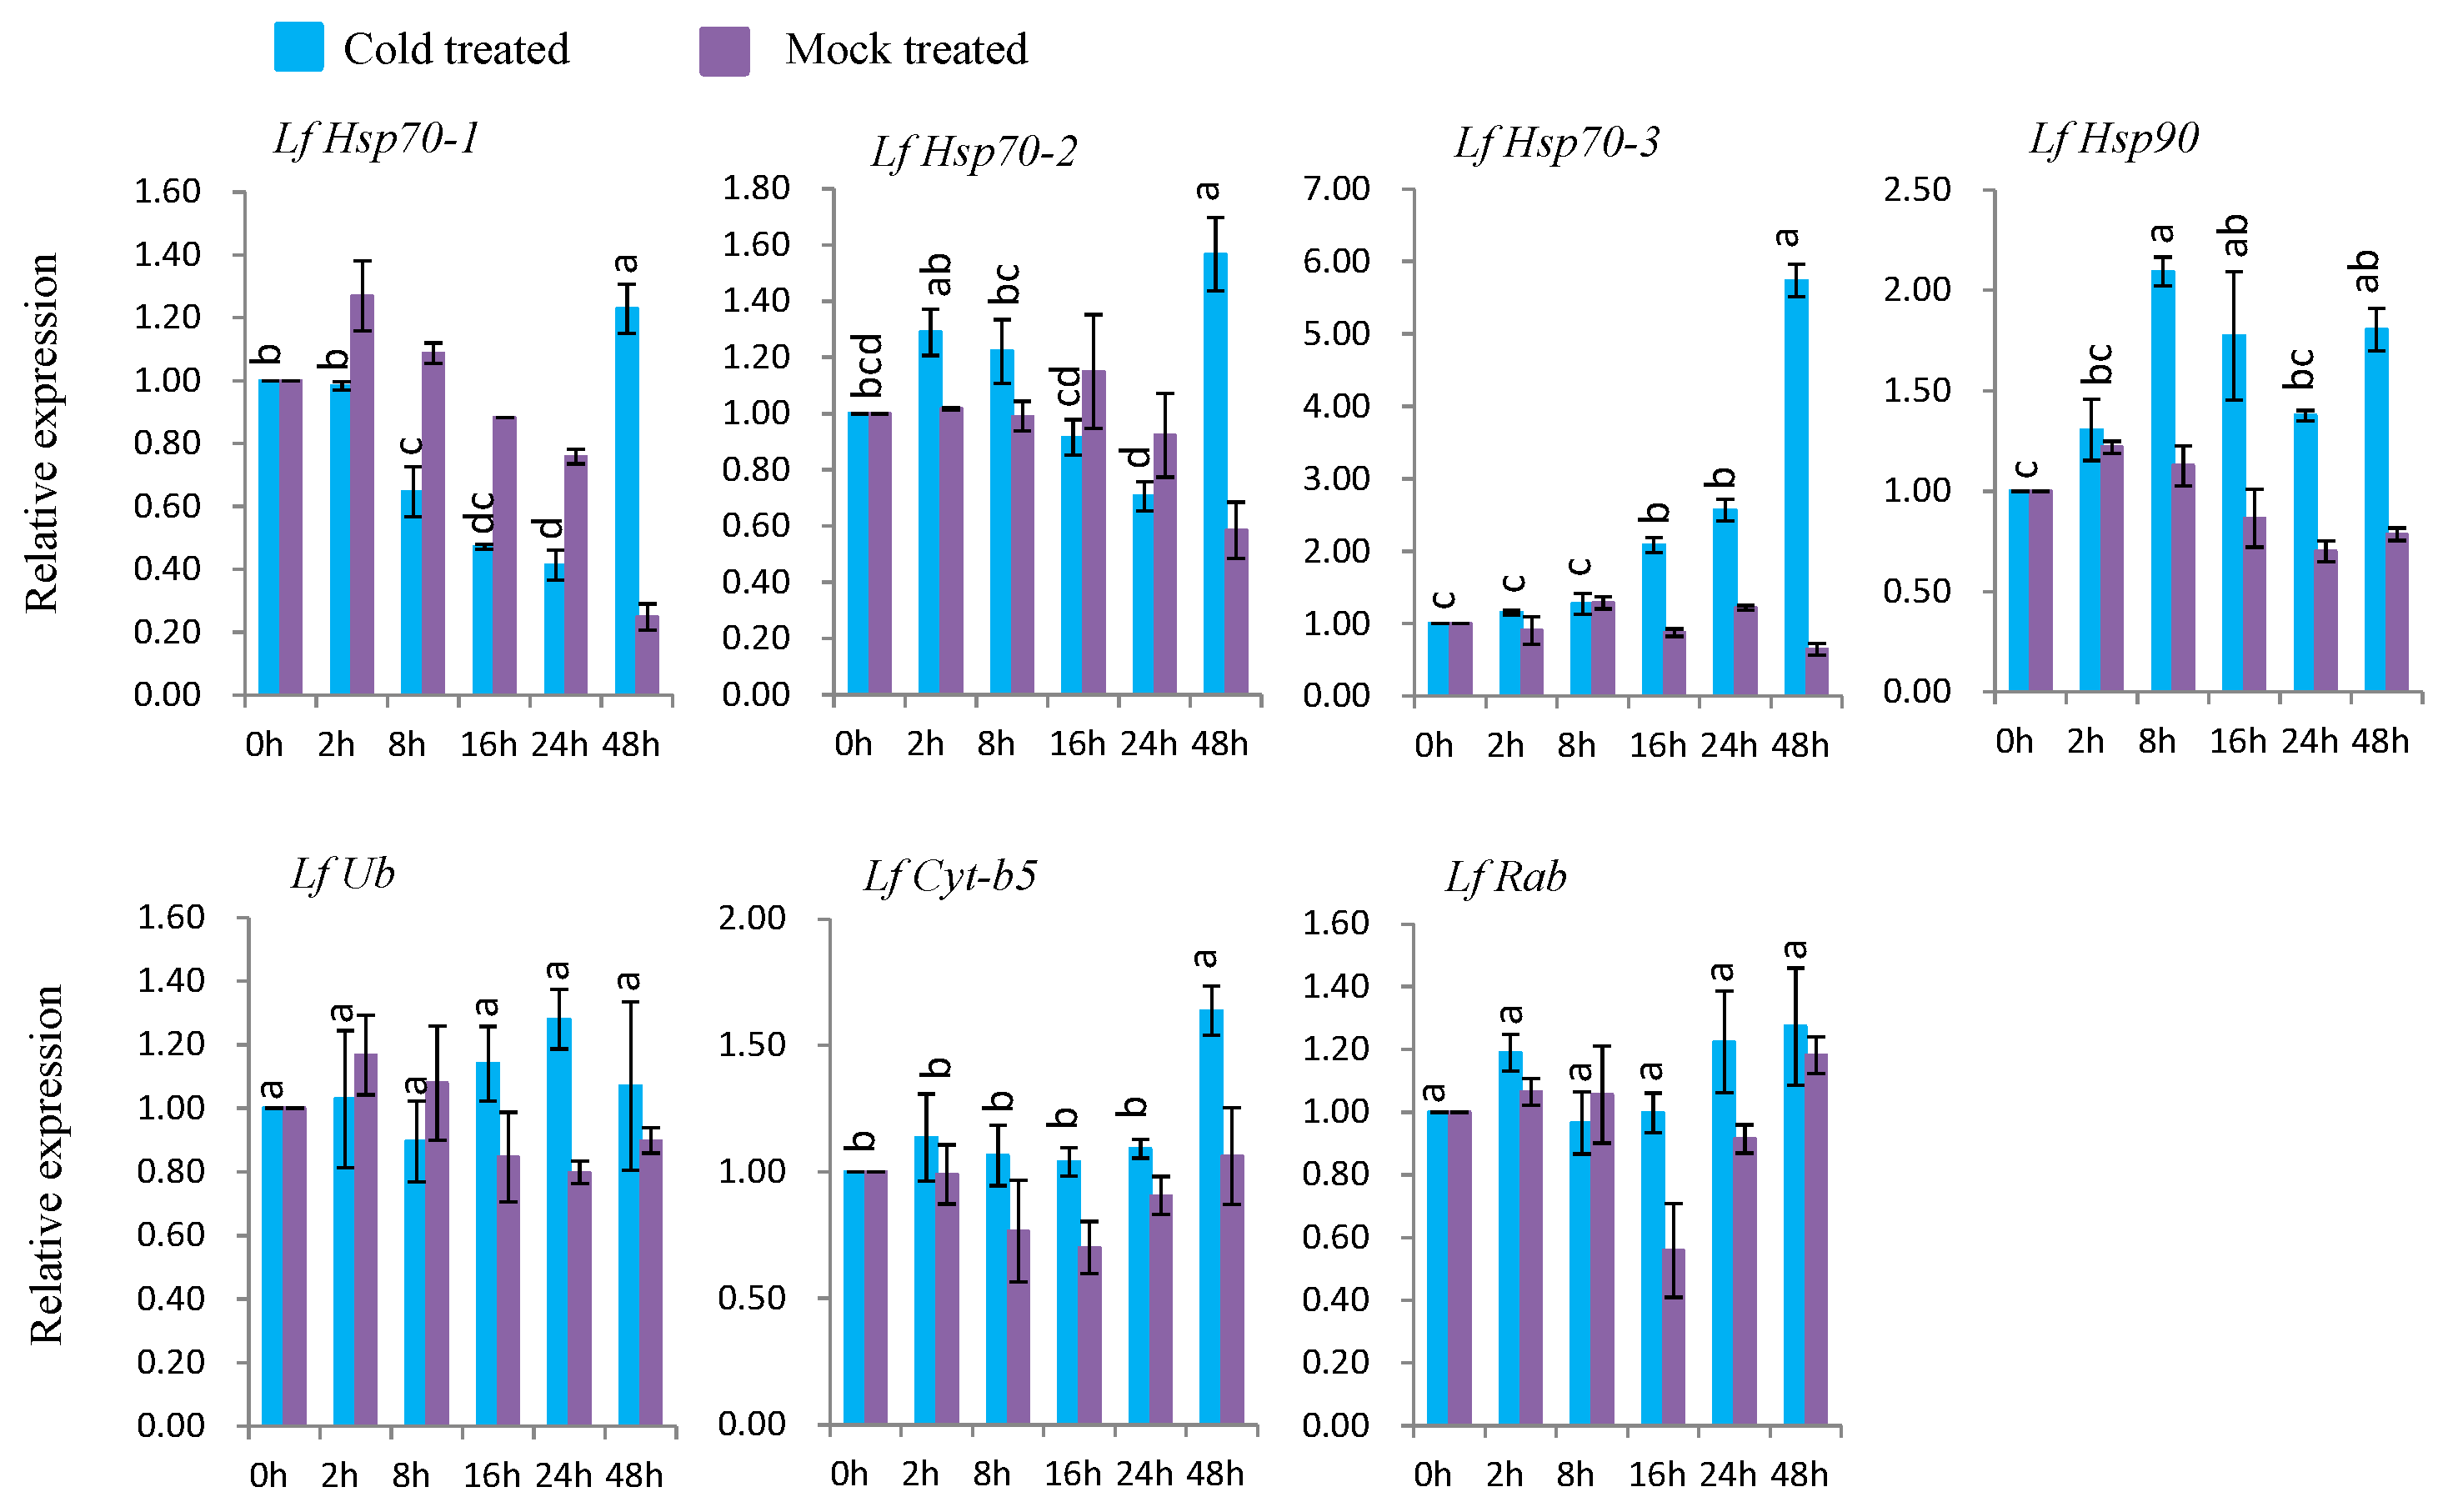
Figure 8.
Real-time quantitative PCR to investigate the relative expression of stress-induced genes in response to drought stress treatments in L. formolongi line Sinnapal lily. The error bars represent the standard error of the means of three independent replicates. Different letters (a, b, c, d, e) obtained from Tukey’s pairwise comparison test indicate statistically significant differences (p < 0.05) in relative expression of each stress-induced gene at different time-points after treatment.

Figure 9.
Real-time quantitative PCR to investigate the relative expression of stress-induced genes in response to salt stress treatments in L. formolongi line Sinnapal lily. The error bars represent the standard error of the means of three independent replicates. Different letters (a, b, c, d) obtained from Tukey’s pairwise comparison test indicate statistically significant differences (p < 0.05) in relative expression of each stress-induced gene at different time-points after treatment.

Figure 10.
Interaction network of the seven stress-related proteins identified in L. formolongi with related proteins in Arabidopsis (A–E). Action types and action effects of predicted functional partners are indicated by different-colored lines.
Figure 10.
Interaction network of the seven stress-related proteins identified in L. formolongi with related proteins in Arabidopsis (A–E). Action types and action effects of predicted functional partners are indicated by different-colored lines.
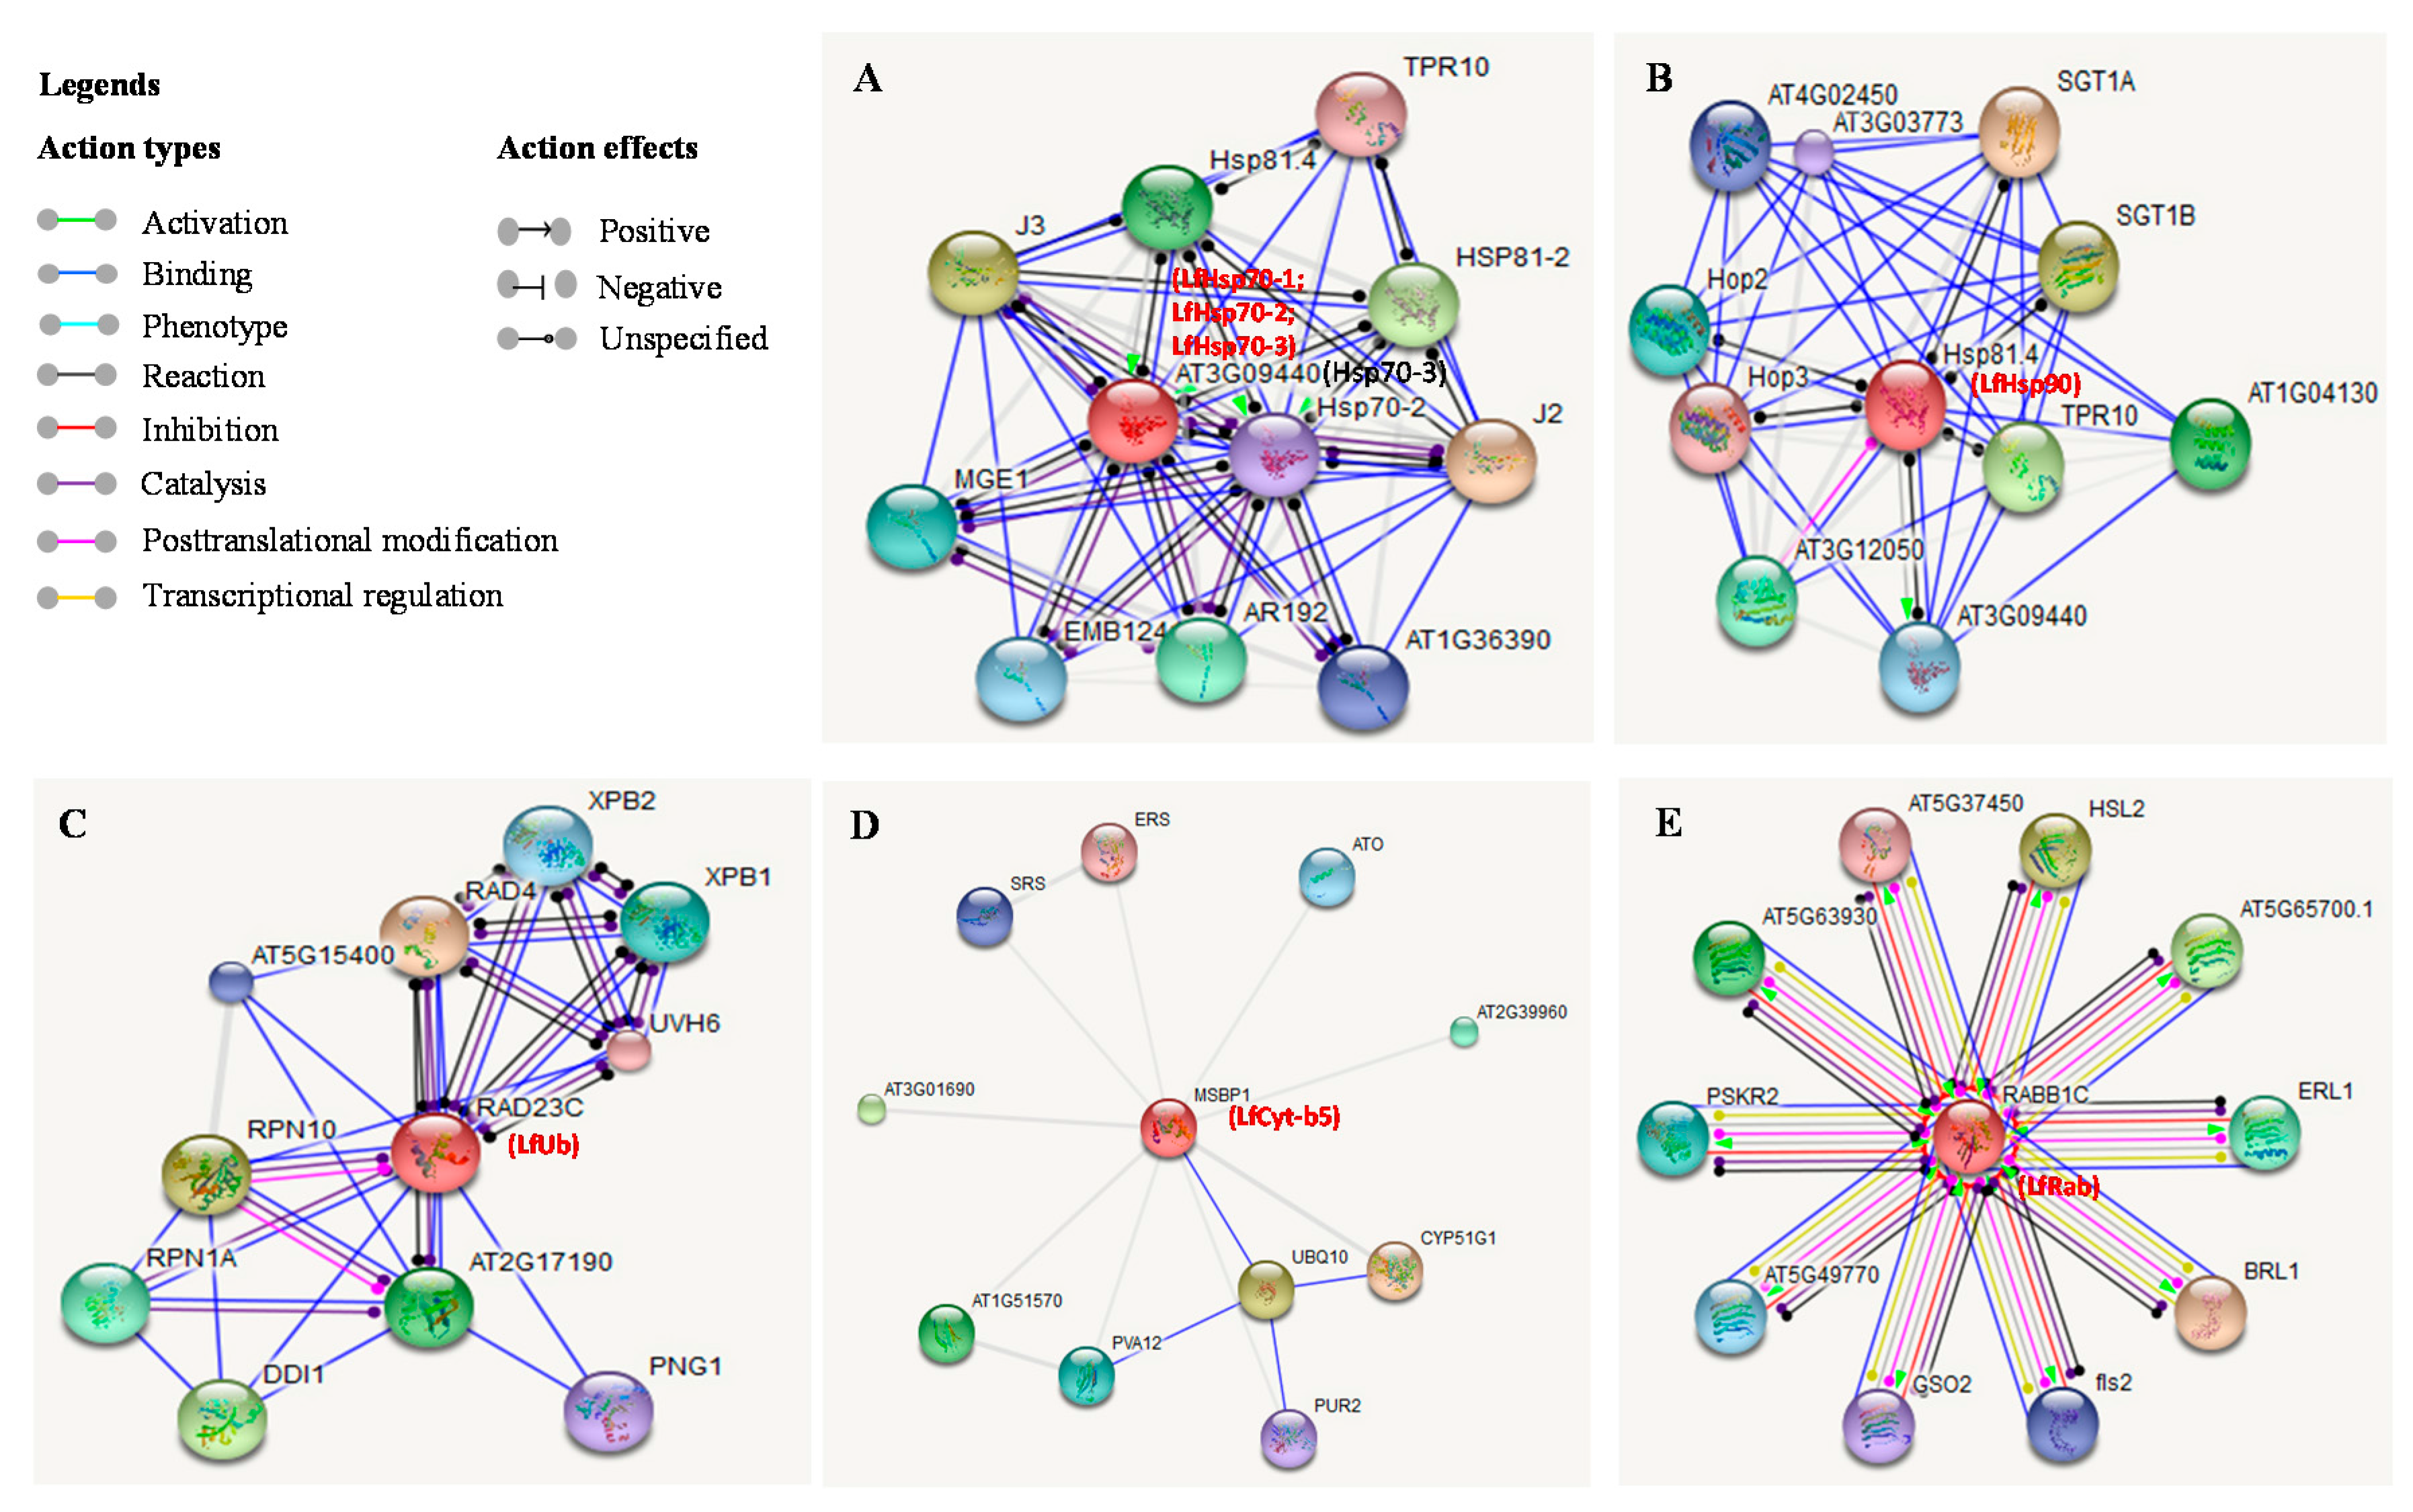

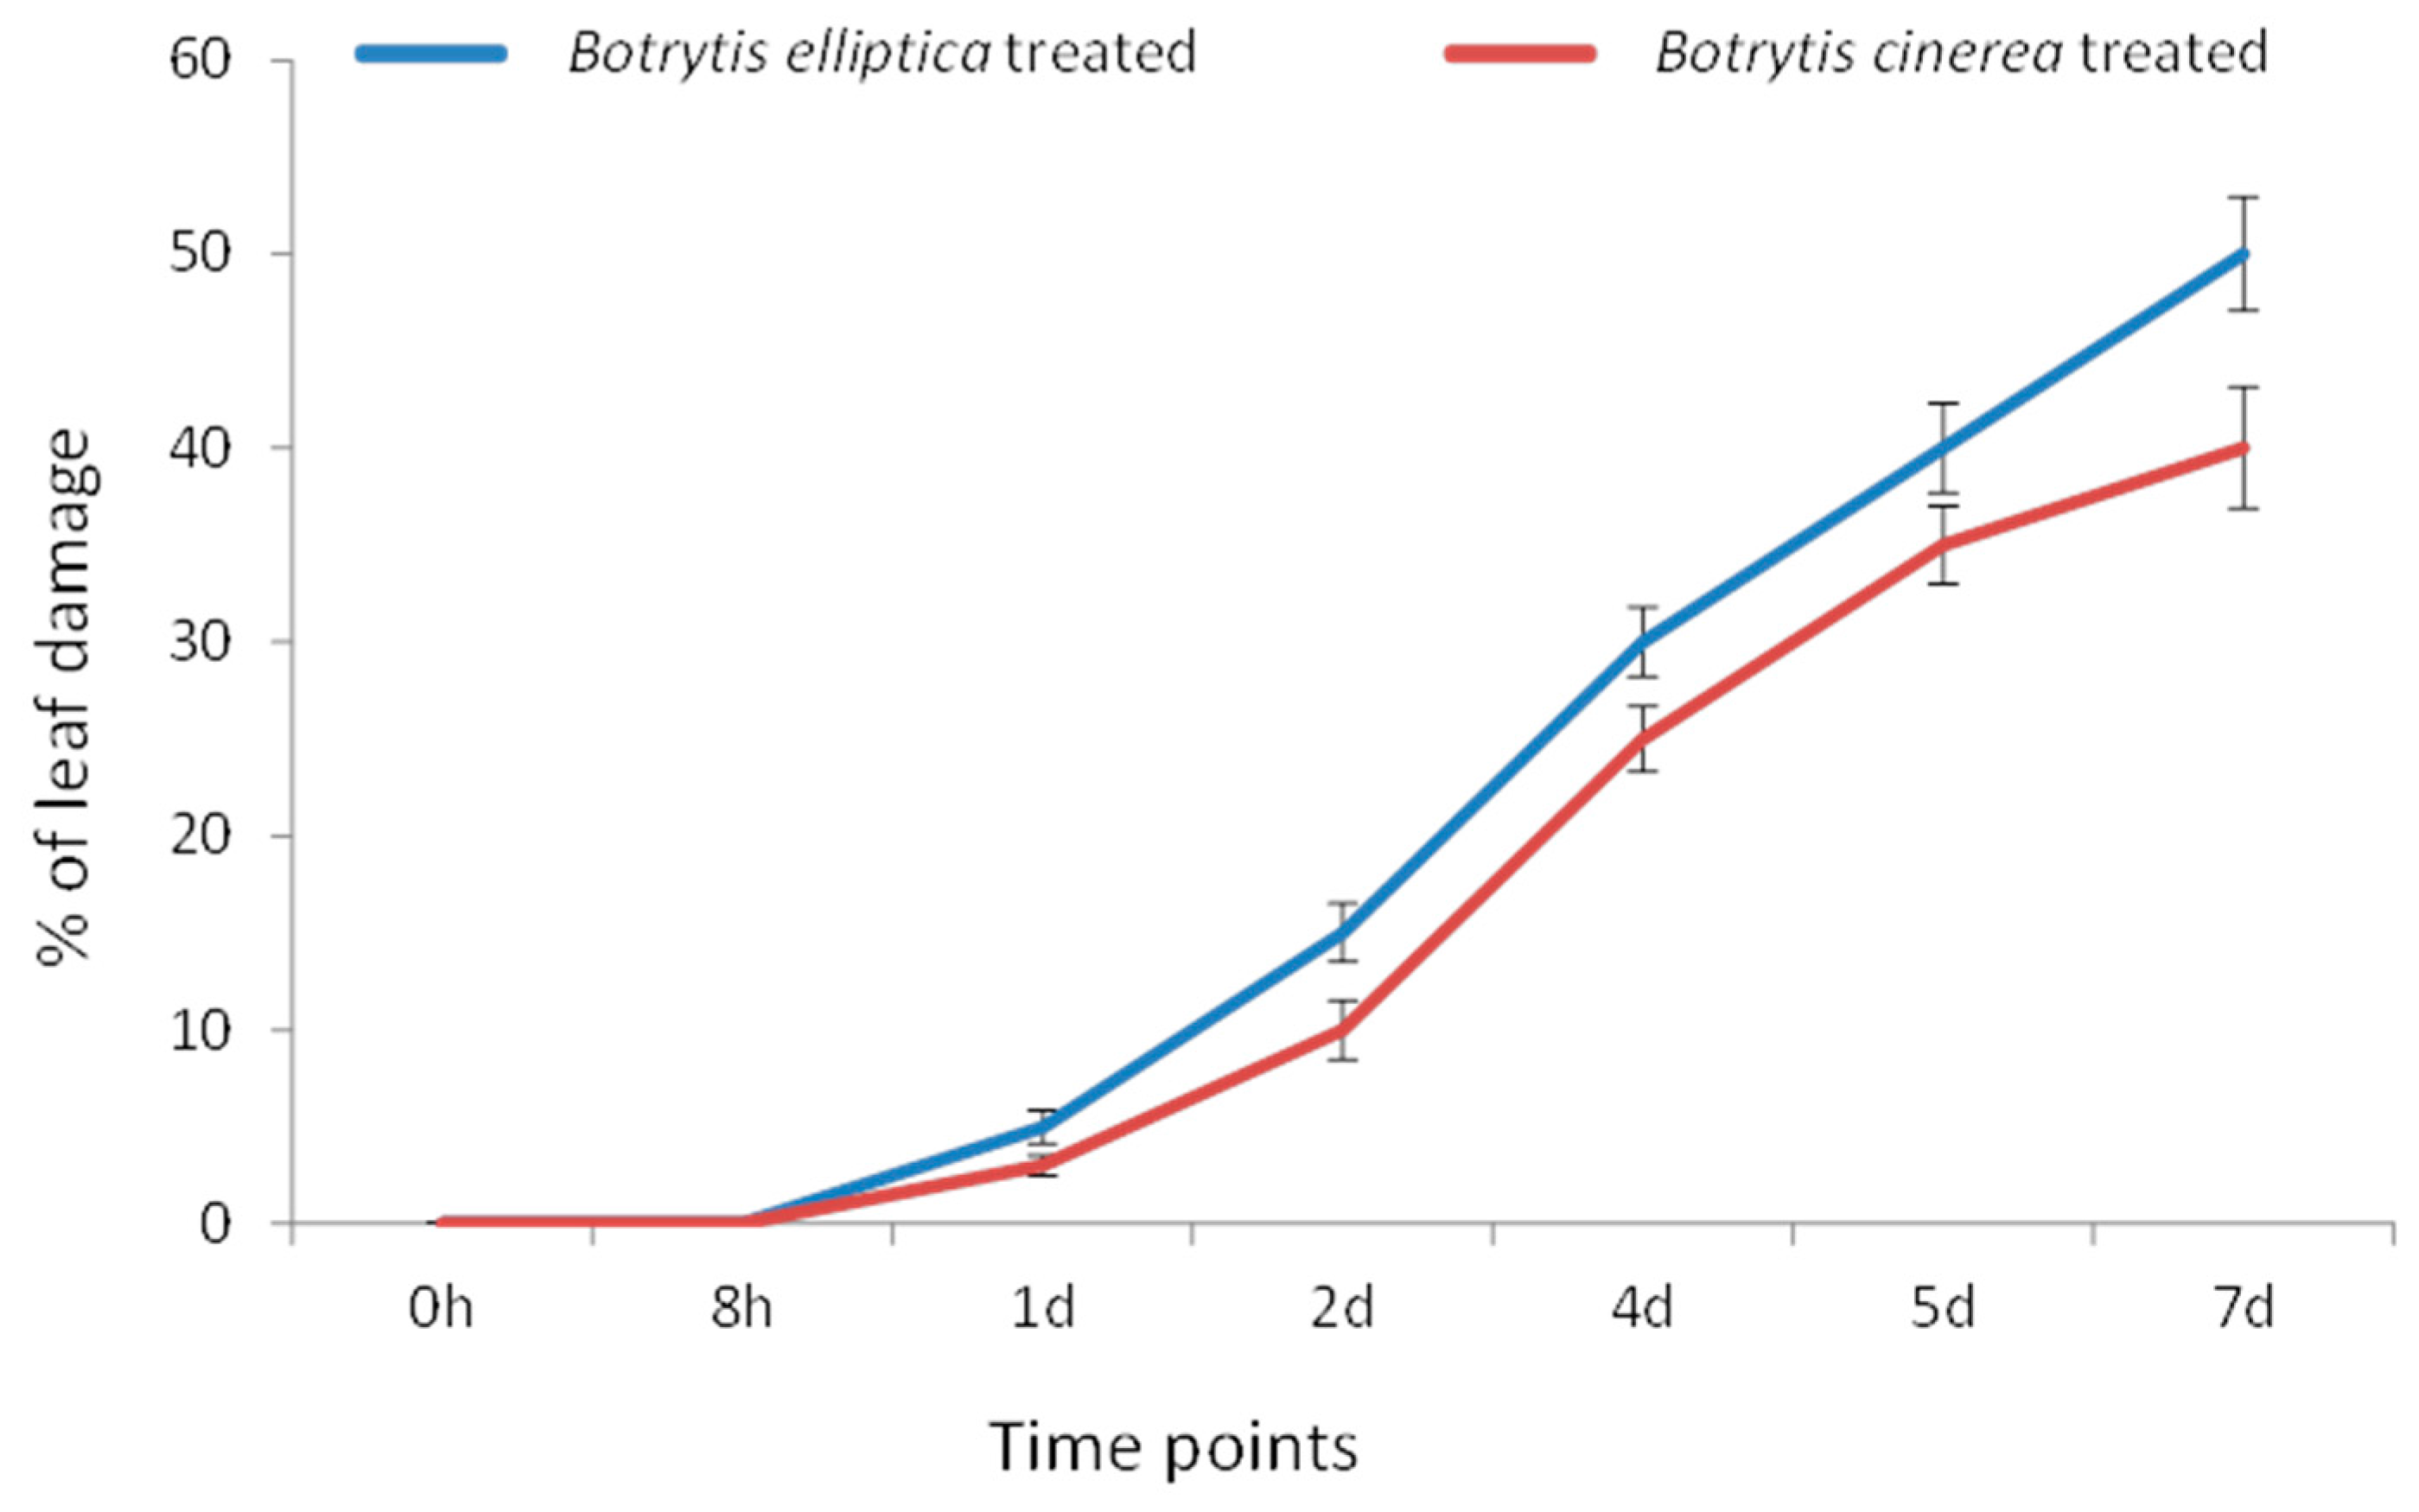
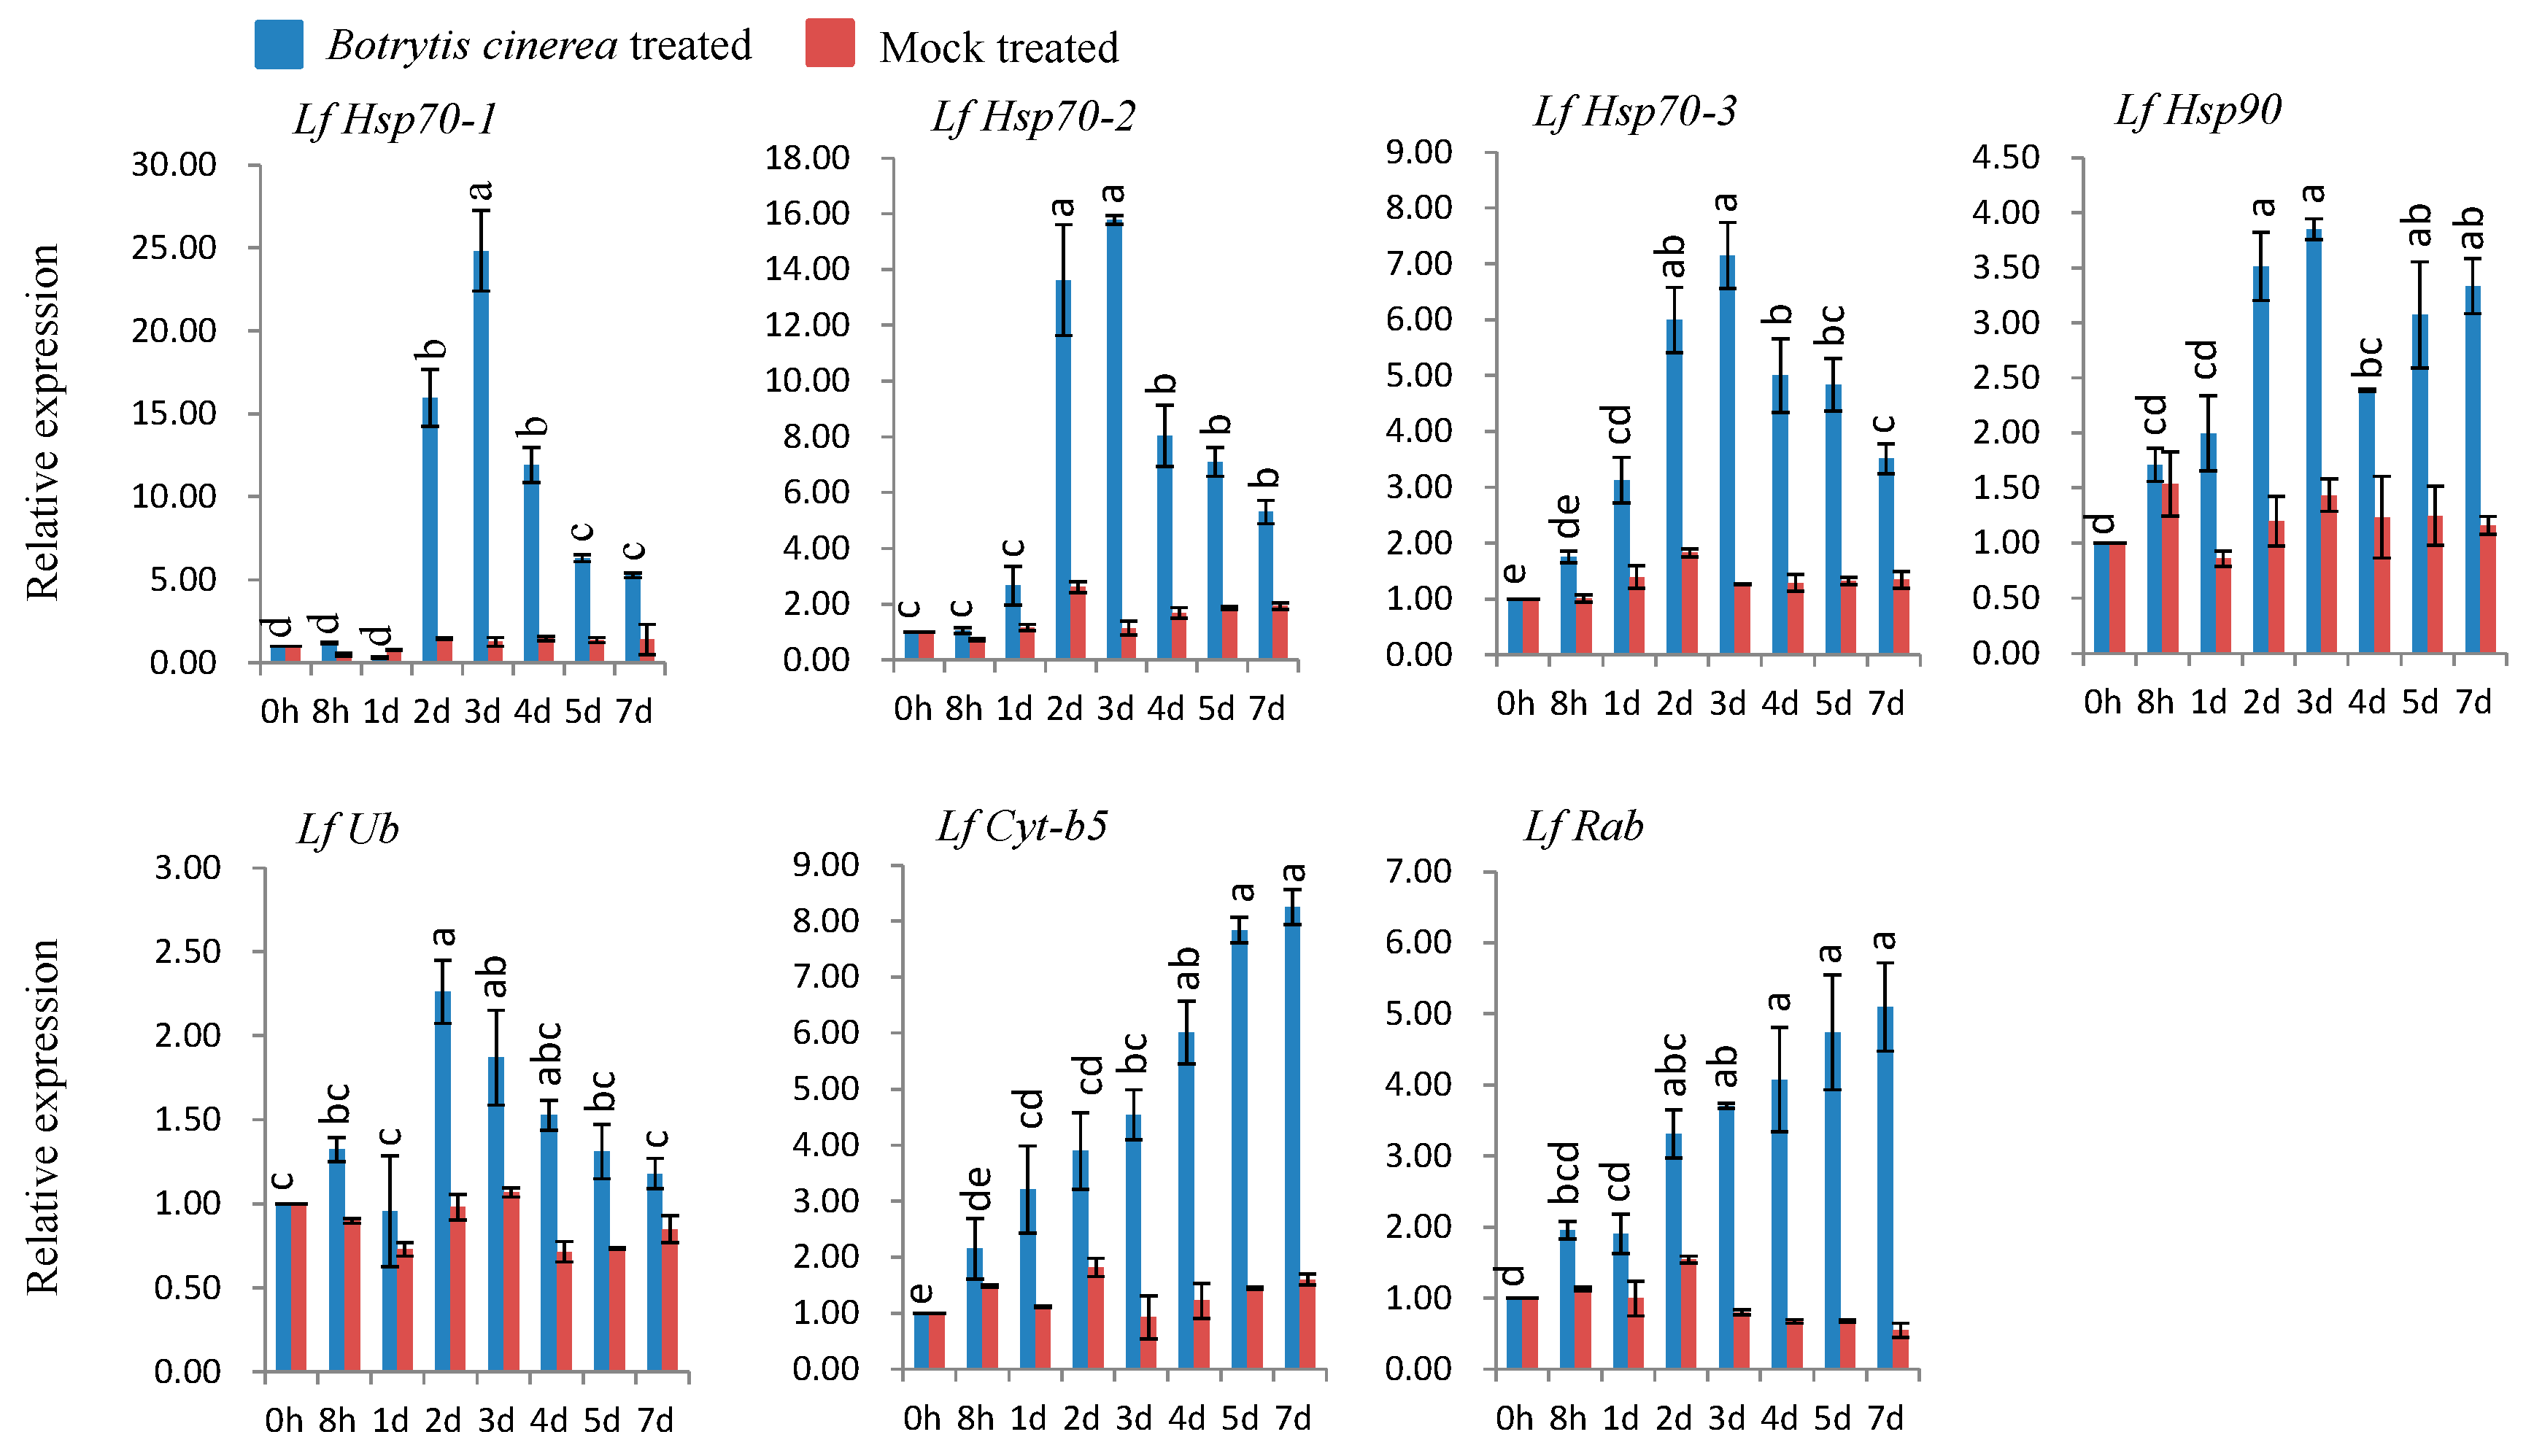
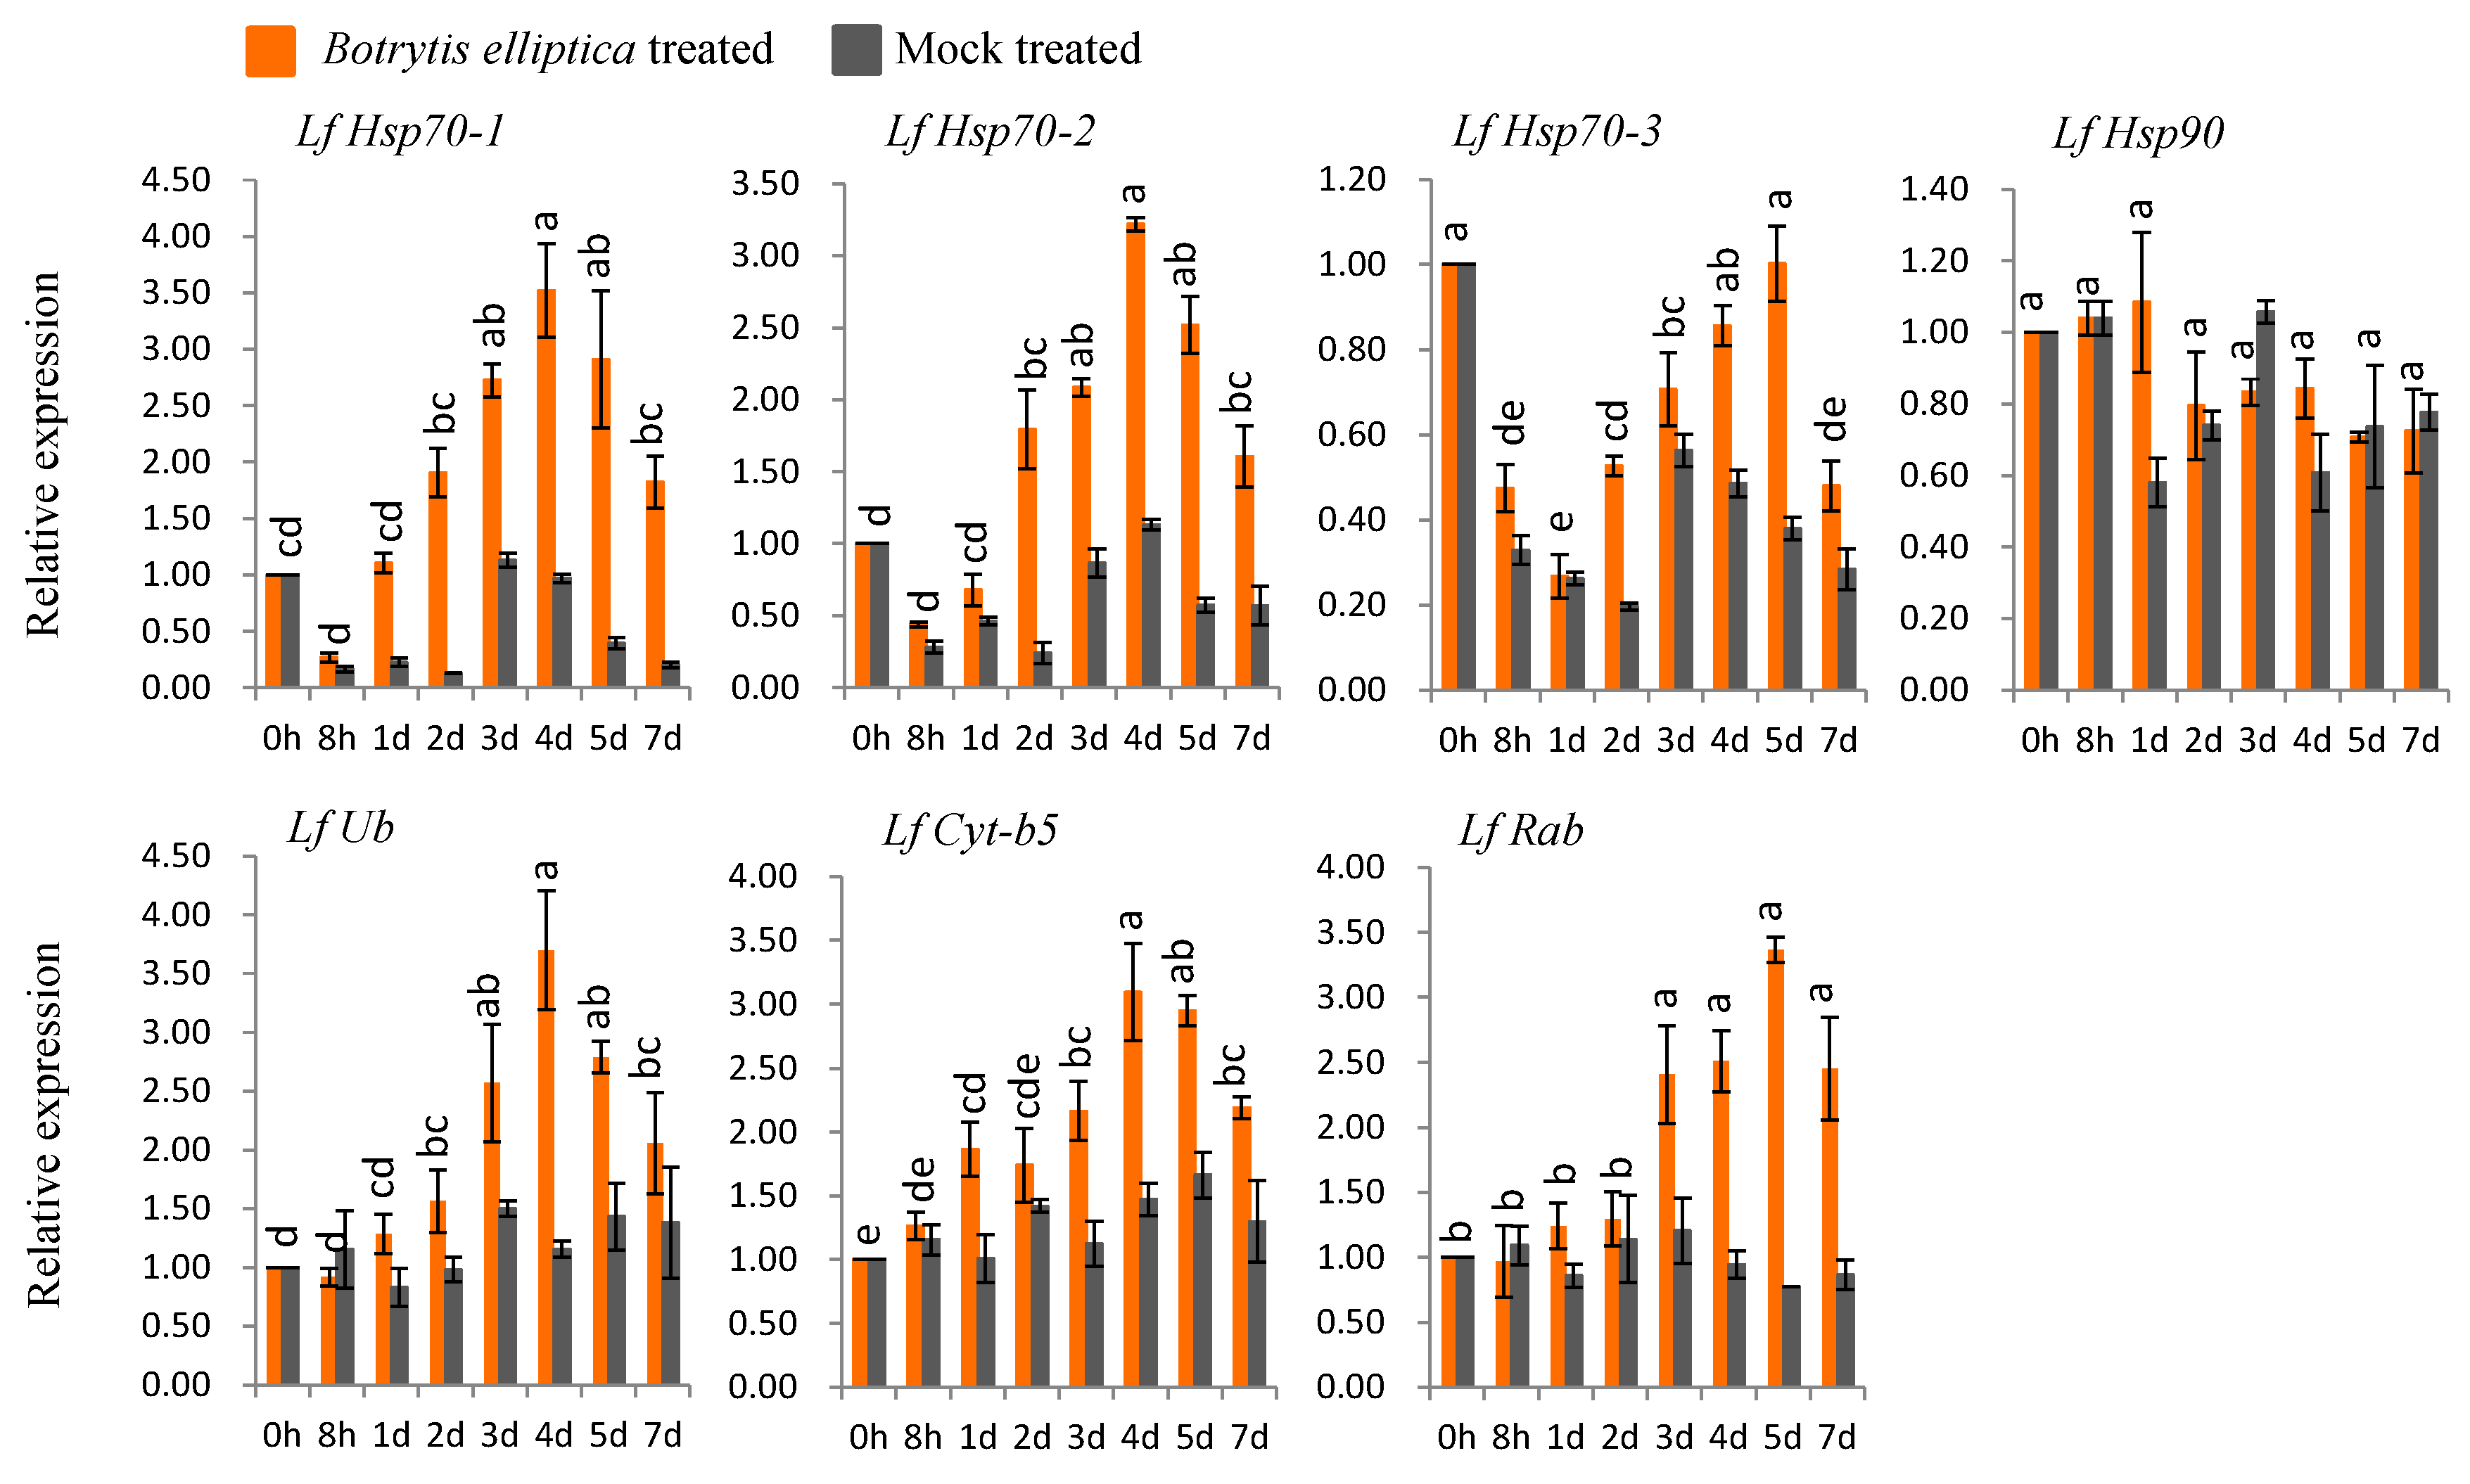
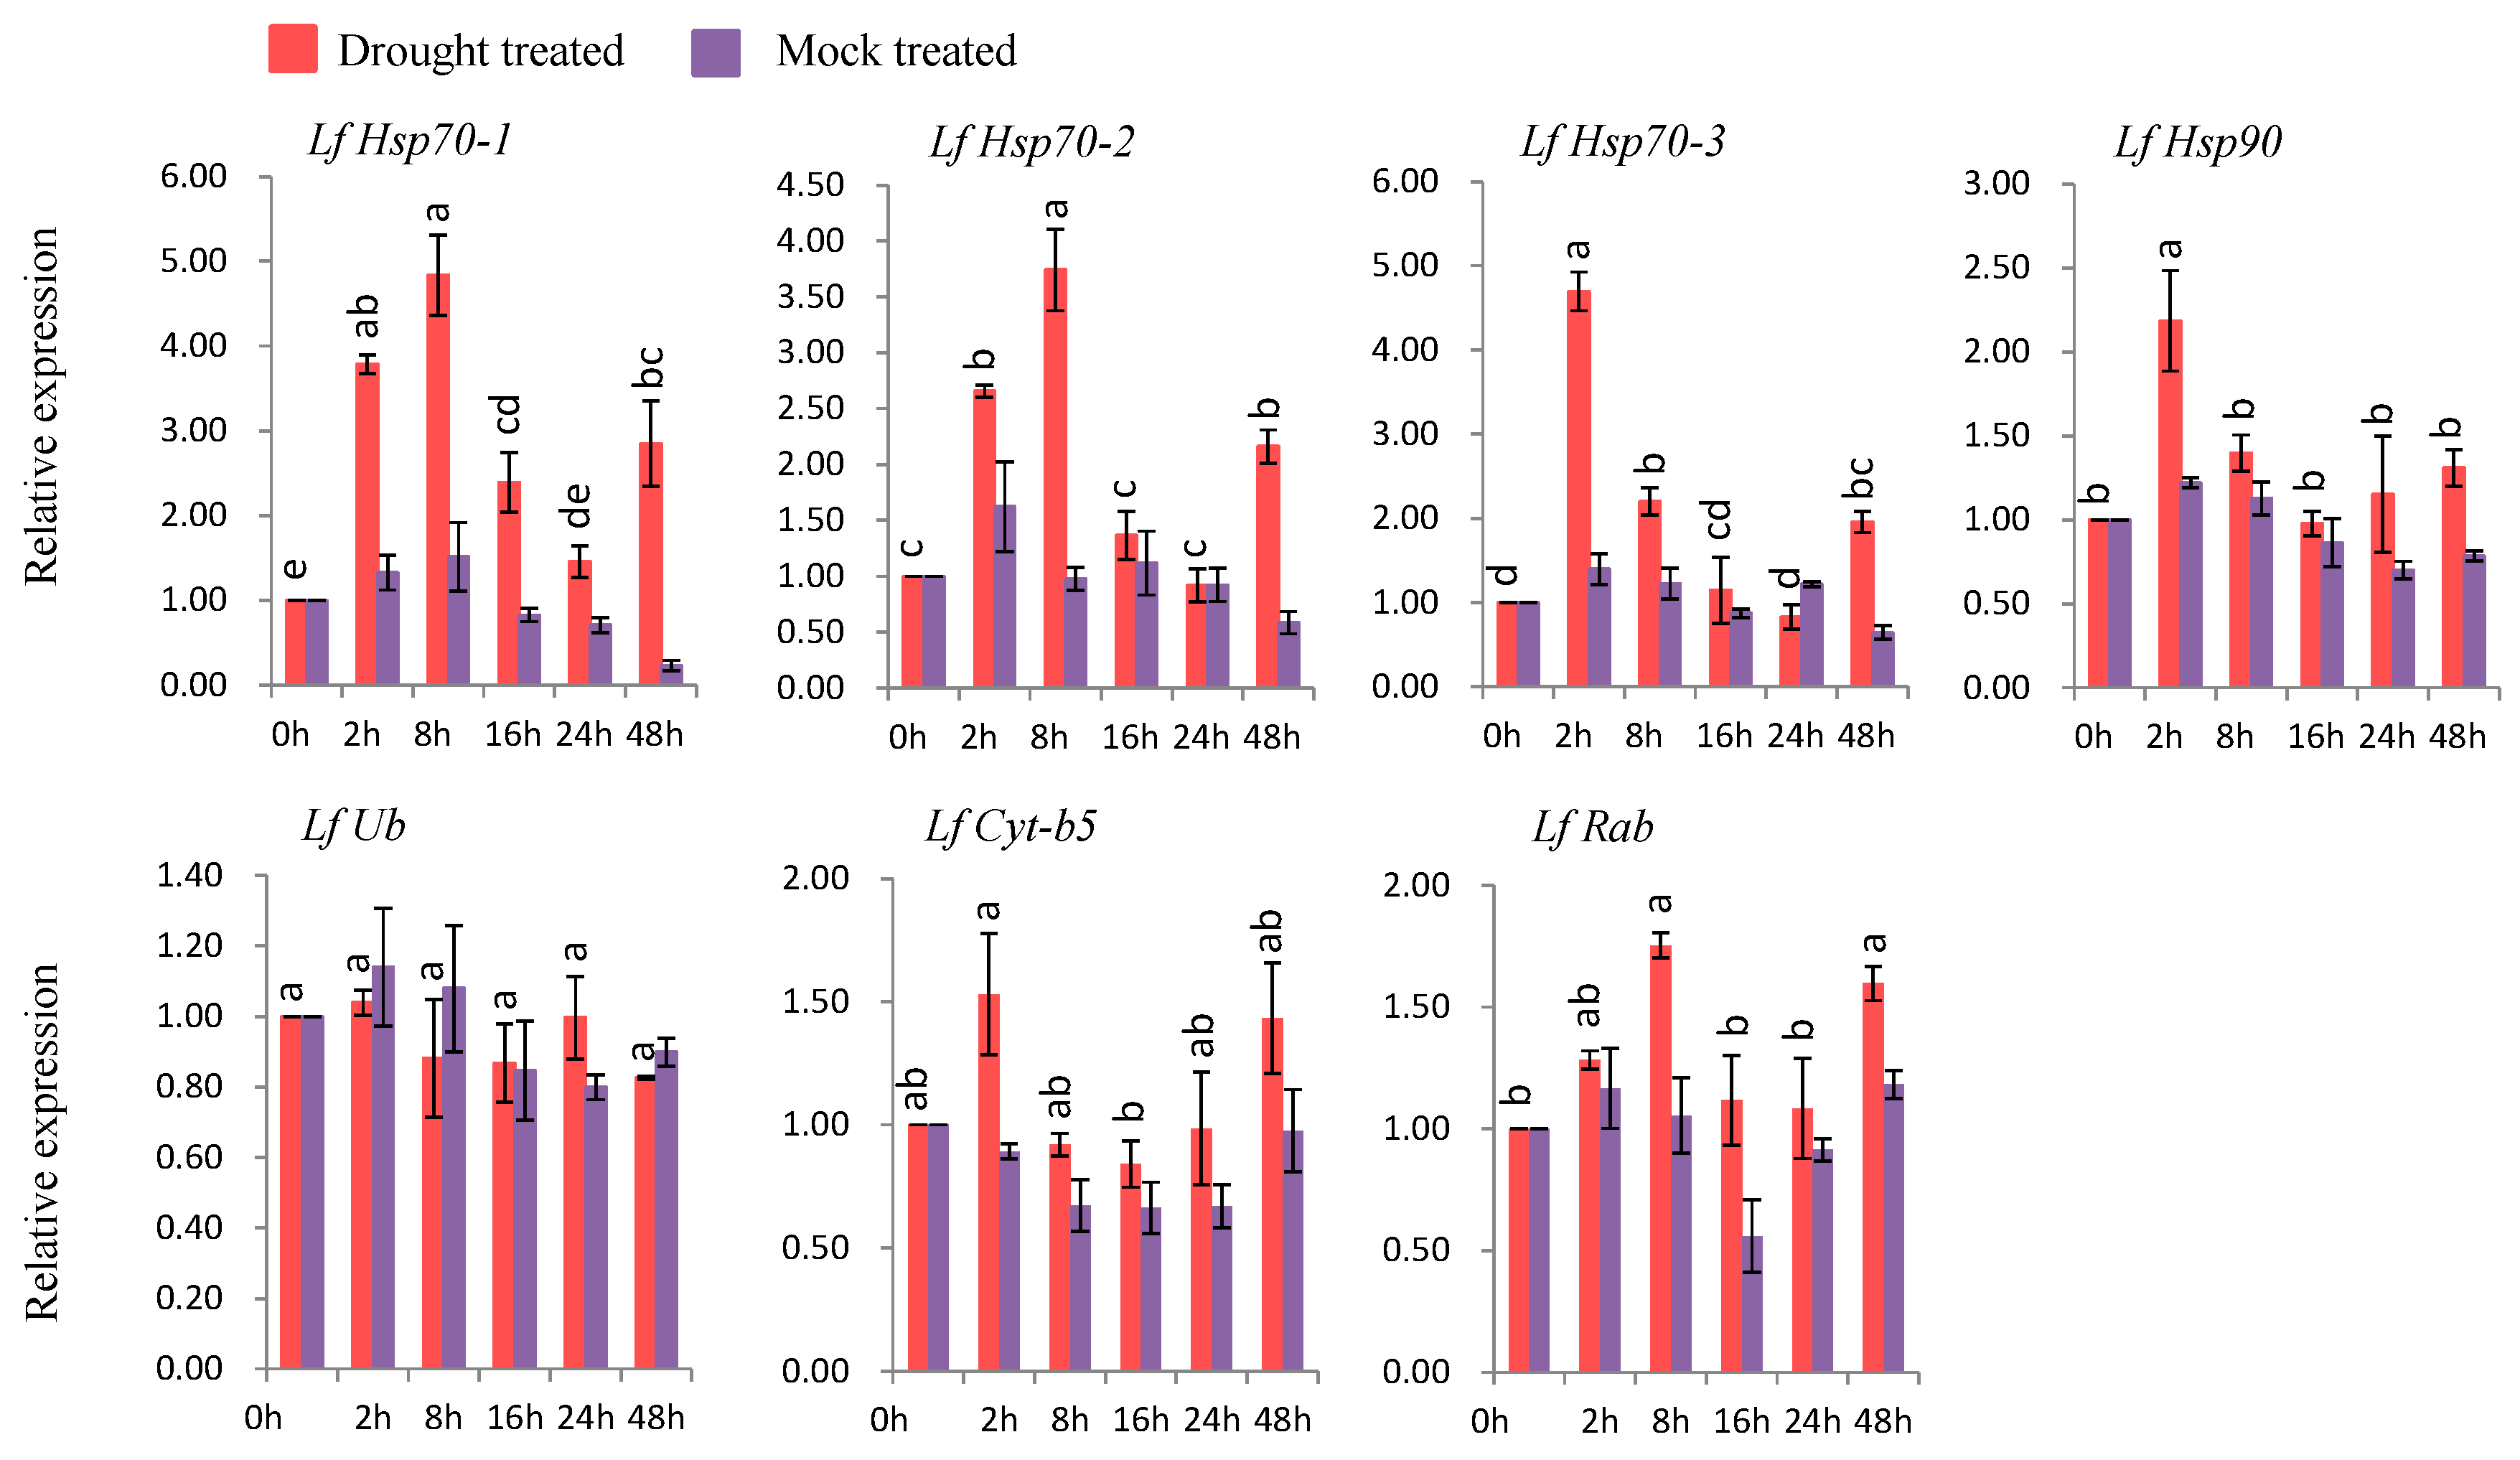
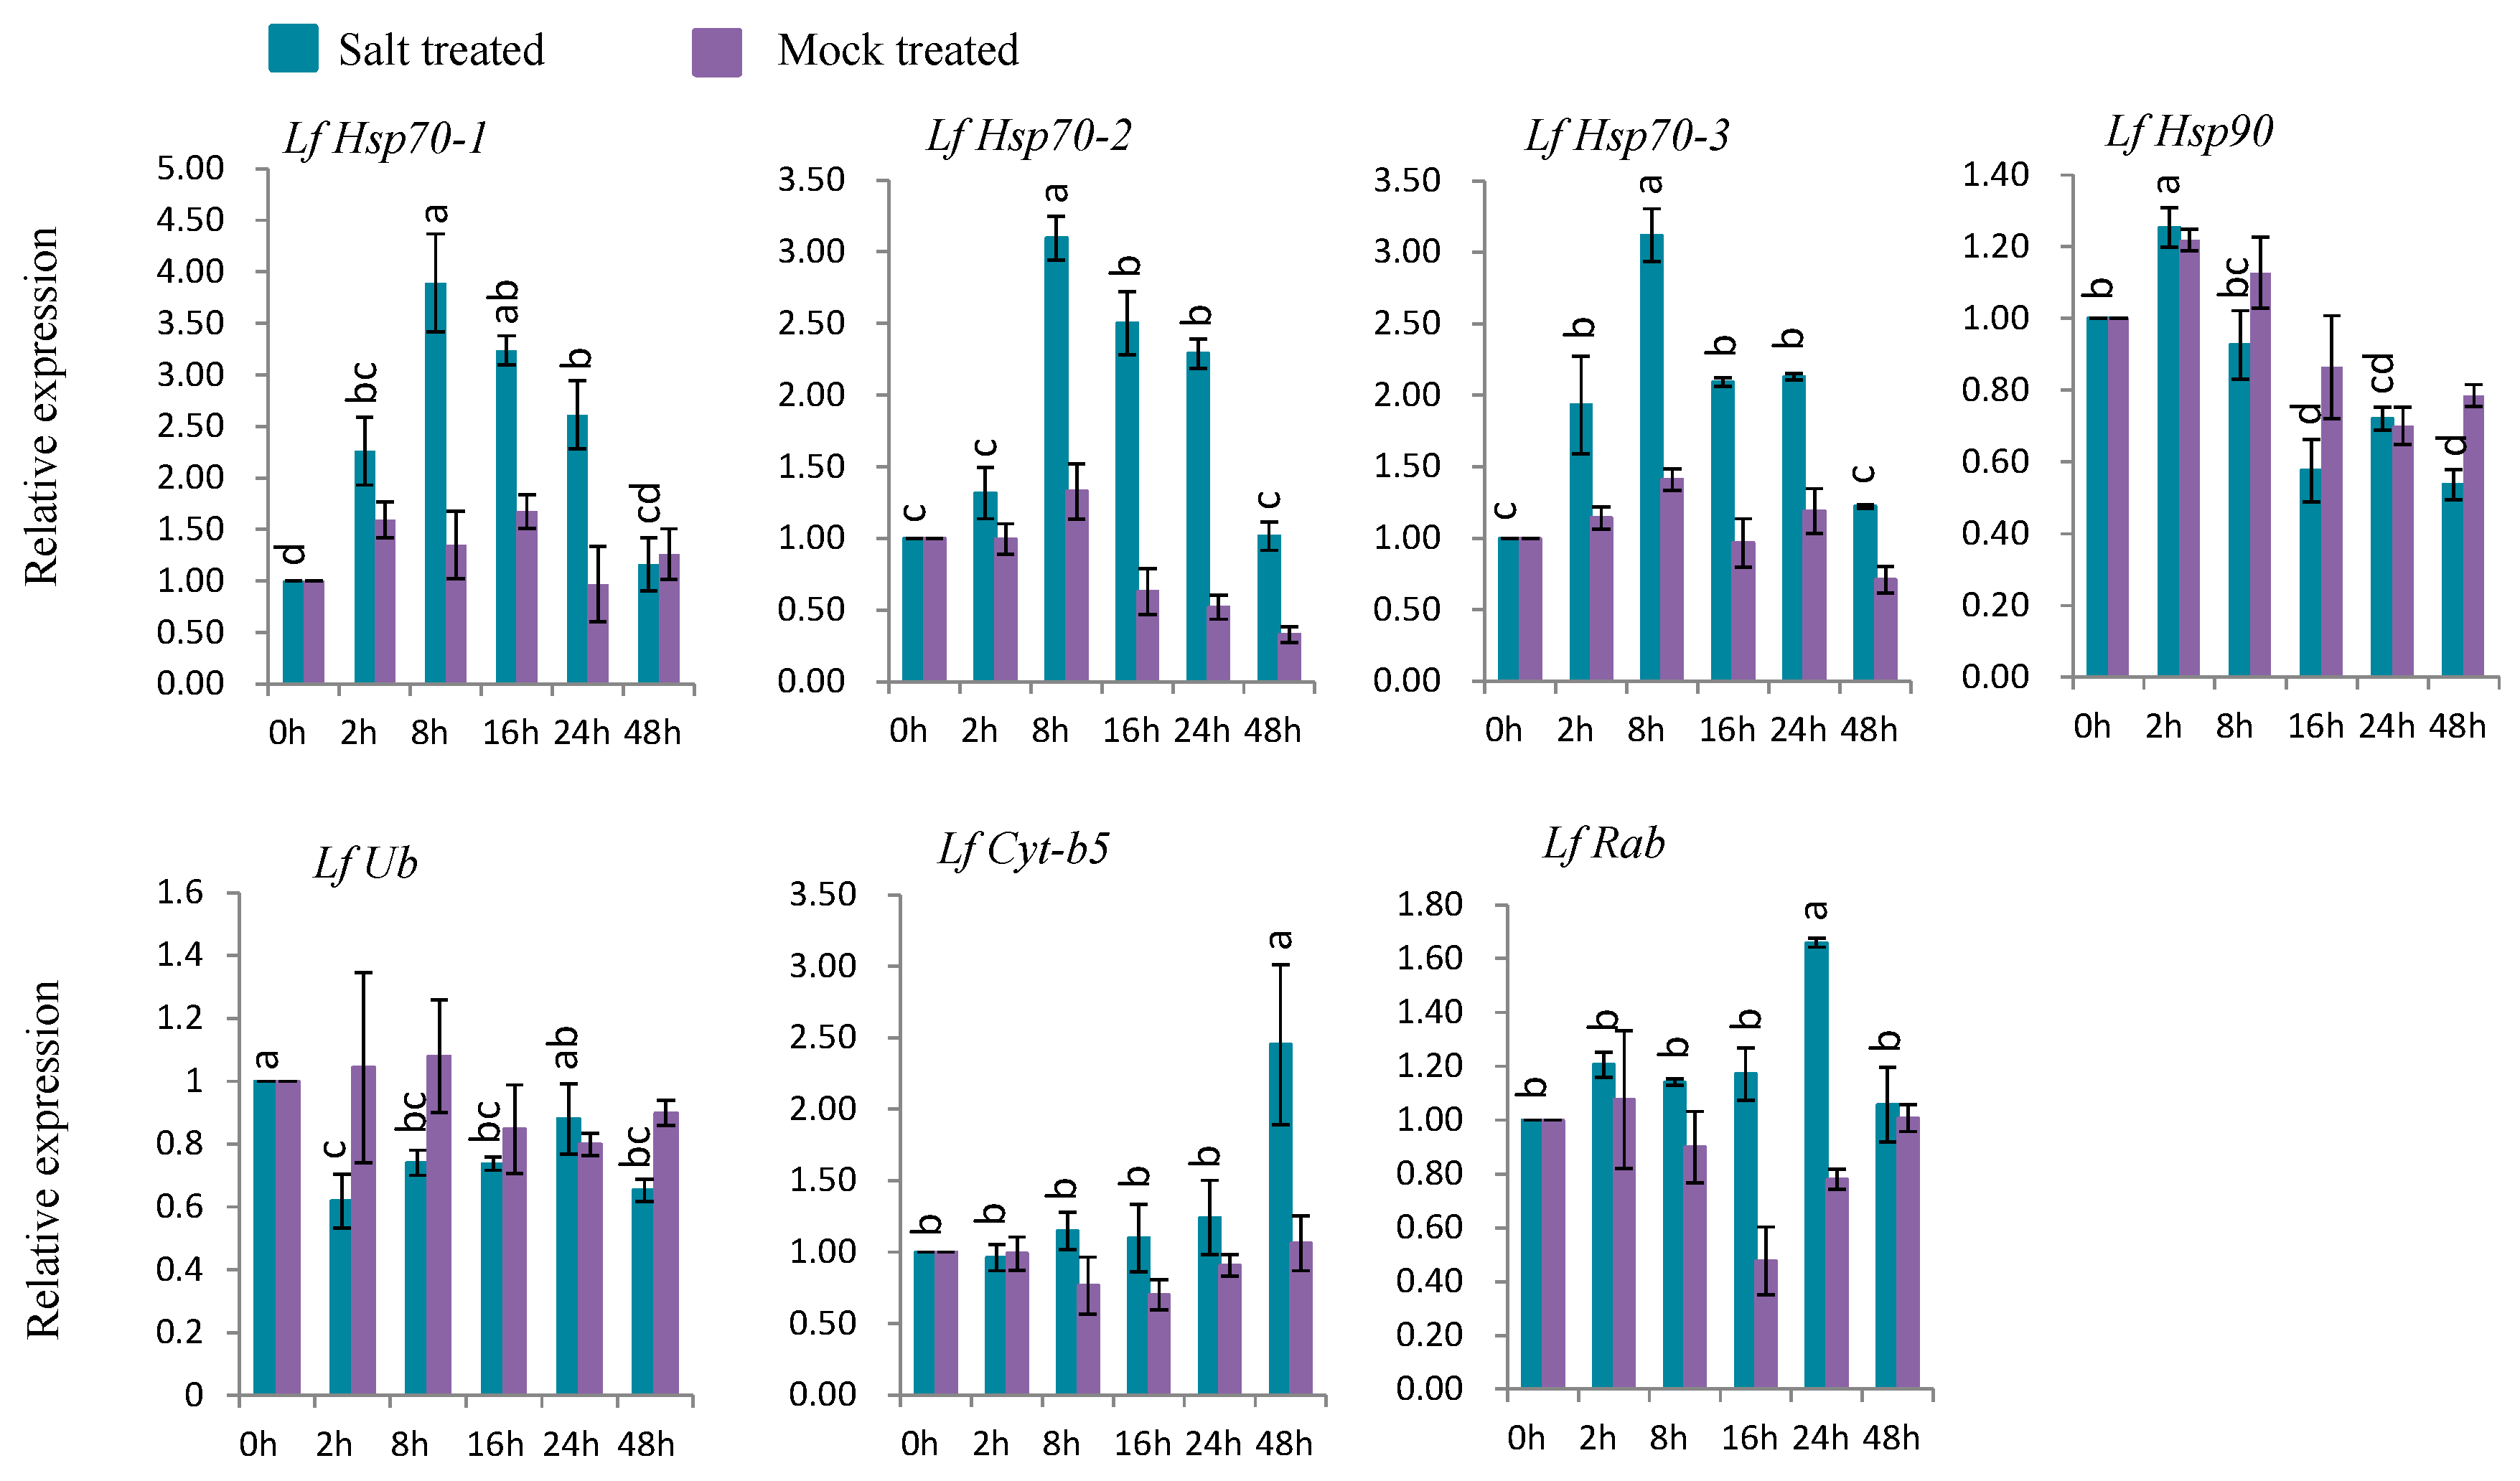
Table 1.
Subcellular localization and structural features of seven stress-related genes in Lilium formolongi.
Table 1.
Subcellular localization and structural features of seven stress-related genes in Lilium formolongi.
| EST Gene Name | Gene Name (mRNA) | GenBank Accession | Location | Domain Name | E-Value | Domain Position | CDS (bp) | Protein | Retrieved Sequence | |||
|---|---|---|---|---|---|---|---|---|---|---|---|---|
| Start | End | Length (aa) | MW (kDa) | PI | ||||||||
| Lf6 | LfHsp70-1 | KX683998 | Cytoplasm and Nucleus | HSP70 | 1.2 × 10−217 | 1 | 513 | 1623 | 540 | 59.51 | 5.04 | 1821 |
| Lf7 | LfHsp70-2 | KX683999 | Cytoplasm and Nucleus | HSP70 | 3.2 × 10−113 | 1 | 306 | 1002 | 333 | 36.58 | 4.78 | 1238 |
| Lf8 | LfHsp70-3 | KX684000 | Cytoplasm and Nucleus | HSP70 | 2.6 × 10−209 | 1 | 493 | 1563 | 520 | 57.27 | 5.17 | 1752 |
| Lf9 | LfHsp90 | KX684001 | Cytoplasm and Membrane | HATPase_c HSP90 | 2.81 × 10⁻⁸ 6.3 × 10−236 | 28 185 | 183 700 | 2103 | 700 | 80.23 | 4.90 | 2422 |
| Lf10 | LfUb | KX683995 | Cytoplasm and Nucleus | UBQ UBA STI1 UBA | 2.3 × 10⁻¹⁸ 8.0 × 10⁻⁵ 4.81 × 10⁻⁶ 1.38 × 10⁻⁸ | 1 155 253 336 | 75 195 296 373 | 1143 | 380 | 40.36 | 4.55 | 1505 |
| Lf11 | LfCyt-b5 | KX683996 | Plasma membrane | TM Cyt-b5 | - 2.68 × 10⁻²⁰ | 13 71 | 35 167 | 795 | 264 | 28.65 | 4.56 | 1144 |
| Lf12 | LfRab | KX683997 | Cytoplasm and Golgi and Endoplasmic Reticulum | RAB | 2.63 × 10−105 | 7 | 170 | 627 | 208 | 22.86 | 6.51 | 950 |
Abbreviations: EST, expressed sequence tag; CDS, coding DNA sequence; bp, base pair; aa, amino acid; kDa, kilo Dalton; PI, iso-electric point; MW, molecular weight; TM, transmembrane.
© 2017 by the authors. Licensee MDPI, Basel, Switzerland. This article is an open access article distributed under the terms and conditions of the Creative Commons Attribution (CC BY) license (http://creativecommons.org/licenses/by/4.0/).
Share and Cite
MDPI and ACS Style
Howlader, J.; Park, J.-I.; Robin, A.H.K.; Sumi, K.R.; Nou, I.-S. Identification, Characterization and Expression Profiling of Stress-Related Genes in Easter Lily (Lilium formolongi). Genes 2017, 8, 172. https://doi.org/10.3390/genes8070172
AMA Style
Howlader J, Park J-I, Robin AHK, Sumi KR, Nou I-S. Identification, Characterization and Expression Profiling of Stress-Related Genes in Easter Lily (Lilium formolongi). Genes. 2017; 8(7):172. https://doi.org/10.3390/genes8070172
Chicago/Turabian StyleHowlader, Jewel, Jong-In Park, Arif Hasan Khan Robin, Kanij Rukshana Sumi, and Ill-Sup Nou. 2017. "Identification, Characterization and Expression Profiling of Stress-Related Genes in Easter Lily (Lilium formolongi)" Genes 8, no. 7: 172. https://doi.org/10.3390/genes8070172
Note that from the first issue of 2016, this journal uses article numbers instead of page numbers. See further details here.