Article

Exploring Genomic Variants Related to Residual Feed Intake in Local and Commercial Chickens by Whole Genomic Resequencing

1
Institute of Animal Sciences, Chinese Academy of Agricultural Sciences, Beijing 100193, China
2
State Key Laboratory of Animal Nutrition, Beijing 100193, China
3
College of Animal Science, Jilin University, Changchun 130062, China
*
Authors to whom correspondence should be addressed.
These authors contributed equally to this work.
Genes 2018, 9(2), 57; https://doi.org/10.3390/genes9020057
Submission received: 17 October 2017 / Revised: 20 December 2017 / Accepted: 2 January 2018 / Published: 24 January 2018
(This article belongs to the Section Animal Genetics and Genomics)

Abstract

:
Improving feed efficiency is a major goal in poultry production to reduce production costs and increase profitability. The genomic variants and possible molecular mechanisms responsible for residual feed intake (RFI) in chickens, however, remain poorly understood. In this study, using both local and commercial breeds, genome re-sequencing of low RFI and high RFI chickens was performed to elucidate the genomic variants underlying RFI. Results showed that 8,505,214 and 8,479,041 single nucleotide polymorphisms (SNPs) were detected in low and high RFI Beijing-You chickens, respectively; 8,352,008 and 8,372,769 SNPs were detected in low- and high-RFI Cobb chickens, respectively. Through a series of filtering processes, 3746 candidate SNPs assigned to 1137 genes in Beijing-You chickens and 575 candidate SNPs (448 genes) in Cobb chickens were found. The validation of the selected 191 SNPs showed that 46 SNPs were significantly associated with the RFI in an independent population of 779 Cobb chickens, suggesting that the method of screening associated SNPs with whole genome sequencing (WGS) strategy was reasonable. Functions annotation of RFI-related genes indicated that genes in Beijing-You were enriched in lipid and carbohydrate metabolism, as well as the phosphatase and tensin homolog (PTEN) signaling pathway. In Cobb, however, RFI-related genes were enriched in the feed behavior process and cAMP responsive element binding protein (CREB) signaling pathway. For both breeds, organismal development physiological processes were enriched. Correspondingly, NOS1, PHKG1, NEU3 and PIP5K1B were differentially expressed in Beijing-You, while CDC42, CSK, PIK3R3, CAMK4 and PLCB4 were differentially expressed in Cobb, suggesting that these might be key genes that contribute to RFI. The results of the present study identified numerous novel SNPs for RFI, which provide candidate biomarkers for use in the genetic selection for RFI. The study has improved knowledge of the genomic variants and potential biological pathways underlying RFI in chickens.

1. Introduction

As with most animal production systems, the cost of feed in chicken meat production is a high proportion of the total farming expense, being nearly 70% of the total cost of poultry production [1]. The selection of more efficient animals reduces production costs, decreases the area of land required for feed production and reduces environmental impact of nitrogen and phosphorus excretion resulting from the digestion/metabolic processes.
Residual feed intake (RFI), defined as the difference between the actual feed intake (FI) and predicted requirements based on growth and maintenance, was first proposed as an alternate measure of feed efficiency (FE) by Koch et al. [2]. RFI is a sensitive and accurate indicator that is increasingly accepted as an alternative measure of FE of livestock. RFI has a moderate heritability (0.21 to 0.49) in broilers and responds to selection [3]. Elucidation of the genomic variants for RFI could potentially be important for marker- or gene-assisted selection [4].
Current whole genomic sequencing methodologies are important tools to unravel the mechanisms of complex traits, facilitate new understanding of the genetic regulation of phenotype and allow the identification of potential biomarkers for early or more accurate genetic prediction [5]. In recent years, some progress has been gained in attempts to identify the molecular mechanisms underlying RFI. Transcriptome analysis of mRNA and microRNA in skeletal muscle in pigs showed that genes involved in mitochondrial energy metabolism were downregulated, while those involved in skeletal muscle differentiation and proliferation were upregulated in low RFI (LRFI), as compared to high RFI (HRFI) animals [6]. The duodenal transcriptome architecture of extreme RFI phenotypes of six brown-egg dwarf hens showed that significant differentially-expressed genes were involved in several specific biological functions related to the processes of digestibility, metabolism, biosynthesis and energy homeostasis [7]. Combination analysis of genome-wide association and transcriptome sequencing in chickens showed that the effective single-nucleotide polymorphisms (SNPs) related to energy utilization were located in a 1-Mb region (16.3–17.3 Mb) of chicken chromosome 12, and liver transcriptomes may contribute to RFI, which is directly influenced by appetite, cell activities and fat metabolism [8]. Genome-level analyses of genetic markers and candidate genes for RFI in pigs by genome-wide associations and systems genetic analyses revealed that the SNPs of MAP3K5, PEX7 and DSCAM might be interesting markers for RFI. Functional annotation of genes indicated that regulation of protein and lipid metabolism, gap junction formation, inositol phosphate metabolism and the insulin signaling pathway were significant biological processes and pathways associated with RFI [4]. Genome-wide association analysis of FI and RFI in Nellore cattle identified several markers located on chromosomes 4, 8, 14 and 21 in regions near genes regulating appetite and ion transport [9].
There are more than one hundred domestic chicken breeds available across China, and collectively, they have roughly the same market share in China as do introduced commercial lines. Beijing-You chickens, one of the representative domestic chickens, are known for their peculiar characteristics including higher intramuscular fat content and chewy texture [
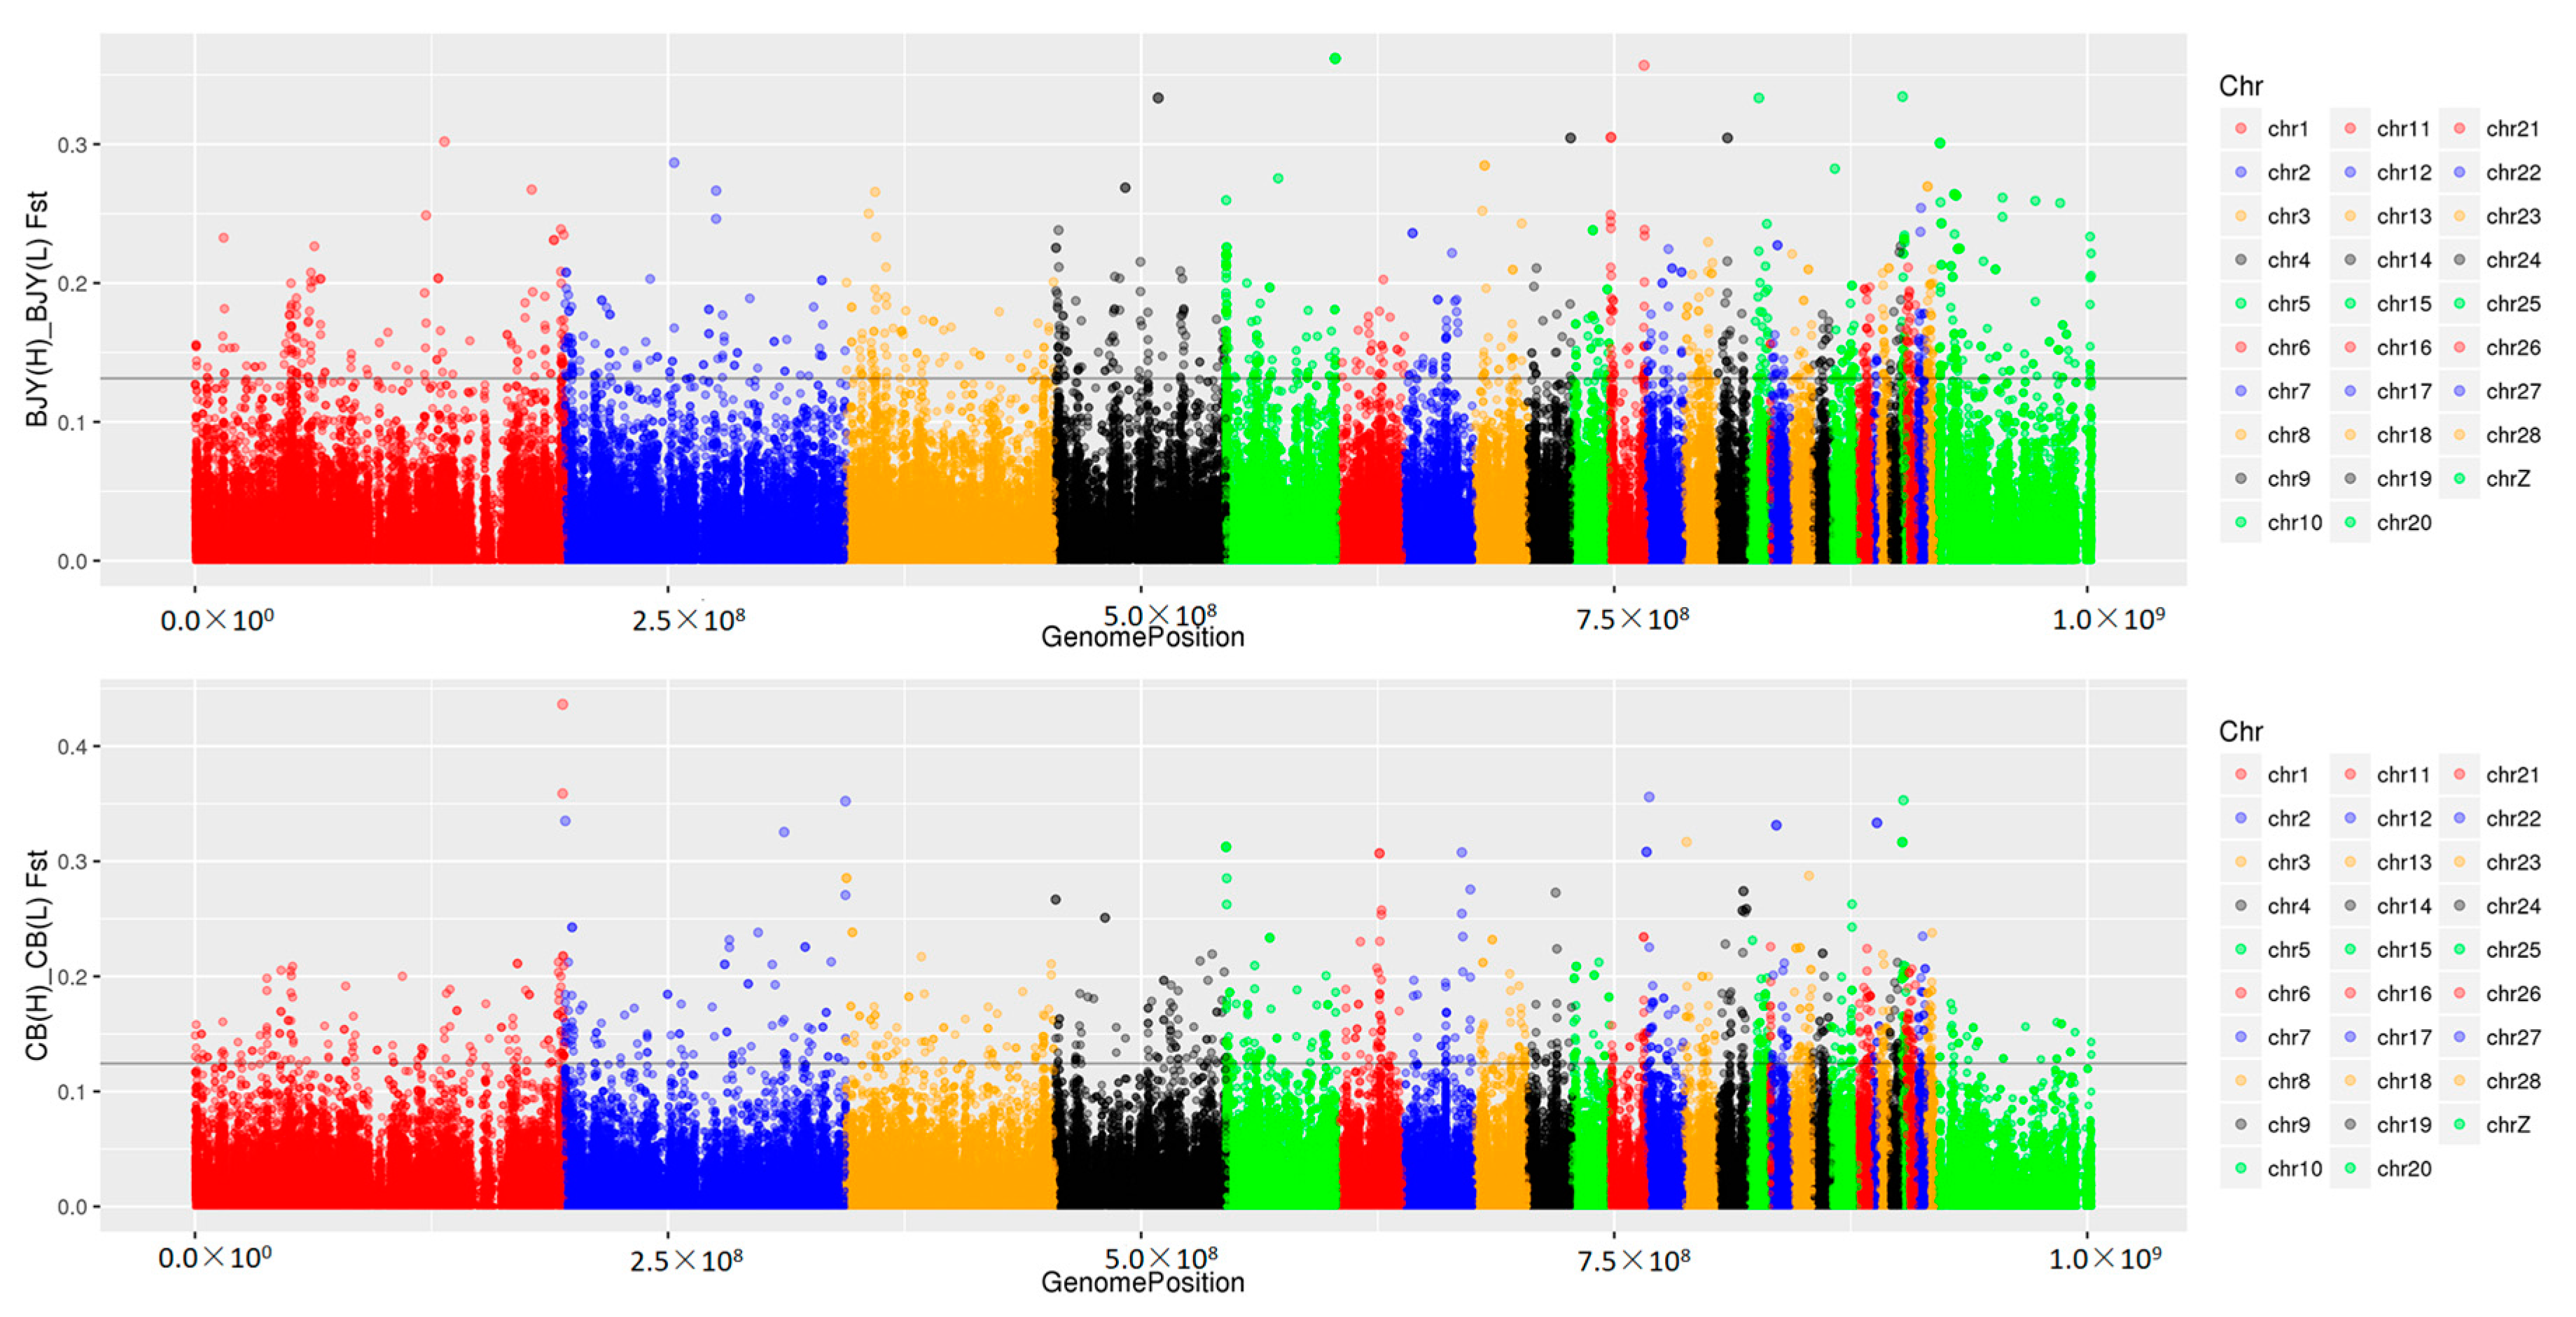
10], which are appealing palatability factors for Chinese consumers. The Cobb line has been intensely selected for high feed efficiency and growth rate and is an important commercial breed world-wide. To gain insights into the molecular alterations underlying differences between HRFI and LRFI chickens, whole genome sequencing (WGS) was conducted using HRFI and LRFI birds of local and commercial breeds.

2. Materials and Methods

2.1. Ethics Statement

All of the animal experiments were conducted in accordance with the Guidelines for Experimental Animals established by the Ministry of Science and Technology (Beijing, China). Animal experiments were approved by the Science Research Department (in charge of animal welfare issue) of the Institute of Animal Sciences, Chinese Academy of Agricultural Sciences (IAS-CAAS) (Beijing, China). Ethical approval on animal survival was given by the animal ethics committee of IAS-CAAS (No. IASCAAS-AE-03).

2.2. Animals and Sample Collection

A population of 400 Beijing-You chickens (200 males and 200 females) with a similar body weight, aged 70 days, was selected from the base population of the Institute of Animal Sciences (CAAS), and these birds came from 75 male and 153 female families (Table 1). Upon receipt, all chickens were housed in individual stair-step cages for FE measurement. The birds were individually weighed at the beginning (Day 70, BW70) and end of the FE test (Day 98, BW98) and were fed ad libitum with daily measurement of FI for the intervening 28 days (Days 70–98 comprised the rapid growth phase for Beijing-You). The diet was based on the Feeding Standard for Chickens established by the Ministry of Agriculture (Beijing, China). For the 28-day period, FI (FI70–98), weight gain (WG70–98) and RFI (RFI70–98), as well as the metabolic BW (BW0.75) at 70 days were calculated. The corresponding data for 220 male Cobb chickens from 64 male families (Table 1) were measured for the rapid growth phase (Days 28–42) of Cobb, developmentally equivalent “finisher” stages, by Guangdong Xinguang Nongmu Co., Ltd. (Foshan, China). RFI was calculated as:
RFI = FI − (b0 + b1BW0.75 + b2WG)
where b0 is the intercept and b1 and b2 are partial regression coefficients of FI on BW0.75 and WG, respectively. RFI values were generated by the regression procedure using SAS 8.0 for Windows statistical software (SAS Institute, Cary, NC, USA).
Genomic DNA was isolated from whole blood samples collected from 48 HRFI and 48 LRFI chickens (the details of the group information are shown in Table 1), within each breed, using the phenol-chloroform method. DNA quality was determined by gel electrophoresis, and the 48 individual DNA samples from each group were used to construct three pools, each of 16 samples. For Beijing-You chickens, each pool consisted of 8 males and 8 females. In brief, there were three pools and 16 chickens of each pool for each sub-group. Paired-end sequencing libraries were constructed using the Nextera DNA Library Preparation Kit (Illumina Inc., San Diego, CA, USA) according to the manufacturer’s standard protocol. At the end of the feeding studies (Day 98), birds were killed, and weight percentages of breast and thigh muscles from the two groups (n = 48, HRFI and LRFI, in Beijing-You chickens) were measured by standard dissection procedures. Breast muscle and liver samples from subsamples (n = 8) of HRFI and LRFI male Beijing-You chickens were cut into small pieces, rapidly snap-frozen and stored at −80 °C for quantitative real-time PCR (qRT-PCR) analyses. Likewise, samples of breast muscle and hypothalamus from HRFI and LRFI Cobb chickens (each n = 8) were collected and saved the same way.

2.3. Genome Sequence Assembly and Data Analysis

All libraries were sequenced on the Hiseq 2500 platform (Illumina) instrument with 125-bp paired-end reads. Reads of extremely low quality (>10 consecutive nucleotides with Phred scores < 10), with adaptor contamination or without a quality control-passed paired read were discarded using NGSQC toolkit (v2.3.3), resulting in a qualified clean dataset. More than 20× coverages were determined for each pool (Table 1). All clean sequenced reads were mapped to a reference genome (Galgal 4.0) using the BWA tool (v0.7.10) [11] with default parameters. Output SAM files were converted to BAM files with command Samtools (v0.1.1.18), and all converted BAM files were sorted with command Samtools (v0.1.1.18). PCR duplications were removed with the “rmdup” argument in Samtools (v0.1.18) [12] after mapping. SNPs were identified and genotyped for each sample pool with the mpileup function in Samtools (v0.1.18), as well as the VarScan.jar tool (v2.3.7) written in Java [13]. Only highly confident variants supported by both methods were used for further downstream analyses.
The sequence data reported in this paper have been deposited in the Genome Sequence Archive of BIG Data Center, Beijing Institute of Genomics (BIG), Chinese Academy of Sciences and is publicly accessible at http://gsa.big.ac.cn/preview/preview.action?code=WkQSr8M0 (accession no. PRJCA000311).

2.4. SNP Detection and Function Annotation

To identify SNPs with frequencies that consistently differed across replicates (pools) of these divergent populations, the divergence of allelic frequency between two phenotypically-extreme groups in the two breeds of chickens was statistically tested using analysis of variance and F-tests. SNPs with Benjamini-adjusted p-values of <0.05 were analyzed further. Pairwise fixation index (FST) values were calculated using the FST-test tool in the PoPoolation2 package. SNPs with FST values in the top 5% and allelic frequency changes greater than 35% (greater than the median of allelic frequency divergence in the top 5% SNPs) were identified as trait-related SNPs. Genes harboring these SNPs (50 kb of upstream and downstream of the SNPs) were selected for pathway and function enrichment analyses using the Ingenuity Pathway Analysis (IPA) system (http://www.ingenuity.com) according to the default parameters. Functional and canonical pathway analyses were used to identify significant biological functions and pathways; associated networks were also constructed.

2.5. SNP Validation by Sanger Sequencing

Nine randomly-chosen SNPs were subjected to validation by PCR analysis and Sanger sequencing using 16 phenotypically-divergent chickens. Targeted sequences were first PCR-amplified using 50 ng of genomic DNA with a Taq PCR MasterMix (Tiangen Biotech Co., Ltd., Beijing, China). Verification of PCR was performed by 1% agarose gel electrophoresis. Amplicons were then purified according to the EasyPure PCR Purification Kit’s standard protocol (Transgen Biotech Co., Ltd., Beijing, China) and sent to Tianyi Huiyuan (Beijing, China) for Sanger sequencing using primers described in Table S1. Results were analyzed using DNAMAN 8.0 (Lynnon Biosoft, San Ramon, CA, USA) (http://www.lynnon.com/), and ratios of bases occurring at SNP locations were recorded.

2.6. Association Analysis of the SNPs from Whole Genome Sequencing in the Validation Population of Cobb

In the validation population, there were 779 Cobbs (345 males and 434 females), which were the offspring of the generation for WGS bird screening. The RFIs of these chickens were measured by the methods described above. One hundred ninety SNPs were randomly selected from the candidate SNPs obtained from the WGS of Cobb. Genotyping was done on Axiom® SNP arrays using the Affymetrix GeneTitan® system according to the procedure described by Axiom 2.0 Target Prep 384 Samples Protocol (Affymetrix; Santa Clara, CA, USA) (https://www.thermofisher.com/). Genetic analyses were performed using ASREML [14] packages under the R v3.1.1 environment [15]. Breeding values of RFI were estimated using the BLUP based on an animal model with a relationship matrix. The models used in matrix notation were as follows:
y = Xb + Za + e
where y is the vector of observations; b, the vector of fixed effects of sex; a, the vector of random direct genetic effects; e, the vector of random residual effects; X and Z are incidence matrices relating the observations to the respective fixed and direct genetic effects.
The association analyses of estimated breeding values (EBVs) and SNPs were conducted using the Wald test under the R v3.1.1 environment [15]. The associations between SNP marker genotypes and RFI were estimated by using Proc GLM in SAS 9.4 (SAS Institute Inc., Cary, NC, USA). Additive genetic effects were estimated by pair-wise comparison of the two homozygous genotypes, and the dominance effects were calculated as the deviation of the heterozygote effect from the average of the two homozygous genotypes.

2.7. Quantitative Reverse Transcription-PCR Validation of Expression of Candidate Genes

To investigate whether the expression profiles of the variant genes differed between HRFI and LRFI groups, key genes (Table S2) that were enriched in the canonical pathways were chosen for qRT-PCR analyses. Total RNA was extracted from hypothalamus, breast muscle and liver using the RNAsimple Total RNA Kit (Tiangen) according to the manufacturer’s recommendations. For complementary DNA (cDNA) synthesis, 1 μg of total RNA was reversed transcribed with high capacity cDNA reverse transcription kits according to the manufacturer’s protocol (TaKaRa, Dalian, China). Zero-point-five microliters of cDNA serving as a template in a 20-μL PCR mixture were subsequently used for qRT-PCR analyses with an ABI 7500 Detection System (Applied Biosystems, Foster City, CA, USA) and primers designed using Primer Premier 5.0 software (PREMIER Biosoft, Palo Alto, CA, USA), as listed in Table S2. Eight independent replications were used for each assay. The mRNA abundance of candidate genes was determined using the KAPA SYBR® FAST qPCR Master Mix (2×) Universal Cocktail (KAPA Biosystems, Boston, MA, USA). A corrected Ct (ΔCt) was calculated by subtracting the β-actin Ct value from that of the target genes for each sample. Relative differences from the control sample (the HRFI groups) were then calculated according to the 2−ΔΔCT method. Differences between the two groups were analyzed using Student’s t-test for independent samples in SAS 8.0 for Windows.

3. Results

3.1. Characteristics of Birds in High and Low Phenotypic Groups

A summary of the phenotypic measurements of Beijing-You and Cobb chickens is presented in Table 2. There was no significant difference between HRFI and LRFI sub-groups within breeds in the initial body weights (BW70 of Beijing-You and BW28 of Cobb) and the final BW (BW98 of Beijing-You and BW42 of Cobb), nor the average daily gain (ADG). Notice, as expected, how different the means are for the Beijing-You and Cobb chickens. There were, however, significant differences (p < 0.01) in daily feed intake (DFI) between the phenotypically-divergent groups in both breeds. Consequently, the differences in mean RFI values and the feed conversion ratio (FCR) between LRFI and HRFI chickens in each breed were highly significant (p < 0.01).

3.2. Genomic Variants Related to Residual Feed Intake in Beijing-You Chickens

In LRFI and HRFI Beijing-You chickens, 8,505,214 and 8,479,041 SNPs were detected by applying an advanced detection algorithm and filtering criteria (Table S3). There were 26,125 SNPs with FST values in the top 5% shown in Figure 1. More significant SNPs were enriched on chicken (Gallus gallus) chromosomes (GGA) 1, GGA2, GGA4 and GGA Z. After filtering with allelic frequency divergence >35% between the HRFI and LRFI groups, there were 6288 SNPs identified as candidates for RFI traits (Figure 2A, Table S4). Consistently, over 4000 SNPs were found on four chromosomes GGA 1, GGA2, GGA4 and GGA Z. Among them, 2542 SNPs were located in intergenic regions and 3746 in genes, including upstream and downstream genes. The SNPs with synonymous and missense mutation were only 85 and 27 (Figure 3A). The 3746 SNPs were then annotated to 1137 genes (Table S4).
Functional annotation and pathway analysis were performed using IPA. Specific for Beijing-You, phosphatase and tensin homolog (PTEN) signaling, as well as lipid and carbohydrate metabolism were enriched (Figure 4, Table 4, Figure S1). Correspondingly, hepatic abundance of NEU3, PHKG1 and PIP5K1B transcripts that participate in lipid and carbohydrate metabolism were upregulated (p < 0.05) in the HRFI compared to the LRFI birds (Figure 5A).

3.3. Genomic Variants Related to Residual Feed Intake in Cobb Chickens

In Cobb chickens, 8,352,008 and 8,372,769 SNPs were detected in the LRFI and HRFI sub-groups (Table S3). There were 15,350 SNPs with FST values in the top 5% shown in Figure 1. More significant SNPs were enriched on GGA1, GGA2, GGA3 and GGA4. With the same data filtering criteria as for Beijing-You chickens, 1001 SNPs were obtained with >600 on GGA 1, GGA2, GGA3, GGA4 and GGA Z (Figure 2B, Table S5). Of these, 575 SNPs were located within genes, including 10 synonymous mutations and two missense mutations (Figure 3B). The 575 SNPs were then annotated to 448 genes (Table S5). The number of SNPs identified in Beijing-You was more than twice that of Cobb.
Specific for Cobb, function annotation showed that genes were enriched in behavior-related physiological process (Table 3). Feed behavior played a critical role in feed intake, and variation in feed intake was associated with variation in RFI. cAMP responsive element binding protein (CREB) signaling is a key factor in the control of appetite and feed intake by the hypothalamus. CREB signaling in neurons as the canonical pathway was significantly enriched in Cobb chickens (Figure 6, Table 4). Correspondingly, the expression levels of CAMK4, PLCB4 and FGFR4 in the hypothalamus were higher in HRFI chickens than in LRFI chickens (p < 0.05, Figure 5B).

3.4. Common Features of Both Breeds

Only 127 enriched genes were common to the two breeds (Figure 7). There were, however, several physiological processes commonly enriched in the two breeds, such as the development of nervous system, connective tissue and the skeletal and muscular systems (Table 3).
In Beijing-You, the enrichment of nNOS signaling in skeletal muscle cells as the significant pathway supported the important role played by organismal development for the RFI trait (Figure 8, Table 4). Consistently, the abundance of NOS1 transcripts was upregulated (p < 0.01) in the breast muscle of LRFI chickens compared to HRFI chickens (Figure 5A).
Again, in Cobb, the enrichment of Rac and actin cytoskeleton signaling was consistent with the important role played by organismal development for the RFI trait (Table 4, Figure 9 and Figure 10). Transcript abundance of the key genes (CDC42, CSK and PIK3R3) in Rac and actin cytoskeleton signaling were consistently higher (p < 0.01) in breast muscle of LRFI than HRFI chickens (Figure 5B).

3.5. SNP Validation

The genome sequencing used DNA from 16 chickens in each of the 12 pools. Nine SNPs were randomly chosen from the candidate SNPs and were subjected to verification by PCR analysis and Sanger sequencing using DNA from individual birds. The results showed (Table S6) that the average similarity was about 75% between the WGS and Sanger sequencing methods, indicating the reliability of the WGS results from the pooling strategy used here.

3.6. Association of the SNPs with the Breeding Value of RFI in the Cobb Population of 779

The association analysis to validate the 191 SNPs was done using the validation population of 779 offspring from the Cobb chickens making up the WGS resource (Table S7). There were 46 SNPs that were demonstrated to be significantly associated with RFI (p < 0.05). The details of these significant SNPs, including their positions in the genome, the nearest known genes and the p-values, are given in Table 5. The association between 46 SNPs genotypes and RFI was estimated. Of these, twelve SNPs, the genotypes showed significant differences. The effects of the genotypes and additive and dominance effects are shown in Table 6.

4. Discussion

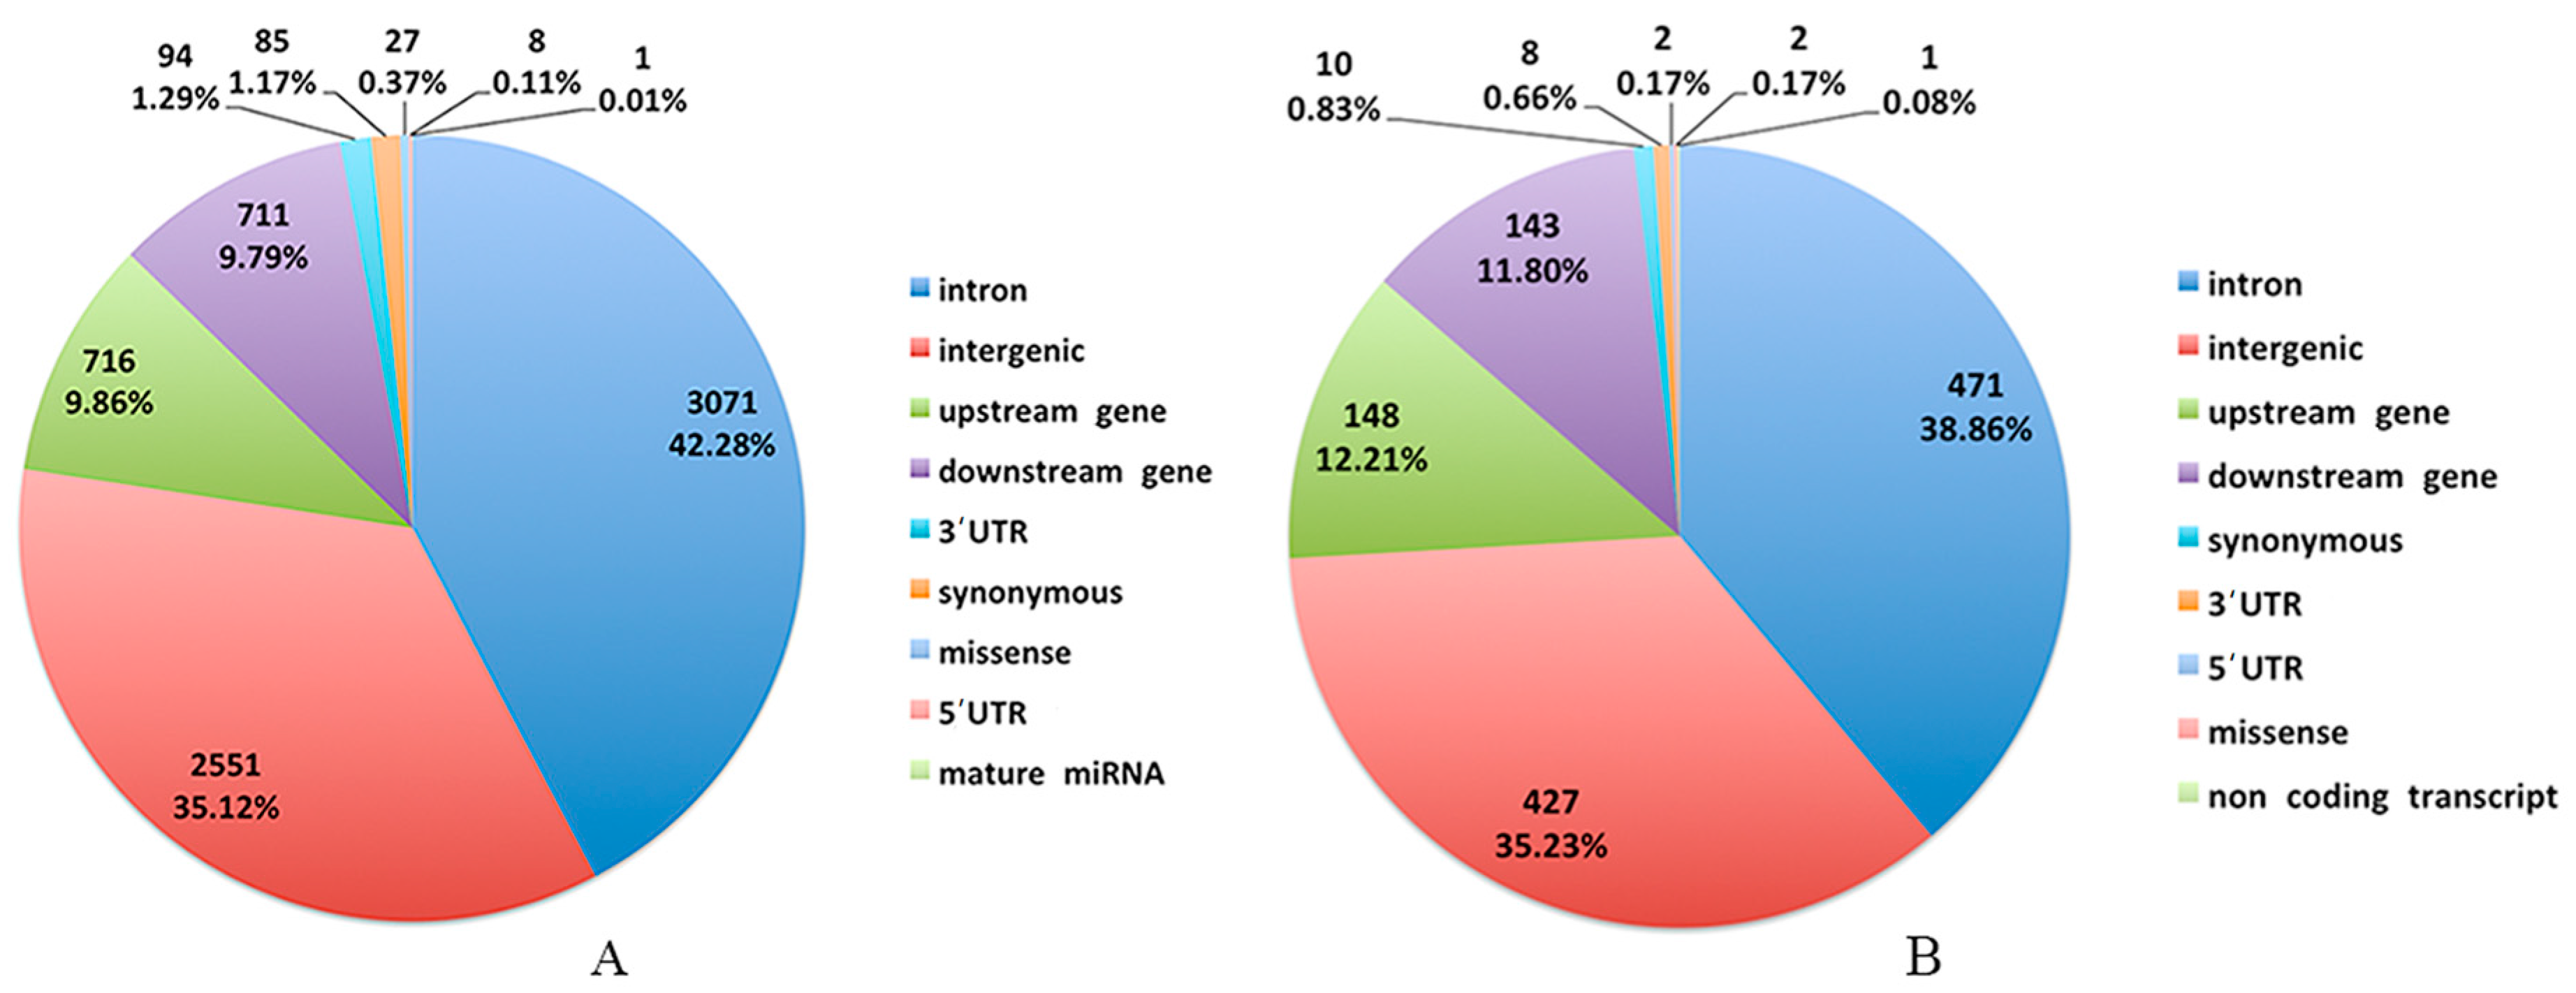
Genetic improvement of economically-important traits, such as growth rate and feed efficiency, has occurred for about 100 years in the Cobb chickens. There has been no systematic genetic selection in the conservation population of the local Beijing-You chickens. Consistent with the current findings, more genomic variants exist in the Beijing-You than Cobb chickens, because the high intensity of genetic selection in the latter would be expected to result in genomic regions with increased homozygosity. There were numerous SNPs associated with RFI in the Beijing-You and a larger proportional difference in FCR (HRFI/LRFI = 1.2), suggesting a high potential for genetically-increasing feed efficiency in Beijing-You chickens. Obviously, FCR is already much lower in Cobb chickens, and there was less difference (HRFI/LRFI = 1.08) between the phenotypic extremes.
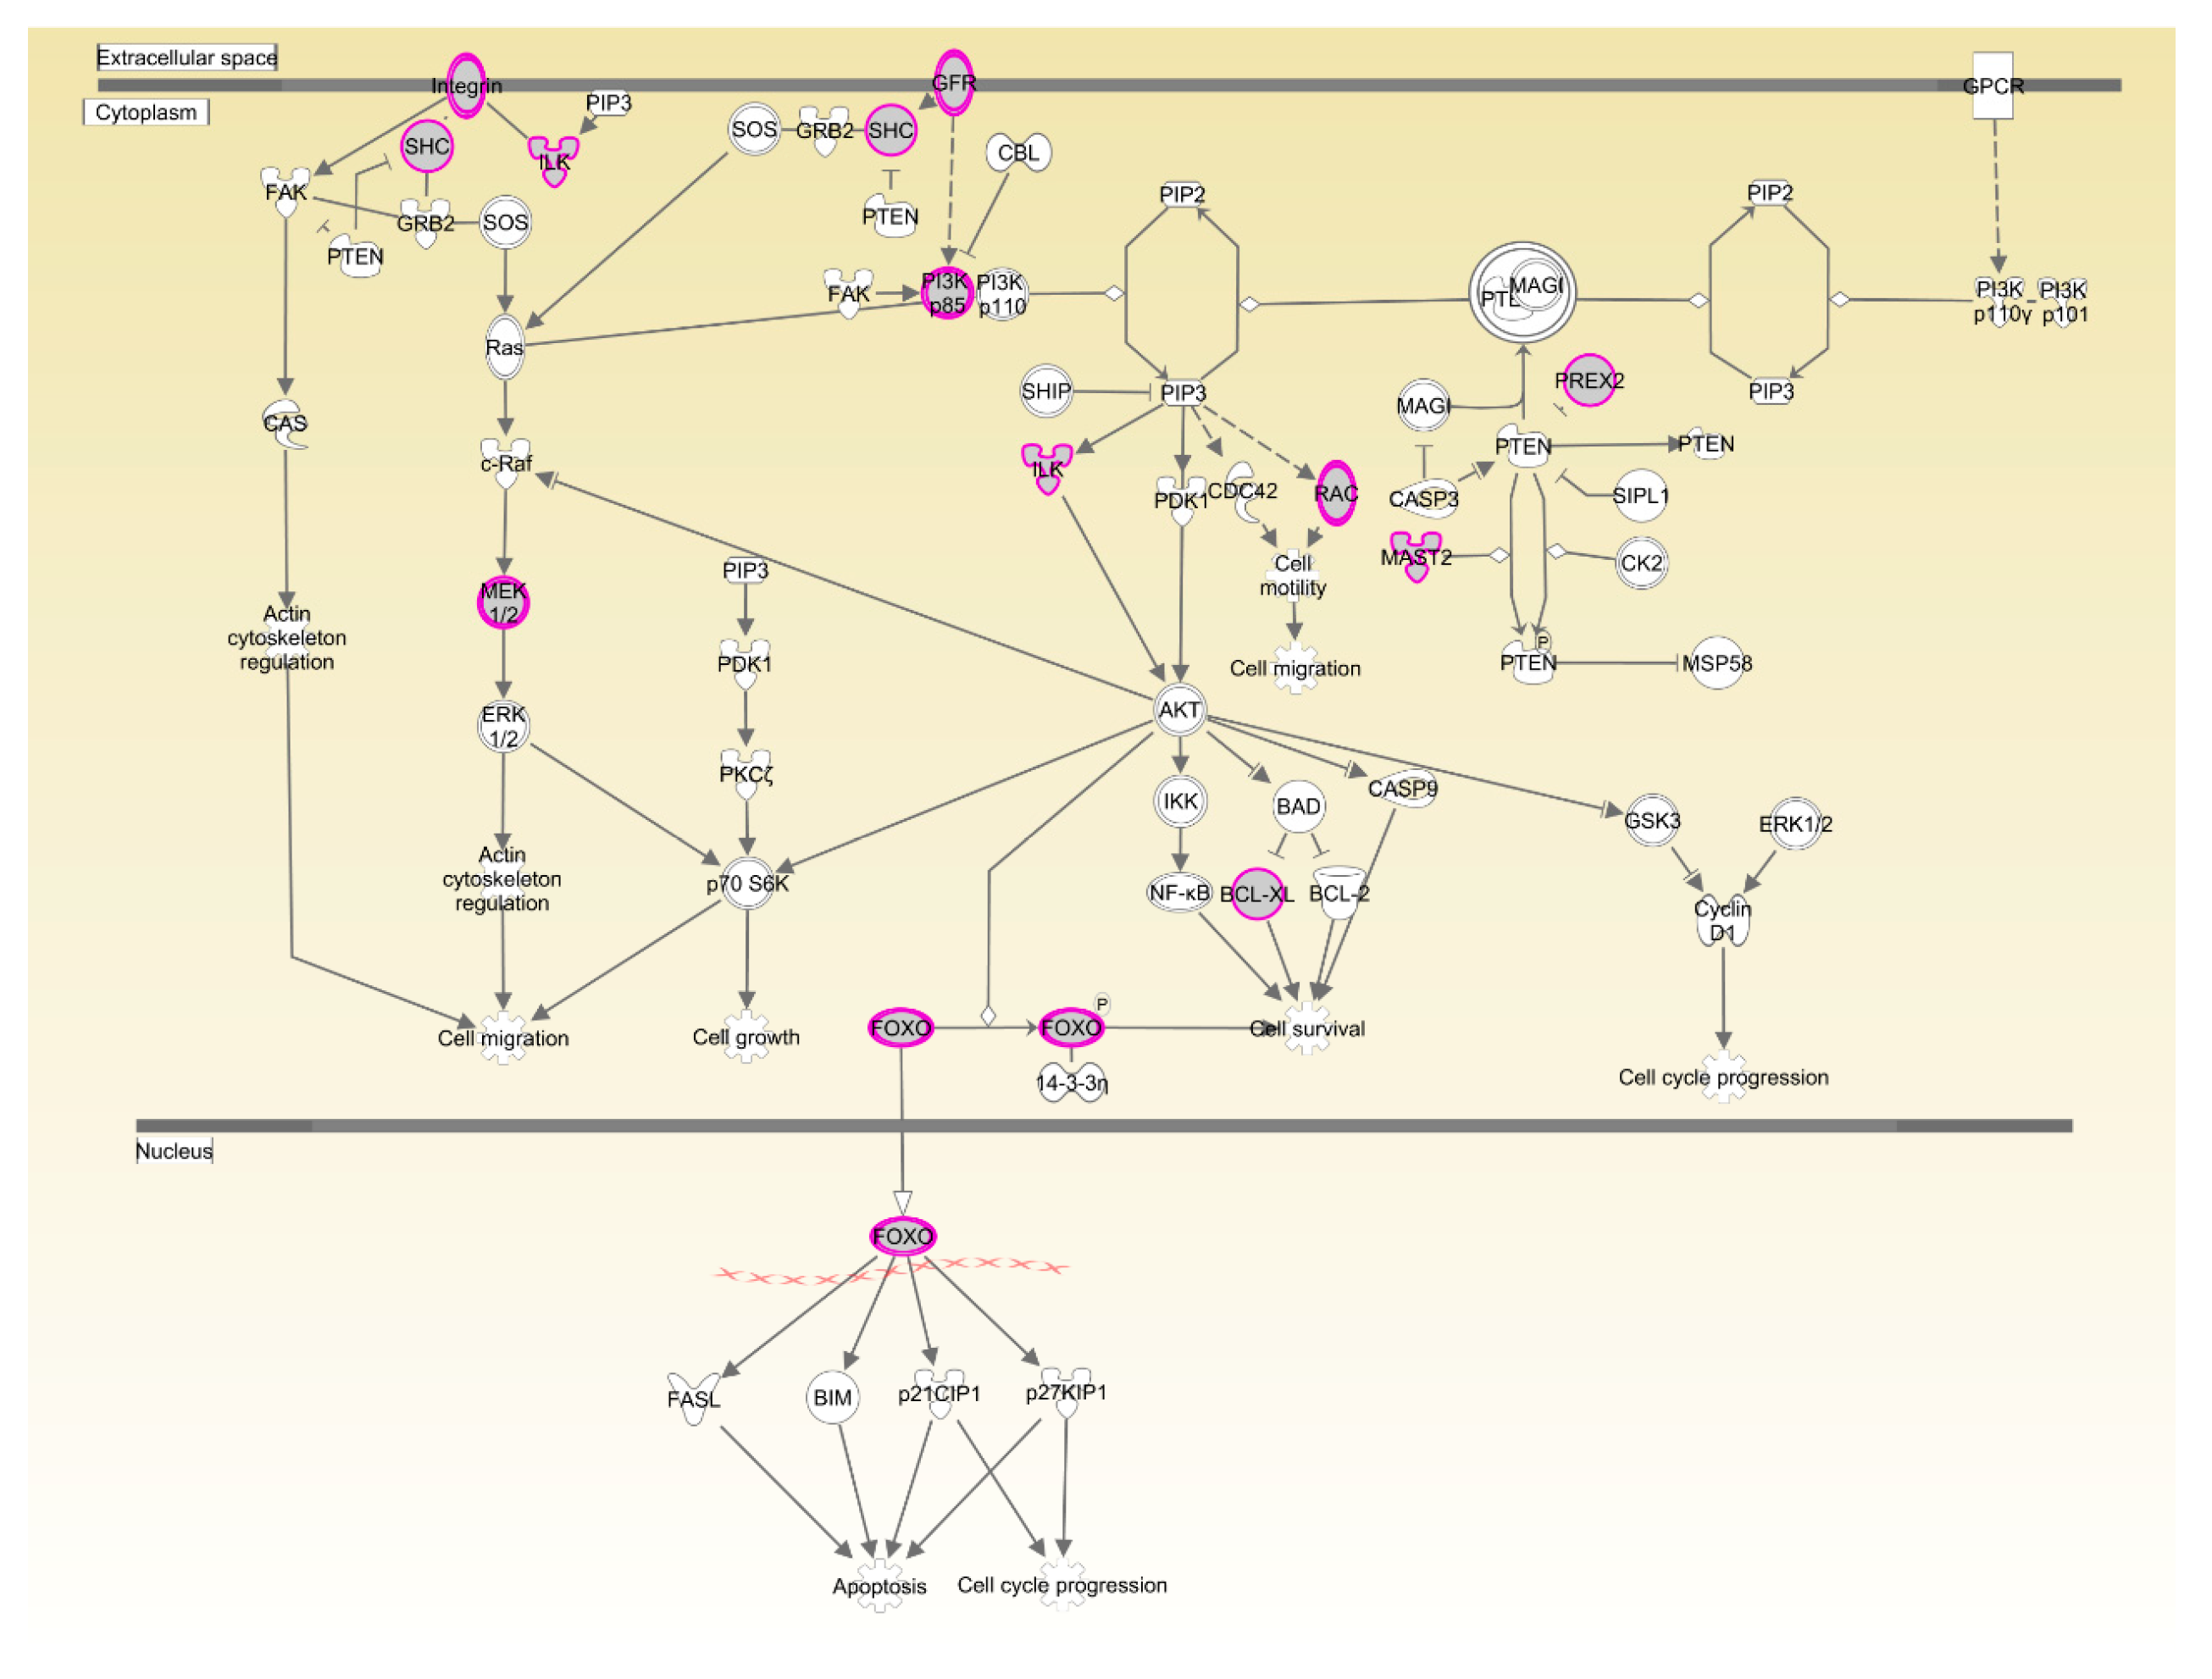
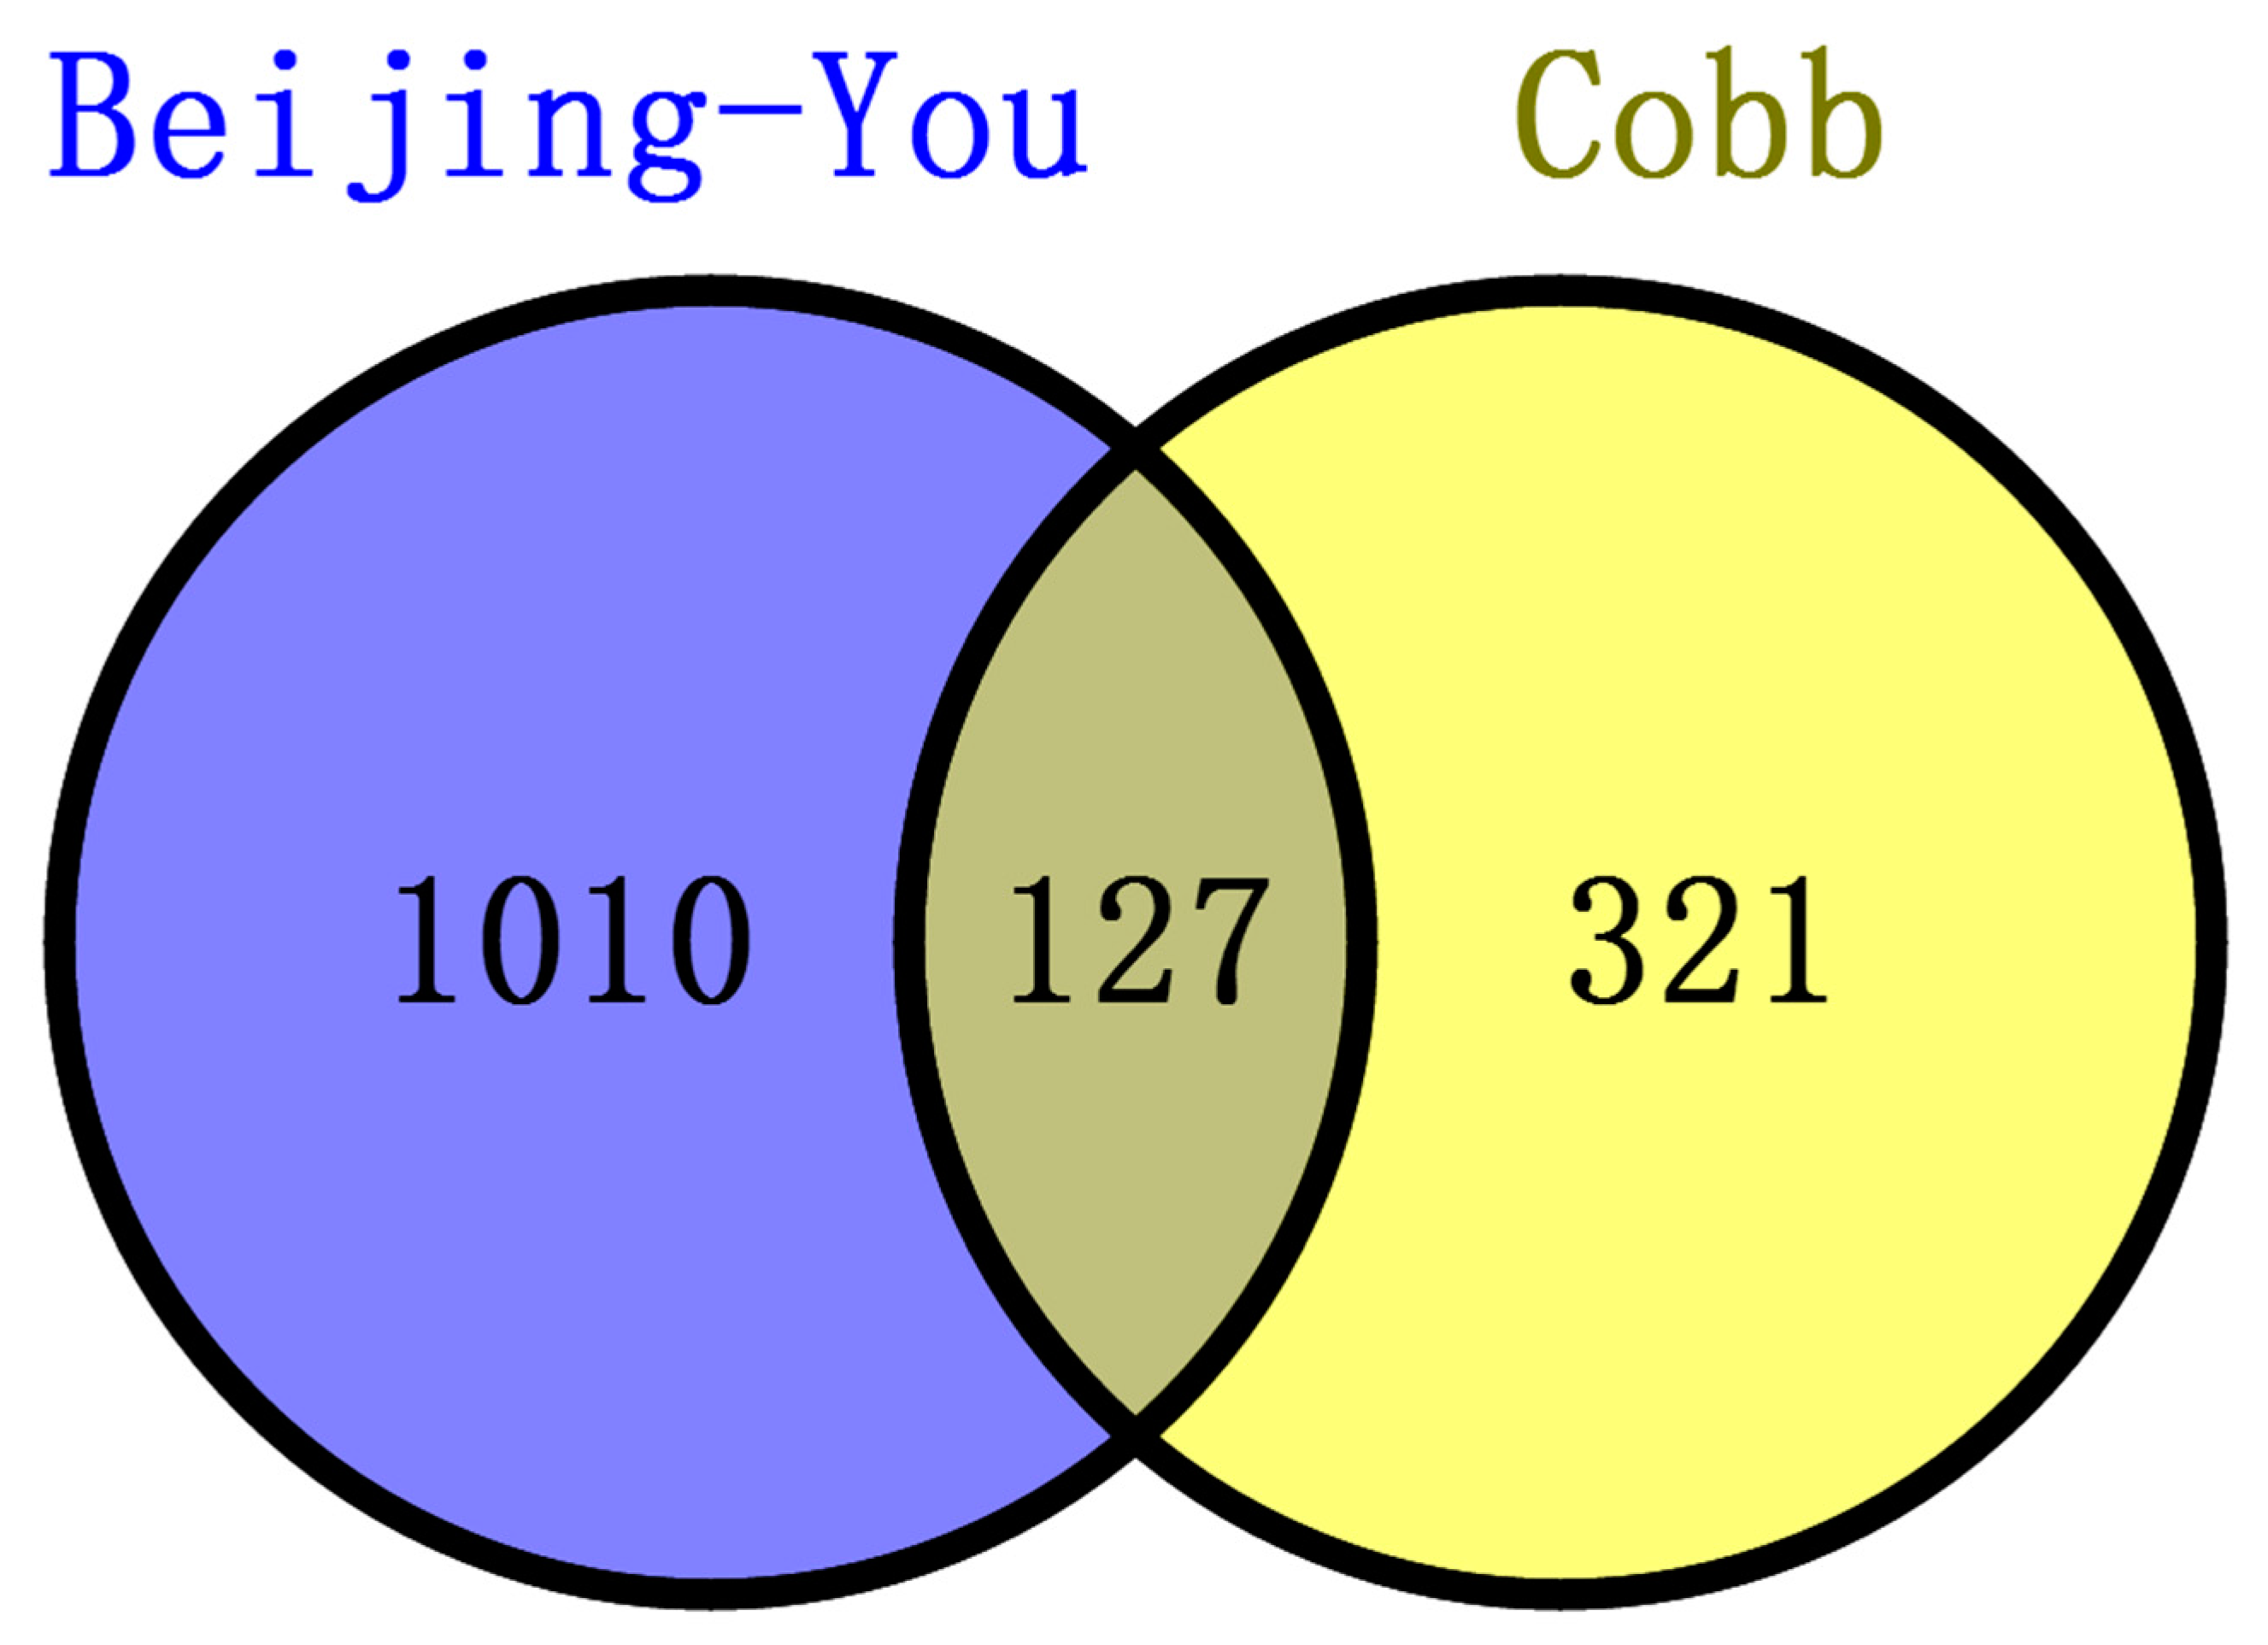
The two breeds examined here showed some unique characteristics, and only 127 genes associated with RFI were identified in both breeds. These represented a small proportion of the total (127/1137) for Beijing-You, but much higher (127/448) for Cobb chickens. PTEN signaling, as well as lipid and carbohydrate metabolism were only enriched in Beijing-You chickens. The PTEN/PI3K/AKT signaling pathway has been shown to regulate cell metabolism, growth and survival [16,17]. PTEN/PI3K/AKT signaling can mediate the insulin-stimulated activation of many major pathways of hepatic lipid metabolism, including lipogenesis, fatty acid β-oxidation, fatty acid esterification to triglycerides and very low density lipoprotein-triglyceride (VLDL-TG) secretion [18,19]. PTEN, a negative regulator, dephosphorylates PIP3 to inhibit the activity of PI3K/AKT signaling [20]. When the PTEN was overexpressed, insulin signaling effects were inhibited, resulting in decreased RAC-alpha serine/threonine-protein kinase (AKT) activity and solute carrier family 2, facilitated glucose transporter member 4 (GLUT4) translocation to the cell membrane, which consequently contributed to insulin resistance and progression of non-alcoholic fatty liver disease [21,22,23]. In addition to controlling the activity of signaling intermediates at the cell membrane, PI3Ks can drive gene expression programs in the nucleus. The forkhead box protein O1(FOXO) transcription factors are coupled to PI3K activity through AKT-dependent phosphorylation [24], which are considered effectors of the pathway regulating hepatic glucose production. Matsumoto et al. [
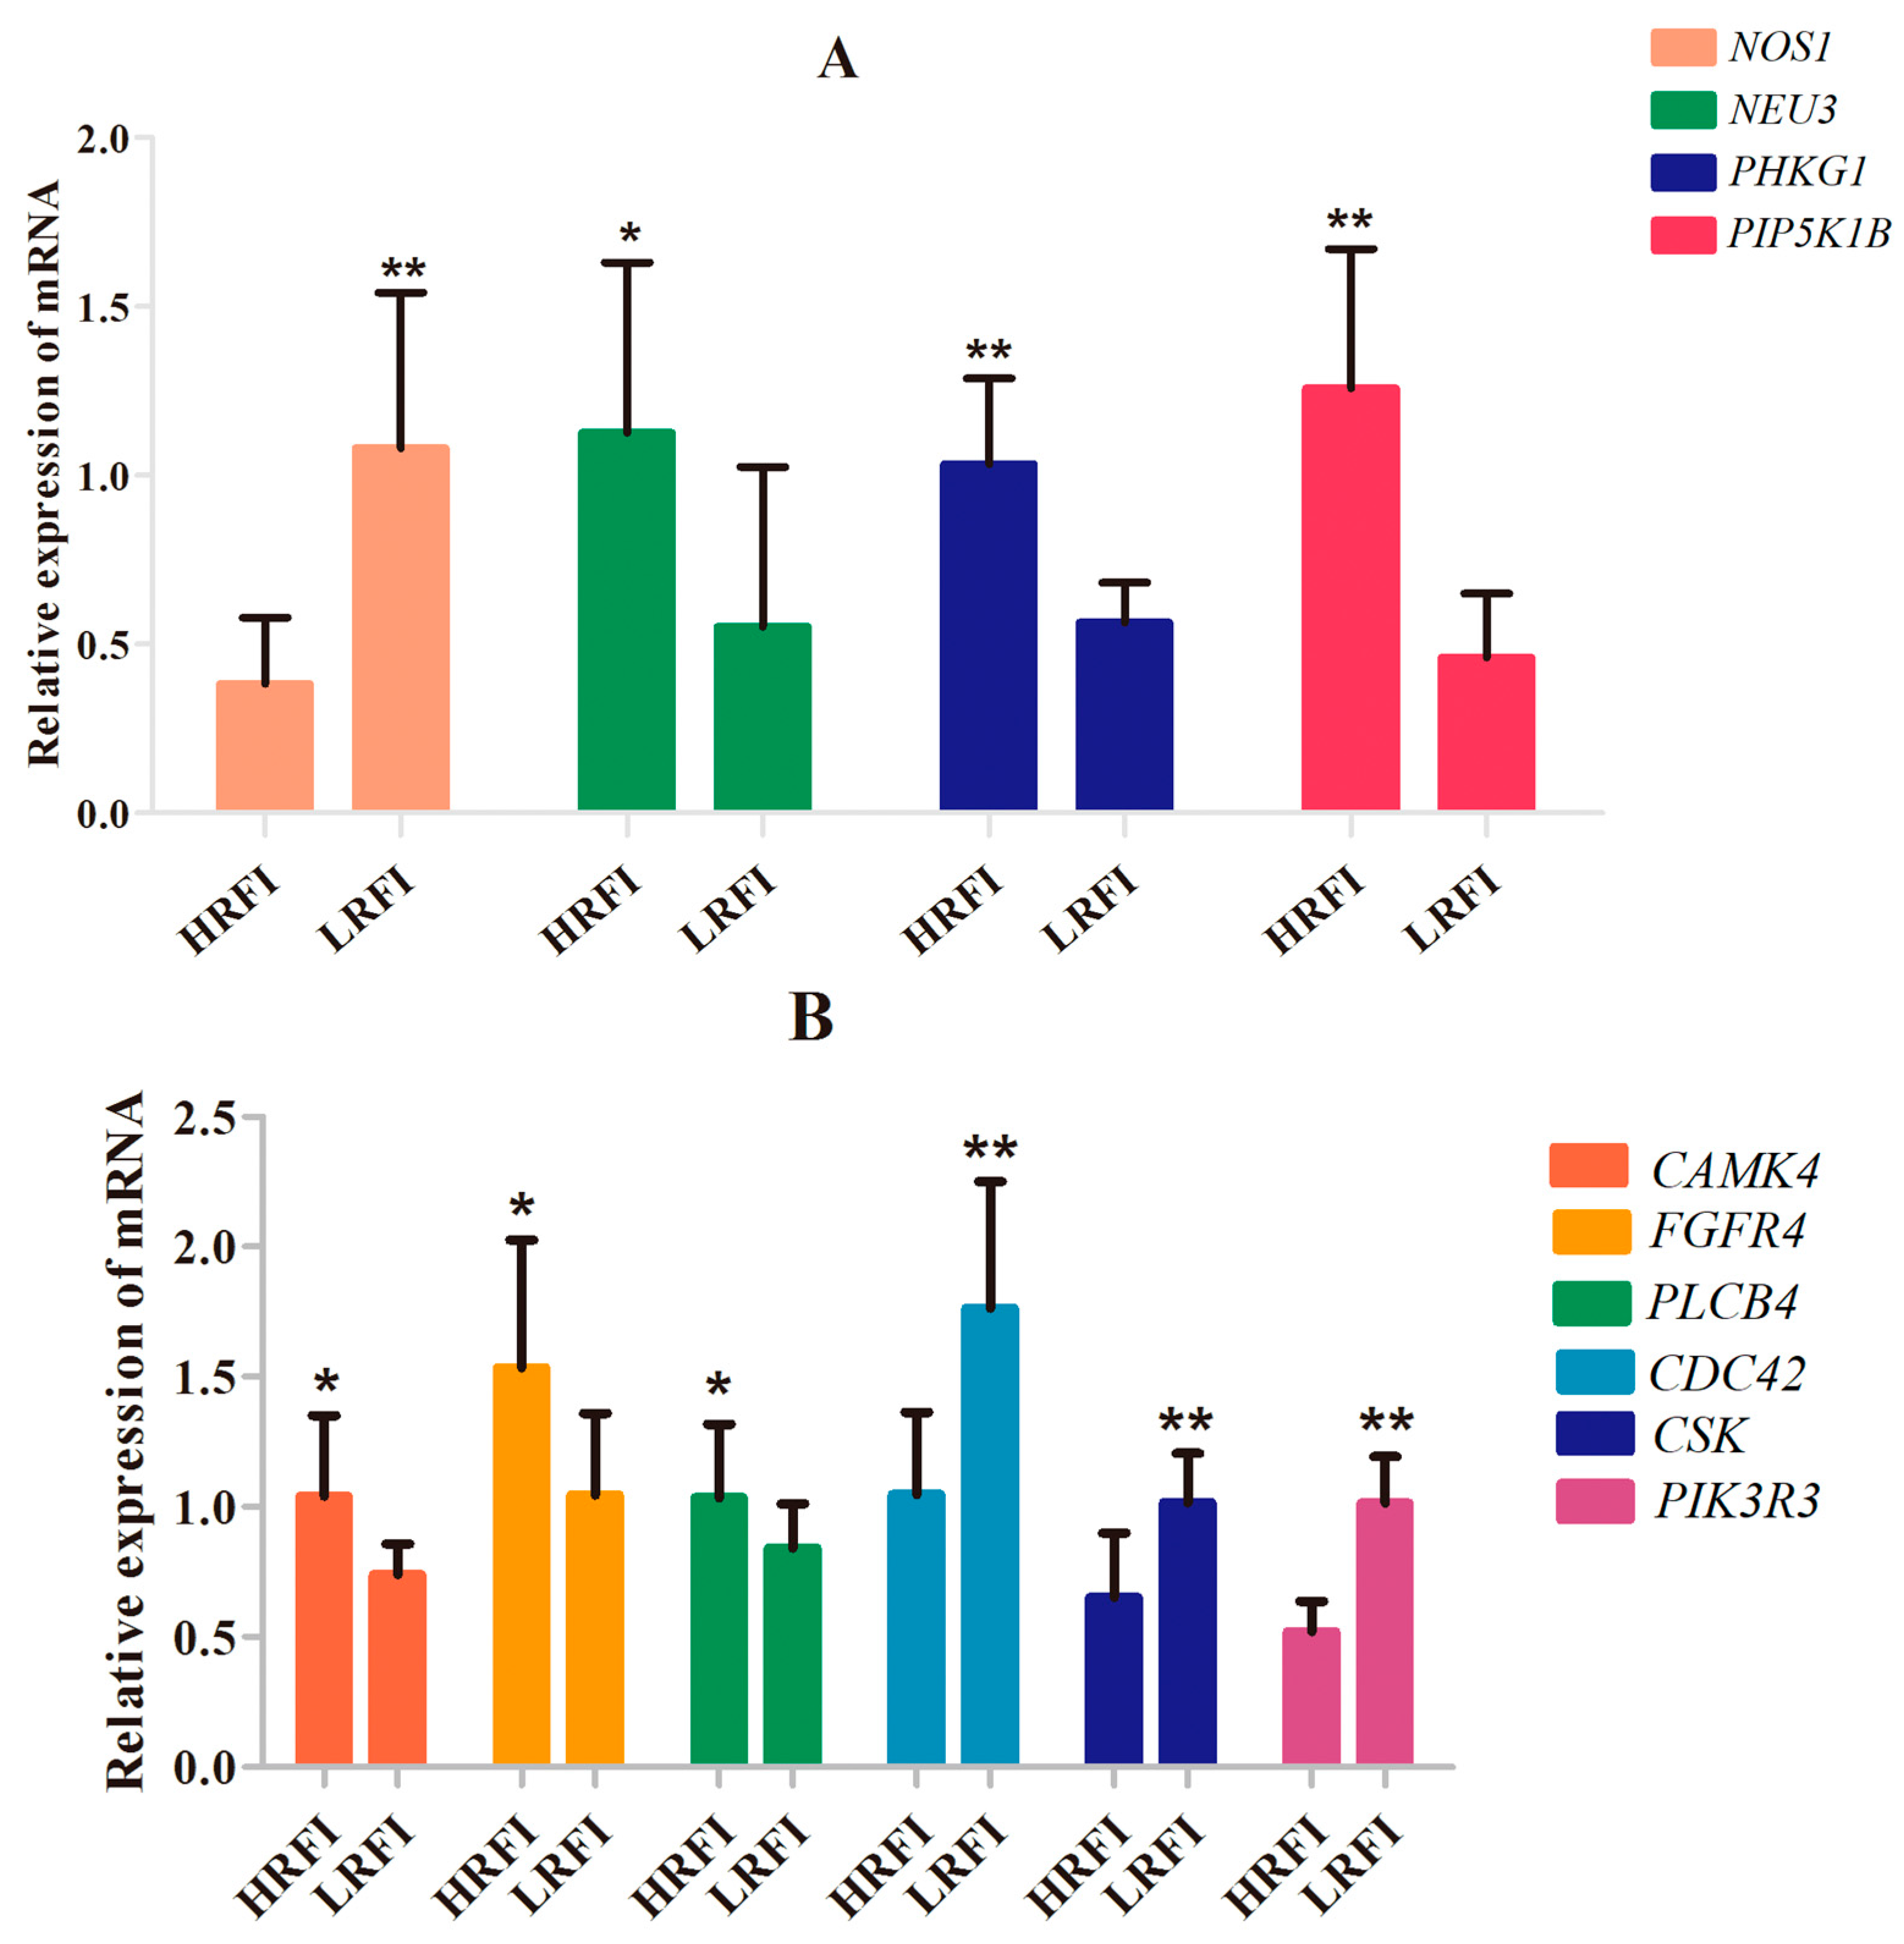
25] showed that delivery of FOXO1 to mouse liver resulted in steatosis arising from increased triglyceride accumulation and decreased fatty acid oxidation. In the present study, the genes (PHKG1, PIP5K1B and NEU3) that participate in carbohydrate and lipid metabolism [26,27,28] were upregulated in the livers of HRFI Beijing-You chickens. Previous studies [5,29] have demonstrated that HRFI animals required more energy to maintain biological activities, such as protein turnover, stress response and muscle activity. Beijing-You chickens are characterized by high fat deposition in muscle and abdominal adipose [30]. Therefore, lipid and carbohydrate metabolism may play crucial roles in RFI through the PTEN/PI3K/AKT signaling pathway in Beijing-You chickens.
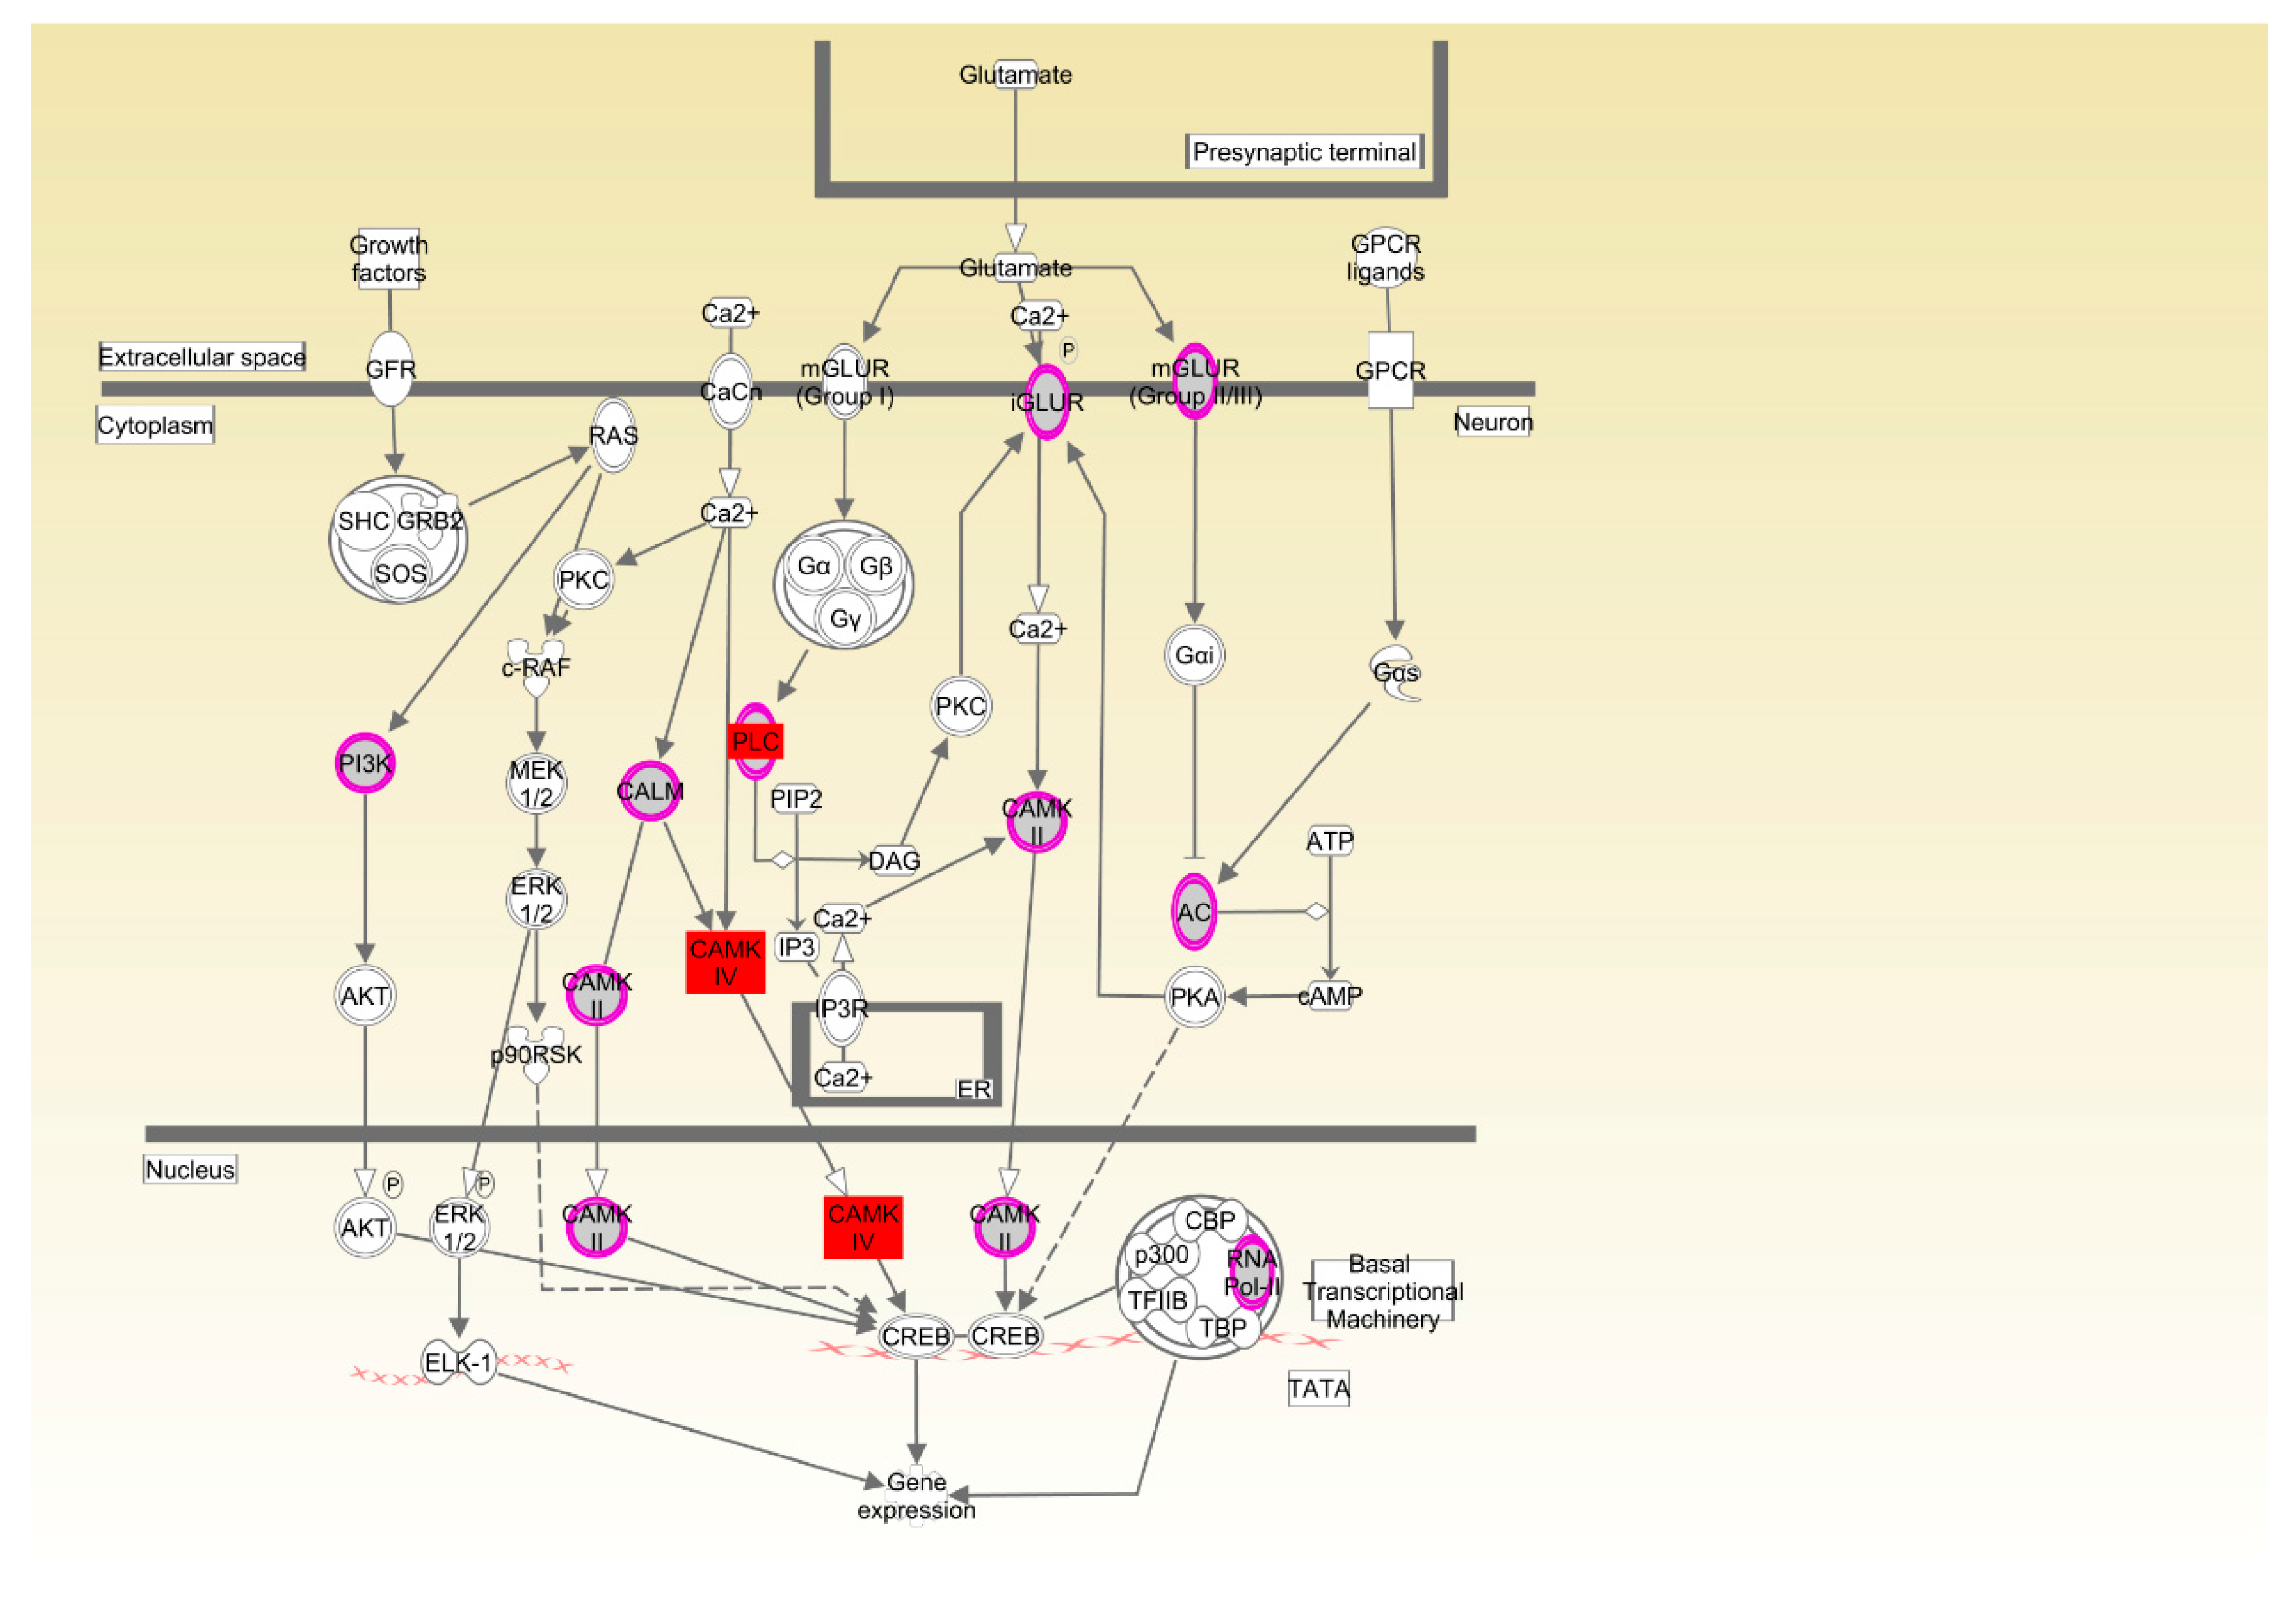
For Cobb chickens, the results showed that feed behavior and the related pathway (CREB signaling in neurons) were enriched. Feed behavior plays a key role in feed intake, and variation in feed intake is associated with variation in RFI. The CREB transcription factor has been widely investigated as a key factor in the control of appetite and FI by the hypothalamus [31]. A previous report showed that an increase and phosphorylation of CREB in the hypothalamus, as a result of injection of NPY into the rat hypothalamus or fasting for 48 h, suggested that CREB phosphorylation might be involved in the regulation of feeding behavior [32]. Calcium/calmodulin-dependent protein kinase (CAMK) plays a critical role in activation of CREB via Ser-133 phosphorylation [33]. PLCB4 and CAMK4 mRNA levels were higher in the hypothalamus of HRFI than LRFI chickens. The upregulation of CAMK4 mRNA levels may increase FI through induction of CREB phosphorylation and activation of downstream signaling pathways, and upregulation of PLCB4 expression may affect activation of CAMKs through changes in Ca2+ concentrations. Therefore, the CREB signaling pathway may contribute to RFI in Cobb chickens by affecting feed behavior. Compared to the Beijing-You, the Cobb is a specialized broiler breed as a result of long-term selection for increased feed efficiency and growth rate, which may have resulted in part from changes in feed behavior and its related genetic basis.
Organismal development as the common physiological process was enriched in both breeds. The concept of RFI was initially developed to determine differences among animals in feed conversion into body tissue. A previous study in cattle showed a variation in RFI of 37%, which was explained by tissue metabolism, protein turnover and stress response [34]. Global RNA expression in breast muscle obtained from a male broiler line phenotyped for high or low feed efficiency showed that significant differences in gene expression profiles were associated with muscle fiber development, muscle function and cytoskeletal organization [35]. In the present study, skeletal and muscular system development and function were enriched in both Beijing-You and Cobb breeds. Phenotypic measurement showed that the percentages of breast and thigh muscle were higher in LRFI than HRFI Beijing-You chickens (
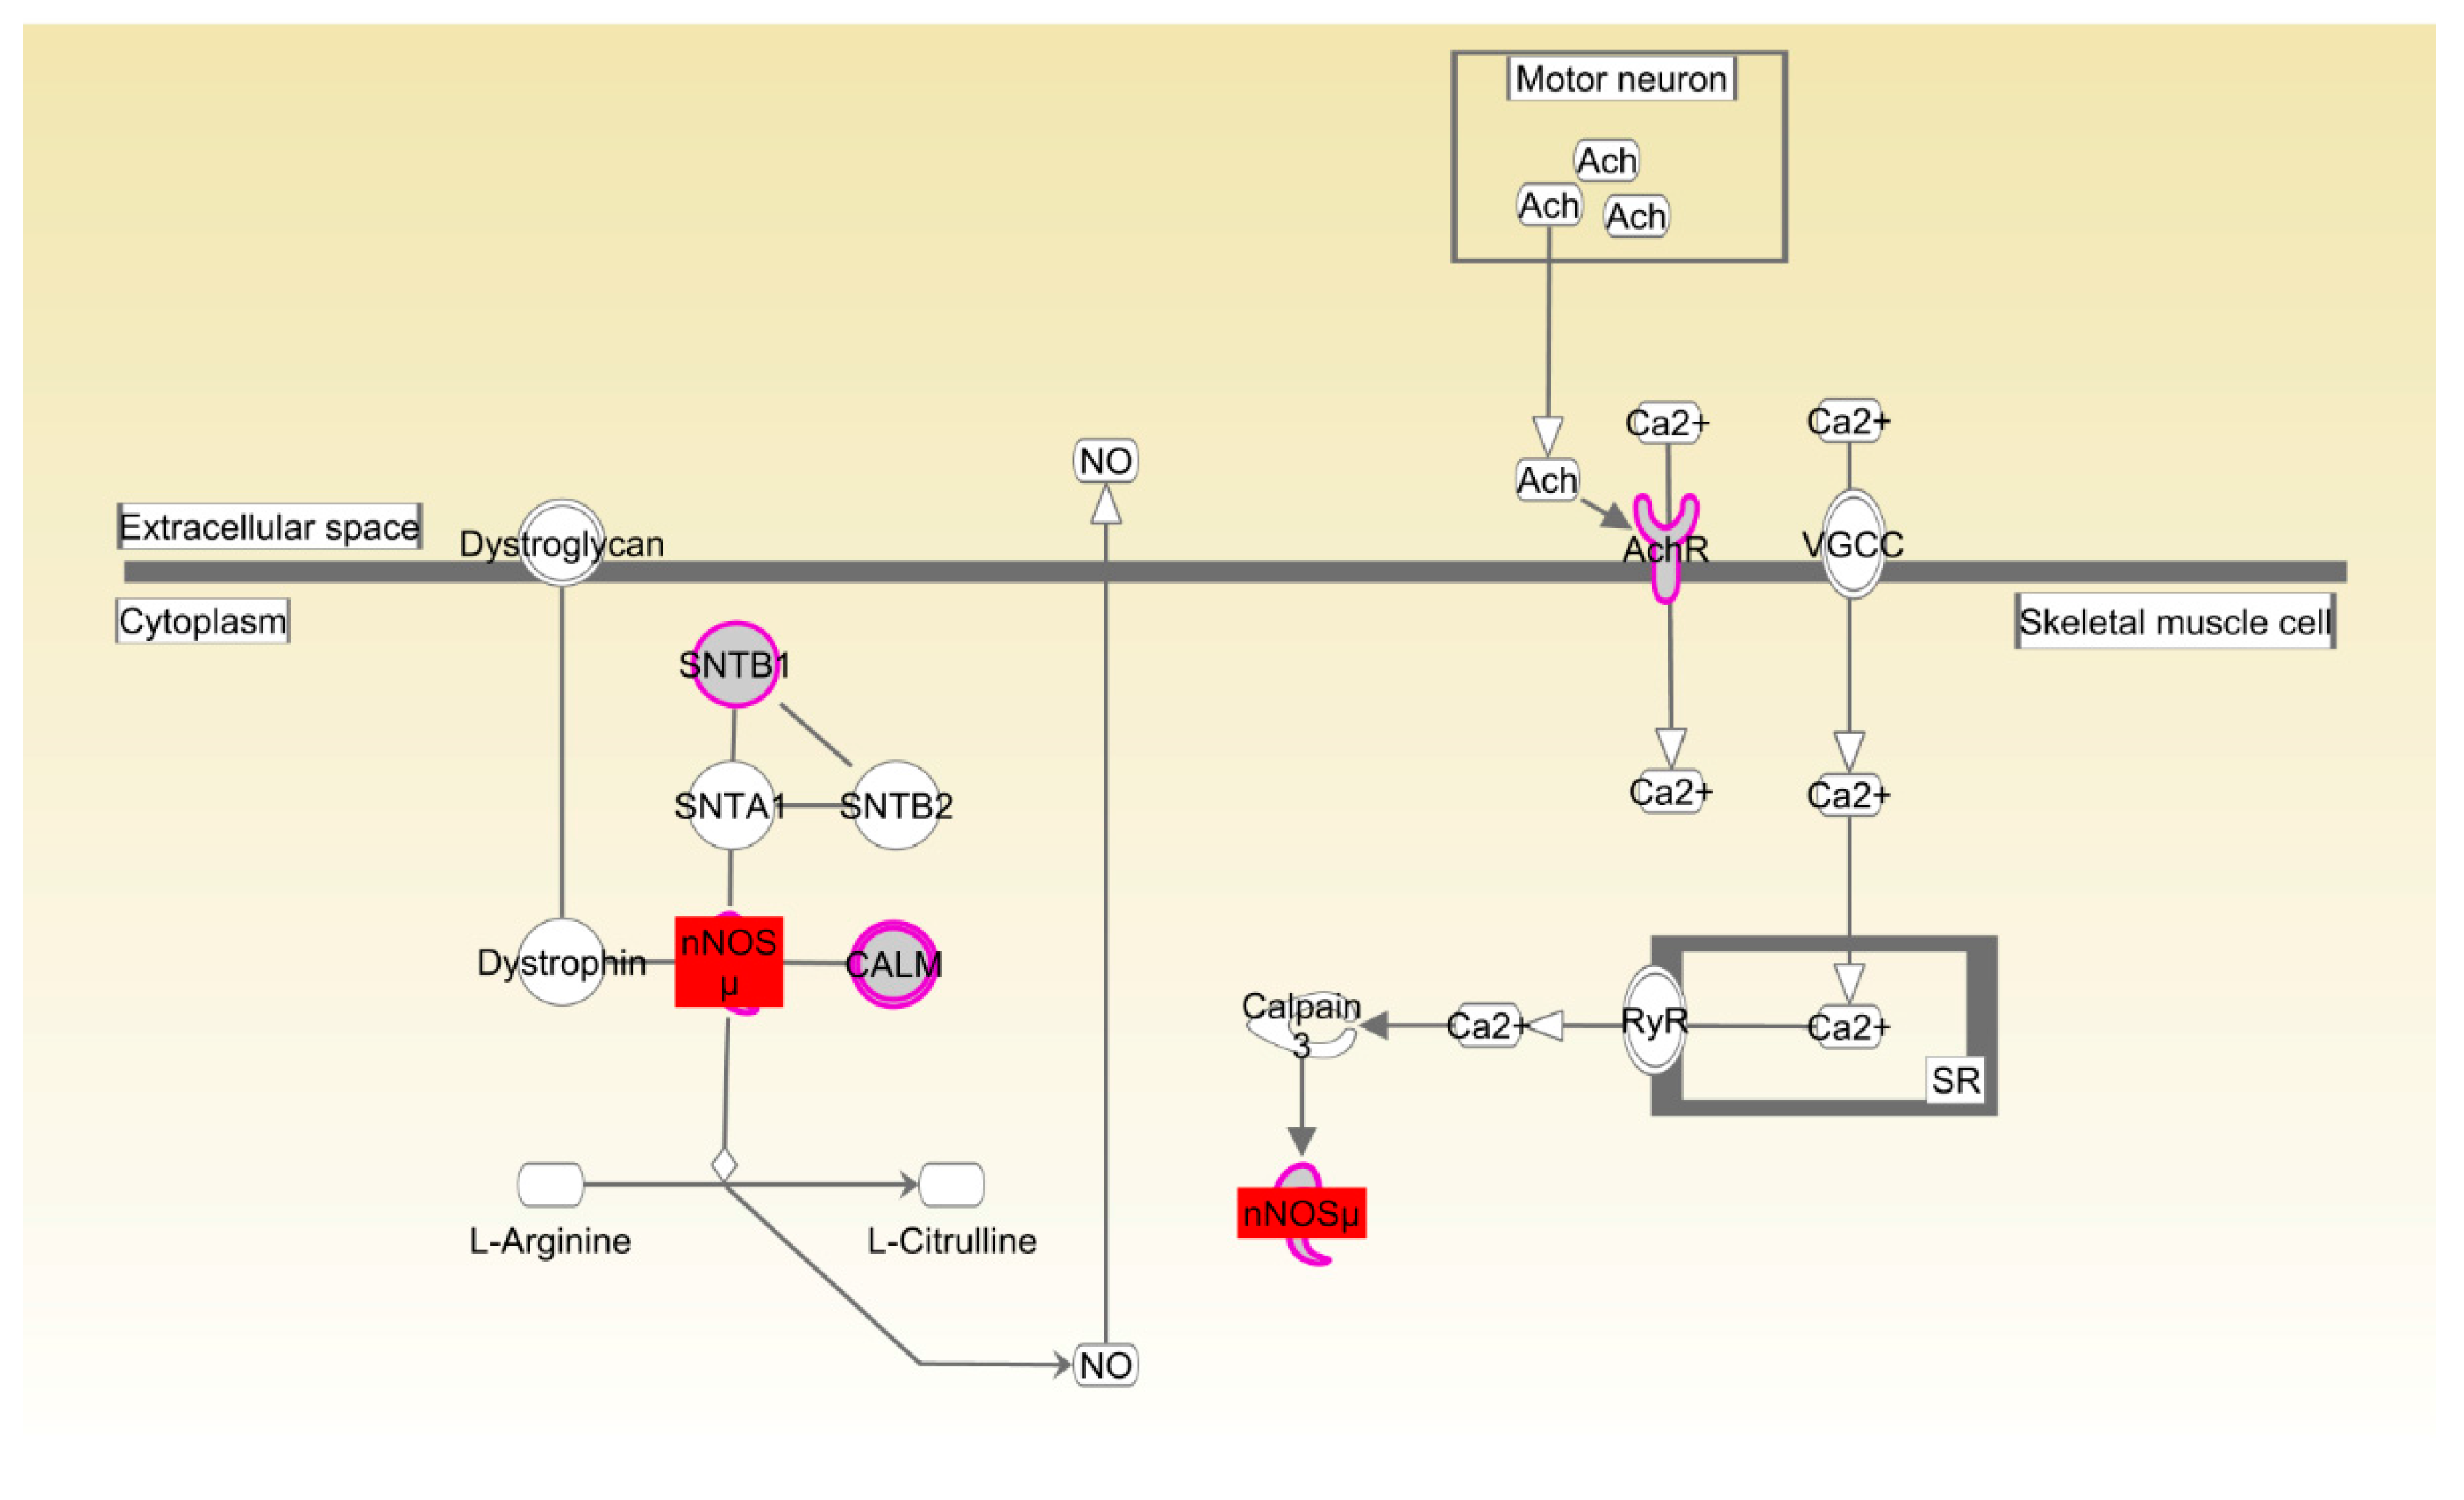
Table S8), suggesting that the development and function of the skeletal and muscular systems might control efficient conversion of dietary nutrients to lean tissue and growth. The canonical pathways that participated in the organismal development were also enriched in both Beijing-You and Cobb breeds. nNOS plays an important role in the regulation of many muscle functions, such as blood flow, contraction and metabolism [36]. For example, nitric oxide (NO), which is physiologically synthesized in a tightly-controlled manner by NO synthases (NOSs), directly inhibits mitochondrial respiration by interfering with electron transport chain complexes, which consequently affects skeletal muscle metabolism and stimulates glucose transport by activating upstream signaling that leads to increased production of GLUT4 [
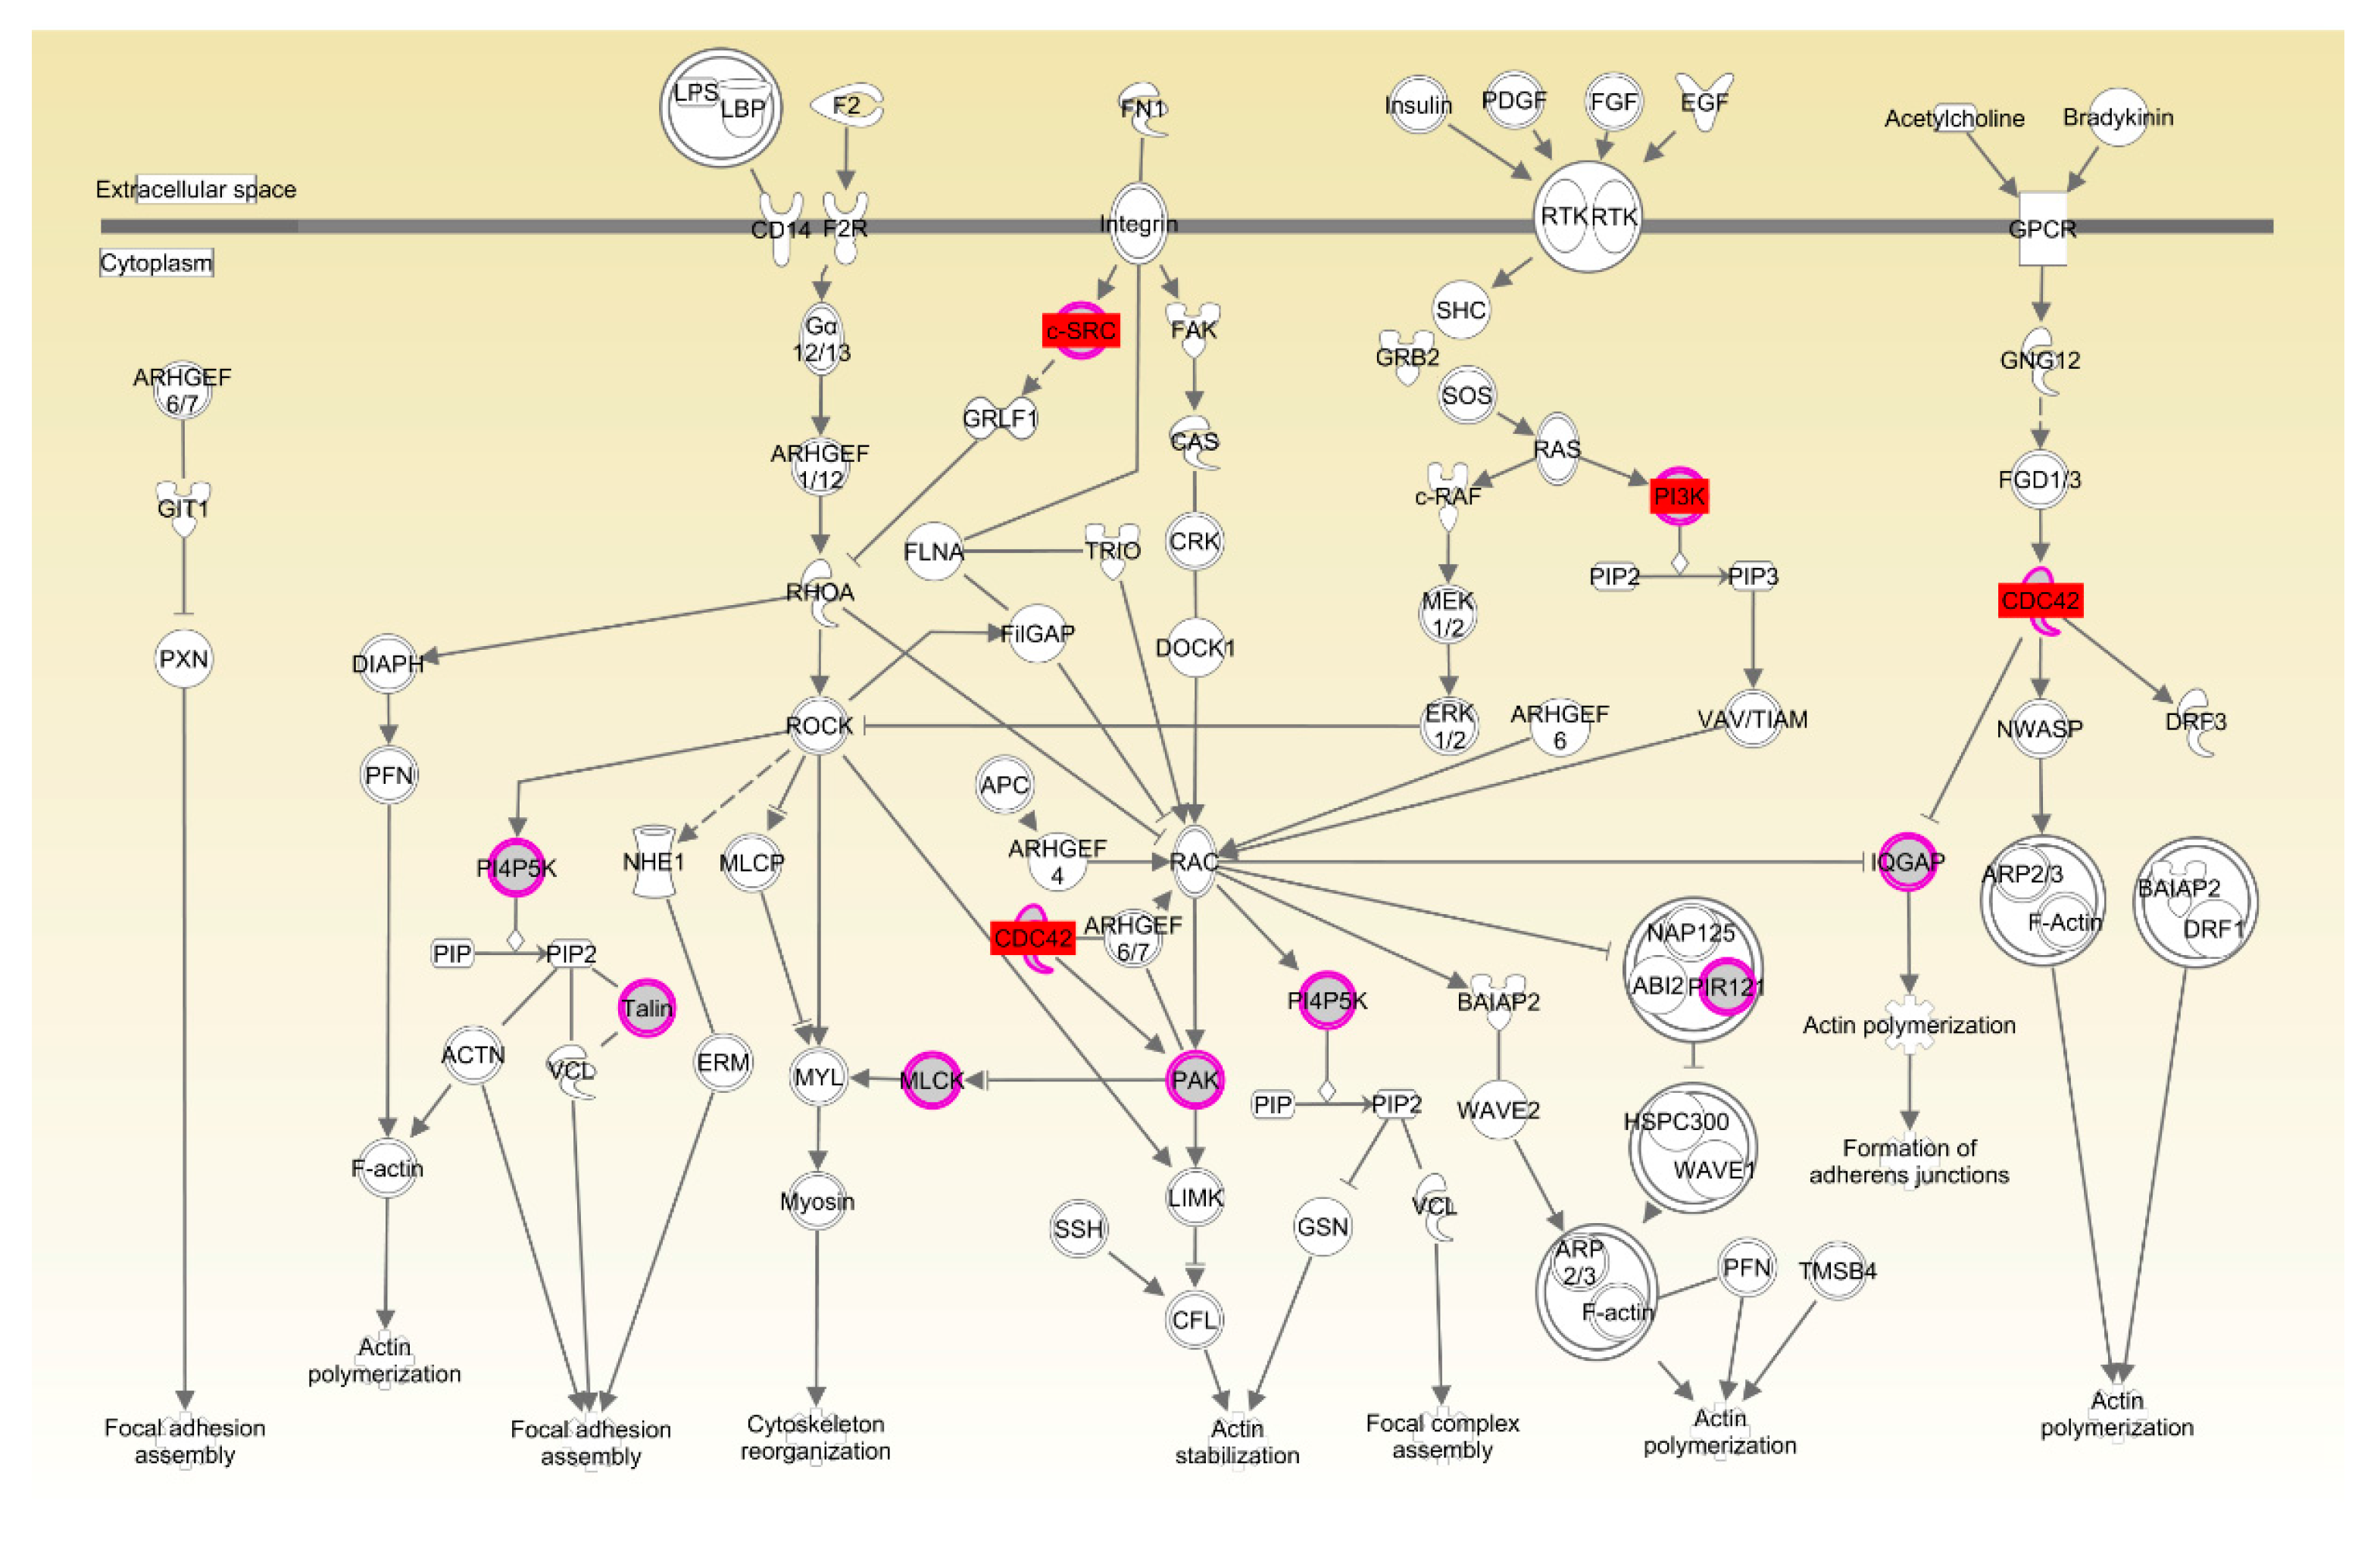
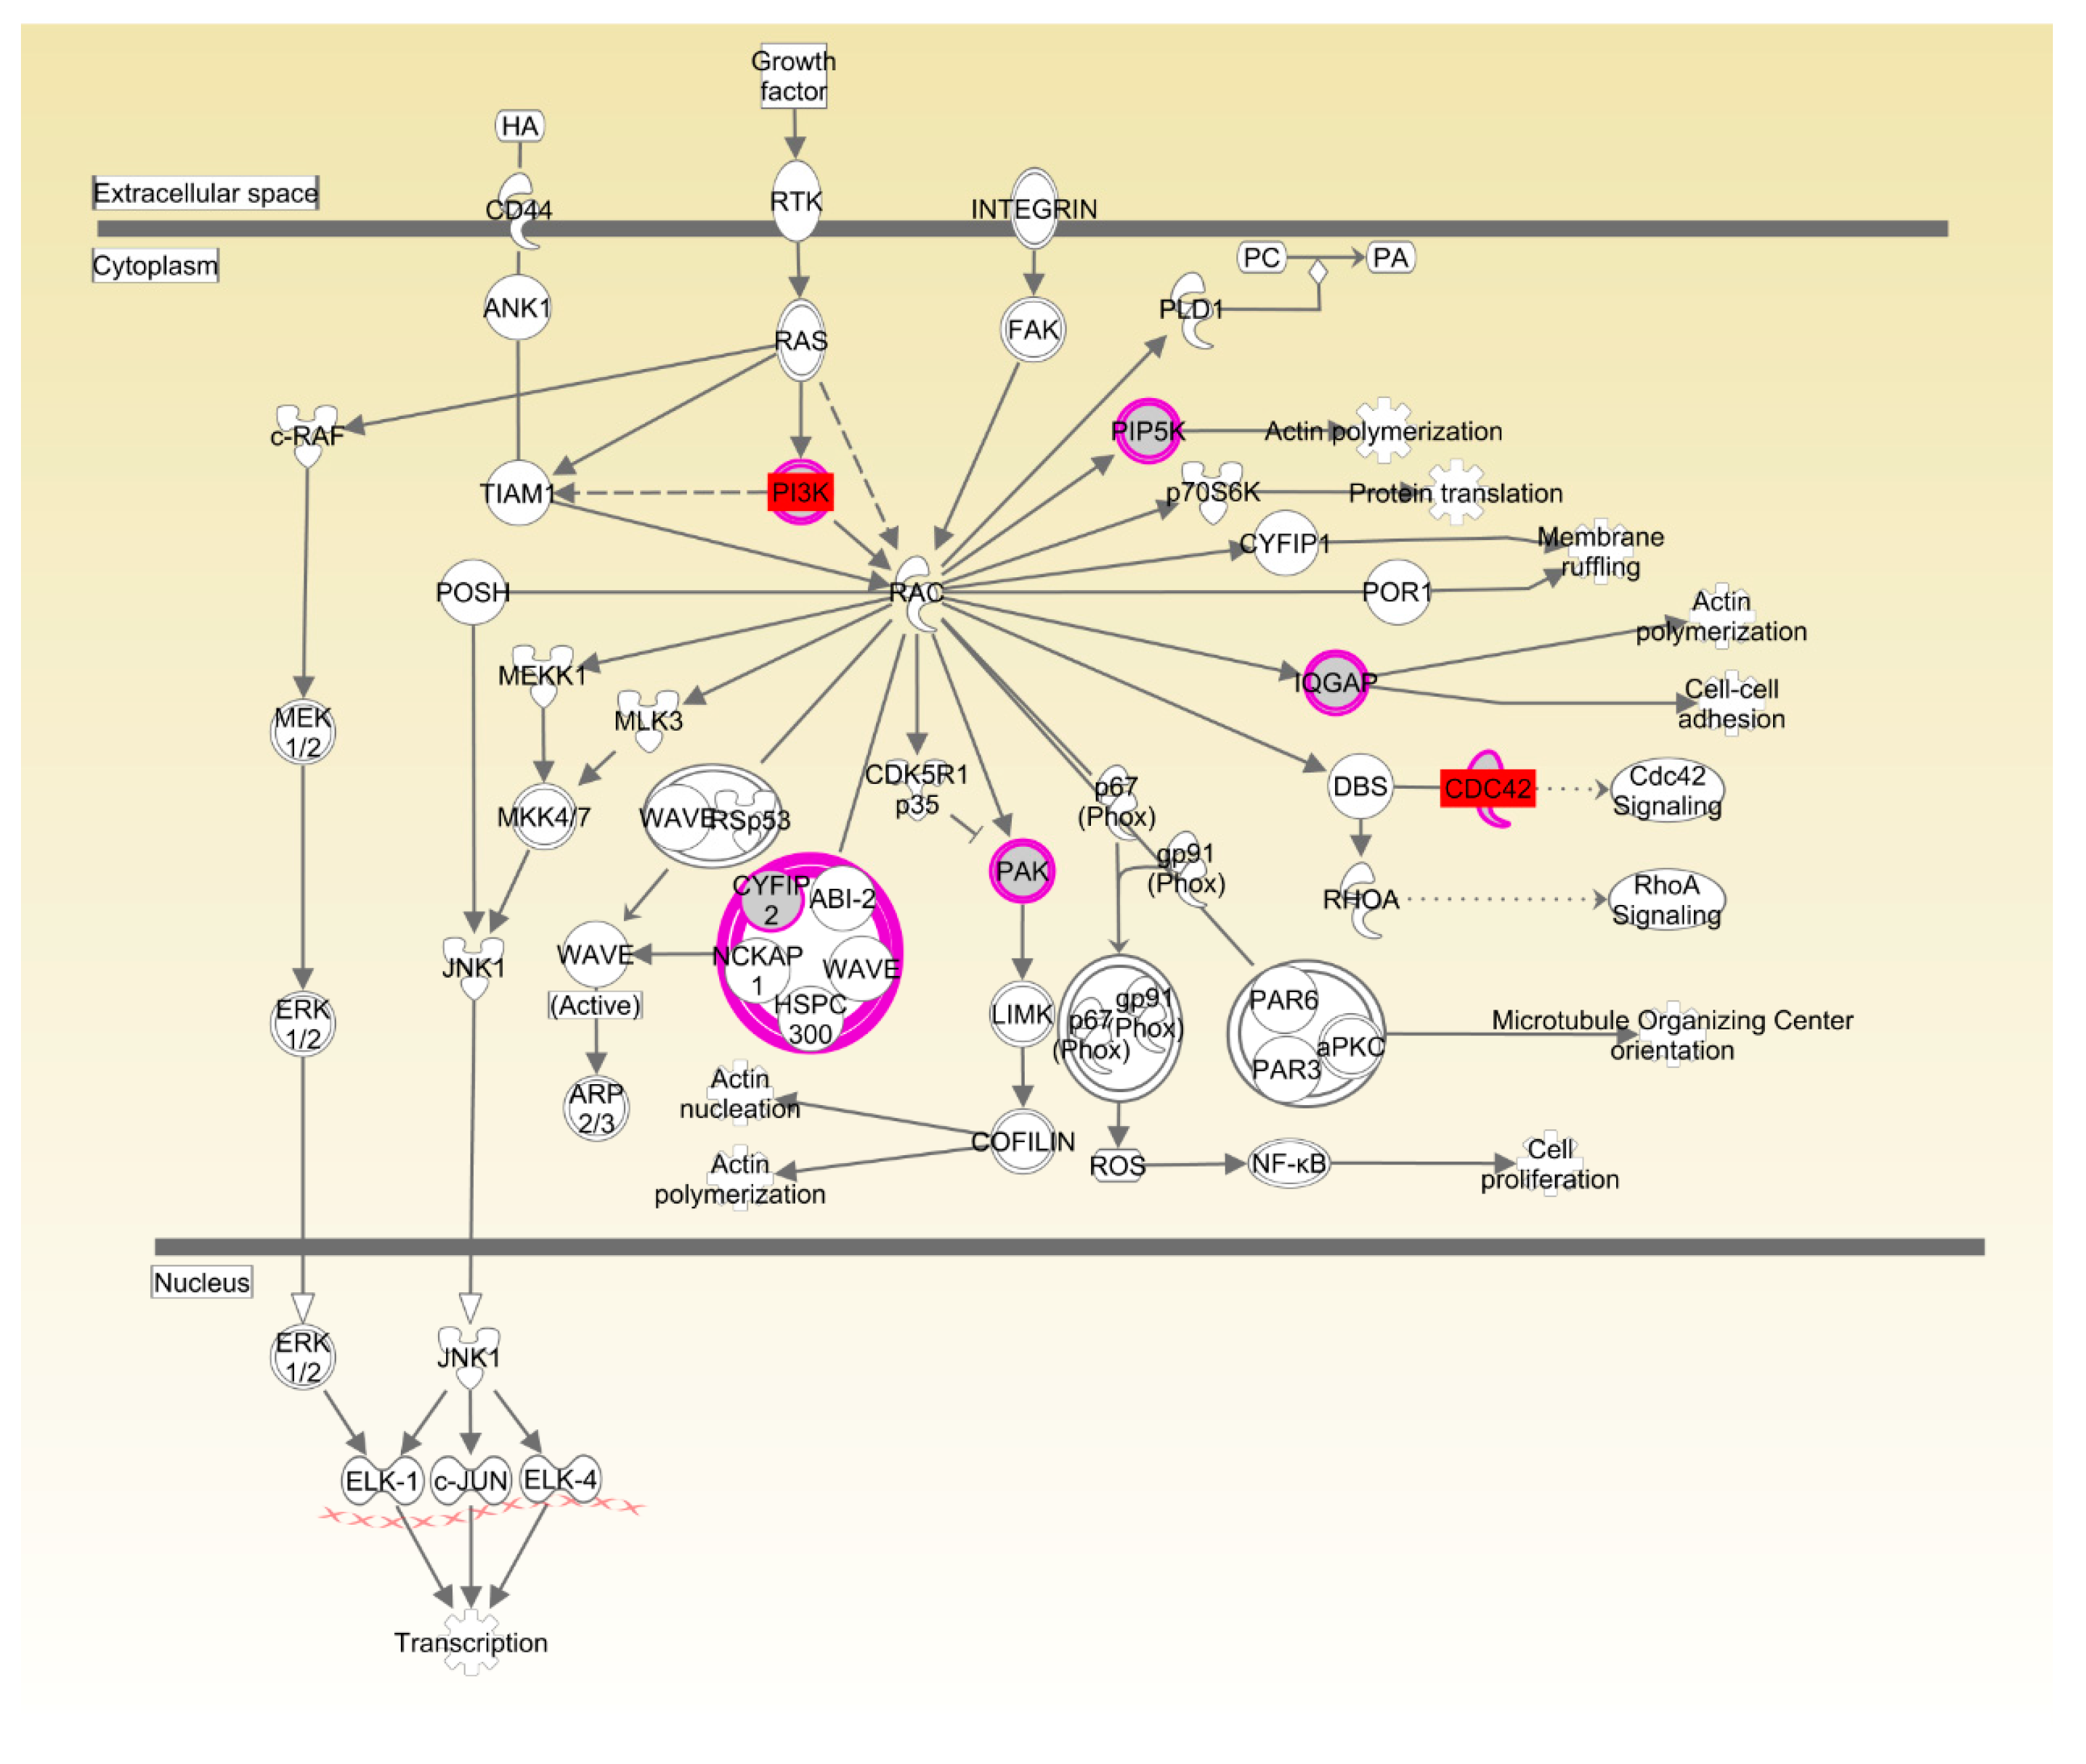
37]. Rac and actin cytoskeleton signaling has been identified in various morphogenetic events associated with tissue organization during organ development. For instance, the conserved role of paxillin in promoting signals from RAC to the actin cytoskeleton is crucial for normal tissue morphogenesis during wing and leg development of Drosophila [38]. Ras-related C3 botulinum toxin substrate 1 (Rac1) and Cell division control protein 42 homolog (CDC42) have also been implicated in neural development and myogenesis [39]. CSK-1 was also essential in the organization of pharyngeal muscle filaments [40]. In the present study, expression in muscle of CDC42, CSK and PIK3R was significantly upregulated in LRFI chickens, as compared to HRFI chickens. Therefore, all of these results showed that although there were small breed differences in the participating pathways, organismal development as the common physiological process contributed to the RFI in the two breeds.
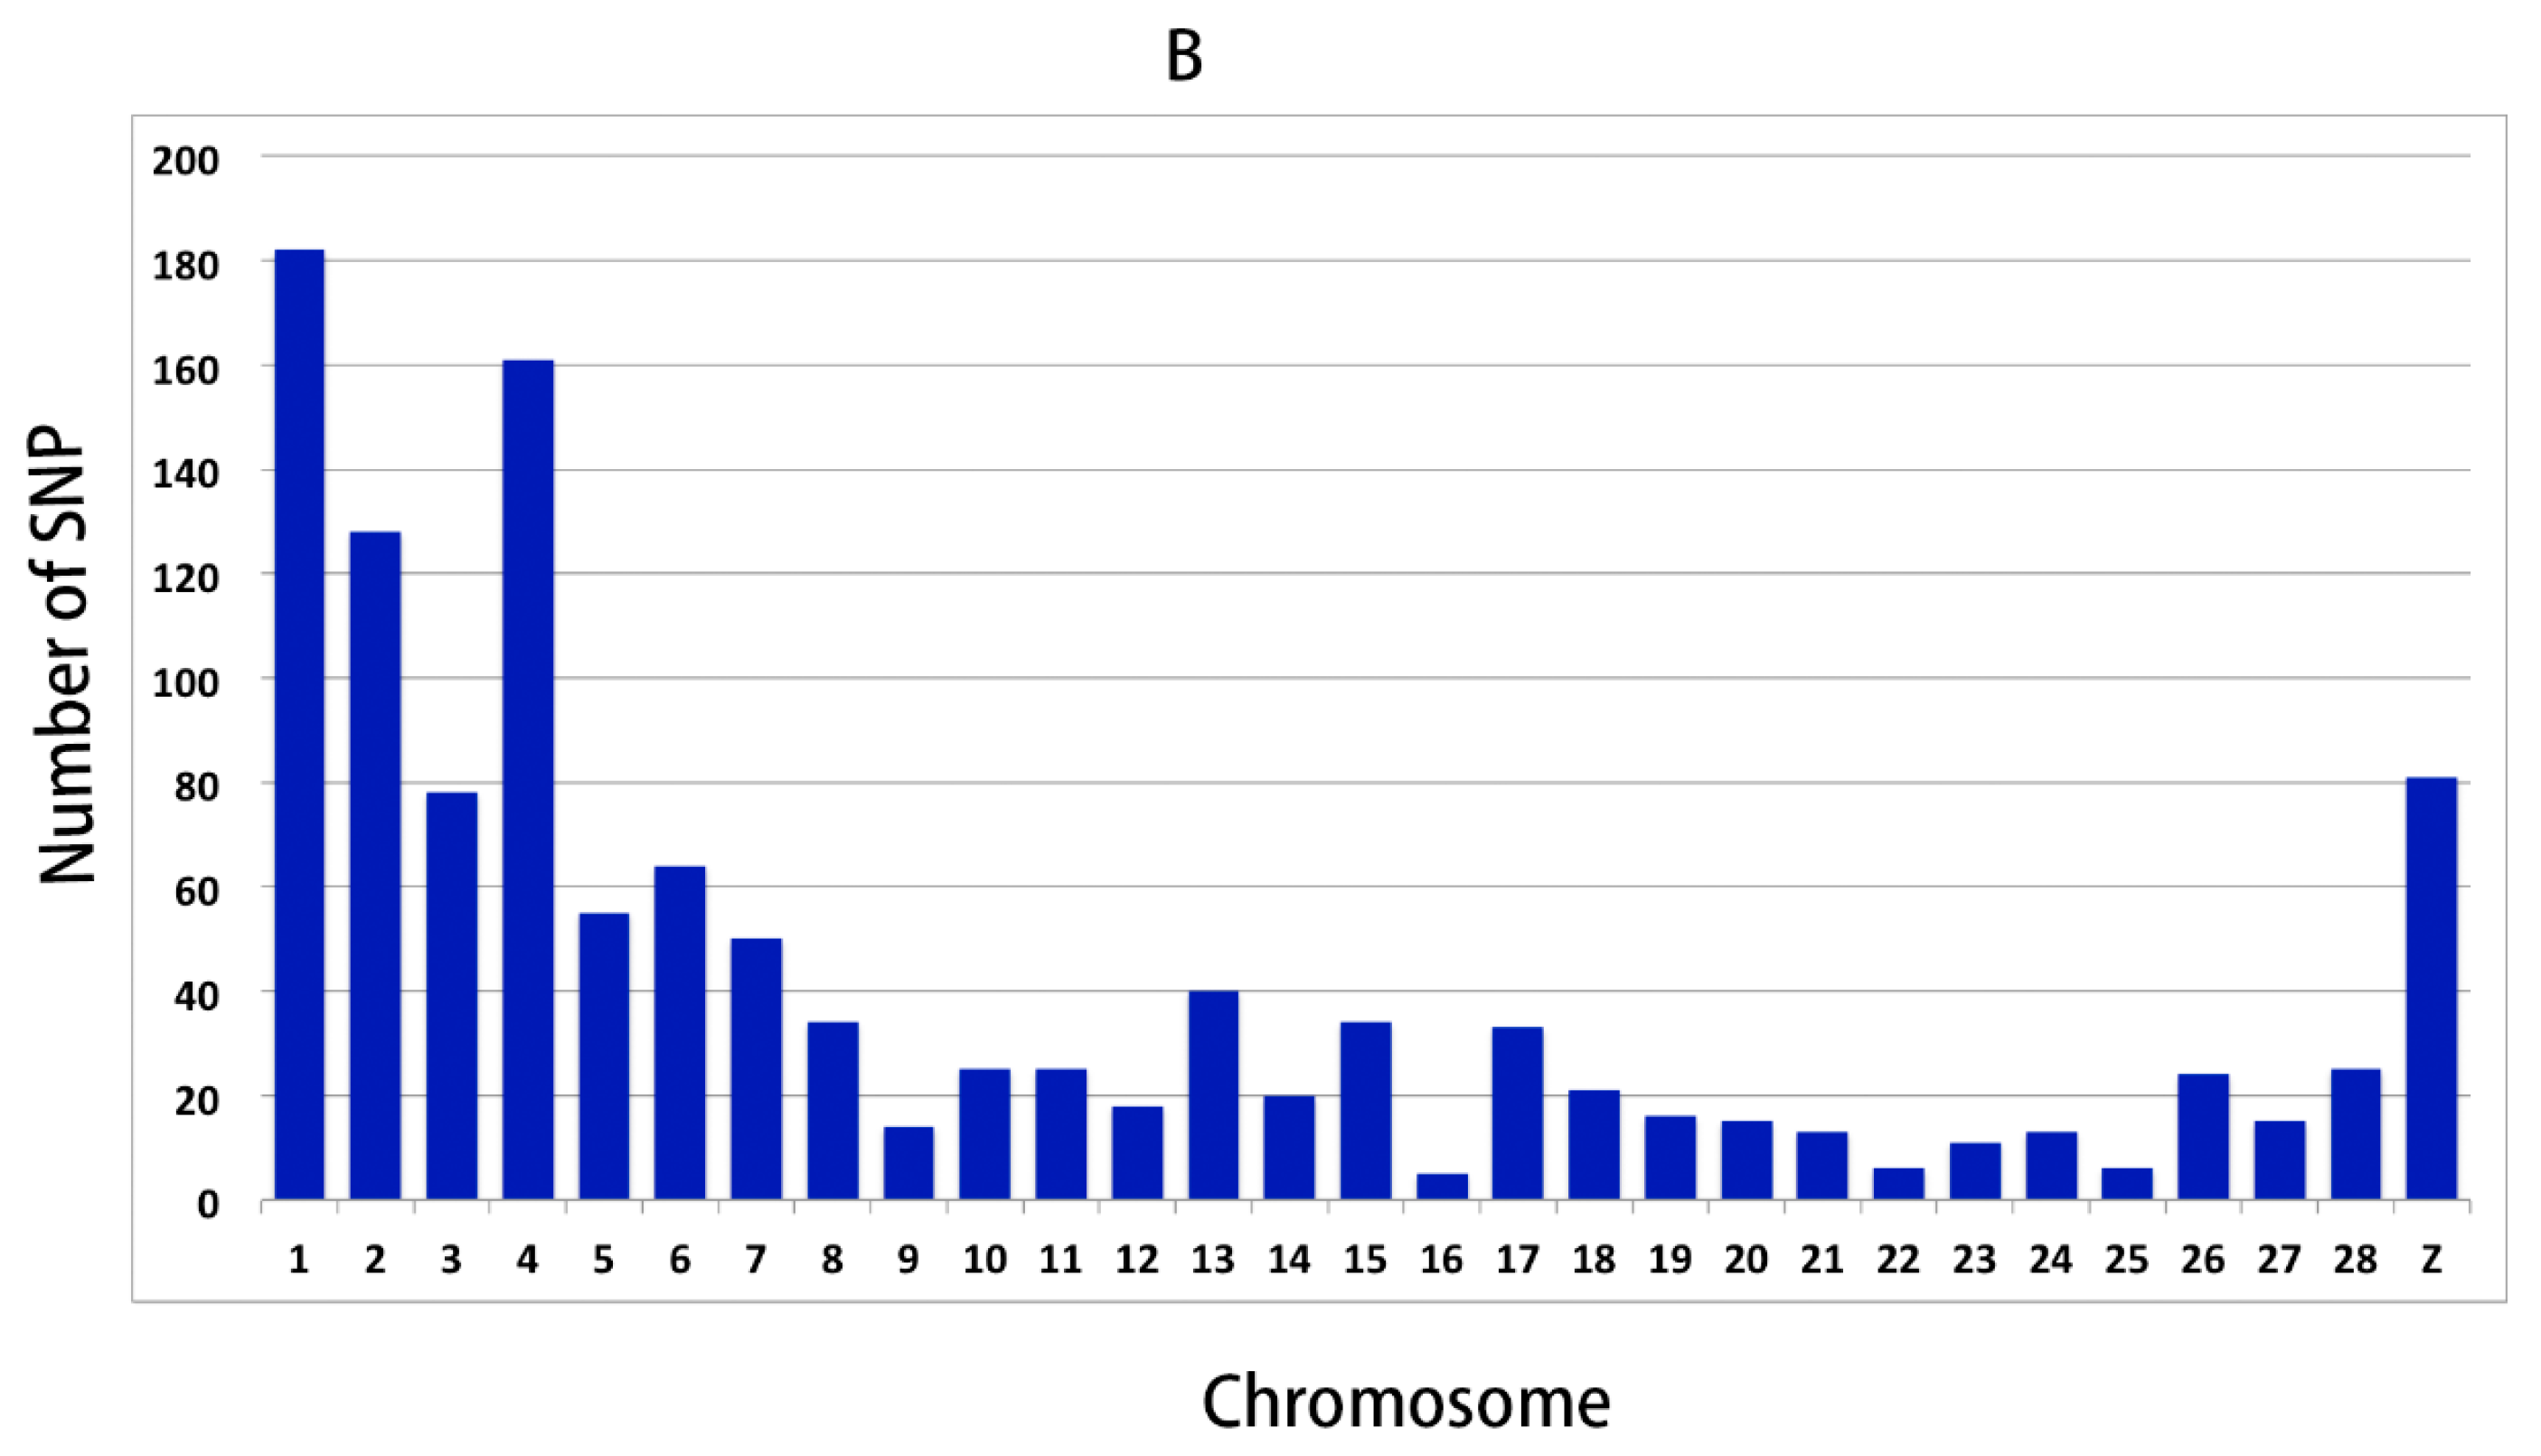
In order to further validate the reliability of the WGS results, 191 SNPs were selected for genotyping and association analysis. The results showed that there were 46 SNPs (48 genes) significantly associated with the RFI, which demonstrated that the WGS result was reliable, and these SNPs could prove to be interesting markers for RFI.

5. Conclusions

The present study provides novel insights into genomic variants related to RFI in two very distinct breeds of chicken. A total of 3746 reliable SNPs included in 1137 genes in Beijing-You chickens and 448 genes with 575 SNPs in Cobb chickens were identified as significant variant markers associated with RFI. Forty-six SNPs were significantly associated with the RFI in an independent population of 779 Cobb chickens, suggesting that the method of screening the associated SNP with WGS strategy was reasonable. Lipid and carbohydrate metabolism and the PTEN signaling pathway were enriched in the Beijing-You, while feed behavior and the CREB signaling pathway were enriched in Cobb chickens. Organismal development as the common physiological process was enriched in the two breeds. NOS1, PHKG1, NEU3 and PIP5K1B were differentially expressed in Beijing-You, while CDC42, CSK, PIK3R3, CAMK4 and PLCB4 were differentially expressed in Cobb, suggesting that these might be key genes that contribute to RFI. This present study, with chickens of very distinct backgrounds and characteristics, offers important knowledge of biomarkers, candidate genes and potential biological pathways underlying RFI.

Supplementary Materials

The following are available online at https://www.mdpi.com/2073-4425/9/2/57/s1. Table S1. Primer information used in amplification for Sanger sequencing (DOCX). Table S2. Oligonucleotide PCR primers (DOCX). Table S3. Results of whole genome sequencing and assembly (DOCX). Table S4. Candidate SNPs related to RFI in Beijing-You chickens (XLSX). Table S5. Candidate SNPs related to RFI in Cobb chickens (XLSX). Table S6. Verification of nine SNPs using PCR analysis and Sanger sequencing (DOCX). Table S7. The result of the association analysis between RFI and candidate SNPs (XLSX). Table S8. Carcass traits of the Beijing-You chickens used for sequencing (DOCX). Figure S1. Lipid and carbohydrate metabolism networks in Beijing-You chickens (DOCX).

Acknowledgments

We acknowledge W. Bruce Currie (Emeritus Professor, Cornell University, USA) for his valuable comments and language editing. We acknowledge Guangdong Xinguang Nongmu Co., Ltd. (Foshan, China), for their selfless offering of Cobb chickens. The research was supported by grants from the National Nonprofit Institute Research Grant (Y2016JC28; 2017ywf-zd-2), the China Agricultural Science and Technology Innovation Project (ASTIP-IAS04; ASTIP-IAS-TS-15) and the earmarked fund for the modern agro-industry technology research system (CARS-42).

Author Contributions

J.L., R.L., G.Z. and J.Wen conceived of and designed the experiments. J.L., R.L., Y.Z., J.Wa., M.Z., H.C., Q.L., P.L. and X.C. performed the experiments. J.L., R.L., S.X., W.L. and J.Wa. analyzed the data. J.L. and R.L. wrote the paper.

Conflicts of Interest

The authors declare no conflict of interest.

References

  1. Ong, S.E. Whole proteomes as internal standards in quantitative proteomics. Genome Med. 2010, 2, 1–4. [Google Scholar] [CrossRef] [PubMed]
  2. Koch, R.M.; Swiger, L.A.; Chambers, D.; Gregory, K.E. Efficiency of feed use in beef cattle. J. Anim. Sci. 1963, 22, 486–494. [Google Scholar] [CrossRef]
  3. Lee, J. Molecular Basis of Feed Efficiency in Meat-Type Chickens. Ph.D. Thesis, University of Georgia, Athens, GA, USA, 2012. [Google Scholar]
  4. Do, D.N.; Ostersen, T.; Strathe, A.B.; Mark, T.; Jensen, J.; Kadarmideen, H.N. Genome-wide association and systems genetic analyses of residual feed intake, daily feed consumption, backfat and weight gain in pigs. BMC Genet. 2014, 15, 27. [Google Scholar] [CrossRef] [PubMed]
  5. Tizioto, P.C.; Coutinho, L.L.; Decker, J.E.; Schnabel, R.D.; Rosa, K.O.; Oliveira, P.S.N.; Souza, M.M.; Mourao, G.B.; Tullio, R.R.; Chaves, A.S.; et al. Global liver gene expression differences in nelore steers with divergent residual feed intake phenotypes. BMC Genom. 2015, 16, 242. [Google Scholar] [CrossRef] [PubMed] [Green Version]
  6. Jing, L.; Hou, Y.; Wu, H.; Miao, Y.X.; Li, X.Y.; Cao, J.H.; Brameld, J.M.; Parr, T.; Zhao, S.H. Transcriptome analysis of mrna and mirna in skeletal muscle indicates an important network for differential residual feed intake in pigs. Sci. Rep. 2015, 5. [Google Scholar] [CrossRef] [PubMed]
  7. Yi, G.Q.; Yuan, J.W.; Bi, H.J.; Yan, W.; Yang, N.; Qu, L.J. In-depth duodenal transcriptome survey in chickens with divergent feed efficiency using rna-seq. PLoS ONE 2015, 10, e0136765. [Google Scholar] [CrossRef] [PubMed]
  8. Xu, Z.; Ji, C.; Zhang, Y.; Zhang, Z.; Nie, Q.; Xu, J.; Zhang, D.; Zhang, X. Combination analysis of genome-wide association and transcriptome sequencing of residual feed intake in quality chickens. BMC Genom. 2016, 17, 594. [Google Scholar] [CrossRef] [PubMed]
  9. Santana, M.H.A.; Utsunomiya, Y.T.; Neves, H.H.R.; Gomes, R.C.; Garcia, J.F.; Fukumasu, H.; Silva, S.L.; Oliveira, G.A.; Alexandre, P.A.; Leme, P.R.; et al. Genome-wide association analysis of feed intake and residual feed intake in nellore cattle. BMC Genet. 2014, 15, 21. [Google Scholar] [CrossRef] [PubMed] [Green Version]
  10. Cui, H.X.; Liu, R.R.; Zhao, G.P.; Zheng, M.Q.; Chen, J.L.; Wen, J. Identification of differentially expressed genes and pathways for intramuscular fat deposition in pectoralis major tissues of fast-and slow-growing chickens. BMC Genom. 2012, 13, 213. [Google Scholar] [CrossRef] [PubMed]
  11. Li, H.; Durbin, R. Fast and accurate short read alignment with burrows–wheeler transform. Bioinformatics 2009, 25, 1754–1760. [Google Scholar] [CrossRef] [PubMed]
  12. Li, H.; Handsaker, B.; Wysoker, A.; Fennell, T.; Ruan, J.; Homer, N.; Marth, G.; Abecasis, G.; Durbin, R. The sequence alignment-map format and samtools. Bioinformatics 2009, 25, 2078–2079. [Google Scholar] [CrossRef] [PubMed]
  13. Koboldt, D.C.; Chen, K.; Wylie, T.; Larson, D.E.; Mclellan, M.D.; Mardis, E.R.; Weinstock, G.M.; Wilson, R.K.; Ding, L. Varscan: Variant detection in massively parallel sequencing of individual and pooled samples. Bioinformatics 2009, 25, 2283–2285. [Google Scholar] [CrossRef] [PubMed]
  14. Gilmour, A.R.; Gogel, B.J.; Cullis, B.R. Asreml User Guide Release 2.0; Vsn International Ltd.: Hemel Hempstead, UK, 2006. [Google Scholar]
  15. R Core team. R: A language and environment for statistical computing. Computing 2014, 14, 12–21. [Google Scholar]
  16. Sheppard, K.; Kinross, K.M.; Solomon, B.; Pearson, R.B.; Phillips, W.A. Targeting PI3 kinase/AKT/mTOR signaling in cancer. Crit. Rev. Oncog. 2012, 17, 69–95. [Google Scholar] [CrossRef] [PubMed]
  17. Matsuda, S.; Kobayashi, M.; Kitagishi, Y. Roles for PI3k/AKT/PTEN pathway in cell signaling of nonalcoholic fatty liver disease. ISRN Endocrinol. 2012, 2013. [Google Scholar] [CrossRef] [PubMed]
  18. Jackel-Cram, C.; Qiao, L.; Xiang, Z.; Brownlie, R.; Zhou, Y.; Babiuk, L.; Liu, Q. Hepatitis C virus genotype-3a core protein enhances sterol regulatory element-binding protein-1 activity through the phosphoinositide 3-kinase-Akt-2 pathway. J. Gen. Virol. 2010, 91, 1388–1395. [Google Scholar] [CrossRef] [PubMed]
  19. Han, C.; Wei, S.; He, F.; Liu, D.; Wan, H.; Liu, H.; Li, L.; Xu, H.; Du, X.; Xu, F. The regulation of lipid deposition by insulin in goose liver cells is mediated by the PI3k-AKT-mTOR signaling pathway. PLoS ONE 2015, 10, e0098759. [Google Scholar] [CrossRef] [PubMed]
  20. Hodakoski, C.; Hopkins, B.D.; Barrows, D.; Mense, S.M.; Keniry, M.; Anderson, K.E.; Kern, P.A.; Hawkins, P.T.; Stephens, L.R.; Parsons, R. Regulation of PTEN inhibition by the pleckstrin homology domain of P-REX2 during insulin signaling and glucose homeostasis. Proc. Natl. Acad. Sci. USA 2014, 111, 155–160. [Google Scholar] [CrossRef] [PubMed]
  21. Nakanishi, M.; Hata, K.; Nagayama, T.; Sakurai, T.; Nishisho, T.; Wakabayashi, H.; Hiraga, T.; Ebisu, S.; Yoneda, T. Acid activation of Trpv1 leads to an up-regulation of calcitonin gene-related peptide expression in dorsal root ganglion neurons via the Camk-CREB cascade: A potential mechanism of inflammatory pain. Mol. Biol. Cell 2010, 21, 2568–2577. [Google Scholar] [CrossRef] [PubMed]
  22. Ono, H.; Katagiri, H.; Funaki, M.; Anai, M.; Inukai, K.; Fukushima, Y.; Sakoda, H.; Ogihara, T.; Onishi, Y.; Fujishiro, M. Regulation of phosphoinositide metabolism, AKT phosphorylation, and glucose transport by PTEN (phosphatase and tensin homolog deleted on chromosome 10) in 3T3-L1 adipocytes. Mol. Endocrinol. 2001, 15, 1411–1422. [Google Scholar] [CrossRef] [PubMed]
  23. Lo, Y.T.; Tsao, C.J.; Liu, I.M.; Liou, S.S.; Cheng, J.T. Increase of PTEN gene expression in insulin resistance. Horm. Metab. Res. 2004, 36, 662–666. [Google Scholar] [CrossRef] [PubMed]
  24. Hosaka, T.; Biggs, W.H.; Tieu, D.; Boyer, A.D.; Varki, N.M.; Cavenee, W.K.; Arden, K.C. Disruption of forkhead transcription factor (FOXO) family members in mice reveals their functional diversification. Proc. Natl. Acad. Sci. USA 2004, 101, 2975–2980. [Google Scholar] [CrossRef] [PubMed]
  25. Matsumoto, M.; Han, S.; Kitamura, T.; Accili, D. Dual role of transcription factor FOXO1 in controlling hepatic insulin sensitivity and lipid metabolism. J. Clin. Investig. 2006, 116, 2464–2472. [Google Scholar] [CrossRef] [PubMed]
  26. Hossain, M.U.; Abu Zaffar Shibly, T.M.; Omar, F.T.Z.; Santona, U.S.; Hossain, M.J.; Khoka, M.S.H.; Keya, C.A.; Salimullah, M. Towards finding the linkage between metabolic and age-related disorders using semantic gene data network analysis. Bioinformation 2016, 12, 22. [Google Scholar] [CrossRef] [PubMed]
  27. Nath, A.; Chan, C. Genetic alterations in fatty acid transport and metabolism genes are associated with metastatic progression and poor prognosis of human cancers. Sci. Rep. 2016, 6, 18669. [Google Scholar] [CrossRef] [PubMed]
  28. Macfarlane, S.; Quigley, M.; Hopkins, M.; Newton, D.F.; Macfarlane, G. Polysaccharide degradation by human intestinal bacteria during growth under multi-substrate limiting conditions in a three-stage continuous culture system. FEMS Microbiol. Ecol. 1998, 26, 231–243. [Google Scholar] [CrossRef]
  29. Grubbs, J.K. Protein Profile and Reactive Oxygen Species Production in Mitochondria from Pigs Divergently Selected for Residual Feed Intake. Ph.D. Thesis, Iowa State University, Ames, IA, USA, 2012. [Google Scholar]
  30. Zhao, G.P.; Cui, H.X.; Liu, R.R.; Zheng, M.Q.; Chen, J.L.; Wen, J. Comparison of breast muscle meat quality in 2 broiler breeds. Poult. Sci. 2011, 90, 2355. [Google Scholar] [CrossRef] [PubMed]
  31. Altarejos, J.Y.; Goebel, N.; Conkright, M.D.; Inoue, H.; Xie, J.; Arias, C.M.; Sawchenko, P.E.; Montminy, M. The CREB1 coactivator CRTC1 is required for energy balance and fertility. Nat. Med. 2008, 14, 1112–1117. [Google Scholar] [CrossRef] [PubMed]
  32. Sheriff, S.; Chance, W.T.; Fischer, J.E.; Balasubramaniam, A. Neuropeptide Y treatment and food deprivation increase cyclic AMP response element-binding in rat hypothalamus. Mol. Pharmacol. 1997, 51, 597–604. [Google Scholar] [CrossRef] [PubMed]
  33. Mayr, B.; Montminy, M. Transcriptional regulation by the phosphorylation-dependent factor CREB. Nat. Rev. Mol. Cell Biol. 2001, 2, 599–609. [Google Scholar] [CrossRef] [PubMed]
  34. Herd, R.M.; Oddy, V.H.; Richardson, E.C. Biological basis for variation in residual feed intake in beef cattle. 1. Review of potential mechanisms. Aust. J. Exp. Agric. 2004, 44, 423–430. [Google Scholar] [CrossRef]
  35. Zhou, N.; Lee, W.R.; Abasht, B. Messenger RNA sequencing and pathway analysis provide novel insights into the biological basis of chickens’ feed efficiency. BMC Genom. 2015, 16, 195. [Google Scholar] [CrossRef] [PubMed]
  36. Suhr, F.; Gehlert, S.; Grau, M.; Bloch, W. Skeletal muscle function during exercise—Fine-tuning of diverse subsystems by nitric oxide. Int. J. Mol. Sci. 2013, 14, 7109–7139. [Google Scholar] [CrossRef] [PubMed]
  37. Etgen, G.J.; Fryburg, D.A.; Gibbs, E.M. Nitric oxide stimulates skeletal muscle glucose transport through a calcium/contraction- and phosphatidylinositol-3-kinase-independent pathway. Diabetes 1997, 46, 1915–1919. [Google Scholar] [CrossRef] [PubMed]
  38. Chen, G.C.; Turano, B.; Ruest, P.J.; Hagel, M.; Settleman, J.; Thomas, S.M. Regulation of Rho and Rac signaling to the actin cytoskeleton by paxillin during Drosophila development. Mol. Cell. Biol. 2005, 25, 979–987. [Google Scholar] [CrossRef] [PubMed]
  39. Luo, L.; Liao, Y.J.; Jan, L.Y.; Jan, Y.N. Distinct morphogenetic functions of similar small GTPases: Drosophila Drac1 is involved in axonal outgrowth and myoblast fusion. Genes Dev. 1994, 8, 1787–1802. [Google Scholar] [CrossRef] [PubMed]
  40. Takata, N.; Itoh, B.; Misaki, K.; Hirose, T.; Yonemura, S.; Okada, M. Non-receptor tyrosine kinase CSK-1 controls pharyngeal muscle organization in Caenorhabditis elegans. Genes Cells 2009, 14, 381–393. [Google Scholar] [CrossRef] [PubMed]
Figure 1. Distribution of SNPs with FST values in the top 5% in Beijing-You (Upper) and Cobb (Lower). More significant SNPs were enriched on Gallus gallus chromosome 1 (GGA1), GGA2, GGA4 and GGA Z in Beijing-You, while more significant SNPs were enriched on GGA1, GGA2, GGA3, GGA4 and GGA Z in Cobb.
Genes 09 00057 g001
Figure 2. Distribution of SNPs obtained after filtering across chromosomes. There were 6288 and 1001 SNPs in Beijing-You (A) and Cobb (B) breeds, respectively.
Genes 09 00057 g002aGenes 09 00057 g002b
Figure 3. Categorization of the candidate SNPs in Beijing-You (A) and Cobb (B) chickens.
Genes 09 00057 g003
Figure 4. Phosphatase and tensin homolog (PTEN) signaling pathway enriched in Beijing-You chickens. Pink symbols show the genes found in the current study, while white symbols indicate genes that are functionally associated.
Genes 09 00057 g004
Figure 5. The expression level of genes related to enriched canonical pathways. (A) The differentially-expressed genes related to nNOS signaling in skeletal muscle (NOS1) and PTEN signaling, as well as lipid and carbohydrate metabolism in liver (NEU3, PHKG1, PIP5K1B) of Beijing-You chickens. (B) The differentially expressed genes related to cAMP responsive element binding protein (CREB) signaling in the hypothalamus (CAMK4, FGFR4, PLCB4) and genes related to Rac signaling and actin cytoskeleton signaling in the breast muscle (CDC42, CSK, PIK3R3) of Cobb chickens. Data are means ± standard deviation (SD) (n = 8 per group). Statistical significance was calculated by Student’s t-test; * p < 0.05, ** p < 0.01.
Genes 09 00057 g005
Figure 6. CREB signaling enriched in neurons in Cobb chickens. Pink symbols show the genes found in the current study, while white symbols indicate genes that are functionally associated. The red symbols show the genes that were differentially expressed in hypothalamus.
Genes 09 00057 g006
Figure 7. Numbers of genes near significant SNPs associated with RFI in Beijing-You and Cobb. There were 1137 genes and 448 genes identified in Beijing-You and Cobb, respectively, of which 127 were commonly found in both breeds.
Genes 09 00057 g007
Figure 8. nNOS signaling in the skeletal muscle cell pathway enriched in Beijing-You chickens. Molecular interaction and symbols are the same as the description in Figure 6. The red symbols show the genes that were differentially expressed in breast muscle.
Genes 09 00057 g008
Figure 9. Rac signaling pathway in Cobb chickens. Molecular interaction and symbols are the same as the description in Figure 6. The red symbols show the genes that were differentially expressed in breast muscle.
Genes 09 00057 g009
Figure 10. Actin cytoskeleton signaling pathway in Cobb chickens. Molecular interaction and symbols are the same as the description in Figure 6. The red symbols show the genes that were differentially expressed in breast muscle.
Genes 09 00057 g010
Table 1. The information of the experimental population.
BreedExperimental PopulationFamily No. of the PopulationBirds for High and Low RFI GroupFamily No. of Sub-GroupNo. of DNA PoolsAverage Coverage/Pool
Beijing-You200 males75:153 (males:females)48 HRFI 33:40 (males:females)320×
200 females48 LRFI 35:39 (males:females)320×
Cobb220 males64 (males)48 HRFI 34 (males)320×
48 LRFI28 (males)320×
For Beijing-You chickens, each pool consisted of 8 males and 8 females. For Cobb chickens, each pool consisted of 16 males. HRFI: high residual feed intake; LRFI: low residual feed intake.
Table 2. Performance of Beijing-You and Cobb chickens used for sequencing (n = 48 per group).
BreedMeasurementLRFIHRFIp-Value
Beijing-YouRFI (g)−239.73 ± 74.97300.67 ± 120.98<0.01
DFI (g)88.34 ± 15.11107.28 ± 16.43<0.01
Initial BW (g)820.58 ± 115.79805.15 ± 95.36>0.05
Final BW (g)1364.38 ± 254.891357.27 ± 218.45>0.05
ADG (g)19.42 ± 5.4919.54 ± 4.72>0.05
FCR4.70 ± 0.585.62 ± 0.63<0.01
CobbRFI (g)−93.83 ± 7.29104.09 ± 54.41<0.01
DFI (g)141.12 ± 14.36157.52 ± 6.11<0.01
Initial BW (g)1012.71± 66.781018.92 ± 58.71>0.05
Final BW (g)2109.06 ± 175.072139.08 ± 96.29>0.05
ADG (g)78.31 ± 11.2280.01 ± 5.15>0.05
FCR1.82 ± 0.121.97 ± 0.05<0.01
The significance of differences between LRFI and HRFI birds was determined using Student’s t-test. RFI: residual feed intake; DFI: daily feed intake; ADG: average daily gain over the assessed feeding period; BW: body weight; FCR: feed conversion ratio = DFI/ADG.
Table 3. Top five biological functions enriched in Beijing-You and Cobb chickens.
BreedNamep-ValueNo. Genes
Beijing-YouNervous system development and function2.28 × 10−2–3.54 × 10−7134
Tissue development2.52 × 10−2–3.54 × 10−7269
Connective tissue development and function2.52 × 10−2–2.36 × 10−5116
Skeletal and muscular system development and function2.32 × 10−2–2.36 × 10−5111
Organismal development2.39 × 10−2–1.07 × 10−4254
CobbNervous system development and function2.86 × 10−2–3.27 × 10−469
Tissue morphology2.86 × 10−2–3.27 × 10−447
Behavior2.86 × 10−2–8.17 × 10−49
Connective tissue development and function2.86 × 10−2–8.17 × 10−412
Skeletal and muscular system development and function2.86 × 10−2–8.17 × 10−417
A summary of results from Ingenuity® Pathway Analysis (IPA) software (Ingenuity System Inc., Redwood City, CA, USA). The function in bold was specific for Cobb chickens.
Table 4. Top five canonical pathways enriched in Beijing-You and Cobb.
BreedNamep-ValueOverlap
Beijing-YounNOS signaling in skeletal muscle cells2.18 × 10−344.4%, 4/9
All-trans-decaprenyl diphosphate biosynthesis4.81 × 10−3100.0%, 2/2
PTEN signaling9.73 × 10−314.3%, 13/91
Small cell lung cancer signaling1.09 × 10−215.9%, 10/63
CNTF signaling1.28 × 10−317.4%, 8/46
CobbCREB signaling in neurons3.68 × 10−37.8%, 10/128
T cell receptor signaling6.38 × 10−39.1%, 7/77
Neuropathic pain signaling in dorsal horn neurons1.02 × 10−28.3%, 7/84
Rac signaling1.37 × 10−27.9%, 7/89
Actin cytoskeleton signaling1.42 × 10−28.3%, 7/84
A summary of result from Ingenuity® IPA software. PTEN: phosphatase and tensin homolog; CNTF: ciliary neurotrophic factor; CREB: cAMP responsive element binding protein; Rac: Ras-related C3 botulinum toxin substrate.
Table 5. SNPs significantly associated with residual feed intake (RFI) (p < 0.05) in Cobb chickens.
GGA aSNPPositionp-ValueCandidate/Nearest GeneLocation b
13rs31727026512, 853, 8258.12 × 10−6CANXDownstream
21rs142861556, 350, 6153.06 × 10−5CDC42Intron
2rs31579120823, 470, 4084.36 × 10−5GNG11Intron
13rs31796515910, 726, 3500.000684CYFIP2Intron
2rs31595180256, 946, 1390.001189ATP9BIntron
15-7, 489, 9120.001298MN1Extron
1rs1521348225, 118, 6960.001437TESIntron
Zrs3127144327, 564, 7590.002362FAM219AIntron
1rs14080181468, 4360.003409PPP6R2Intron
1rs31806917525, 124, 8280.003993TESIntron
15rs157756347, 501, 9670.004145MN1Intron
Z-46, 332, 8840.005222STARD4Upstream
15rs3145409627, 528, 8930.005293PITPNBDownstream
1rs315382419130, 499, 0910.005896GABRG3Intron
1rs317493245130, 499, 1000.006448GABRG3Intron
6rs1458883927, 221, 4560.007046CCDC186Intron
18-4, 638, 9320.007055UNC13D, ENSGALG00000002278Downstream
4-66, 157, 8410.008525TXK, TECUpstream
6-20, 250, 6040.008611HHEXDownstream
10rs3161096601, 504, 1590.008684NEOIntron
7rs31648381526, 455, 7360.009332ADCY5Intron
27rs143015311, 697, 2350.011689PSMC5, FTSJ3, ENSGALG00000000293, SMARCD2Upstream, Extron, Downstream, Downstream
7rs1587235626, 615, 2790.015109ADCY5Intron
7rs31523426226, 817, 2530.019031MYLKIntron
Z-6, 813, 6060.019644KIAA1328Intron
20rs136338368, 919, 4350.020108HAR1AUpstream
Z-6, 847, 2250.02043KIAA1328Intron
6rs31298623827, 242, 3190.020633TDRD1Upstream
5-16, 429, 9600.022312TPCN2Intron
2rs1593122228, 639, 2600.024226BZW2Intron
4rs31508166112, 239, 3570.024332USP12P1Downstream
4-36, 460, 0980.024731GRID2Intron
4rs3181586325, 122, 5580.026111NOX1, ENSGALG00000006637, ENSGALG00000020303Upstream, Intron, Downstream
26rs143006224, 106 ,0860.027252SCUBE3Intron
15rs140920967, 493, 0370.029197MN1Intron
3rs152696098, 547, 0010.030645MSH2Intron
4rs1558867956, 165, 3560.033439CAMK2DIntron
2rs31391567539, 376, 1960.034241CMC1Intron
4rs1640080745, 122, 9070.034602NUDT9, ENSGALG00000010963Upstream
6-20, 691, 9880.039963BLNKIntron
4rs1352348056, 160, 4820.041005CAMK2DIntron
2-145, 118, 3780.042982TRAPPC9Intron
4-67, 677, 2620.045337GRXCR1Intron
2rs1506794216, 967, 4290.048495KIAA1217Intron
3rs143160288, 484, 2540.049147FAM179A, TECUpstream
13rs3131107163, 909, 8460.049643SLIT3Intron
a Chicken chromosome. b The location of SNPs on genes. Genes in bold involved in the key pathways for the RFI.
Table 6. Effect of the genotypes on RFI in Cobb chickens.
SNPGGAPositionNGenotypeLSM ± SDAdditive EffectDominance Effect
rs15213482chr125, 118, 696125AA35.02 ± 7.65 B14.41 −10.70
330AG9.91 ± 4.69 A
320GG6.20 ± 4.76 A
rs318069175chr125, 124, 828318AA6.08 ± 4.79 A−12.95 −8.31
329AG10.72 ± 4.71 A
127GG31.98 ± 7.63 B
-chr2145, 118, 378276CC1.57 ± 5.14 A−12.65 0.17
357TC14.39 ± 4.50 AB
141TT26.86 ± 7.18 B
rs315791208chr223, 470, 408166AA−3.58 ± 6.62 A−8.82 12.43
380AG17.67 ± 4.36 B
230GG14.05 ± 5.61 B
rs313915675chr239, 376, 196623AA9.67 ± 3.44 a10.14 29.01
123AC28.55 ± 7.72 b
27CC−10.60 ± 16.47 a
rs315951802chr256, 946, 13964AA−1.63 ± 10.68 a−10.64 −3.53
293AG5.49 ± 5.00 a
417GG19.66 ± 4.2 b
rs318158632chr45, 122, 558249AA14.44 ± 5.41 b8.36 11.93
362AG18.01 ± 4.50 b
167GG−2.29 ± 6.59 a
rs315081661chr412, 239, 357215CC15.95 ± 5.82 b8.83 10.09
386TC17.21 ± 4.35 b
175TT−1.71 ± 6.45 a
-chr516, 429, 960246AA23.49 ± 5.46 b10.08 −5.28
363AT8.13 ± 4.50 a
164TT3.33 ± 6.70 a
rs316109660chr101, 504, 15950AA32.29 ± 12.03 b7.97−20.56
325AG3.76 ± 4.72 a
400GG16.34 ± 4.27 b
-chr184, 638, 932223CC23.67 ± 5.72 B10.90 −1.90
361CG10.86 ± 4.48 AB
193GG1.86 ± 6.16 A
-chrZ46, 332, 884133AA12.64 ± 7.68 AB−2.78 −20.25
145AG−4.82 ± 7.53 A
497GG18.21 ± 3.90 B
N: number of genotype records. a,b Means in the same column with different superscripts significantly differ at p < 0.05. A,B Means in the same column with different superscripts significantly differ at p < 0.01.

