Article

Genome-Wide Identification, Characterization, and Expression Profiling of Glutathione S-Transferase (GST) Family in Pumpkin Reveals Likely Role in Cold-Stress Tolerance

1
Department of Horticulture, Sunchon National University, 255 Jungang-ro, Suncheon, Jeonnam 57922, Korea
2
Department of Genetics and Plant Breeding, Bangladesh Agricultural University, Mymensingh 2202, Bangladesh
3
Jangchun Seed Company, 72 Sideok-ro, Yakmokmyeon, Chilgok-gun, Kyeongsangbuk-do 39821, Korea
4
National Institute of Biological Resources, 42, Hwangyeong-ro, Seo-gu, Incheon 22689, Korea
5
University-Industry Cooperation Foundation, Sunchon National University, 255 Jungang-ro, Suncheon, Jeonnam 57922, Korea
*
Author to whom correspondence should be addressed.
Genes 2018, 9(2), 84; https://doi.org/10.3390/genes9020084
Submission received: 17 January 2018 / Revised: 6 February 2018 / Accepted: 6 February 2018 / Published: 10 February 2018
(This article belongs to the Section Plant Genetics and Genomics)

Abstract

:
Plant growth and development can be adversely affected by cold stress, limiting productivity. The glutathione S-transferase (GST) family comprises important detoxifying enzymes, which play major roles in biotic and abiotic stress responses by reducing the oxidative damage caused by reactive oxygen species. Pumpkins (Cucurbita maxima) are widely grown, economically important, and nutritious; however, their yield can be severely affected by cold stress. The identification of putative candidate genes responsible for cold-stress tolerance, including the GST family genes, is therefore vital. For the first time, we identified 32 C. maxima GST (CmaGST) genes using a combination of bioinformatics approaches and characterized them by expression profiling. These CmaGST genes represent seven of the 14 known classes of plant GSTs, with 18 CmaGSTs categorized into the tau class. The CmaGSTs were distributed across 13 of pumpkin’s 20 chromosomes, with the highest numbers found on chromosomes 4 and 6. The large number of CmaGST genes resulted from gene duplication; 11 and 5 pairs of CmaGST genes were segmental- and tandem-duplicated, respectively. In addition, all CmaGST genes showed organ-specific expression. The expression of the putative GST genes in pumpkin was examined under cold stress in two lines with contrasting cold tolerance: cold-tolerant CP-1 (C. maxima) and cold-susceptible EP-1 (Cucurbita moschata). Seven genes (CmaGSTU3, CmaGSTU7, CmaGSTU8, CmaGSTU9, CmaGSTU11, CmaGSTU12, and CmaGSTU14) were highly expressed in the cold-tolerant line and are putative candidates for use in breeding cold-tolerant crop varieties. These results increase our understanding of the cold-stress-related functions of the GST family, as well as potentially enhancing pumpkin breeding programs.

1. Introduction

The glutathione S-transferases (GSTs, EC 2.5.1.18) are a large and complex enzyme family, involved in key metabolic steps in many eukaryotic organisms [1,2,3], including catalyzing the nucleophilic conjugation of the reduced site-specific (G-site) tri-peptide (glutathione, GSH, and Glu-Cys-Gly) into a wide range of electrophilic and hydrophobic substrates, as well as redox buffering. In plants, GSTs play vital roles in the detoxification of xenobiotics and toxic lipid peroxides [4,5], signal transduction, protection against damage from ozone, heavy metals [6], and glucosinolate biosynthesis and metabolism [7]. They also act as non-catalytic carrier proteins, which are required for vacuolar uptake of anthocyanins [8,9] and the regulation of plant growth and development [10]. The GST proteins of plants were classified into 14 distinct classes, namely tau, phi, theta, zeta, lambda, γ-subunit of the eukaryotic translation elongation factor 1B, dehydroascorbate reductase (DHAR), metaxin, tetrachlorohydroquinone dehalogenase (TCHQD), Ure2p, microsomal prostaglandin E synthase type 2 (PGES2), hemerythrin, iota, and glutathionyl-hydroquinone reductases (GHR) [11]. GST proteins in plants usually contain two domains, the GST N-domain (thioredoxin-like domain), involved in the conjugation of the GSH moiety (G-site), and the GST C-domain, which binds to hydrophobic substrates (H-site) [12]. The secondary structure analysis of the GSTs suggests that α-helix is the predominant structure followed by random coil and β-sheet in most of the plant GSTs [13].
The GSTs are directly involved in reducing oxidative damage in plants [2,14]; the overexpression of GSTs results in significant tolerance to oxidative stress [15,16]. The GSTs have also been suggested to be involved in controlling programmed cell death [17]. The biochemical and molecular pathways involved in the functions of GSTs in biotic and abiotic stress adaptation are the result of both catalytic and non-catalytic functions of reactive electrophile species with GSH [11]. The tau and phi GSTs are common in plants and are mainly involved in xenobiotic metabolism [18,19,20]. These GSTs were found to have broad substrate specificities in Arabidopsis thaliana [21] and Populus trichocarpa [22].The expression of the tau and phi GSTs is also correlated with a high tolerance to a range of abiotic stresses, including cold, dehydration, UV, oxidative stress, salt, and heavy metals [21]. In plant cells, the DHAR-class GSTs, which are particularly up-regulated during light and drought stress, catalyze the generation of the antioxidant ascorbic acid, and are therefore considered antioxidant proteins [23]. Little is known about the roles that the GHR and mPGES2 GSTs play against environmental stresses; however, Arabidopsis microarray data indicate they are differentially regulated under various abiotic stresses [24]. The theta GSTs putatively function to detoxify oxidized lipids [25], although GST theta 1 (GSTT1) was also found to be up-regulated in Euphorbia esula during drought stress and treatment with xenobiotics [26]. The zeta GSTs are involved in tyrosine catabolism [25], and were also found to be involved in enabling E. esula germination under chilling and salt stresses [26]. Among the GST family, a few tau, phi, and theta GSTs are known to possess glutathione peroxide activity [12]. The lambda GSTs have a putative role in flavonoid metabolism [27] and are also up-regulated during heavy metal stress [28].
Cold stress has a major impact on plant growth and development, causing physiological, biochemical, metabolic, and molecular changes [29]. Cold-stress tolerance can be induced in plants by acclimating them to lower temperatures over a period of time, which induces an array of cellular physical and physiochemical changes and may prevent the formation of ice within their cells, this process is called cold-acclimation. The cold-acclimation mechanism is present in many plants and agricultural crops [30]. The cold-regulated (COR) genes are involved in cold acclimation, and their activities are mediated by one or more effector genes and various transcription factors [30]. The COR genes play key roles in stabilizing membranes against freezing damage [30]. Major cis-acting elements, such as the LTREs (low-temperature responsive elements), ABREs (abscisic acid, ABA,-responsive elements), and DREs/CRTs (dehydration-responsive elements/C-repeats), are regulated by ABA-dependent and ABA-independent pathways in osmotic- and cold-stress responses [31]. Messengers such as ABA and reactive oxygen species (ROS) act via Ca2+ signaling to play a key role in inducing the expression of COR genes, such as FAD8 (fatty acid desaturase 8), ERD6 (early-responsive to dehydration 6) [30], LOS5 (low osmotic stress 5), FRO1 (ferric reduction oxidase 1) [32], hsp70 (70 kDa heat shock protein) [33], and the CBFs (c-repeat binding factors) [34]. Most of the COR genes encode hydrophilic boiling-soluble polypeptides and function to promote the accumulation of secondary metabolites in the cell membrane to protect them from damage during cold stress. Under cold stress, the increased activity of anti-oxidative enzymes, such as superoxide dismutase, GST, glutathione reductase, glutathione peroxidase (GPX), ascorbate peroxidase, and catalase, as well as non-enzymatic antioxidants such as tripeptidthiol, GSH, and ascorbic acid, contribute directly to membrane stabilization [35].
The Cucurbita genus, which includes the pumpkins, squashes, and gourds, belongs to the Cucurbitaceae family. Two pumpkin species, C.maxima and C. moschata, are the most economically important cultivated Cucurbita crops, used as a staple food in many developing countries, although their mature fruits and seeds are consumed worldwide. The largest pumpkin producers are China, India, Russian Federation, Ukraine, United States, and Mexico [36]. C. maxima and C. moschata are used as rootstocks for other cucurbit crops, such as watermelon (Citrullus lanatus var. lanatus), cucumber (Cucumis sativus), and melon (multiple genera), to improve resistance against soil-borne pathogens and tolerance to abiotic stresses [37]. In our study, we identify and characterize the GST genes in C. maxima using a genome-wide analysis and various bioinformatics tools. We also predict which putative GSTs may be involved in cold-stress tolerance through a comparison of cold-induced gene expression data from cold-tolerant C. maxima and cold-susceptible C. moschata materials.

2. Materials and Methods

2.1. Identification and Sequence Analysis of the CmaGSTs

The GST family members in pumpkin were identified from the cucurbit genomic database [38] and National Center for Biotechnology Information (NCBI) databases using the keyword “GST”. The cucumber (Chinese Long) GST gene sequences were used as queries in a Basic Local Alignment Search Tool (BLAST) search, with a cut-off E-value of <10−10. The coding sequence (CDS) and protein sequences of the putative GST family members were extracted from the cucurbit genomic database, and the protein sequences were further examined to confirm the presence of the GST-N (thioredoxin-like) and GST-C (hydrophobic or electrophilic binding) domains using the SMART web tool [39] and the NCBI tools [40]. In addition, the protein structures (protein length, molecular weight, and isoelectric point) were determined from the primary gene sequence using Expasy [41]. The sub-cellular localization of the identified CmaGST proteins was determined using Plant-mPLoc [42]. The GST-N domain sequences were aligned using CLUSTAL Omega [43]. The Multiple Expectation Maximization for Motif Elicitation (MEME) [44] was used to determine conserved motifs in the encoded proteins, using the following parameters: maximum number of motifs: 10; width of optimum motif ≥15 and ≤50. To determine the number of introns and exons, the CDS and genomic sequences of the CmaGST genes were compared using the Gene Structure Display Server (GSDS) tool [45].Putative cis-acting regulatory elements in the CmaGST genes were predicted in regions approximately 1 kb upstream of the translation initiation site (ATG) using Place [46].

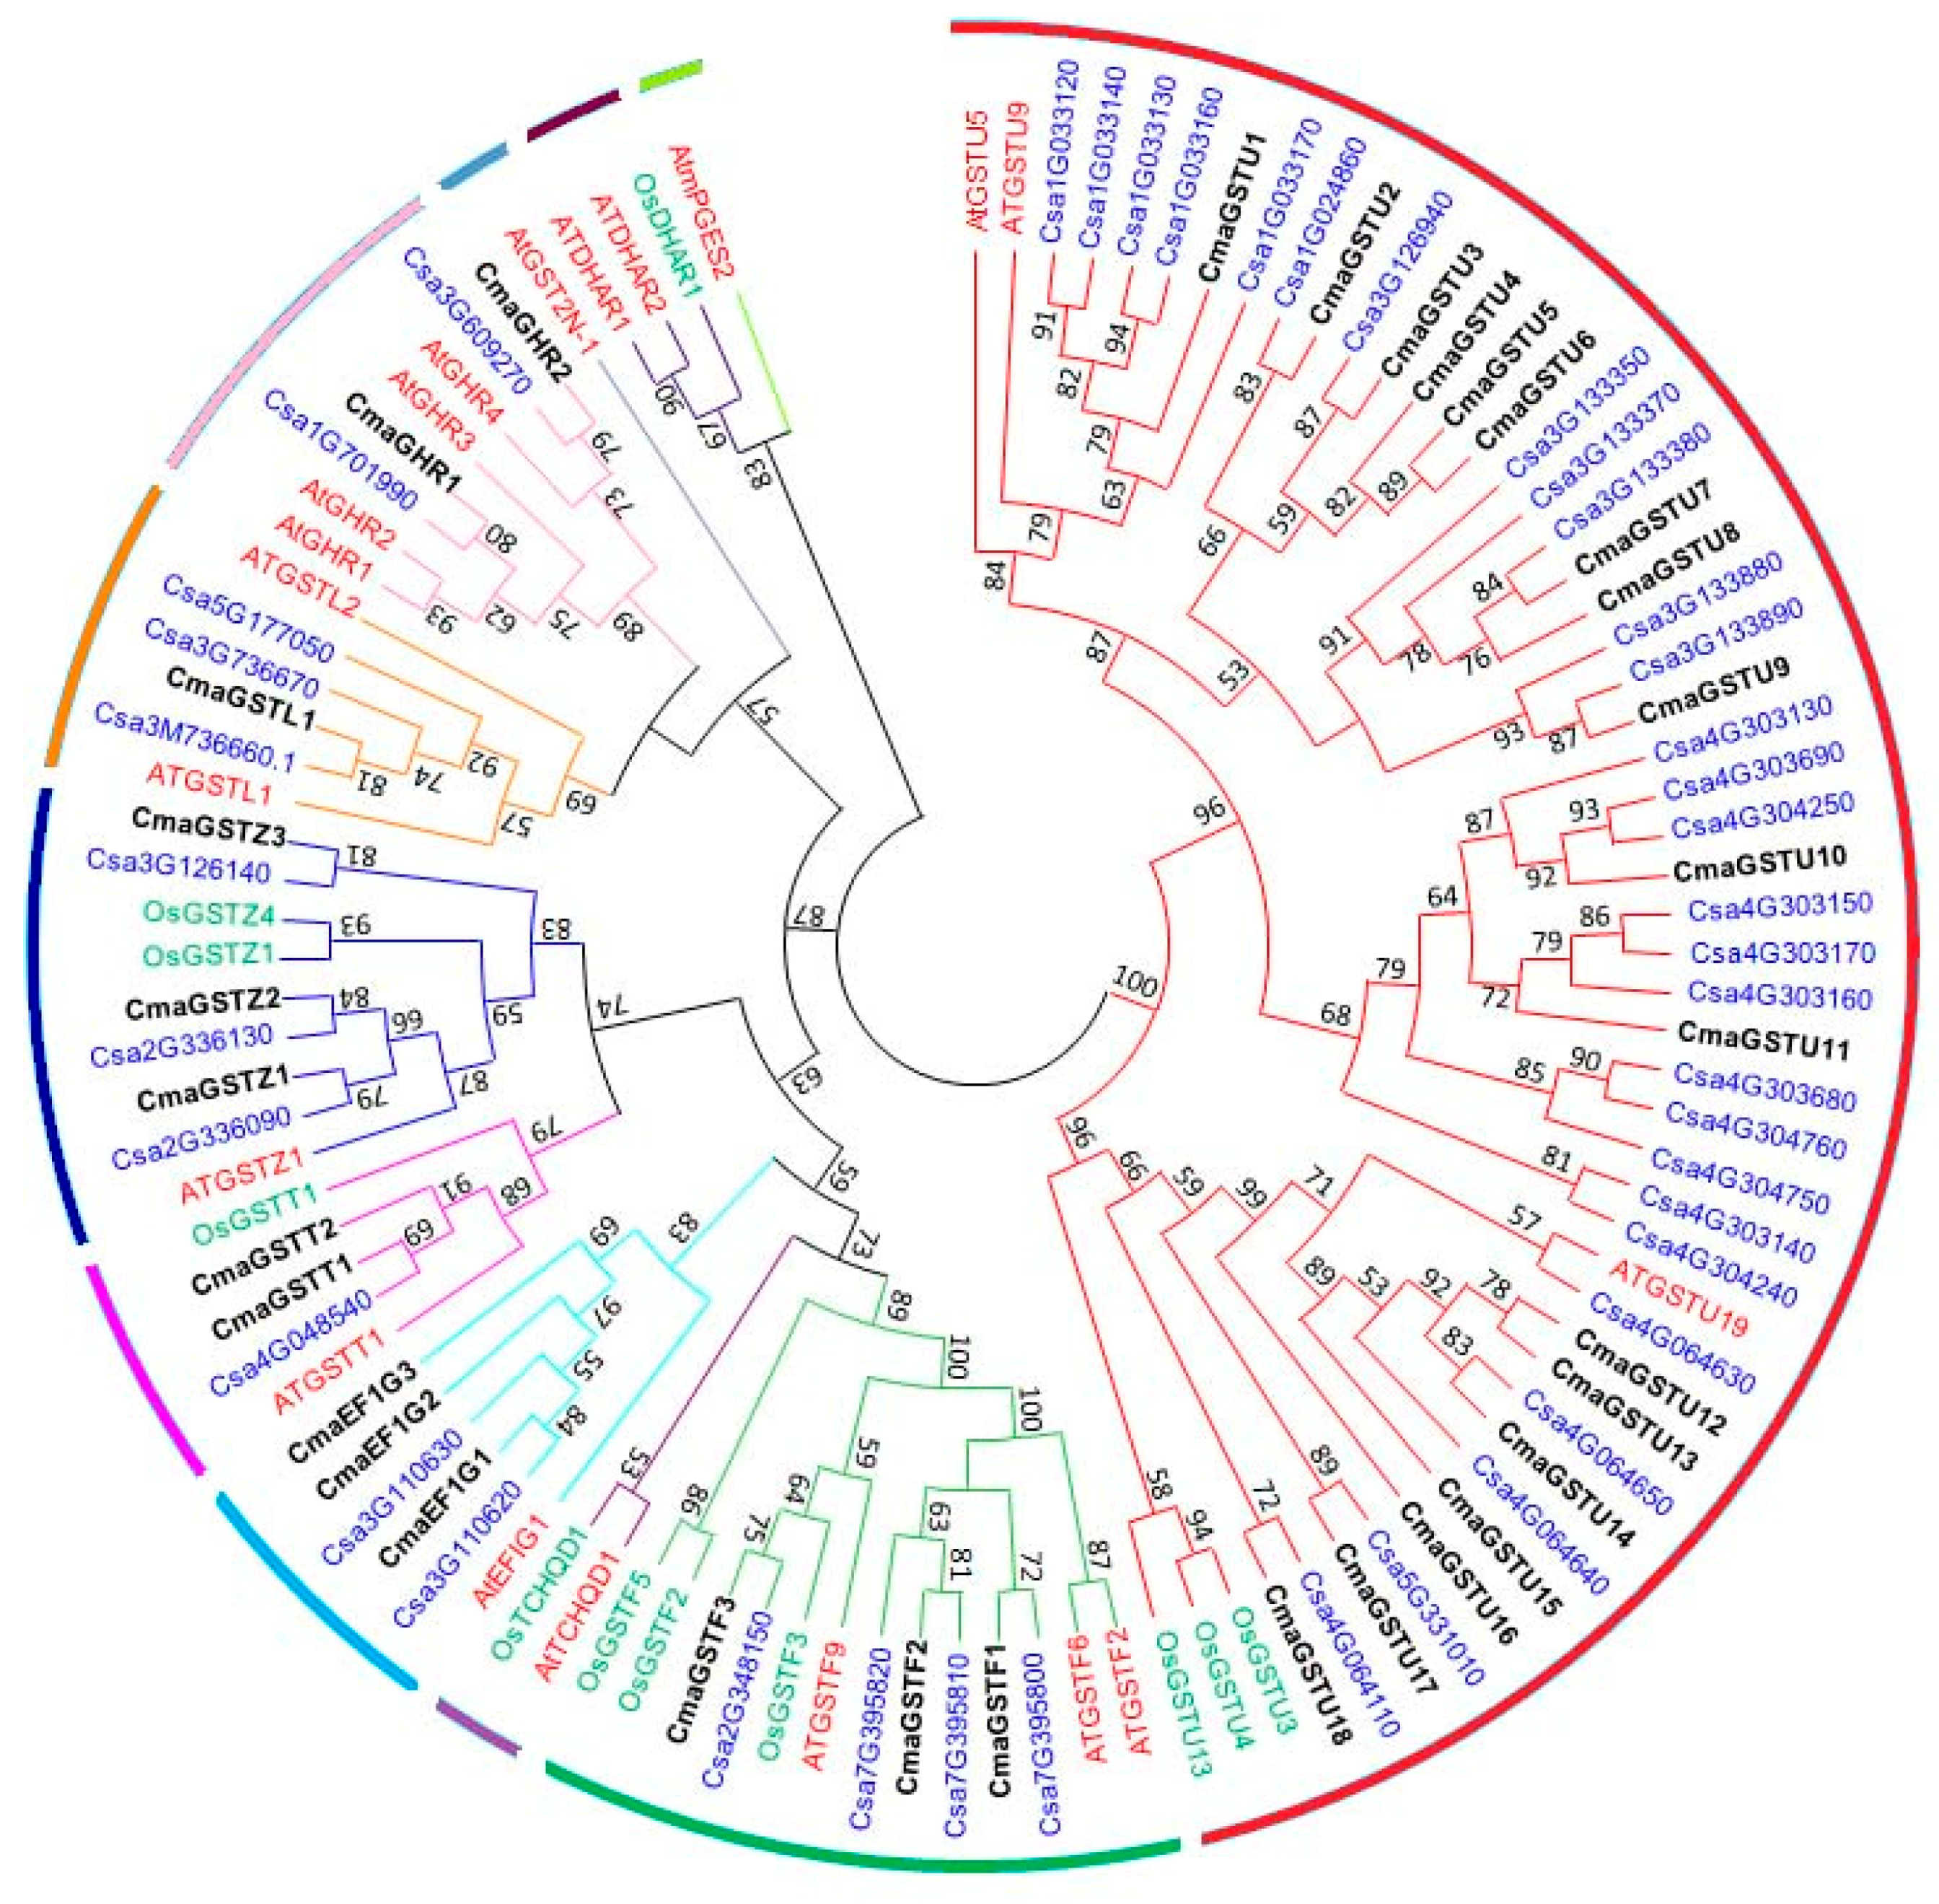
2.2. Phylogenetic Analysis

The predicted CmaGST protein sequences were collected from the cucurbit genomics database [38]. Arabidopsis thaliana, Oryza sativa (rice), and Cucumis sativus var. sativus (cucumber) GST protein sequences were downloaded from TAIR [47], the MSU Rice Genome Annotation Project [48], and the Cucurbit Genome Database [38], respectively. The CmaGST protein sequences were aligned with those of Arabidopsis, rice, and cucumber using Clustal Omega. A phylogenetic tree was constructed in MEGA 6.0 [49] using the neighbor-joining algorithm with 1000 bootstrap replicates, using complete deletion mode to analyze tree topology and reliability. The names and sequences of all proteins used in the phylogenetic analysis are provided in Table S1.

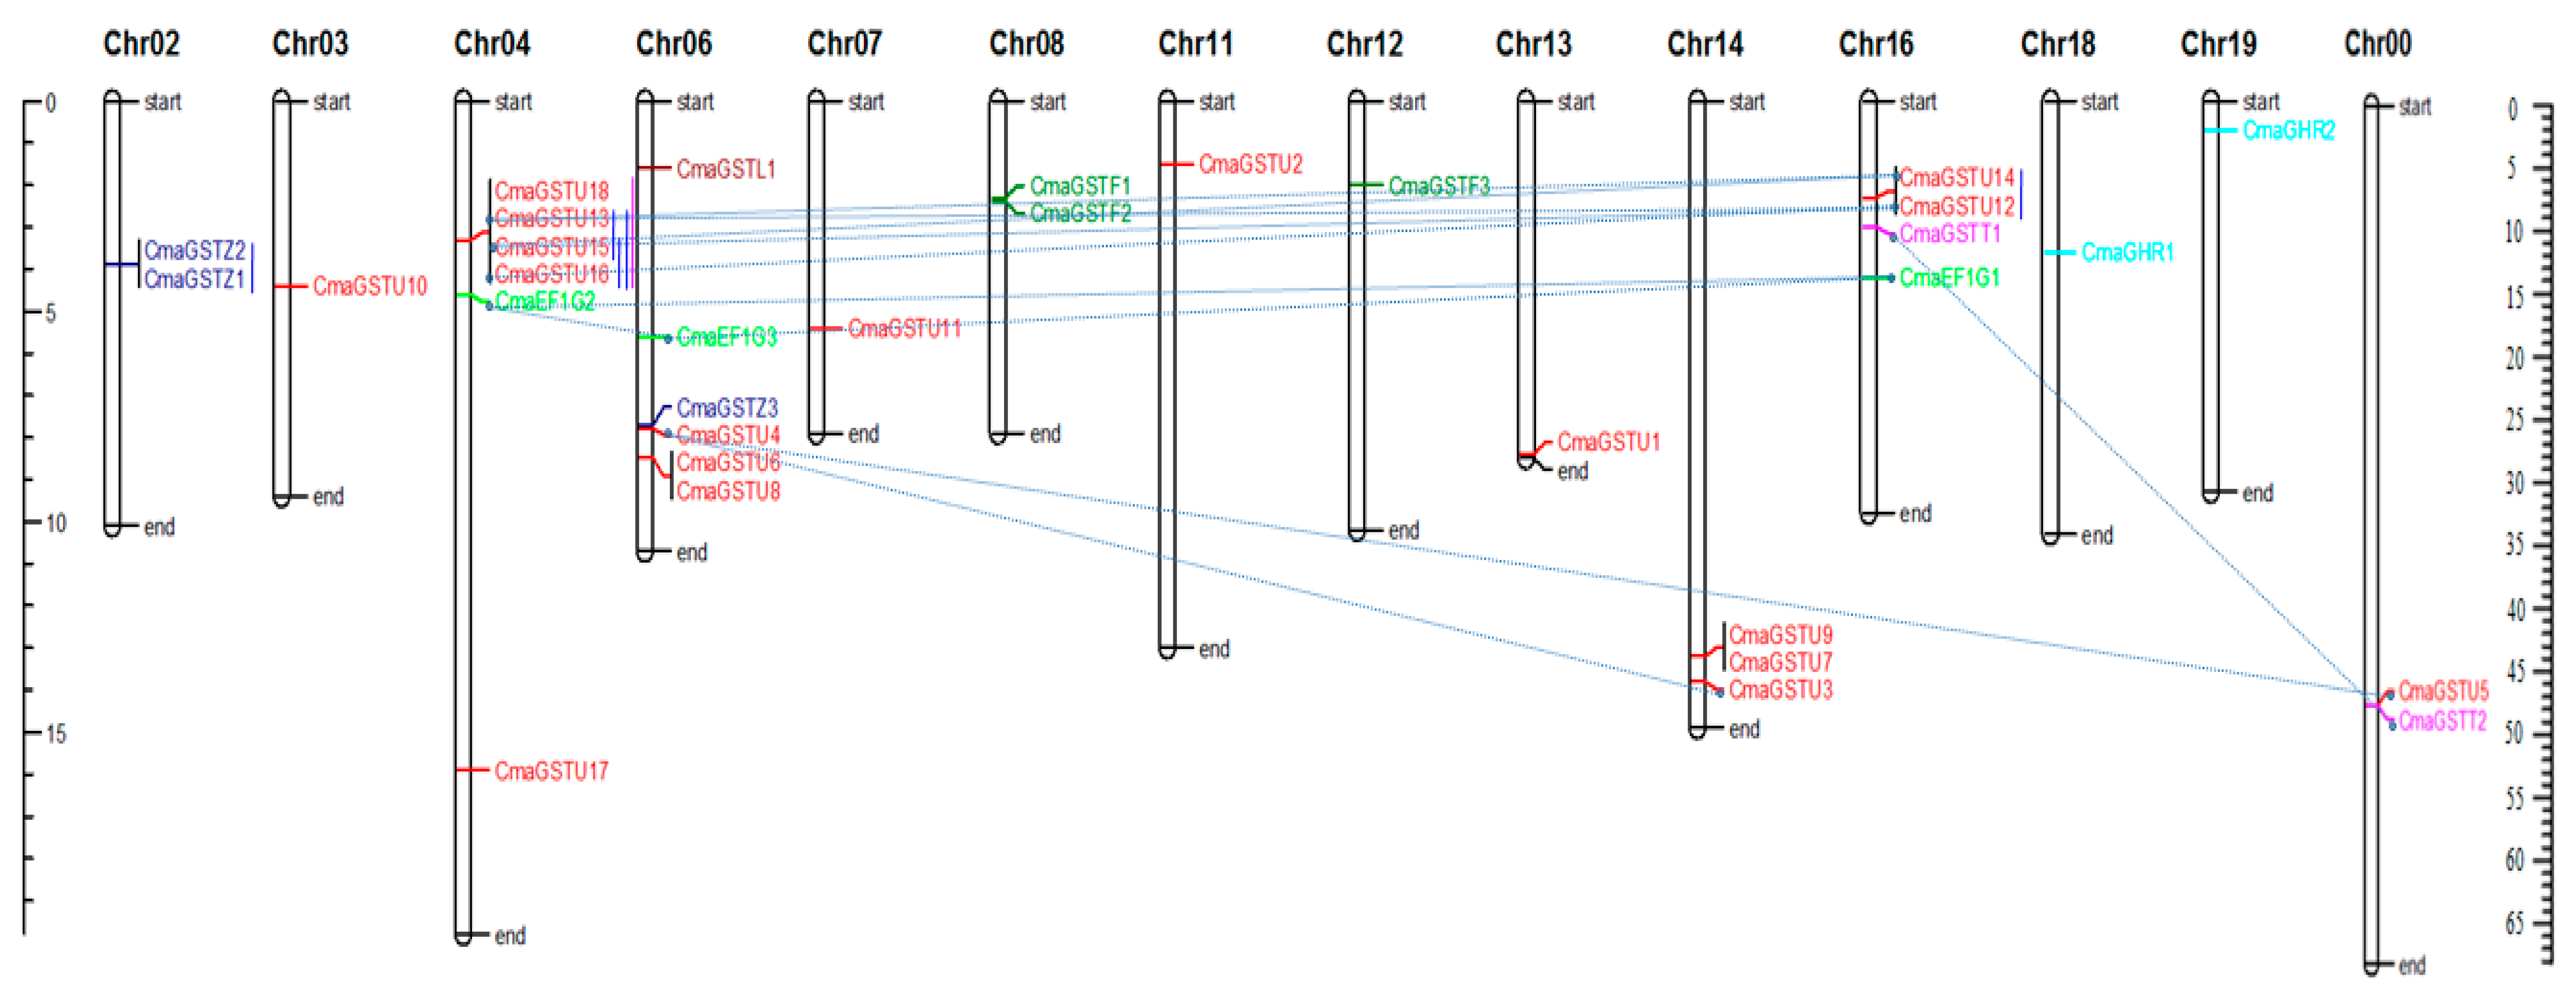
2.3. Chromosome Localization and Gene Duplication Analysis

Genomic positional information for the CmaGST genes was collected from the cucurbit genome database, and their locations were plotted using Mapchart 2.2 [50]. Duplicated CmaGST genes were identified by BLAST-searching [51] them against each other, and were classed as duplicated genes when both their identity and query coverage was >80% of their partner sequence [52]. Tandem-duplicated genes were identified as an array of two or more homologous genes within a distance of 100 kb. A chromosome region containing more than two genes within 200 kb was defined as a gene cluster [53]. We estimated the synonymous rate (Ks), non-synonymous rate (Ka), and evolutionary constraint (Ka/Ks) between the duplicated CmaGST gene pairs based on coding sequence alignments, using the method described by Nei and Gojobori [54] for MEGA 6.0 software. The mode of selection was identified using the Ka/Ks value between duplicated genes, where values >1, <1, and equal to 1 reflected positive selection, purifying selection, and neutral selection, respectively. We calculated divergence time of the duplicated gene pairs using the formula: T million year (Mya) = Ks/2r; where T is divergence time, Ks is the number of synonymous substitutions per site, and r is the fixed rate of 1.5×10⁻⁸ synonymous substitutions per site per year expected for dicotyledonous plants [55].

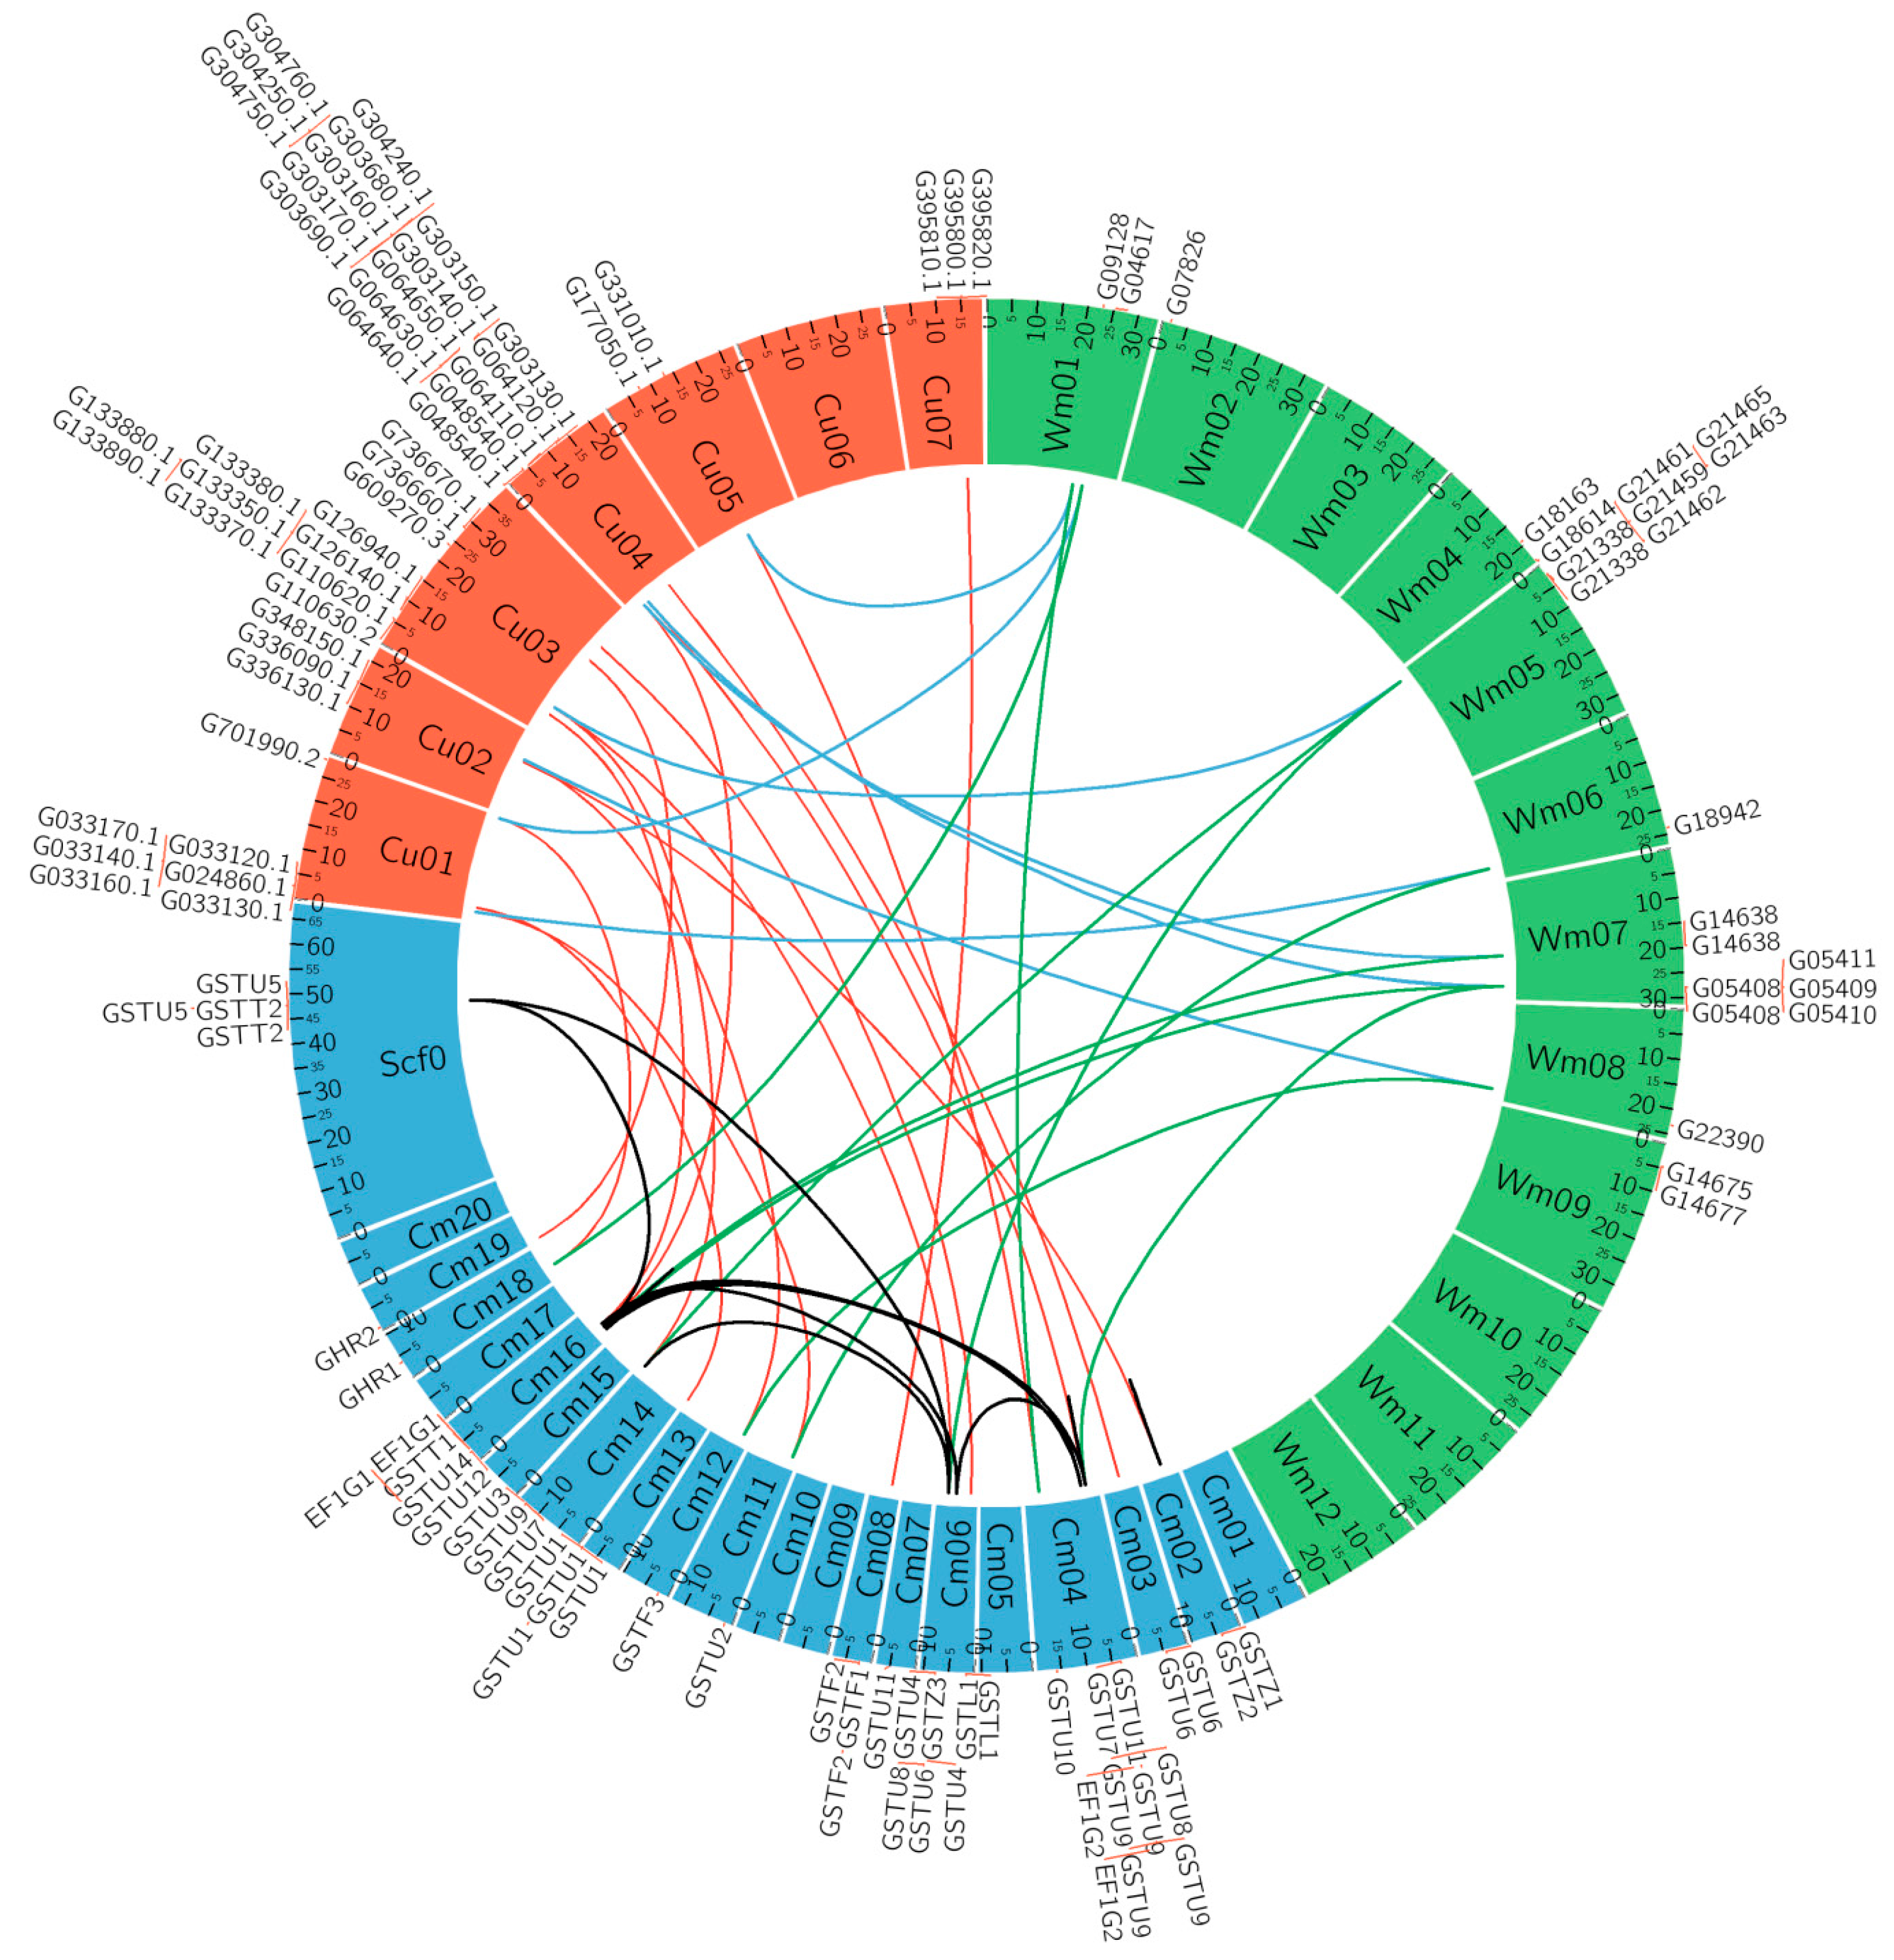
2.4. Microsynteny of the GST Gene Family

The microsyntenic relationships of the GST genes in C. maxima, C. sativus, and C. lanatus subsp. vulgaris were detected using BLAST searches of these genes against the whole genomes of these crops. The physical location of the CmaGST genes on each chromosome were collected from the respective databases, and the relationships among the three crop species were plotted using Circos-0.52 [56].

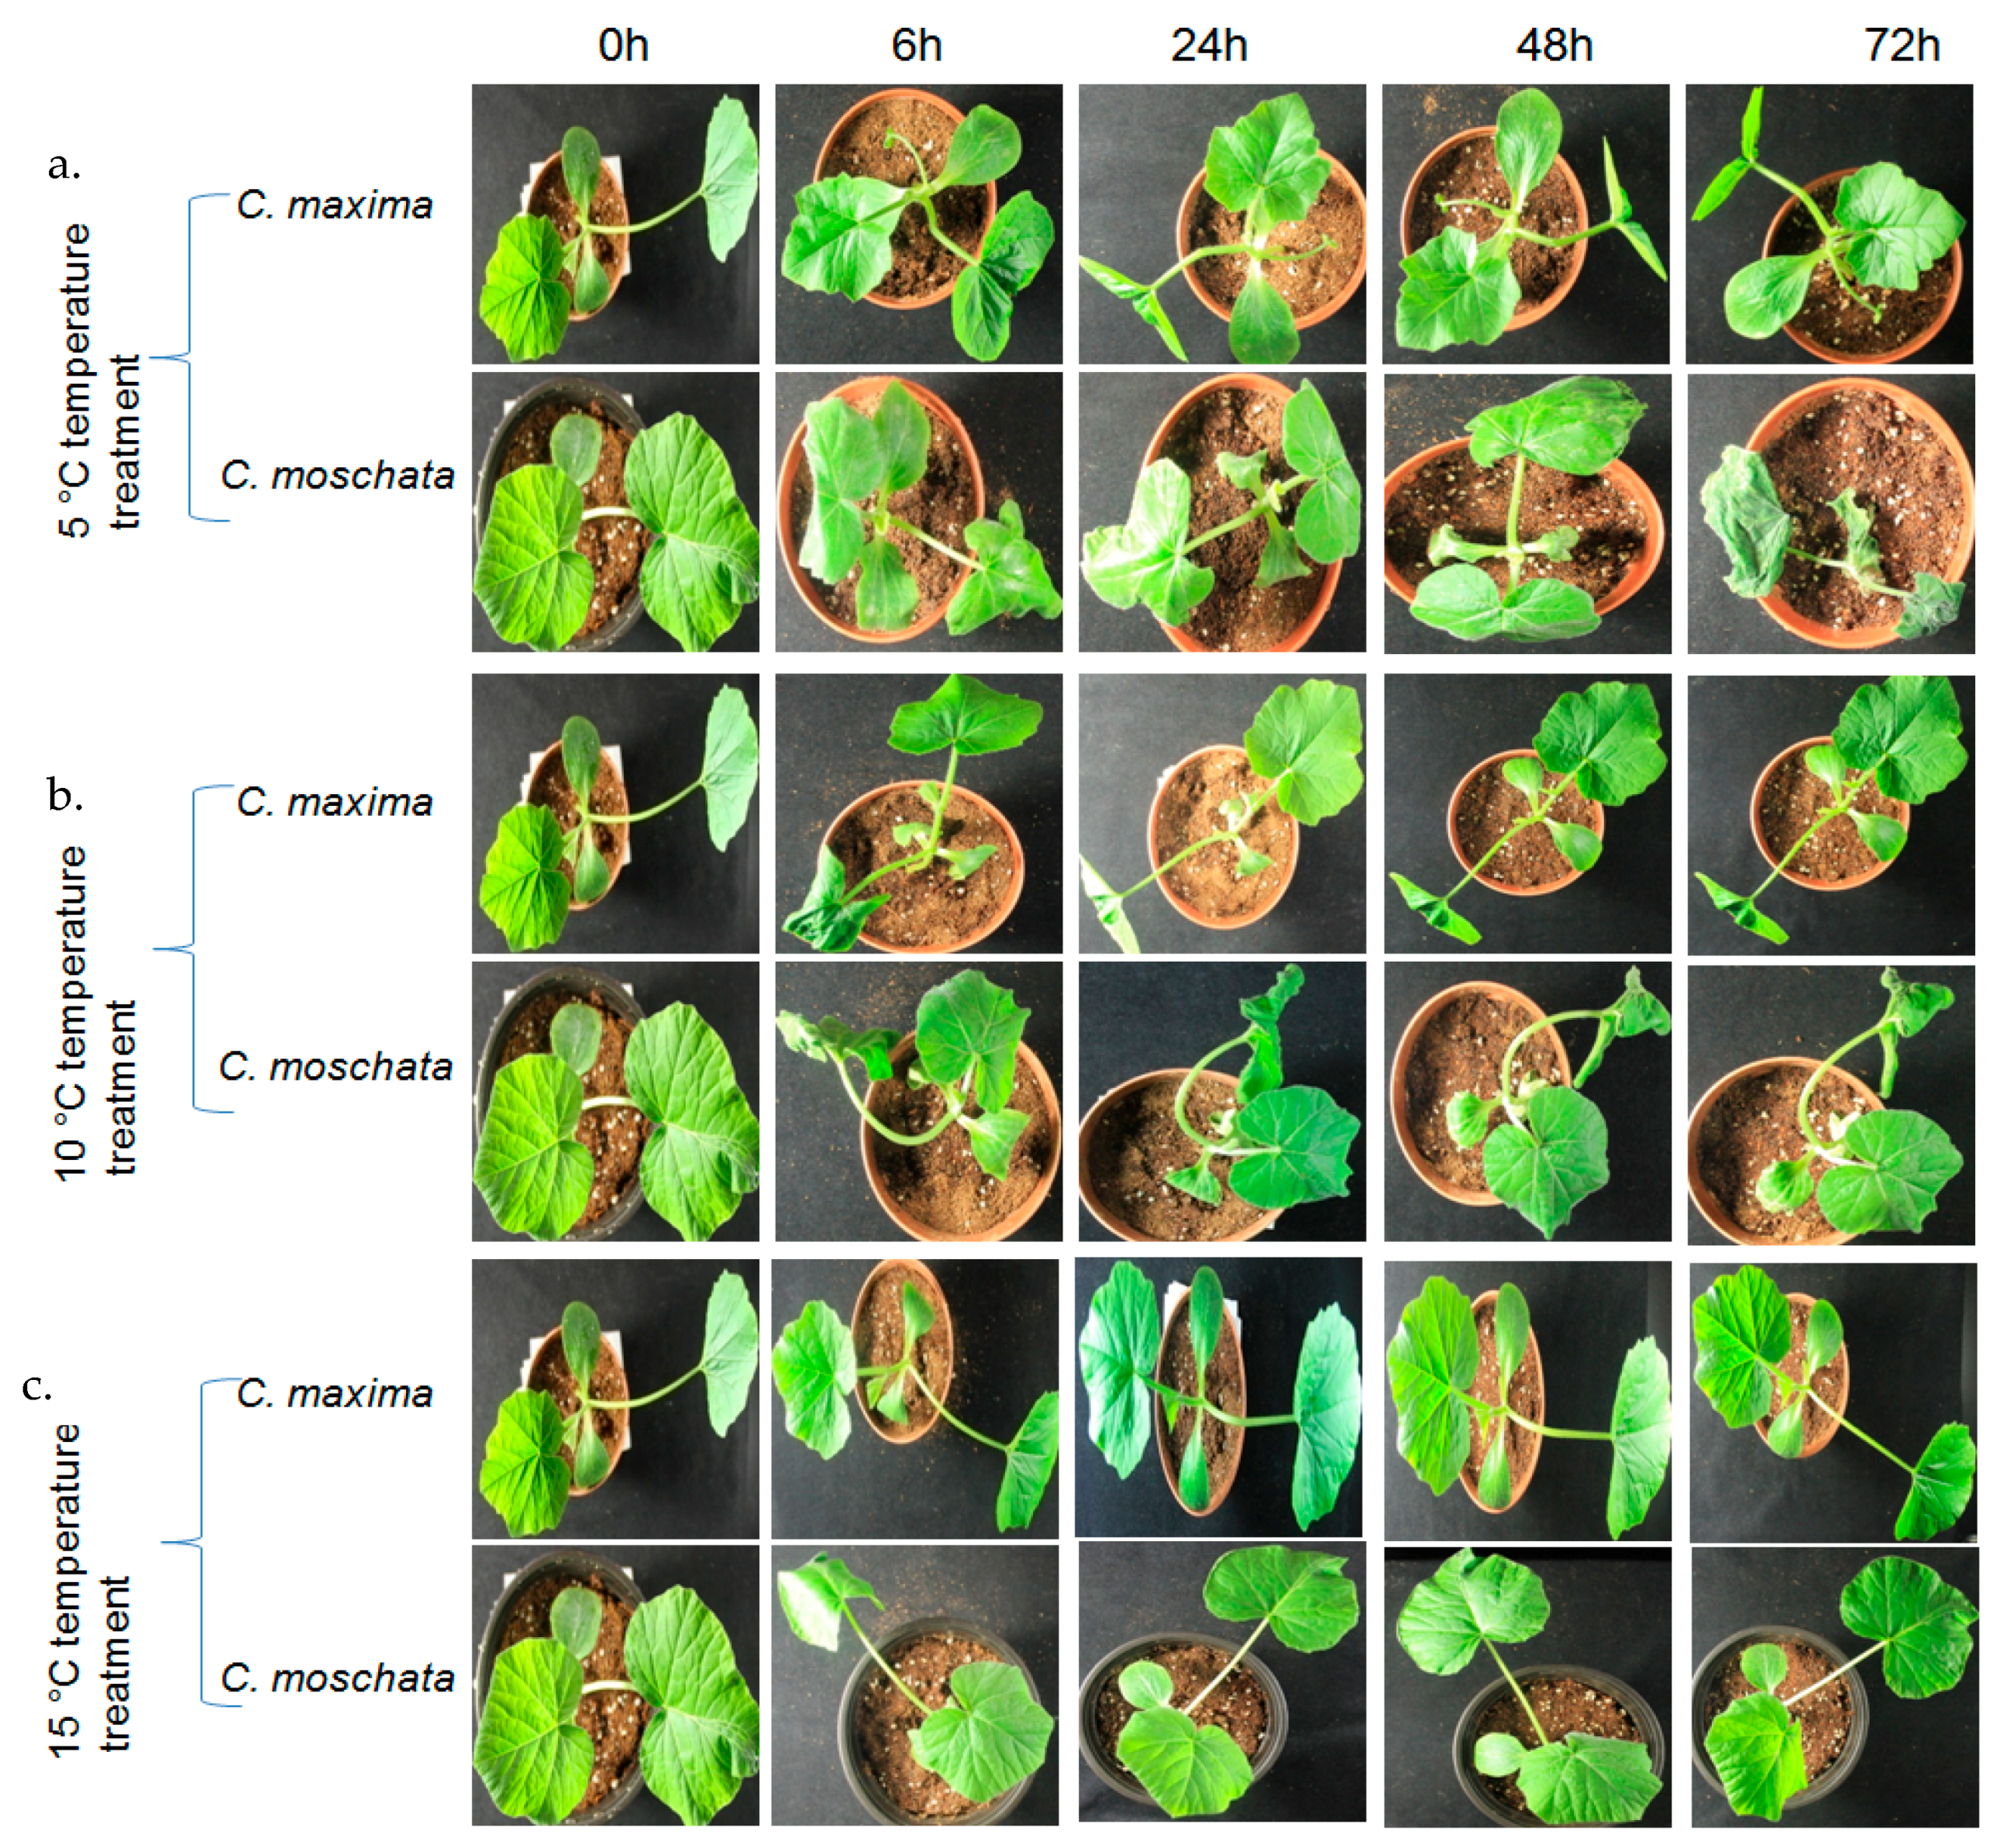
2.5. Plant Materials, Growth, and Treatments

Two pumpkin species, moderately cold-tolerant C. maxima (inbred line CP-1) and cold-susceptible C. moschata (inbred line EP-1), were grown in a growth chamber at the department of Horticulture, Sunchon National University, Republic of Korea, at 24 °C and with a 14/10 h light/dark photoperiod. The seeds were directly sown into plastic containers containing soil. Cold stress was imposed on four-week-old seedlings, with five biological replications per treatment. The seedlings were transferred to incubators (TOGA clean system; model: TOGA UGSR01, Daejong, Korea) maintained at 5 °C, 10 °C, and 15 °C until cold injury symptoms were clearly observed on the seedlings (Figure 1a–c). Leaf samples of the cold-treated plants were excised after 0 h, 6 h, 24 h, 48 h, and 72 h of treatment. The samples were immediately frozen in liquid nitrogen and stored at −80 °C for RNA extraction. Root, stem, leaf, and flower bud samples were also collected from healthy C. maxima plants, to investigate the organ-specific expression of the CmaGSTs.

2.6. RNA Extraction and cDNA Synthesis

Cold-treated frozen leaf samples were used for total RNA extraction with an RNeasy Mini kit (Qiagen, Hilden, Germany), following the manufacturer’s instructions. DNA was removed from the samples using RNase-free DNase (Promega, Madison, WI, USA), as instructed by the manufacturer. The extracted RNA was quantified using UV spectrophotometry at A260 NanoDropND-1000 and NanoDrop v3.7 software (Thermo Fisher Scientific, Waltham, MA, USA). The complementary DNA (cDNA) was synthesized using a First-Strand cDNA Synthesis kit (Thermo Fisher Scientific), following the manufacturer’s instructions.

2.7. Qualitative and Quantitative PCR Expression Analyses

Reverse transcription polymerase chain reaction (RT-PCR) qualitative expression analyses were performed with a one-step Emerald Amp GT PCR Master Mix (Takara Bio Inc., Kusatsu, Japan). CmaGST gene-specific primers were used for the RT-PCR, with CmaActin expression as an internal control (Table S2). The PCR reactions were performed using 1 µL of 50 ng cDNA from the roots, leaves, stems, and flower buds as templates, as well as a master mix containing 10 pmol each of the forward and reverse primers, 9 µL sterile water, and 8 µL Emerald Mix in a total volume of 20 µL. The PCR conditions were: an initial denaturation at 95 °C for 5 min; followed by 30 cycles of denaturation at 95 °C for 30 s, annealing at 58 °C for 30 s, and extension at 72 °C for 45 s; with a final extension at 72 °C for 5 min. The PCR amplicons were run on a 1.2% agarose gel stained with HIQ blue mango (BioD Co, Gwangmyeong, Korea) and visualized with UV.
Quantitative PCR (qPCR) was performed using a 10-μL reaction volume containing 5 μL 2× Quanti Speed SYBR mix (Thermo Fisher Scientific), 1 μL (10 pmol) each of the forward and reverse gene-specific primers (Table S1), 1 μL template cDNA (50 ng), and 2 μL distilled, deionized water. The qPCR conditions were as follows: initial denaturation at 95 °C for 5 min; followed by 40 cycles of denaturation at 95 °C for 10 s, annealing at 58 °C for 10 s, and extension at 72 °C for 15 s. Light cycler 96 SW 1.1 (Roche, Mannheim, Germany) software was used to detect amplification and process data. Fluorescence was measured at the last step of each cycle, and three replicates were used for each sample. The qPCR reactions were normalized using cucurbit Actin genes as a reference for all comparisons [57], and the cycle threshold (Cq)value was calculated using the 2−ΔΔCt method to determine the relative expression of the genes. Heat maps were constructed based on transcript abundance value of 32 GST genes of the two contrasting lines C. maxima (inbred line CP-1) and C. moschata (inbred line EP-1) exposed to different temperature at several time courses using Cluster 3.0 and tree view software [58].

2.8. Statistical Analysis

One-way analyses of variance (ANOVAs) were performed with Minitab 18 (State College, PA, USA) statistical software to detect significant differences among the relative expression levels of the genes. The mean separation of the relative expression values was determined using Tukey’s pair-wise comparison test.

3. Results

3.1. Identification of GST Genes in C. maxima

We identified GST genes from the cucurbit and NCBI databases using the key word “GST”. The C. sativus gene sequences were BLAST-searched against the C. maxima genome to obtain the putative CmaGST genes, and a series of systematic analyses were performed to assemble the final set of 32 C. maxima GST gene sequences (Table 1). The protein and genomic sequences for these candidates were obtained from the cucurbit database [38]. The CmaGST protein sequences were highly similar to those of other plant species, and all CmaGST proteins contained both the GST-N and GST-C domains. Certain proteins contained other specific domains; the EF1G (elongation factor 1γ, pfam00647) was present in CmaEF1G1, CmaEF1G2, and CmaEF1G3, while the UCH (ubiquitin carboxyl terminal hydrolase) and RPT1 (internal repeat 1) domains were found in CmaGSTU16 and CmaGSTU7, respectively. The GST-N domain was comprised of βαβαββα motifs, resulting in three layers of β-sheets sandwiched by three layers of α-helixes (Figure S1). The N-terminus and C-terminus were connected by a small peptide sequence (8–15 aa) called the linker region in all CmaGSTs. The predicted isoelectric points (5.17–9.38), molecular weights (23.19–91.29 KDa), sub-cellular localizations, and residual sizes (202–810 aa) of the 32 putative CmaGST proteins are presented in Table 1.

3.2. Phylogenetic Analysis

A phylogenic tree was constructed using 106 full-length GST protein sequences from Arabidopsis (20 sequences), rice (11 sequences), cucumber (43 sequences), and the 32 CmaGST proteins (Figure 2), to investigate the evolutionary relationships of the CmaGST proteins. We have found 11 classes of GSTs out of recently published 14 classes [11], eight of which (tau, phi, zeta, theta, lambda, EF1G, DHAR, and TCHQD) correspond to the Arabidopsis GST gene classification by Dixon and Edwards [12], while the remaining three classes (GHR, mPGES-2, and GST2N) were identified by Vijayakumar et al. [59]. A total of 18 CmaGSTs were attributed to the tau class, the largest and most abundant group, while three CmaGSTs each were positioned in the phi, EF1G, and zeta classes (Figure 2). In addition, two CmaGSTs were categorized as theta GSTs, while another two were grouped into the GHR category. The remaining CmaGST was located in the lambda class. No CmaGST proteins were attributed to the TCHQD, GST2N, DHAR, and mPGES2 classes.

3.3. Chromosomal Locations and Gene Duplications of the CmaGSTs

The distribution of the CmaGST genes across the pumpkin chromosomes was mapped, showing that most were located on relatively few chromosomes, including chromosomes 4, 6, 14, and 16 (Figure 3). Six CmaGST genes each were found on chromosomes 4 and 6, while chromosomes 3, 7, 11, 12, 13, 18, and 19 each contained only one CmaGST gene. The distribution of the CmaGST genes in the pumpkin genome reflected the diversity and complexity of this gene family. A cluster of tau CmaGST genes was identified on chromosome 4 (Figure 3). In other species, the genomic locations of the GST gene family are known to be influenced by genetic events including segmental duplication, tandem duplication, and polyploidization [60,61]. We identified 11 pairs of segmentally duplicated and five pairs of tandem-duplicated GST genes in the pumpkin genome (Figure 3, Table 2). Moreover, the substitution rate of non-synonymous (Ka) and synonymous (Ks) mutations was estimated to assess the selection pressures and divergence time among the duplicated CmaGST gene pairs (Table 2). Ka/Ks values <1, 1, and >1 indicate negative or purifying selection, neutral selection, and positive selection, respectively. Among the 16 CmaGST duplicated gene pairs, 15 had Ka/Ks values below 1, indicating that these duplicated genes evolved under purifying selection pressure in C. maxima (Table 2). Only one pair of duplicated genes had a Ka/Ks value above 1, suggesting that this gene pair evolved under strong positive selection pressures in C. maxima. We also calculated the divergence time of the CmaGST genes, revealing that the duplication events began 18.87 Mya and continued up until 1.30 Mya (Table 2). The N-terminal GST domain sequence similarity of the CmaGST proteins was greater within classes than between classes (Figure S1); 11 pairs of tau CmaGST proteins shared more than 80% similarity, indicating the high rate of gene duplication within this class. In addition, four conserved regions and the G-site were found in all CmaGST proteins (Figure S1).

3.4. Structural and Motif Analyses of the CmaGSTs

We analyzed the exon-intron structures of the CmaGST genes using the GSDS online tool, revealing different numbers of exons and introns in different classes of these genes. The tau-class CmaGSTs typically contained two exons, except that only one exon was present in CmaGSTU1, three exons were present in CmaGSTU2 and CmaGSTU5, four exons were found in CmaGSTU3, and CmaGSTU16 contained 10 exons (Figure S2). All of the genes in the phi class contained three exons, whereas the EF1G class contained six to nine exons. The zeta class genes contained 8–10 very small exons, while the two GHR-class genes contained three or six exons. The lambda (GSTL1) and theta (GSTT1 and GSTT2) genes possessed nine and seven exons, respectively (Figure S2).
Conserved motifs were found among the GST genes of C. maxima using the MEME web tool. Motifs 3 and 4 were present in all classes except the EF1G and lambda classes, respectively (Figure S3). The lambda-class gene contained only one motif (motif 3), while motifs 8 and 10 were unique to the EF1G class. Motifs 1 and 9 were unique to the tau class genes, while motifs 5 and 9 were only present in certain tau class members. Motif 2 was present in the tau and zeta class genes, but motif 6 was absent in the genes of the tau, lambda, and GHR classes. The phi and theta class genes contained motifs 3, 4, and 6, but in the theta class genes, motif 4 was partially or completely absent (Figure S3).

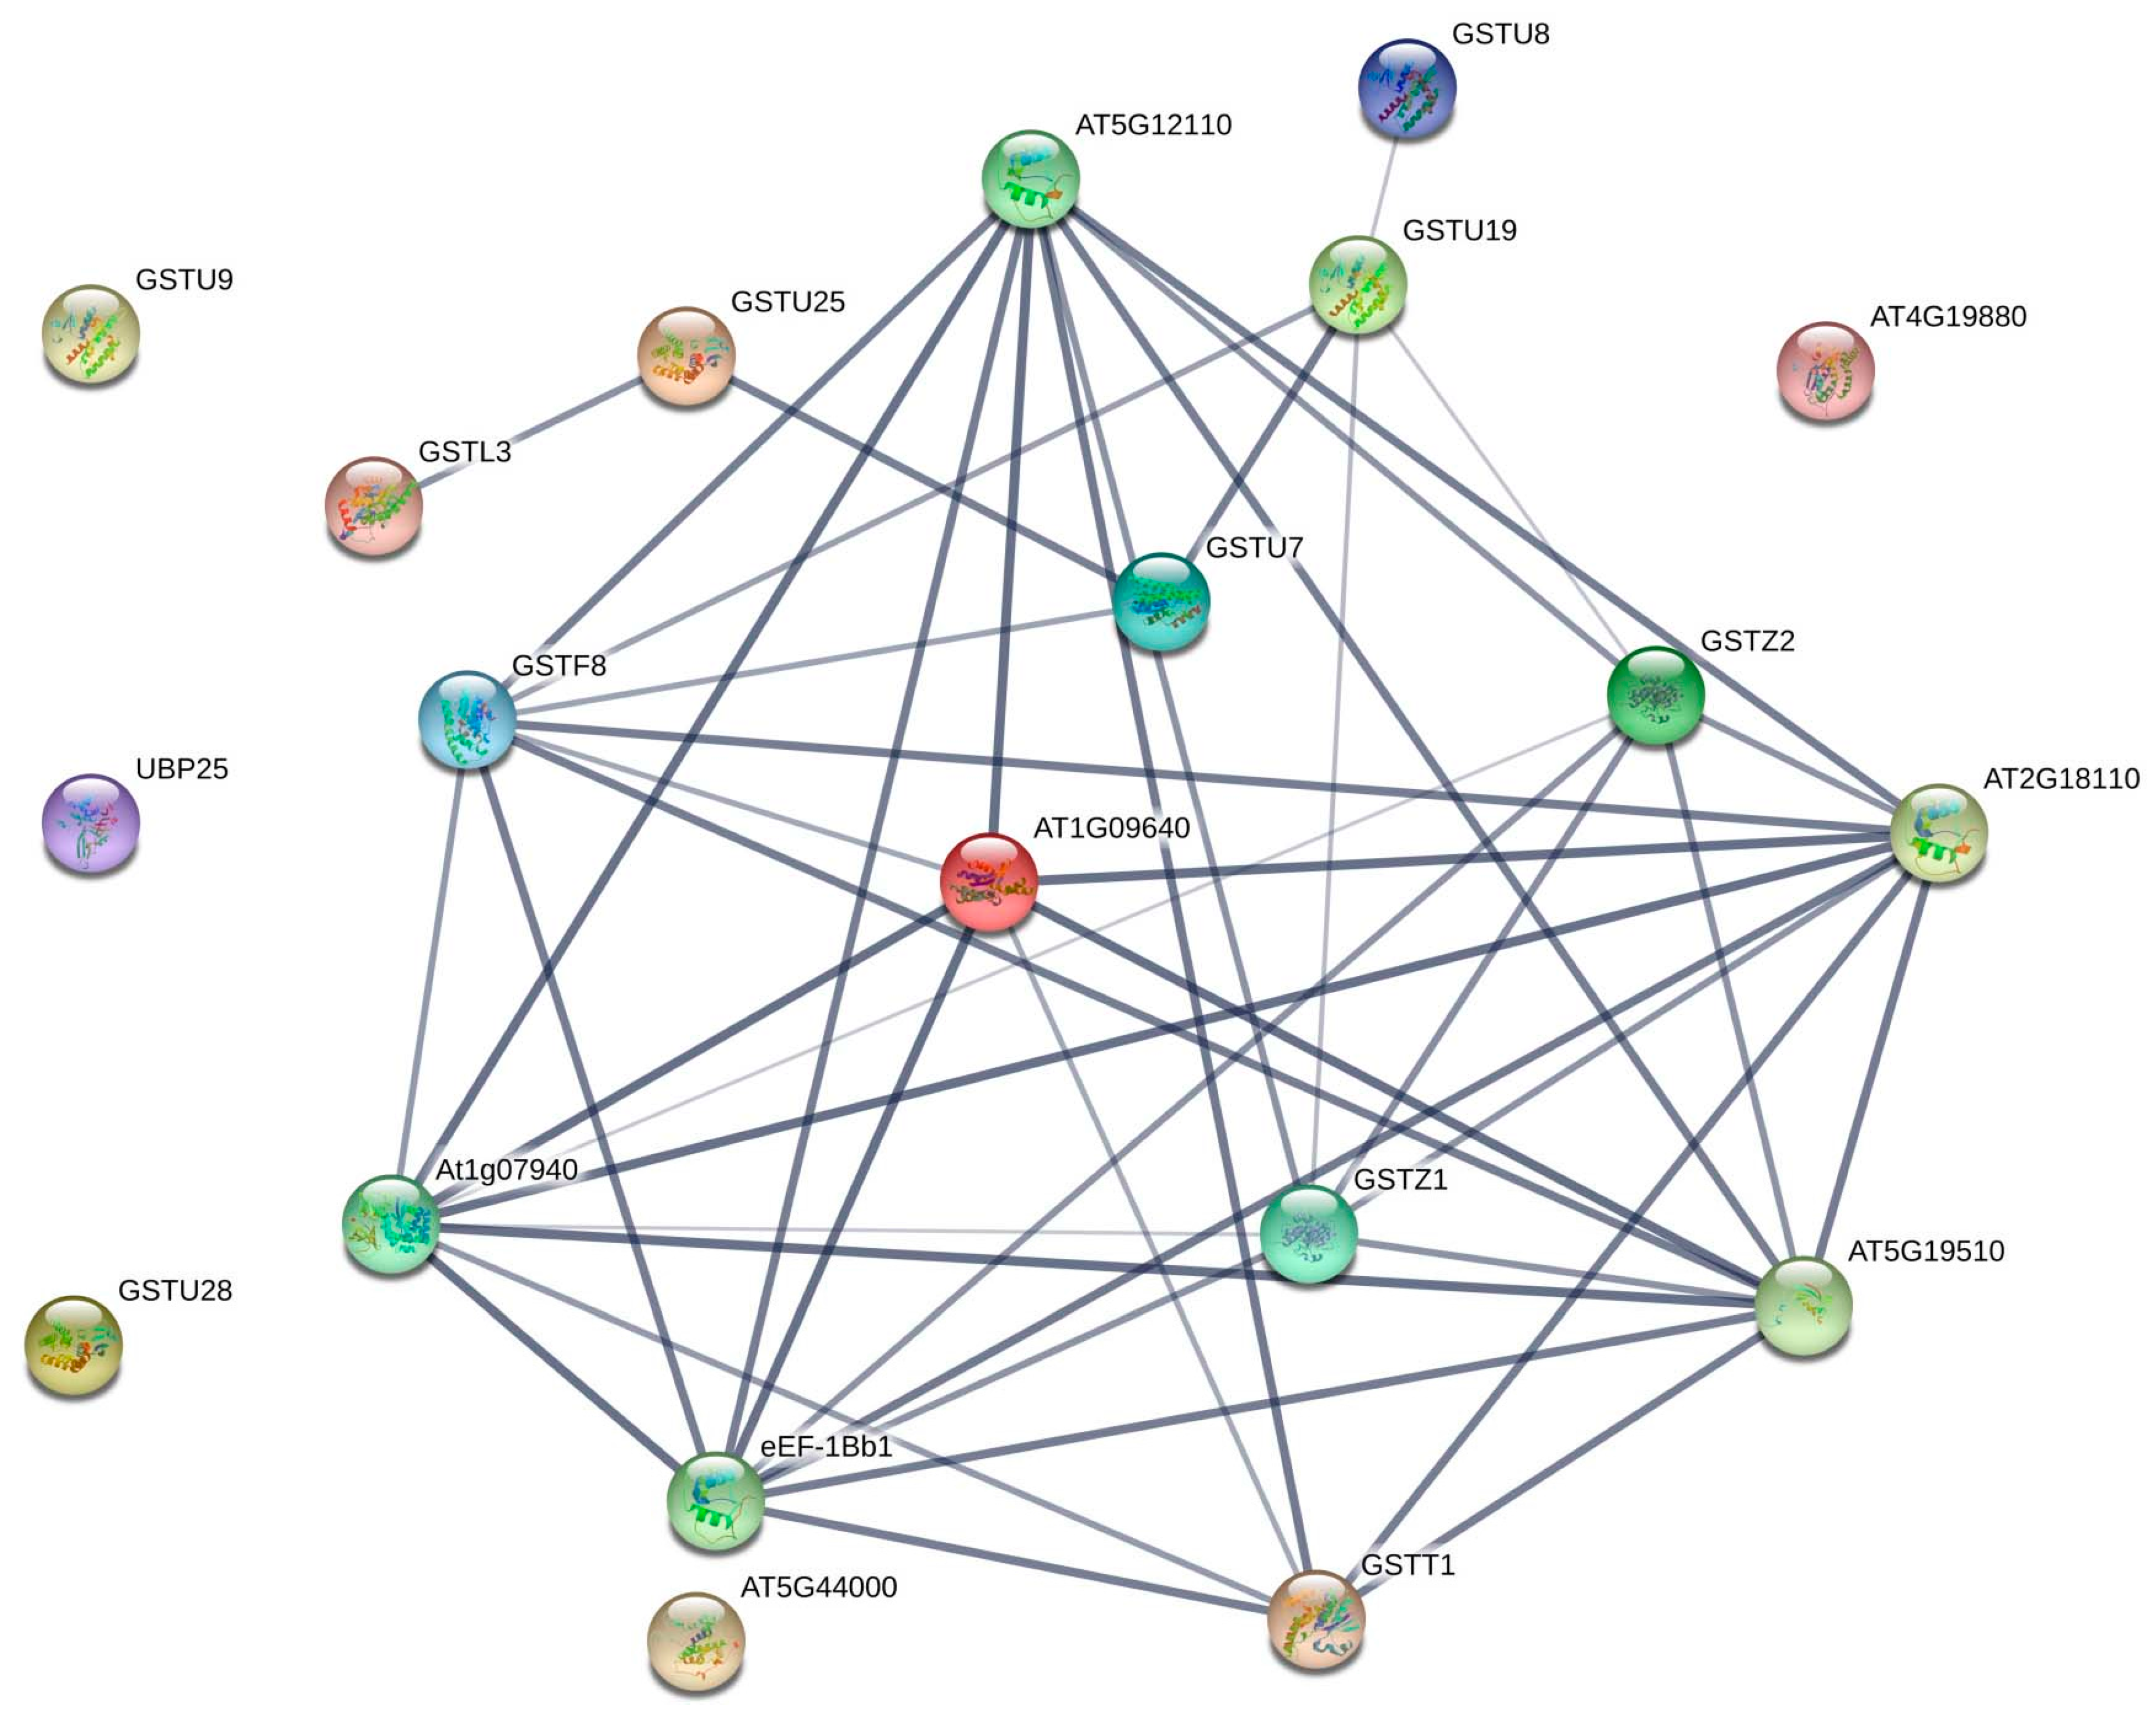
3.5. Microsynteny Relationships and Analysis of CmaGST Protein Interactions

A microsynteny map was constructed using orthologous GST gene pairs among C. maxima, C. sativus, and C. lanatus subsp. vulgaris to explore their evolutionary history and relationships (Figure 4). Nine orthologous gene pairs were identified between C. maxima and C. lanatus subsp. lanatus, whereas 24 orthologous gene pairs were identified between C. maxima and C. sativus (Figure 4). This indicates that CmaGST genes are more closely related to those of C. sativus than C. lanatus. This study also provided further evidence of the 16 pairs of duplicated CmaGST genes.
We used STRING 10.5 version software to predict the interactions of the 32 C. maxima GST proteins based on their homology to Arabidopsis proteins, to identify their putative functional and physical roles (Figure 5). CmaGSTU2, CmaGSTU7, CmaGSTU8, and CmaGSTU9 showed high homology to AtGSTU7, which is involved in cold stress [62]. AtGSTU7 is also closely related to AtGSTU19 and AtGSTU25, which are associated with the response to chilling, salicylic acid, and H2O2 stress. The phi (CmaGSTF1, CmaGSTF2, and CmaGSTF1), EF1G (CmaEF1G1, CmaEF1G2, and CmaEF1G3), zeta (CmaGSTZ1 and CmaGSTZ2), and theta (CmaGSTT1 and CmaGSTT2) proteins are highly homologous to Arabidopsis AtGSTF8, AT1G09640, AtGSTZ1, and AtGSTT1, respectively, which are associated with responses to a range of stresses and signals, including H2O2, salicylic acid, and bacterial pathogens. Arabidopsis proteins AtGSTU19, AtGSTU25, AtGSTL3, At5G12110, At1G07940, AteEF-1Bb1, AT5G19510, AT2G18110, and AtGSTZ2 are also involved in the protein interaction network (Figure 5).

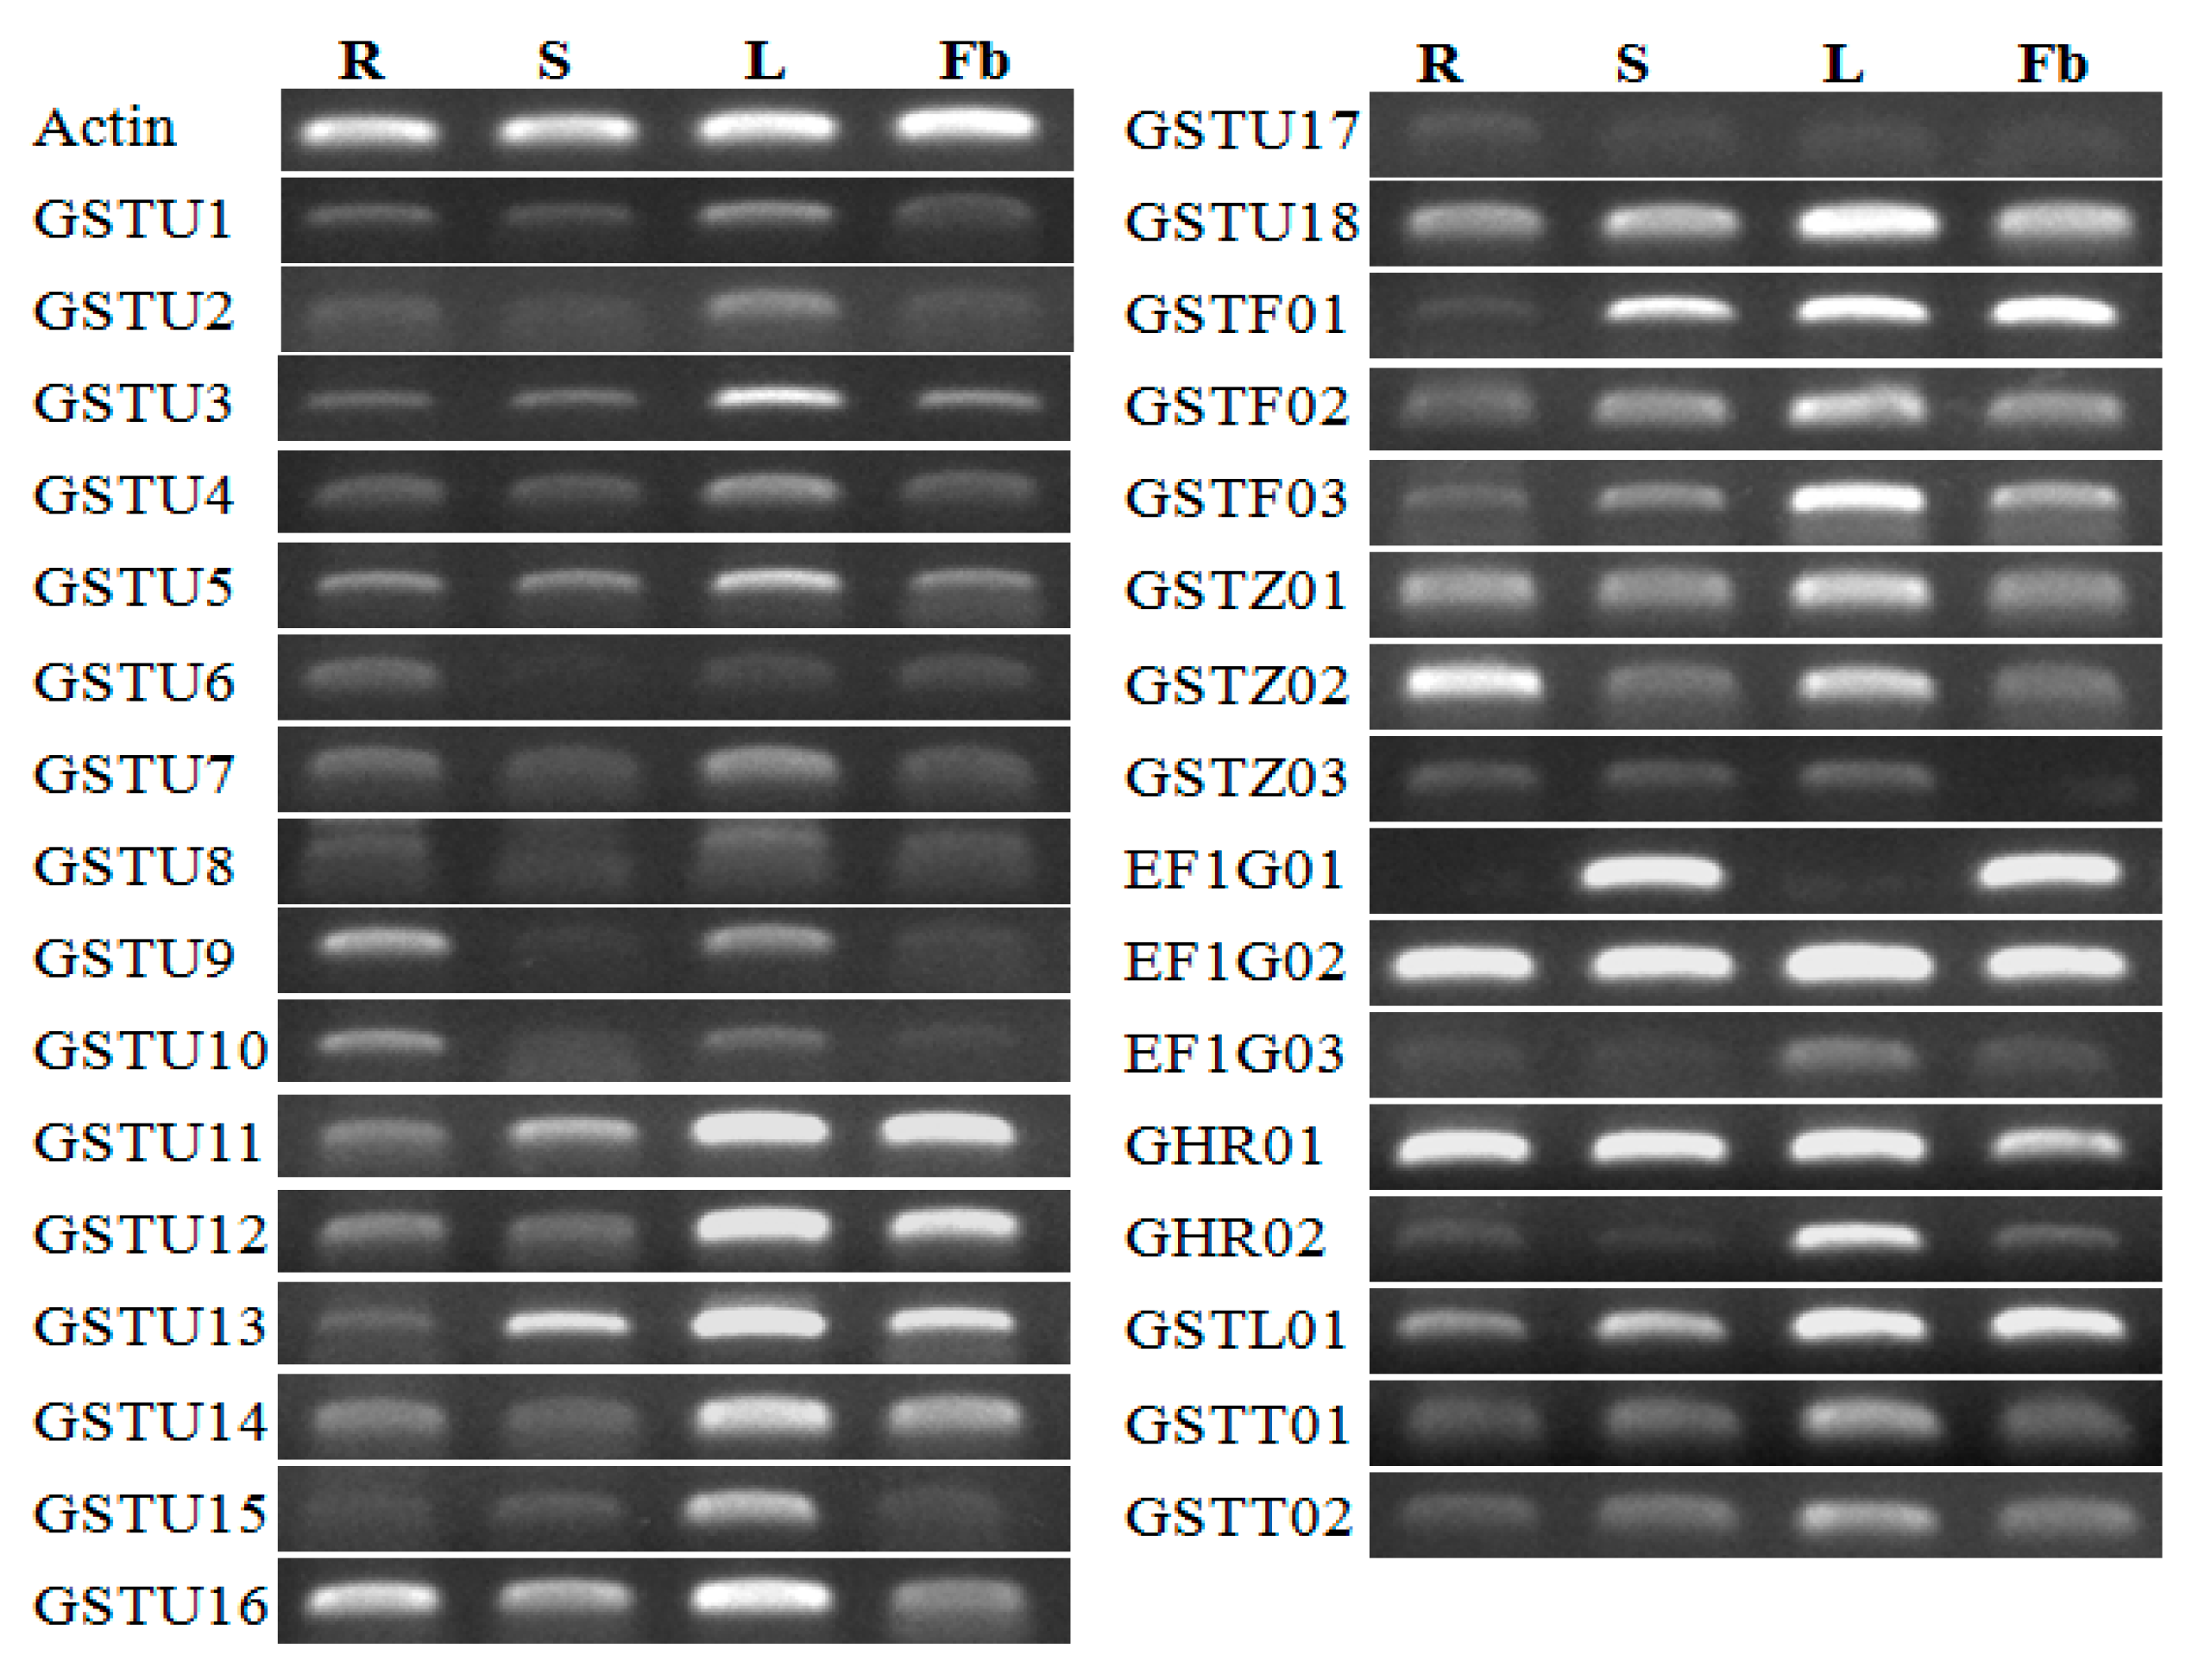
3.6. Expression Profiles of CmaGST Genes in Various Organs

We performed RT-PCR to analyze the expression patterns of the CmaGST genes in different organs (root, stem, leaf, and flower buds) of healthy C. maxima plants. Most of the CmaGST genes were abundantly expressed in all tested organs (Figure 6), although CmaGSTU17 was weakly expressed in all tested organs. CmaGSTU15, CmaEF1G03, and CmaGHR02 were highly expressed in the leaf relative to the other organs. CmaGSTZ03 was expressed in all organs except the flower buds, while CmaEF1G01 expression was absent from the root and leaf. CmaGSTU6 and CmaGSTU9 were expressed in the root, leaf, and flower buds, but not in the stem. Moreover, CmaGSTU2, CmaGSTU8, and CmaGSTU10 were expressed in all organs but only very weakly in the stem and flower buds (Figure 6).

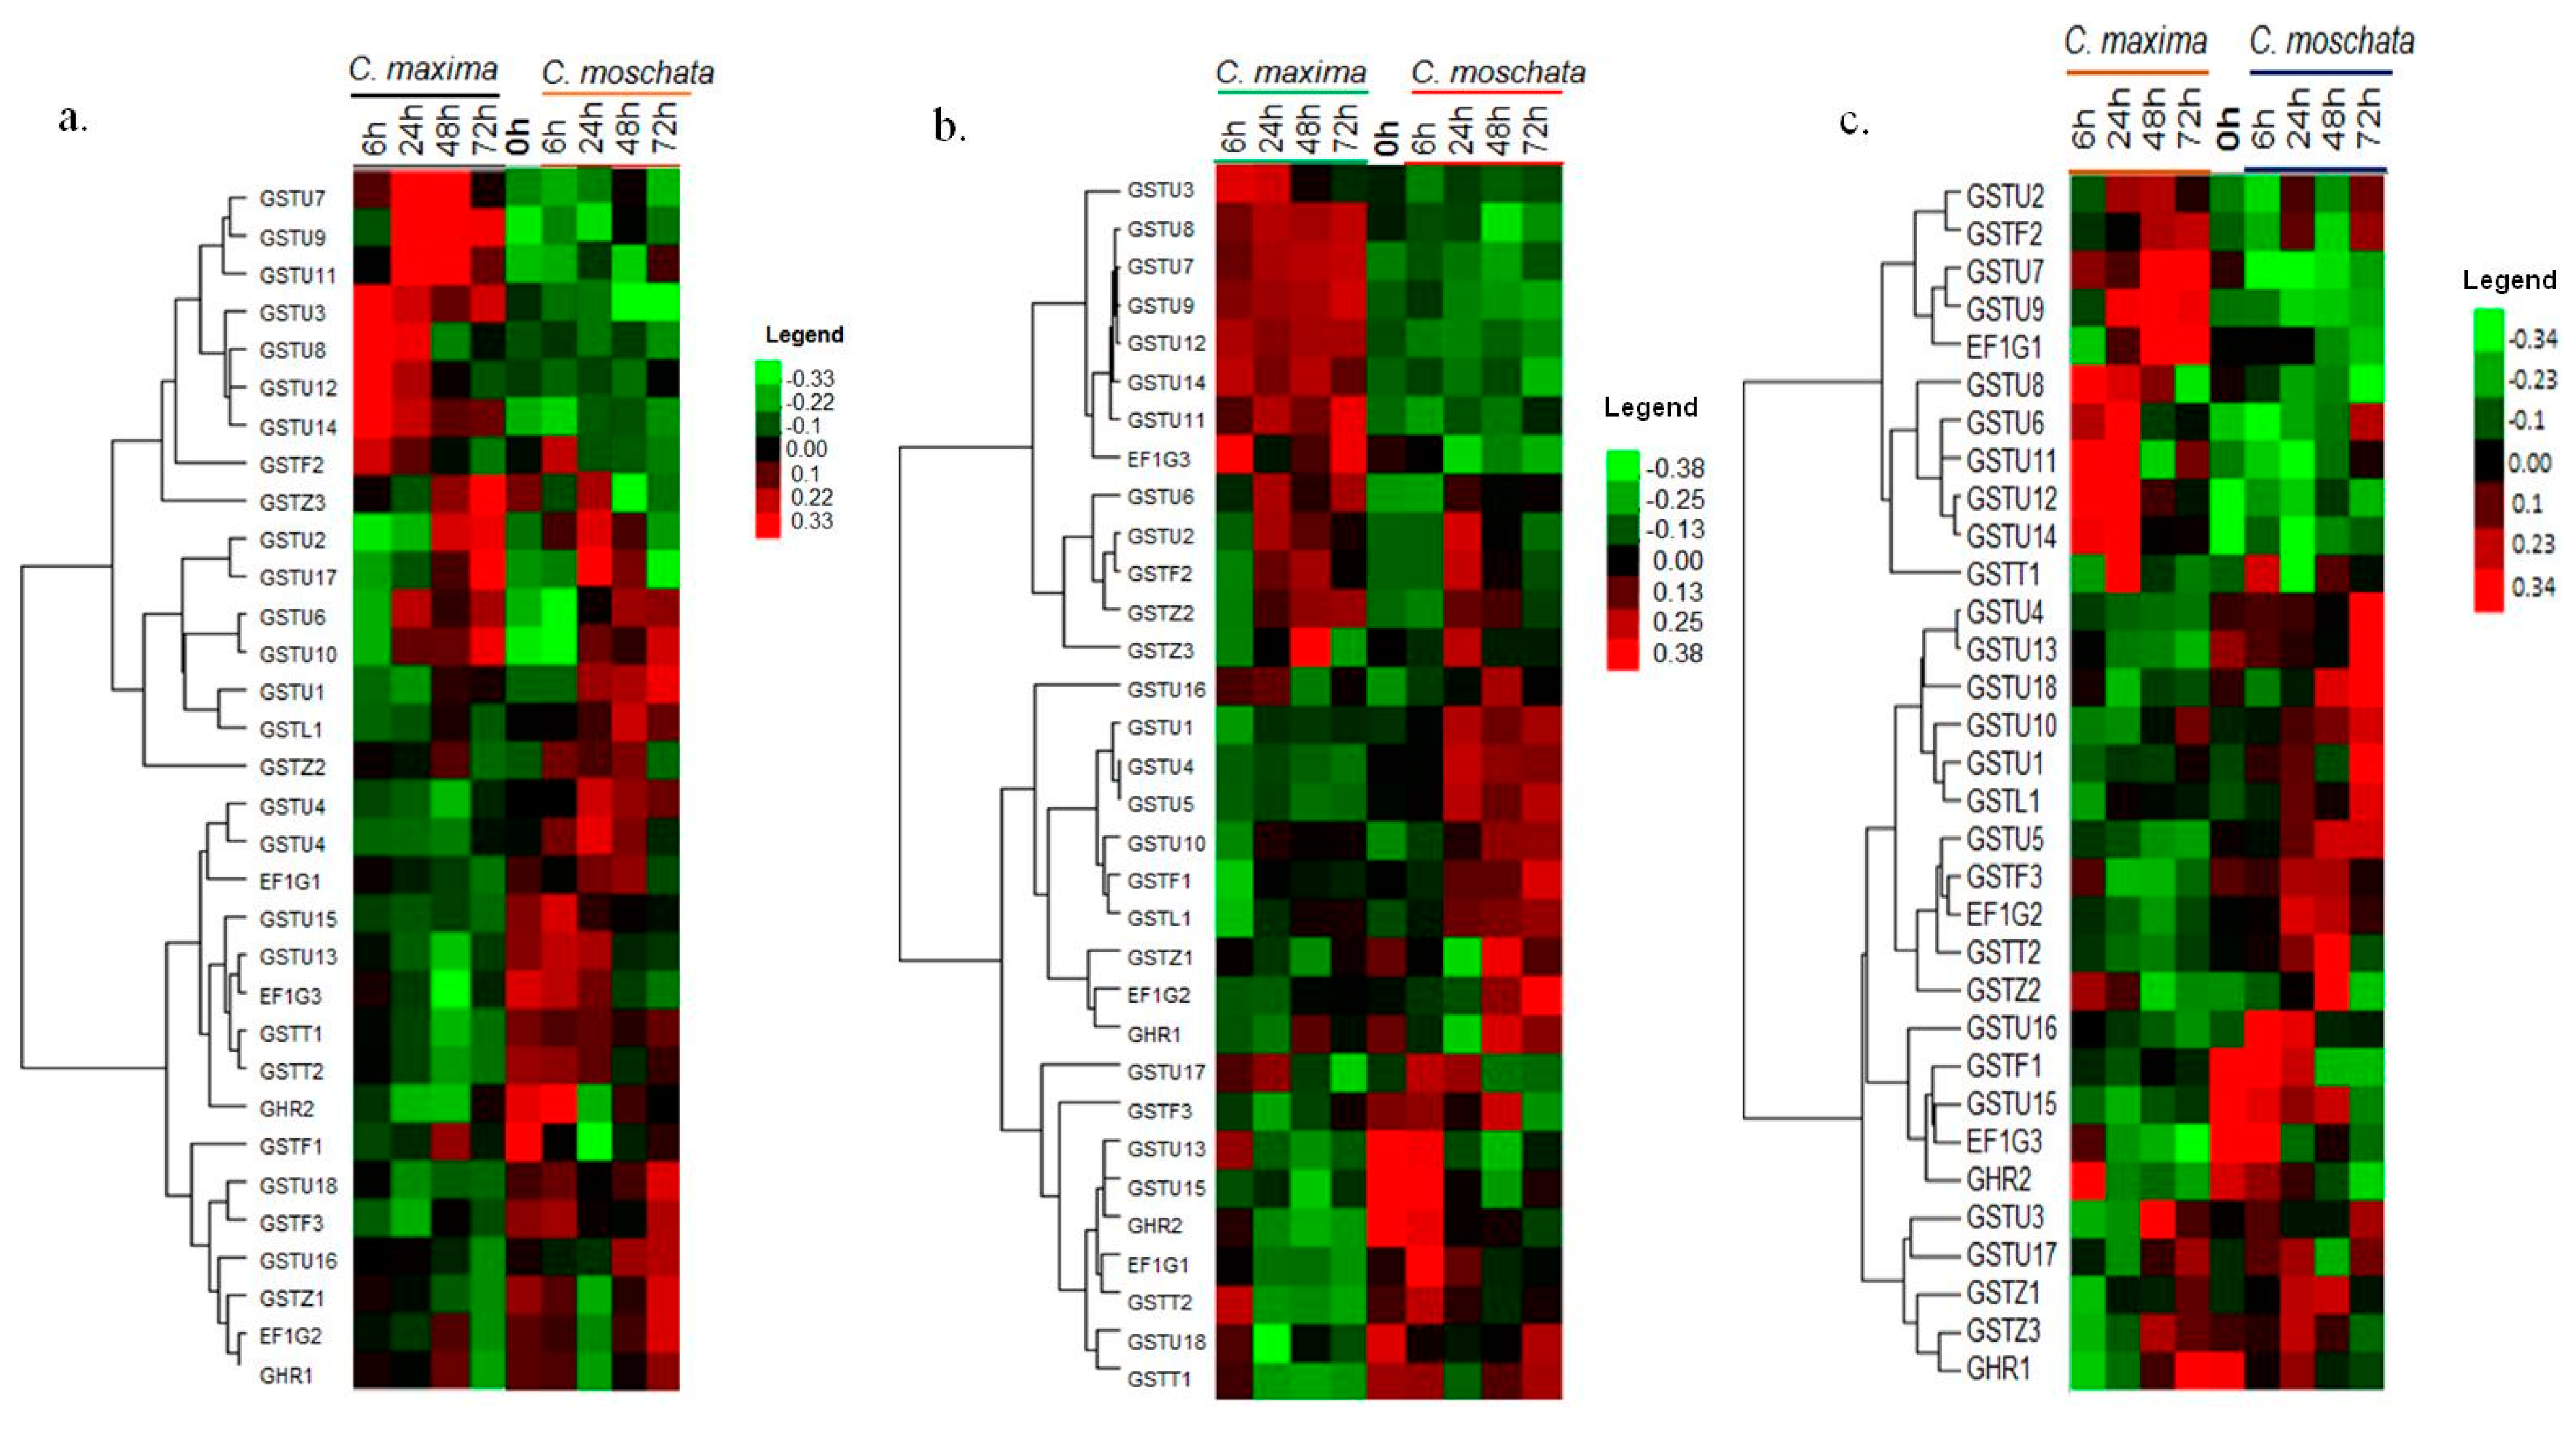
3.7. Expression Profiling of the CmaGST Genes during Cold Treatment

Moderately cold-tolerant C. maxima and cold-susceptible C. moschata lines were treated with different temperatures (5 °C, 10 °C, and 15 °C) to elucidate the expression patterns of the CmaGST genes in response to cold stress. A qPCR analysis revealed that the majority of CmaGST genes were down-regulated in C. maxima during the 5 °C treatment (Figure 7a, and Figures S4a and S5a); however, CmaGSTU3, CmaGSTU8, CmaGSTU12,and CmaGSTU14 had 8-, 6-, 11-, and 8-fold higher expressions, respectively, after 6 h. CmaGSTU7, CmaGSTU9,and CmaGSTU11 exhibited 4-, 5-, and 2-fold higher expressions, respectively, in C. maxima compared with C. moschata after 24 h at 5 °C. CmaGSTU10, CmaGSTU17, and CmaGSTZ2 were up-regulated in both species after 24 h at 5 °C (Figure 7a and Figure S4a,b); however, the majority of the CmaGST genes were down-regulated (Figure S5b). In contrast, CmaGSTU1, CmaGSTU4, CmaGSTU5, and CmaGSTL1 showed 16-, 15-, 14-, and 5-fold higher expression levels, respectively, in C. moschata compared with C. maxima after 24 h of treatment at 5 °C; however, their expression levels declined over time (Figure 7a and Figure S4b)
A total of nine CmaGST genes showed significantly higher expression levels in C. maxima compared with C. moschata after 6 h at 10 °C. Among them, CmaGSTU3, CmaGSTU7, CmaGSTU8, CmaGSTU9, CmaGSTU11, CmaGSTU12, and CmaGSTU14 had more than a 10-fold higher expression in the cold-tolerant line than the susceptible line. Four genes, CmaGSTU7, CmaGSTU8, CmaGSTU9, and CmaGSTU11, exhibited 10-, 12-, 14-, and 10-fold higher levels of expression, respectively, in C. maxima than in C. moschata after 24 h at 10 °C (Figure 7b and Figure S4c,d). In the cold-susceptible line, the expression levels of CmaGSTU1, CmaGSTU4, CmaGSTU5, and CmaGSTL1 were 22-, 30-, 28-, and 6-fold higher than the cold-resistant cultivar at 24 h and 48 h (Figure S4d). The rest of the genes did not have significantly different levels of expression at any time point in C. maxima or C. moschata, except for the EF1G3 and GSTT2 genes at the 6 h time point (Figure S5c,d).
During the 15 °C temperature treatment, seven genes were up-regulated in the cold-tolerant line compared with the susceptible line, with expression changes of 6-fold at 6 h for CmaGST6, 12-fold at 24 h for CmaGST7, 10-fold at 6 h for CmaGST8, 4-fold at 24 h for CmaGST9, 14-fold at 6 h for CmaGST11, 8-fold at 24 h for CmaGST12, and 7-fold at 24 h for CmaGST14 (Figure 7c and Figure S4e). By contrast, seven CmaGST genes (CmaGSTU1, CmaGSTU4, CmaGSTU5, CmaGSTU10, CmaGSTF2, CmaGSTZ2, and CmaGSTL1) in the susceptible line were significantly up-regulated at the 48 h time point and drastically decreased at the 72 h time point in C. moschata (Figure 7c and Figure S4f). After 48 h at 15 °C, the majority of genes were up-regulated in C. moschata compared with C. maxima, although some genes showed very low levels of expression or did not have a significant response to the 15 °C treatment in C. maxima and C. moschata (Figure 7c and Figure S5e,f).

4. Discussion

The GST genes play key roles in plant growth and stress responses [59,63,64,65]. Plants have a high number of GSTs categorized into 14 classes [11], which can have constitutive or tissue-specific expression, or be induced by biotic and abiotic stresses. In our study, 32 full-length GST genes were identified in pumpkin and evaluated through various in silico approaches. The phylogenetic analysis revealed high level of similarities within the same classes of GSTs in four plant species, pumpkin, cucumber, Arabidopsis, and rice (Figure 2), which indicates that these classes evolved before the monocot–dicot divergence. Pumpkin has more GST genes than soybean (Glycine max) [66], but fewer than Arabidopsis [62], rice [67], sweet orange (Citrus sinensis) [68] and maize (Zea mays) [66]. Gene family expansion in plants often arises as a result of tandem duplications, segmental duplications, whole-genome duplications, and inter-specific hybridizations, and can facilitate the evolution of functional diversity [69]. We identified seven pairs of segmental- and four pairs of tandem-duplicated tau-class genes, representing 44% of the tau GSTs (Figure 3 and Table 2). Only one duplicated gene pair was found in each of the theta and zeta classes, whereas the EF1G class contained three gene pairs that evolved by segmental duplication (100% of EF1G-class genes). We calculated the Ka, Ks, and Ka/Ks values of the duplicated gene pairs, providing an estimate of their selection history. Fifteen of the 16 duplicated CmaGST gene pairs had Ka/Ks values less than 0.8 (Table 2), suggesting that majority of gene pairs evolved through purifying selection.
In the protein association networks, CmaGSTU2, CmaGSTU7, CmaGSTU8, and CmaGSTU9 showed similarity to GSTU7 in Arabidopsis (Figure 5), which is involved in the response to abiotic (chilling and hypoxia) and biotic (fungal and bacterial) stresses [62,70]. CmaGSTU14, CmaGSTU15, and CmaGSTU16 were predicted to have similar functions to AtGSTU19, while CmaGSTU12 and CmaGSTU17 were associated with AtGSTU25, and were predicted to have a strong interaction with the homologs of AtGSTU7. From these results, we speculated that nine CmaGSTs (CmaGSTU2, CmaGSTU7, CmaGSTU8, CmaGSTU9, CmaGSTU12, CmaGSTU13, CmaGSTU15, CmaGSTU16, and CmaGSTU17) might be involved in the response to cold, fungal, and bacterial stresses. By contrast, CmaGSTF1, CmaGSTF2, and CmaGSTF3 were more functionally related to AtGSTF8 (Figure 5), which also has functions in the response to chilling, bacterial, and fungal stresses [3,62]. Theta and zeta classes of GSTs have glutathione peroxidase activity [4] and the ability to reduce cytotoxic hydroperoxides. Glutathione reductase reduces glutathione levels by catalyzing the glutathione disulfide into the sulfhydryl [71], providing a substrate for the GSTs. They play a role in the cellular detoxification process through facilitating a conjugation reaction; and are also associated with other cellular proteins or pathways involved in detoxification.
All CmaGST genes were differentially expressed in different organs (Figure 6). Only one gene (CmaEF1G01) was expressed exclusively in the stem and flower buds. In contrast, CmaGSTU6 and CmaGSTU9 were not expressed in the stem and CmaGSTZ03 was not expressed in the flower buds, suggesting that they might not be responsible for the development of these respective organs (Figure 6). The rest of the GST genes were expressed in all tested organs, consistent with the organ-specific microarray expression data of the AtGSTs [12], tomato (Solanum lycopersicum) GSTs [63], and OsGSTs [67].
The CmaGSTs were also differentially expressed in cold-tolerant and cold-susceptible lines following treatments with various cold temperatures. Seven genes (CmaGSTU3, CmaGSTU7, CmaGSTU8, CmaGSTU9, CmaGSTU11, CmaGSTU12, and CmaGSTU14) were up-regulated in the cold-tolerant line compared with the cold-susceptible line after 6 h or 24 h of treatment with cold temperatures (Figure 7a–c) and might therefore be putative candidates for breeding cold-tolerant pumpkins. Similarly, in cold-stress treatments in cabbage (Brassica oleracea), BoGSTU19, BoGSTU24, and BoGSTF10 were identified as putative candidate genes involved in cold-stress tolerance, as they were more highly expressed in the cold-tolerant line (Bo106) than the cold-susceptible line (Bo107) [59]. Sappl et al. [62] reported that AtGSTU7 was significantly up-regulated after 3 h of chilling stress. Dalton et al. [72] reported that the GSTs are involved in physiological flexibility and resistance to various biotic and abiotic stresses in plants. The seven putative candidate CamGST genes involved in the cold response contained highly cold stress responsive cis-acting elements (Table S3). Plant cells sense cold stress via membrane rigidification, as well as through changes metabolite concentration, initiating the primary signals, such as ABA, Ca2+, nitric oxide (NO) [73], and ROS, to induce a variety of responses, like stomatal closure. The GST and GPX proteins are known to be highly induced during ROS formation, enabling the detoxification of lipid peroxides and DNA degradation products, and removing ROS. During cold stress, the cellular levels of ROS increase and act as a secondary messengers, inducing programmed cell death [74]; however, ROS also induce the MAPKK (mitogen-activated protein kinase kinase) proteins, which can activate defensive genes to induce conjugation processes, including the processing of GSH by GST enzymes, which becomes localized in the vacuole by transporters (ABC transporter cascade) for degradation.
CmaGSTU2, CmaGSTU6, CmaGSTU10, CmaGSTU17, CmaGSTF2, and CmaGSTZ2 expression was up-regulated by the cold treatments in both the cold-tolerant and -susceptible lines (Figure 7a–c), suggesting that these six genes are not affected by any internal variable factors. Four GST genes (CmaGSTU1, CmaGSTU4, CmaGSTU5, and CmaGSTL1) were highly expressed in the cold-susceptible line than the cold-tolerant one, which might result in the cold susceptibility of this plant (Figure 7a–c); therefore, these genes might be the putative candidates for developing cold-tolerant pumpkin cultivars via gene editing/anti-sense technique or molecular genetics technologies. These genes might play differential roles in the signal transduction pathways and/or cooperate with other genes to form networks that defend plants against adverse environmental conditions.

5. Conclusions

In conclusion, this is the first report of the genome-wide identification, characterization, and expression profiling of the GSTs in pumpkin. We systematically analyzed the C. maxima genome, identified 32 GSTs, and characterized those using bioinformatics and expression analyses in response to cold (5 °C, 10 °C, and 15 °C) stresses. Seven (CmaGSTU3, CmaGSTU7, CmaGSTU8, CmaGSTU9, CmaGSTU11, CmaGSTU12, and CmaGSTU14) of the 32 GST genes were more highly expressed in the cold-tolerant cultivar (C. maxima) than in the cold-susceptible cultivar (C. moschata) during cold stress and might therefore be useful for developing cold-tolerant cultivars through conventional, molecular, or transgenic breeding approaches. The comprehensive expression analysis in response to cold stress in pumpkin provided novel information regarding the cold-related physiological roles of the CmaGST genes, which could enhance the selection of potential genes utilized for marker-assisted breeding and/or the engineering of transgenic plants with increased cold tolerance in future research.

Supplementary Materials

The following are available online at https://www.mdpi.com/2073-4425/9/2/84/s1, Figure S1: Sequence and structural analysis of pumpkin GST proteins with Arabidopsis, Rice and Populus trichocarpa GSTs; Figure S2: Genomic structures of GST genes of Cucurbita maxima.; Figure S3: Schematic representation of motif compositions in the GST sequences; Figure S4: Expression patterns of the CmaGST genes under various temperature treatments; Figure S5: Expression patterns of CmaGST genes under various temperature treatments; Table S1: List of GSTs from different species with their amino acid sequences used for phylogenetic analysis; Table S2: Primer sequence used for real time and reverse transcription polymerase chain reaction (RT-PCR) of GST genes of C. maxima; Table S3: Putative cis-elements, more than 4 bp, were identified in 32 CmaGST genes in C. maxima using Place Web Signal Scan.

Acknowledgments

This research was supported by the Golden Seed Project (Center for Horticultural Seed Development, No. 213007-05-2-CG100), the Ministry of Agriculture, Food and Rural Affairs (MAFRA), the Ministry of Oceans and Fisheries (MOF), the Rural Development Administration (RDA), and the Korea Forest Service (KFS), Republic of Korea.

Author Contributions

I.-S.N., J.-I.P., J.Y.S. and M.A.K. formulated the concept and designed the research. M.A.K. performed the research, analyzed the real-time data, and drafted the manuscript. U.K.N. conducted the statistical analysis, and extensively revised, polished and finalized this manuscript. M.K.B., E.K.C. and H.-T.K. performed the in silico analysis. All authors read and approved the final manuscript.

Conflicts of Interest

Eung Kyoo Choi is an employee of Jangchun Seed Company. He declares no conflict of interest from him or his company side to publish this manuscript.

References

  1. Dixon, D.P.; Lapthorn, A.; Edwards, R. Plant glutathione transferases. Genome Biol. 2002, 3. [Google Scholar] [CrossRef] [Green Version]
  2. Edwards, R.; Dixon, D.P.; Walbot, V. Plant glutathione S-transferases: Enzymes with multiple functions in sickness and in health. Trends Plant Sci. 2000, 5, 193–198. [Google Scholar] [CrossRef]
  3. Wagner, U.; Edwards, R.; Dixon, D.P.; Mauch, F. Probing the diversity of the Arabidopsis glutathione S-transferase gene family. Plant Mol. Biol. 2002, 49, 515–532. [Google Scholar] [CrossRef] [PubMed]
  4. Dixon, D.P.; Cummins, I.; Cole, D.J.; Edwards, R. Glutathione-mediated detoxification systems in plants. Curr. Opin. Plant Biol. 1998, 1, 258–266. [Google Scholar] [CrossRef]
  5. Chronopoulou, E.; Kontouri, K.; Chantzikonstantinou, M.; Pouliou, F.; Perperopoulou, F.; Voulgari, G.; Bosmali, E.; Axarli, I.; Nianiou-Obeidat, I.; Madesis, P. Plant glutathione transferases: Structure, antioxidant catalytic function and in planta protective role in biotic and abiotic stress. Curr. Chem. Biol. 2014, 8, 58–75. [Google Scholar] [CrossRef]
  6. Esmaeili, M.; Shahrtash, M.; Moosavi, F.; Mohsenzadeh, S.; Mohabatkar, H. Plant glutathione S-transferase function. In Proceedings of the 6th National Biotechnology Congress of Iran, Tehran, Iran, 13 August 2009. [Google Scholar]
  7. Liu, S.; Liu, Y.; Yang, X.; Tong, C.; Edwards, D.; Parkin, I.A.; Zhao, M.; Ma, J.; Yu, J.; Huang, S. The Brassica oleracea genome reveals the asymmetrical evolution of polyploid genomes. Nat. Commun. 2014, 5, 3930. [Google Scholar] [CrossRef] [PubMed]
  8. Kitamura, S.; Shikazono, N.; Tanaka, A. TRANSPARENT TESTA 19 is involved in the accumulation of both anthocyanins and proanthocyanidins in Arabidopsis. Plant J. 2004, 37, 104–114. [Google Scholar] [CrossRef] [PubMed]
  9. Alfenito, M.R.; Souer, E.; Goodman, C.D.; Buell, R.; Mol, J.; Koes, R.; Walbot, V. Functional complementation of anthocyanin sequestration in the vacuole by widely divergent glutathione S-transferases. Plant Cell 1998, 10, 1135–1149. [Google Scholar] [CrossRef] [PubMed]
  10. Jiang, H.-W.; Liu, M.-J.; Chen, C.; Huang, C.-H.; Chao, L.-Y.; Hsieh, H.-L. A glutathione S-transferase regulated by light and hormones participates in the modulation of arabidopsis seedling development. Plant Physiol. 2010, 154, 1646–1658. [Google Scholar] [CrossRef] [PubMed]
  11. Nianiou-Obeidat, I.; Madesis, P.; Kissoudis, C.; Voulgari, G.; Chronopoulou, E.; Tsaftaris, A.; Labrou, N.E. Plant glutathione transferase-mediated stress tolerance: Functions and biotechnological applications. Plant Cell Rep. 2017, 36, 791–805. [Google Scholar] [CrossRef] [PubMed]
  12. Dixon, D.P.; Edwards, R. Glutathione transferases. Arabidopsis Book 2010, e0131. [Google Scholar] [CrossRef] [PubMed]
  13. Puglisi, I.; Cicero, L.L.; Lo Piero, A.R. The glutathione S-transferase gene superfamily: An in silico approach to study the post translational regulation. Biodegradation 2013, 24, 471–485. [Google Scholar] [CrossRef] [PubMed]
  14. Kilili, K.G.; Atanassova, N.; Vardanyan, A.; Clatot, N.; Al-Sabarna, K.; Kanellopoulos, P.N.; Makris, A.M.; Kampranis, S.C. Differential roles of tau class glutathione S-transferases in oxidative stress. J. Biol. Chem. 2004, 279, 24540–24551. [Google Scholar] [CrossRef] [PubMed]
  15. Zhao, F.; Zhang, H. Expression of Suaeda salsa glutathione S-transferase in transgenic rice resulted in a different level of abiotic stress resistance. J. Agric. Sci. 2006, 144, 547–554. [Google Scholar] [CrossRef]
  16. Ji, W.; Zhu, Y.; Li, Y.; Yang, L.; Zhao, X.; Cai, H.; Bai, X. Over-expression of a glutathione S-transferase gene, GSGST, from wild soybean (Glycine soja) enhances drought and salt tolerance in transgenic tobacco. Biotechnol. Lett. 2010, 32, 1173–1179. [Google Scholar] [CrossRef] [PubMed]
  17. Kampranis, S.C.; Damianova, R.; Atallah, M.; Toby, G.; Kondi, G.; Tsichlis, P.N.; Makris, A.M. A novel plant glutathione S-transferase/peroxidase suppresses Bax lethality in yeast. J. Bio. Chem. 2000, 275, 29207–29216. [Google Scholar] [CrossRef] [PubMed]
  18. Frova, C. The plant glutathione transferase gene family: Genomic structure, functions, expression and evolution. Physiol. Plant. 2003, 119, 469–479. [Google Scholar] [CrossRef]
  19. Lo Piero, A.R.; Mercurio, V.; Puglisi, I.; Petrone, G. Different roles of functional residues in the hydrophobic binding site of two sweet orange tau glutathione S-transferases. FEBS J. 2010, 277, 255–262. [Google Scholar] [CrossRef] [PubMed]
  20. Cicero, L.L.; Madesis, P.; Tsaftaris, A.; Lo Piero, A.R. Tobacco plants over-expressing the sweet orange tau glutathione transferases (CsGSTUs) acquire tolerance to the diphenyl ether herbicide fluorodifen and to salt and drought stresses. Phytochemistry 2015, 116, 69–77. [Google Scholar] [CrossRef] [PubMed]
  21. Dixon, D.P.; Hawkins, T.; Hussey, P.J.; Edwards, R. Enzyme activities and subcellular localization of members of the Arabidopsis glutathione transferase superfamily. J. Exp. Bot 2009, 60, 1207–1218. [Google Scholar] [CrossRef] [PubMed]
  22. Lan, T.; Yang, Z.-L.; Yang, X.; Liu, Y.-J.; Wang, X.-R.; Zeng, Q.-Y. Extensive functional diversification of the Populus glutathione S-transferase supergene family. Plant Cell 2009, 21, 3749–3766. [Google Scholar] [CrossRef] [PubMed]
  23. Moons, A. Regulatory and functional interactions of plant growth regulators and plant glutathione S-transferases (GSTs). Vitam. Horm. 2005, 72, 155–202. [Google Scholar] [PubMed]
  24. Lallement, P.-A.; Brouwer, B.; Keech, O.; Hecker, A.; Rouhier, N. The still mysterious roles of cysteine-containing glutathione transferases in plants. Front. Pharmacol. 2014, 5, 192. [Google Scholar] [CrossRef] [PubMed]
  25. Dixon, D.P.; Cole, D.J.; Edwards, R. Characterisation of a zeta class glutathione transferase from Arabidopsis thaliana with a putative role in tyrosine catabolism. Arch. Biochem. Biophys 2000, 384, 407–412. [Google Scholar] [CrossRef] [PubMed]
  26. Anderson, J.V.; Davis, D.G. Abiotic stress alters transcript profiles and activity of glutathione S-transferase, glutathione peroxidase, and glutathione reductase in Euphorbia esula. Physiol. Plant. 2004, 120, 421–433. [Google Scholar] [CrossRef] [PubMed]
  27. Dixon, D.P.; Edwards, R. Roles for stress-inducible lambda glutathione transferases in flavonoid metabolism in plants as identified by ligand fishing. J. Biol. Chem. 2010, 285, 36322–36329. [Google Scholar] [CrossRef] [PubMed]
  28. Dixon, D.P.; Davis, B.G.; Edwards, R. Functional divergence in the glutathione transferase superfamily in plants identification of two classes with putative functions in redox homeostasis in Arabidopsis thaliana. J. Biol. Chem. 2002, 277, 30859–30869. [Google Scholar] [CrossRef] [PubMed]
  29. Yadav, S.K. Cold stress tolerance mechanisms in plants. A review. Agron. Sustain. Dev. 2010, 30, 515–527. [Google Scholar] [CrossRef]
  30. Thomashow, M.F. Plant cold acclimation: Freezing tolerance genes and regulatory mechanisms. Ann. rev. Plant Biol. 1999, 50, 571–599. [Google Scholar] [CrossRef] [PubMed]
  31. Yamaguchi-Shinozaki, K.; Shinozaki, K. Organization of cis-acting regulatory elements in osmotic-and cold-stress-responsive promoters. Trends Plant Sci. 2005, 10, 88–94. [Google Scholar] [CrossRef] [PubMed]
  32. Lee, B.-h.; Lee, H.; Xiong, L.; Zhu, J.-K. A mitochondrial complex I defect impairs cold-regulated nuclear gene expression. Plant Cell 2002, 14, 1235–1251. [Google Scholar] [CrossRef] [PubMed]
  33. Anderson, J.V.; Li, Q.-B.; Haskell, D.W.; Guy, C.L. Structural organization of the spinach endoplasmic reticulum-luminal 70-kilodalton heat-shock cognate gene and expression of 70-kilodalton heat-shock genes during cold acclimation. Plant Physiol. 1994, 104, 1359–1370. [Google Scholar] [CrossRef] [PubMed]
  34. Thamilarasan, S.K.; Park, J.-I.; Jung, H.-J.; Nou, I.-S. Genome-wide analysis of the distribution of Ap2/Erf transcription factors reveals duplication and cbfs genes elucidate their potential function in Brassica oleracea. BMC Genom. 2014, 15, 422. [Google Scholar] [CrossRef] [PubMed]
  35. Janská, A.; Maršík, P.; Zelenková, S.; Ovesná, J. Cold stress and acclimation–what is important for metabolic adjustment? Plant Biol. 2010, 12, 395–405. [Google Scholar] [CrossRef] [PubMed]
  36. Kousik, C.S.; Levi, A.; Wehner, T.C.; Maynard, D.N. Cucurbitaceae (vine crops). eLS 2015. [Google Scholar] [CrossRef]
  37. Lee, J.-M.; Kubota, C.; Tsao, S.; Bie, Z.; Echevarria, P.H.; Morra, L.; Oda, M. Current status of vegetable grafting: Diffusion, grafting techniques, automation. Sci. Hortic. 2010, 127, 93–105. [Google Scholar] [CrossRef]
  38. Cucurbita maxima (Rimu) Genome. Cucurbit Genomics Database. Available online: http://cucurbitgenomics.org/search/genome/8 (accessed on 20 November 2017).
  39. Letunic, I.; Bork, P. 20 years of the SMART protein domain annotation resource. Nucleic Acids Res. 2017, 46, D493–D496. [Google Scholar] [CrossRef] [PubMed]
  40. Marchler-Bauer, A.; Bo, Y.; Han, L.; He, J.; Lanczycki, C.J.; Lu, S.; Chitsaz, F.; Derbyshire, M.K.; Geer, R.C.; Gonzales, N.R. CDD/SPARCLE: functional classification of proteins via subfamily domain architectures. Nucleic Acids Res. 2017, 45, D200–D203. [Google Scholar] [CrossRef] [PubMed]
  41. Gasteiger, E.; Hoogland, C.; Gattiker, A.; Wilkins, M.R.; Appel, R.D.; Bairoch, A. Protein identification and analysis tools on the ExPASsy server. In The Proteomics Protocols Handbook; Humana Press: New York, NY, USA, 2005; pp. 571–607. [Google Scholar]
  42. Chou, K.-C.; Shen, H.-B. Plant-mPLoc: A top-down strategy to augment the power for predicting plant protein subcellular localization. PLoS ONE 2010, 5, e11335. [Google Scholar] [CrossRef] [PubMed]
  43. McWilliam, H.; Li, W.; Uludag, M.; Squizzato, S.; Park, Y.M.; Buso, N.; Cowley, A.P.; Lopez, R. Analysis tool web services from the EMBL-EBI. Nucleic acids Res. 2013, 41, W597–W600. [Google Scholar] [CrossRef] [PubMed]
  44. Bailey, T.L.; Boden, M.; Buske, F.A.; Frith, M.; Grant, C.E.; Clementi, L.; Ren, J.; Li, W.W.; Noble, W.S. MEME SUITE: Tools for motif discovery and searching. Nucleic Acids Res. 2009, 37, W202–W208. [Google Scholar] [CrossRef] [PubMed]
  45. Hu, B.; Jin, J.; Guo, A.-Y.; Zhang, H.; Luo, J.; Gao, G. GSDS 2.0: An upgraded gene feature visualization server. Bioinformatics 2014, 31, 1296–1297. [Google Scholar] [CrossRef] [PubMed]
  46. Higo, K.; Ugawa, Y.; Iwamoto, M.; Korenaga, T. Plant cis-acting regulatory DNA elements (PLACE) database: 1999. Nucleic Acids Res. 1999, 27, 297–300. [Google Scholar] [CrossRef] [PubMed]
  47. The Arabidopsis Information Resource (TAIR). Available online: https:// www.arabidopsis.org (accessed on 18 November 2017).
  48. Rice Genome Annotation Project. Available online: http://rice.plantbiology.msu.edu (accessed on 22 November 2017).
  49. Tamura, K.; Stecher, G.; Peterson, D.; Filipski, A.; Kumar, S. MEGA6: Molecular evolutionary genetics analysis version 6.0. Mol. Biol. Evol. 2013, 30, 2725–2729. [Google Scholar] [CrossRef] [PubMed]
  50. Voorrips, R. MapChart: Software for the graphical presentation of linkage maps and QTLs. J. Heredity 2002, 93, 77–78. [Google Scholar] [CrossRef]
  51. Altschul, S.F.; Gish, W.; Miller, W.; Myers, E.W.; Lipman, D.J. Basic local alignment search tool. J. Mol. Biol. 1990, 215, 403–410. [Google Scholar] [CrossRef]
  52. Kong, X.; Lv, W.; Jiang, S.; Zhang, D.; Cai, G.; Pan, J.; Li, D. Genome-wide identification and expression analysis of calcium-dependent protein kinase in maize. BMC Genom. 2013, 14, 433. [Google Scholar] [CrossRef] [PubMed]
  53. Holub, E.B. The arms race is ancient history in Arabidopsis, the wildflower. Nat. Rev. Genet. 2001, 2, 516–527. [Google Scholar] [CrossRef] [PubMed]
  54. Nei, M.; Gojobori, T. Simple methods for estimating the numbers of synonymous and nonsynonymous nucleotide substitutions. Mol. Biol. Evol. 1986, 3, 418–426. [Google Scholar] [PubMed]
  55. Koch, M.A.; Haubold, B.; Mitchell-Olds, T. Comparative evolutionary analysis of chalcone synthase and alcohol dehydrogenase loci in Arabidopsis, Arabis, and related genera (Brassicaceae). Mol. Biol. Evol. 2000, 17, 1483–1498. [Google Scholar] [CrossRef] [PubMed]
  56. Krzywinski, M.; Schein, J.; Birol, I.; Connors, J.; Gascoyne, R.; Horsman, D.; Jones, S.J.; Marra, M.A. Circos: An information aesthetic for comparative genomics. Genome Res 2009, 19, 1639–1645. [Google Scholar] [CrossRef] [PubMed]
  57. Guo, P.; Baum, M.; Grando, S.; Ceccarelli, S.; Bai, G.; Li, R.; Von Korff, M.; Varshney, R.K.; Graner, A.; Valkoun, J. Differentially expressed genes between drought-tolerant and drought-sensitive barley genotypes in response to drought stress during the reproductive stage. J. Exp. Bot. 2009, 60, 3531–3544. [Google Scholar] [CrossRef] [PubMed]
  58. Cluster 3.0 Open source clustering software. Available online: http://bonsai.hgc.jp/~mdehoon/software/cluster/software.htm#ctv (accessed on 4 February 2018).
  59. Vijayakumar, H.; Thamilarasan, S.K.; Shanmugam, A.; Natarajan, S.; Jung, H.-J.; Park, J.-I.; Kim, H.; Chung, M.-Y.; Nou, I.-S. Glutathione transferases superfamily: Cold-inducible expression of distinct GST genes in Brassica oleracea. Int. J. Mol. Sci. 2016, 17, 1211. [Google Scholar] [CrossRef] [PubMed]
  60. Lynch, M.; Conery, J.S. The evolutionary fate and consequences of duplicate genes. Science 2000, 290, 1151–1155. [Google Scholar] [CrossRef] [PubMed]
  61. Paterson, A.; Bowers, J.; Chapman, B. Ancient polyploidization predating divergence of the cereals, and its consequences for comparative genomics. Proc. Natl. Acad. Sci. USA 2004, 101, 9903–9908. [Google Scholar] [CrossRef] [PubMed]
  62. Sappl, P.G.; Carroll, A.J.; Clifton, R.; Lister, R.; Whelan, J.; Harvey Millar, A.; Singh, K.B. The Arabidopsis glutathione transferase gene family displays complex stress regulation and co-silencing multiple genes results in altered metabolic sensitivity to oxidative stress. Plant J. 2009, 58, 53–68. [Google Scholar] [CrossRef] [PubMed]
  63. Islam, S.; Rahman, I.A.; Islam, T.; Ghosh, A. Genome-wide identification and expression analysis of glutathione S-transferase gene family in tomato: Gaining an insight to their physiological and stress-specific roles. PLoS ONE 2017, 12, e0187504. [Google Scholar] [CrossRef] [PubMed]
  64. Oakley, A.J. Glutathione transferases: New functions. Curr. Opin. Struct. Biol. 2005, 15, 716–723. [Google Scholar] [CrossRef] [PubMed]
  65. Dixon, D.P.; Skipsey, M.; Edwards, R. Roles for glutathione transferases in plant secondary metabolism. Phytochemistry 2010, 71, 338–350. [Google Scholar] [CrossRef] [PubMed]
  66. McGonigle, B.; Keeler, S.J.; Lau, S.-M.C.; Koeppe, M.K.; O'Keefe, D.P. A genomics approach to the comprehensive analysis of the glutathione S-transferase gene family in soybean and maize. Plant Physiol. 2000, 124, 1105–1120. [Google Scholar] [CrossRef] [PubMed]
  67. Jain, M.; Ghanashyam, C.; Bhattacharjee, A. Comprehensive expression analysis suggests overlapping and specific roles of rice glutathione S-transferase genes during development and stress responses. BMC Genom. 2010, 11, 73. [Google Scholar] [CrossRef] [PubMed]
  68. Licciardello, C.; D’Agostino, N.; Traini, A.; Recupero, G.R.; Frusciante, L.; Chiusano, M.L. Characterization of the glutathione S-transferase gene family through ESTs and expression analyses within common and pigmented cultivars of Citrus sinensis (L.) osbeck. BMC Plant Biol. 2014, 14, 39. [Google Scholar] [CrossRef] [PubMed]
  69. Kong, H.; Landherr, L.L.; Frohlich, M.W.; Leebens-Mack, J.; Ma, H.; DePamphilis, C.W. Patterns of gene duplication in the plant SKP1 gene family in angiosperms: Evidence for multiple mechanisms of rapid gene birth. Plant J. 2007, 50, 873–885. [Google Scholar] [CrossRef] [PubMed]
  70. Sappl, P.G.; Oñate-Sánchez, L.; Singh, K.B.; Millar, A.H. Proteomic analysis of glutathione S-transferases of Arabidopsis thaliana reveals differential salicylic acid-induced expression of the plant-specific phi and tau classes. Plant Mol. Biol. 2004, 54, 205–219. [Google Scholar] [CrossRef] [PubMed]
  71. Patel, B.; Raval, G.; Rawal, R.; Patel, J.; Sainger, R.; Patel, M.; Shah, M.; Patel, D.; Patel, P. Serum glutathione-S-transferase and glutathione reductase activity in head and neck cancer patients. Neoplasma 2002, 49, 260–266. [Google Scholar] [PubMed]
  72. Dalton, D.A.; Boniface, C.; Turner, Z.; Lindahl, A.; Kim, H.J.; Jelinek, L.; Govindarajulu, M.; Finger, R.E.; Taylor, C.G. Physiological roles of glutathione S-transferases in soybean root nodules. Plant Physiol. 2009, 150, 521–530. [Google Scholar] [CrossRef] [PubMed]
  73. Chinnusamy, V.; Zhu, J.-K.; Sunkar, R. Gene regulation during cold stress acclimation in plants. Plant Stress Toler. Methods and Protocols 2010, 39–55. [Google Scholar]
  74. Marrs, K.A. The functions and regulation of glutathione S-transferases in plants. Ann. Rev. Plant Biol. 1996, 47, 127–158. [Google Scholar] [CrossRef] [PubMed]
Figure 1. Comparison of the cold injury symptoms in cold-tolerant Cucurbita maxima and cold-susceptible Cucurbita moschata during temperature treatments; (a) 5 °C, (b) 10 °C and (c) 15 °C. Cold injury symptoms first appeared after 24 h in the 5 °C treated C. moschata plants, and gradually worsened over time. In contrast, no cold injury symptoms were observed in the C. maxima plants at any time point.
Genes 09 00084 g001
Figure 2. Phylogenetic analysis of full-length glutathione S-transferase (GST) proteins from C.maxima, Cucumis sativus, Arabidopsis thaliana, and Oryza sativa. This phylogenetic tree was generated using the neighbor-joining method in MEGA 6.0, with 1000 bootstrap replicates. Black, blue, red, and green text indicates C. maxima, C. sativus, A. thaliana, and O. sativa proteins, respectively.
Genes 09 00084 g002
Figure 3. Chromosomal distribution and gene duplication of the GST genes in C. maxima. The chromosome number is indicated at the top of each chromosome; Chr00 is the gene scaffold. The scales on the left and right sides (in Mb) are for the chromosomes and scaffold, respectively. The pink and blue bars represent GST gene clusters and tandem duplication, respectively. The segmentally duplicated gene pairs are connected with dotted light blue lines. Different classes of GST genes have different text colors; red, green, light green, blue, pink, paste and brown colours represent tau, phi, EF1G, zeta, theta, GHR and lamda group of GST genes, respectively.
Genes 09 00084 g003
Figure 4. Microsynteny analyses of GST genes in C. maxima (Cm), C. sativus (Cu), and Citrullus lanatus var. lanatus (Wm). Light blue, orange, and green blocks represent C. maxima, C. sativus, and C.lanatus var. lanatus chromosomes, respectively. Black lines denote duplicated CmaGST genes on the C. maxima chromosomes.
Genes 09 00084 g004
Figure 5. Interaction networks of the 32 CmaGST proteins based on their homology to Arabidopsis thaliana GST proteins. Stronger associations are represented by thicker lines.
Genes 09 00084 g005
Figure 6. Expression patterns of the CmaGST genes in various tissues, determined by reverse transcript polymerase chain reaction (RT-PCR) analysis. From left to right, each band shows the amplified products from the roots (R); stems (S), leaves (L); and flower buds (Fb).
Genes 09 00084 g006
Figure 7. Differential expression profiles of 32 CmaGST genes in two contrasting lines C. maxima (inbred line CP-1) and C. moschata (inbred line EP-1) exposed to different temperatures at different time courses:(a) at 5 °C; (b) at 10 °C; and (c) at 15 °C. The gene name against each expression has mentioned at left side and color bars with values at right side represent differential expression, where red and green color represent up- and down-regulations of the genes, respectively.
Genes 09 00084 g007
Table 1. In silico analysis and sequence characteristics of the 32 putative glutathione S-transferase (GST) genes identified in Cucurbita maxima.
Sl. No.Gene NameAccession No.ChromosomeStart LocationEnd LocationStrandpIMW(kDa)AALocalization
01CmaGSTU1CmaCh13G0113001383816458382352+5.7427.04235Cytoplasm
02CmaGSTU2CmaCh11G0029901114835991484338+5.1725.08219Cytoplasm
03CmaGSTU3CmaCh14G019610141380182813805918+6.3144.50387Cytoplasm
04CmaGSTU4CmaCh06G01155006777731677788275.9326.16227Cytoplasm
05CmaGSTU5CmaCh00G0068900047643604476450876.9827.96242Cytoplasm
06CmaGSTU6CmaCh06G01277006849959285003936.0226.29226Cytoplasm
07CmaGSTU7CmaCh14G0186201413214607132176865.9841.95370Cytoplasm
08CmaGSTU8CmaCh06G0127800685013498502406+6.6225.61222Cytoplasm
09CmaGSTU9CmaCh14G0186101413213235132143225.2825.41222Cytoplasm
10CmaGSTU10CmaCh03G0038400343661334366923+5.9424.72217Cytoplasm
11CmaGSTU11CmaCh07G01031007537853353800706.2025.66220Cytoplasm
12CmaGSTU12CmaCh16G0046501623334982334374+6.1424.95219Cytoplasm
13CmaGSTU13CmaCh04G00639004326991632713758.6333.08288Cytoplasm
14CmaGSTU14CmaCh16G0046401623261202328293+7.6623.19202Cytoplasm
15CmaGSTU15CmaCh04G00640004327157732723215.2724.41212Cytoplasm
16CmaGSTU16CmaCh04G00641004327312232864319.0291.29810Nucleus
17CmaGSTU17CmaCh04G0227000415857294158580455.5825.47224Cytoplasm
18CmaGSTU18CmaCh04G00638004326869132697785.6525.65224Cytoplasm
19CmaGSTF1CmaCh08G0040900823448402346569+6.3824.14217Cytoplasm
20CmaGSTF2CmaCh08G00410008234686323481625.7524.12214Cytoplasm
21CmaGSTF3CmaCh12G00385012198880919900165.5125.09220Cytoplasm
22CmaEF1G1CmaCh16G007670.1642063634213994+5.5461.96547Cytoplasm
23CmaEF1G2CmaCh04G0089200446452714652681+5.6560.31531Cytoplasm
24CmaEF1G3CmaCh06G00887006560370656067186.0147.14415Cytoplasm
25CmaGSTT1CmaCh16G00590016305479230580339.3827.09238Cytoplasm
26CmaGSTT2CmaCh04G007350004764360447645087+9.3426.96238Cytoplasm
27CmaGSTZ1CmaCh02G0064300238953233899120+5.8524.89222Cytoplasm
28CmaGSTZ2CmaCh02G0064100238870133892301+5.1724.99223Cytoplasm
29CmaGSTZ3CmaCh06G0113500676524257656514+5.2025.63228Cytoplasm
30CmaGSTL1CmaCh06G00342006158822215914885.2529.35257Cytoplasm
31CmaGHR1CmaCh18G00559018367167236744037.6240.83355Chloroplast
32CmaGHR2CmaCh19G00114019681203684746+8.7945.58415Cytoplasm
pI: isolectric point; MW: molecular weight; aa: amino acids.
Table 2. Estimated Ka/Ks ratios and divergence times of the duplicated CmaGST genes.
Duplicated Gene PairsKsKaKa/KsDuplication TypeType of SelectionDivergence Time (Mya)
CmaGSTU3vs.CmaGSTU40.2150.1270.593SegmentalPurifying7.18
CmaGSTU4vs.CmaGSTU50.1390.0560.405SegmentalPurifying4.66
CmaGSTU12vs.CmaGSTU140.0380.0170.452TandemPurifying1.30
CmaGSTU12vs.CmaGSTU130.4120.1420.346SegmentalPurifying13.75
CmaGSTU12vs.CmaGSTU150.4550.1370.302SegmentalPurifying15.19
CmaGSTU12vs.CmaGSTU160.5330.2290.430SegmentalPurifying17.78
CmaGSTU13vs.CmaGSTU140.3870.1420.367SegmentalPurifying12.91
CmaGSTU13vs.CmaGSTU150.4050.1720.424TandemPurifying13.52
CmaGSTU13vs.CmaGSTU160.3090.2420.784TandemPurifying10.32
CmaGSTU14vs.CmaGSTU150.3980.1510.379SegmentalPurifying13.27
CmaGSTU15vs.CmaGSTU160.3080.2260.735TandemPurifying10.28
CmaGSTZ1vs.CmaGSTZ20.3820.2200.575TandemPurifying12.76
CmaEF1G1vs.CmaEF1G20.0800.1191.483SegmentalPositive2.68
CmaEF1G1vs.CmaEF1G30.5360.2930.547SegmentalPurifying17.89
CmaEF1G2vs.CmaEF1G30.5660.2790.493SegmentalPurifying18.87
CmaGSTT1vs.CmaGSTT20.2010.1300.646SegmentalPurifying6.72
Mya: Million year.

