Emissions from Ethanol-Gasoline Blends: A Single Particle Perspective

Abstract
:1. Introduction/Motivation
2. Methods and Models
2.1. Fuels
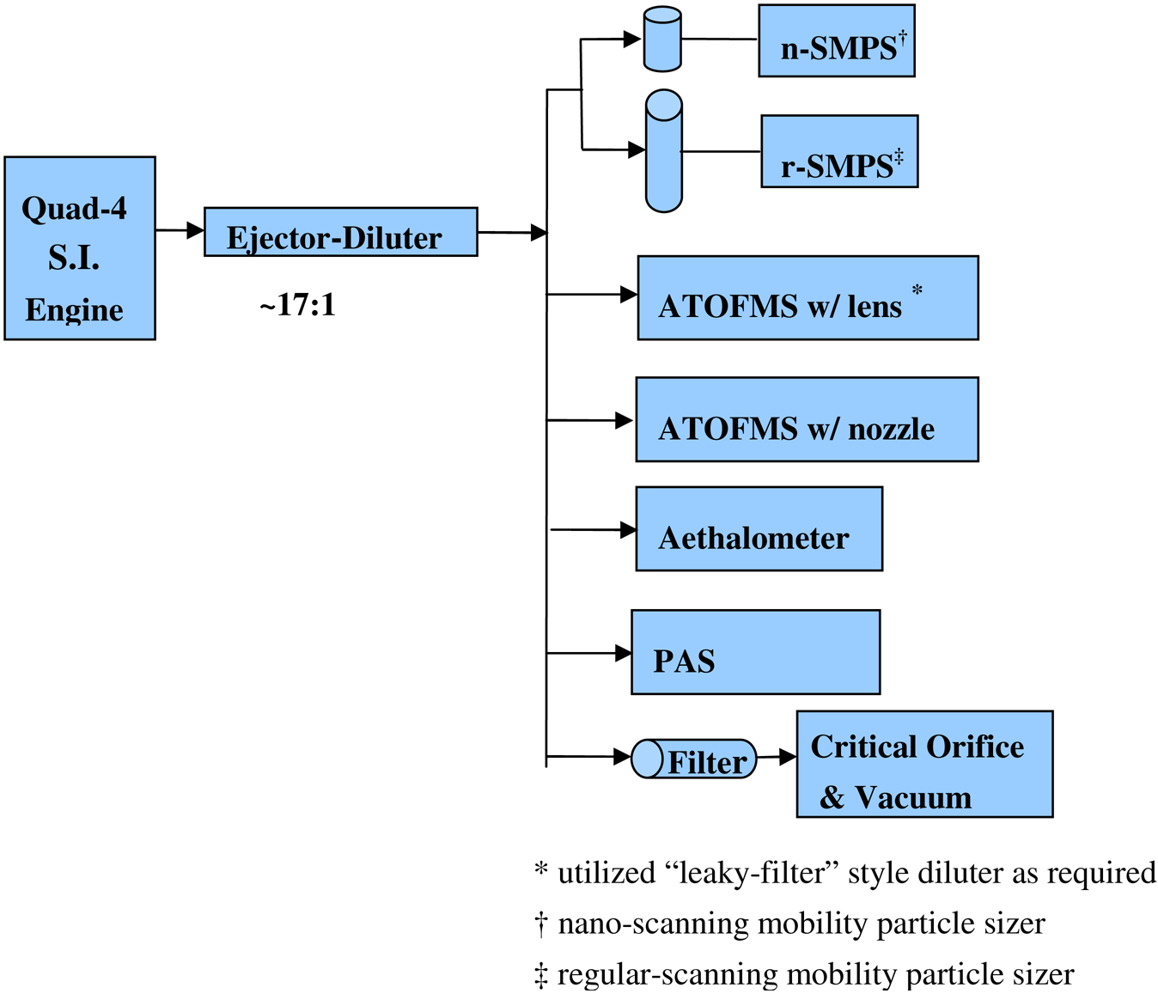
2.2. Apparatus
2.3. Aerosol Sampling and Measurement
3. Results and Discussion
3.1. Mass and Black Carbon
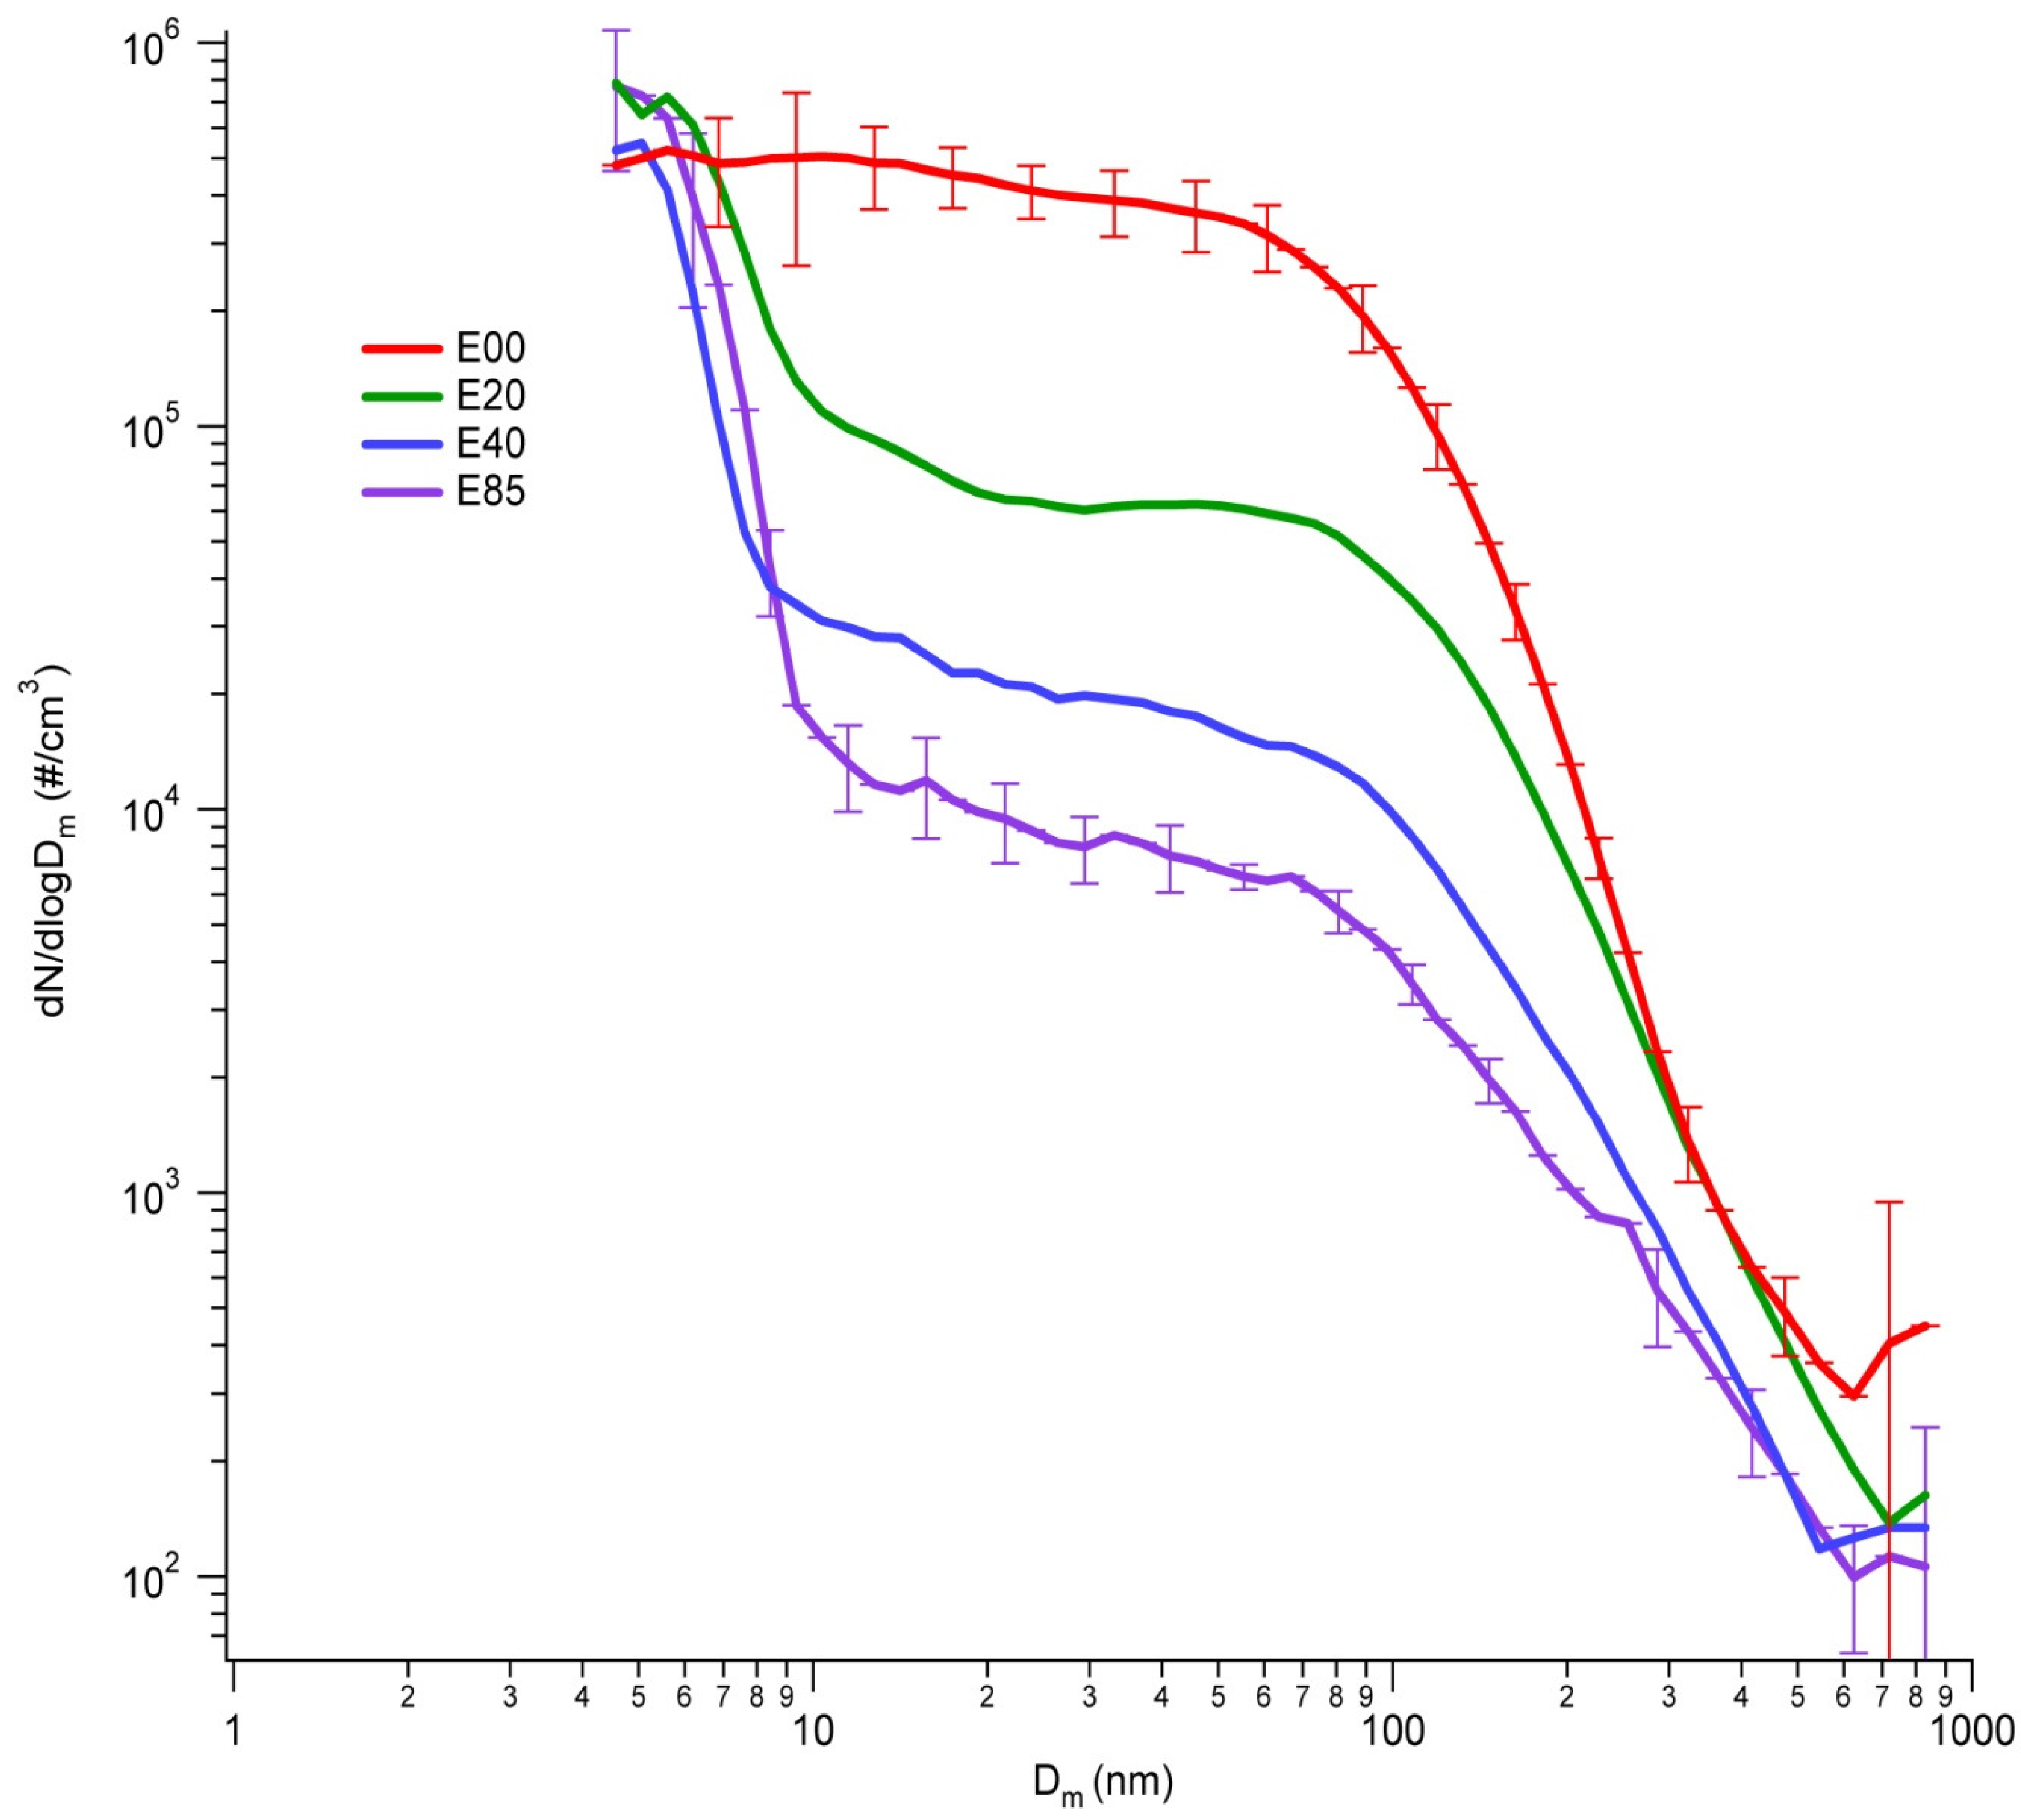
3.2. Mobility Distributions
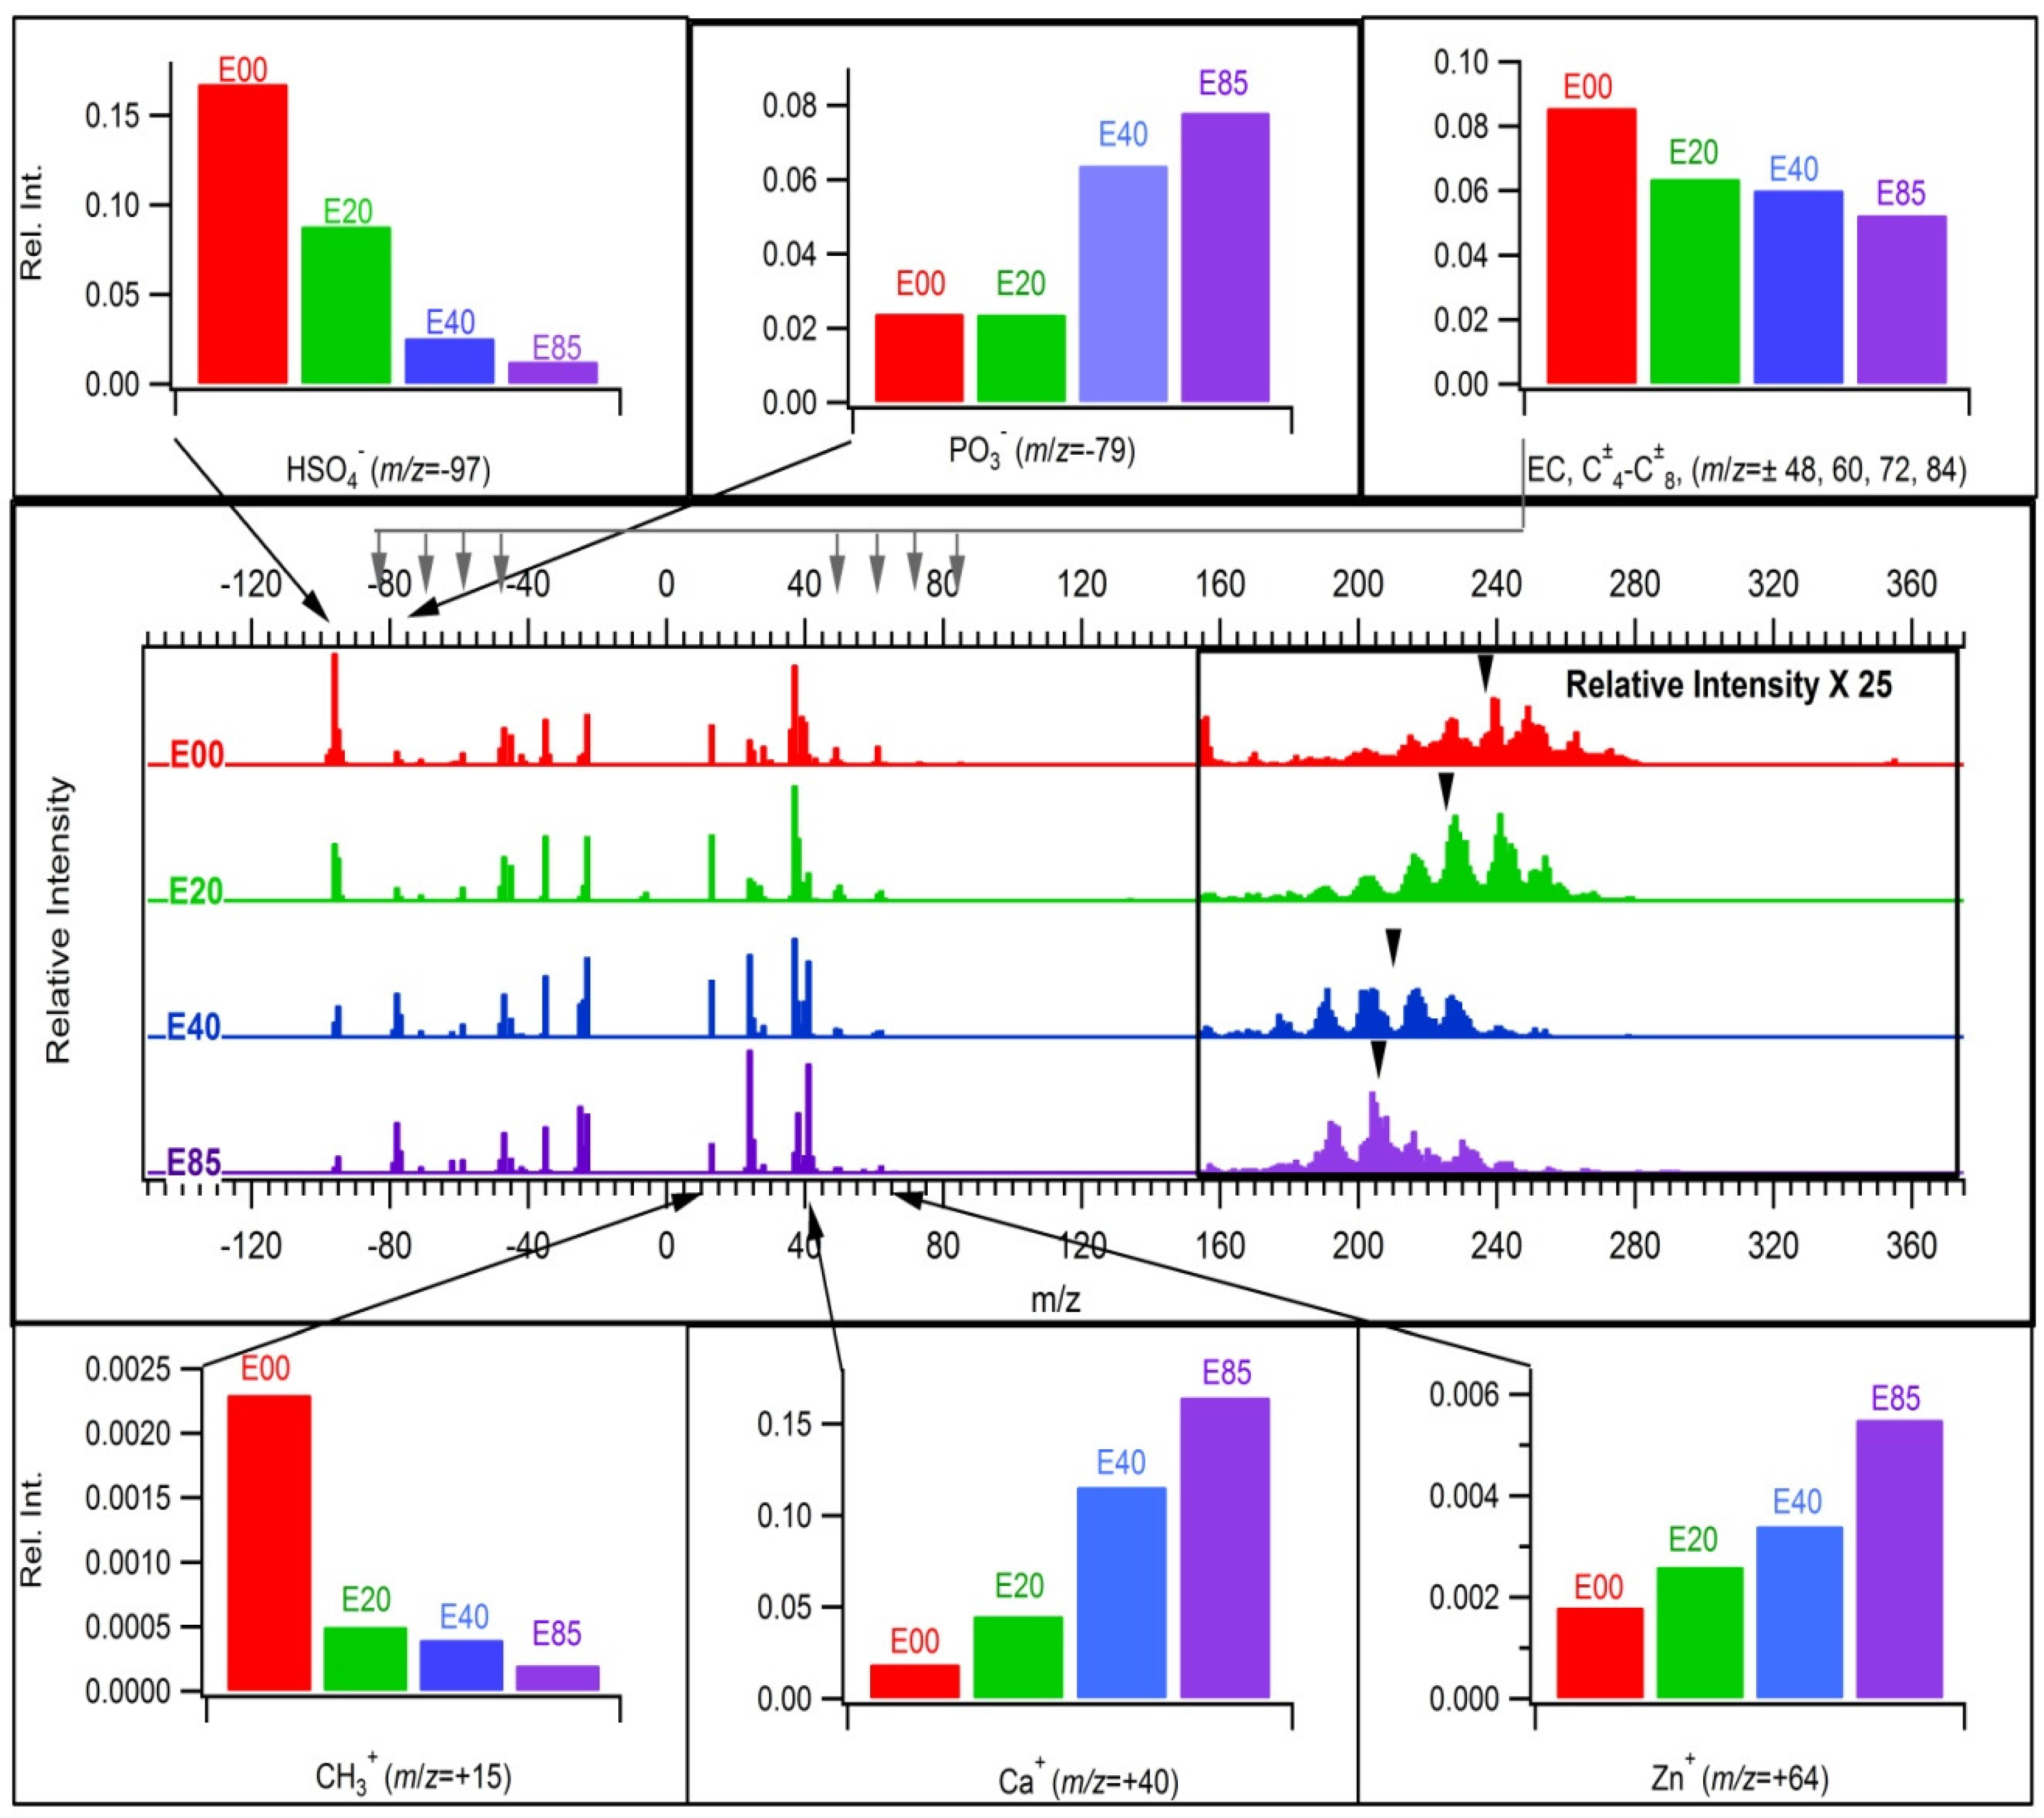
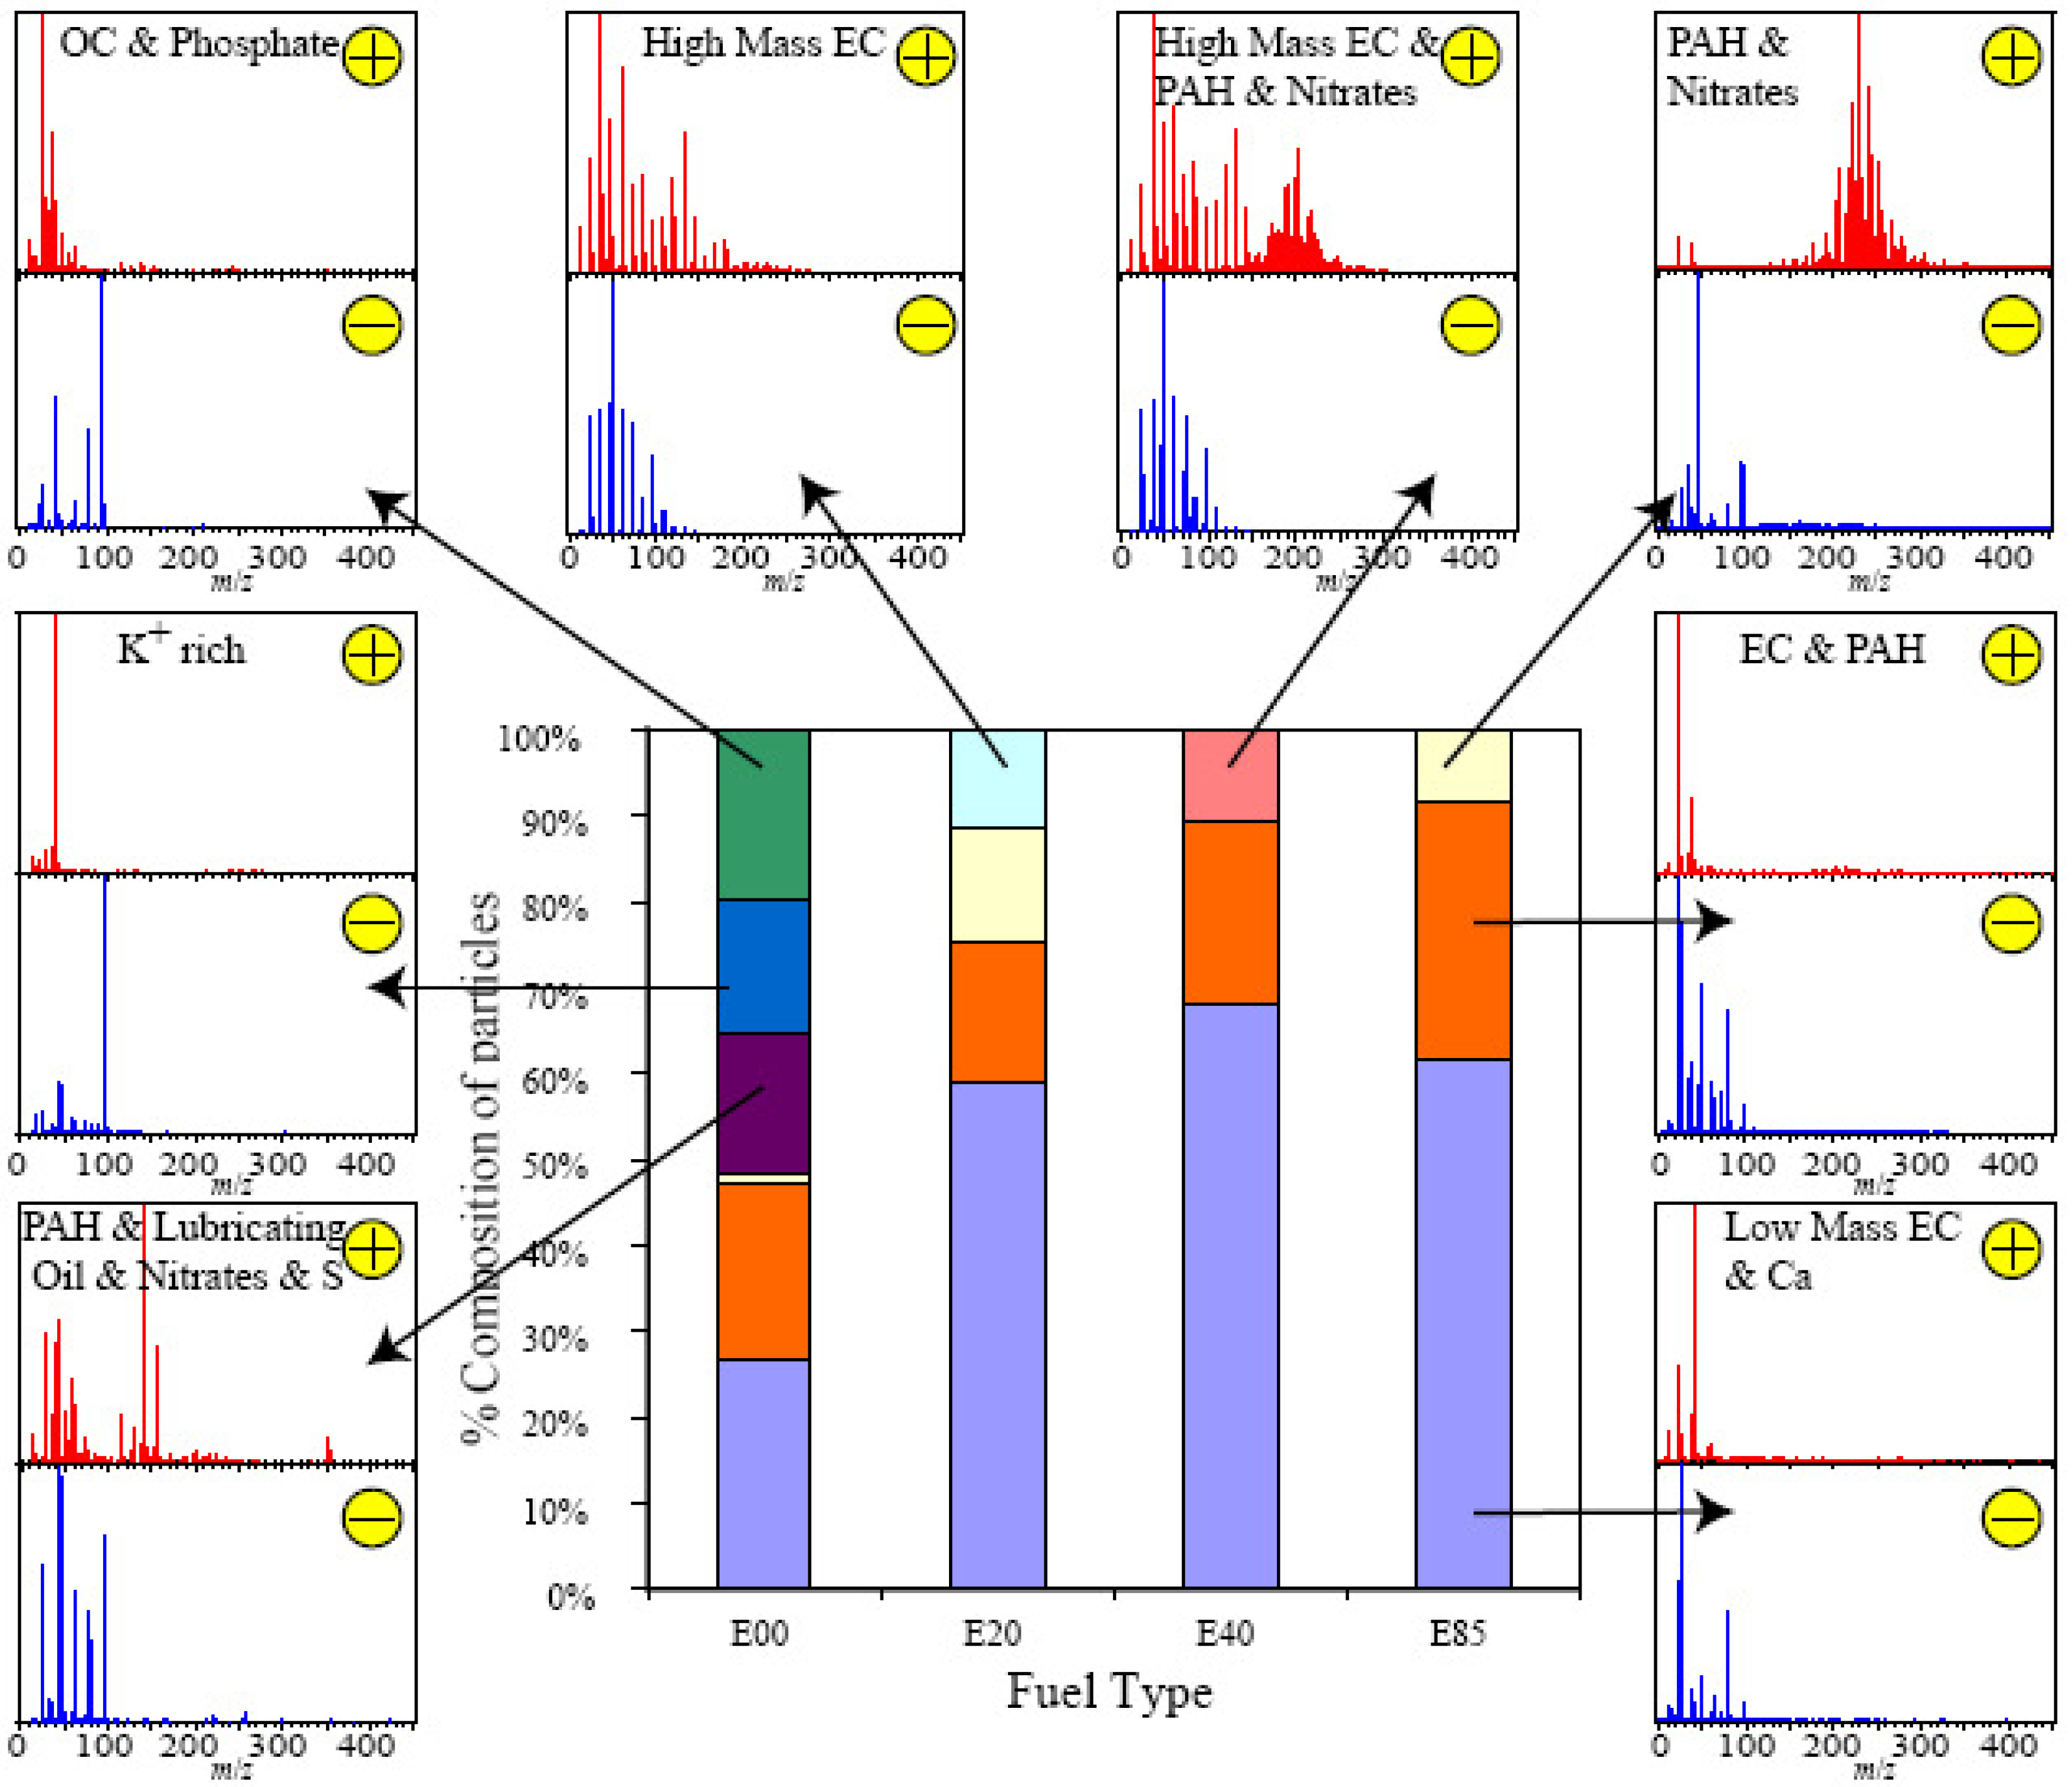
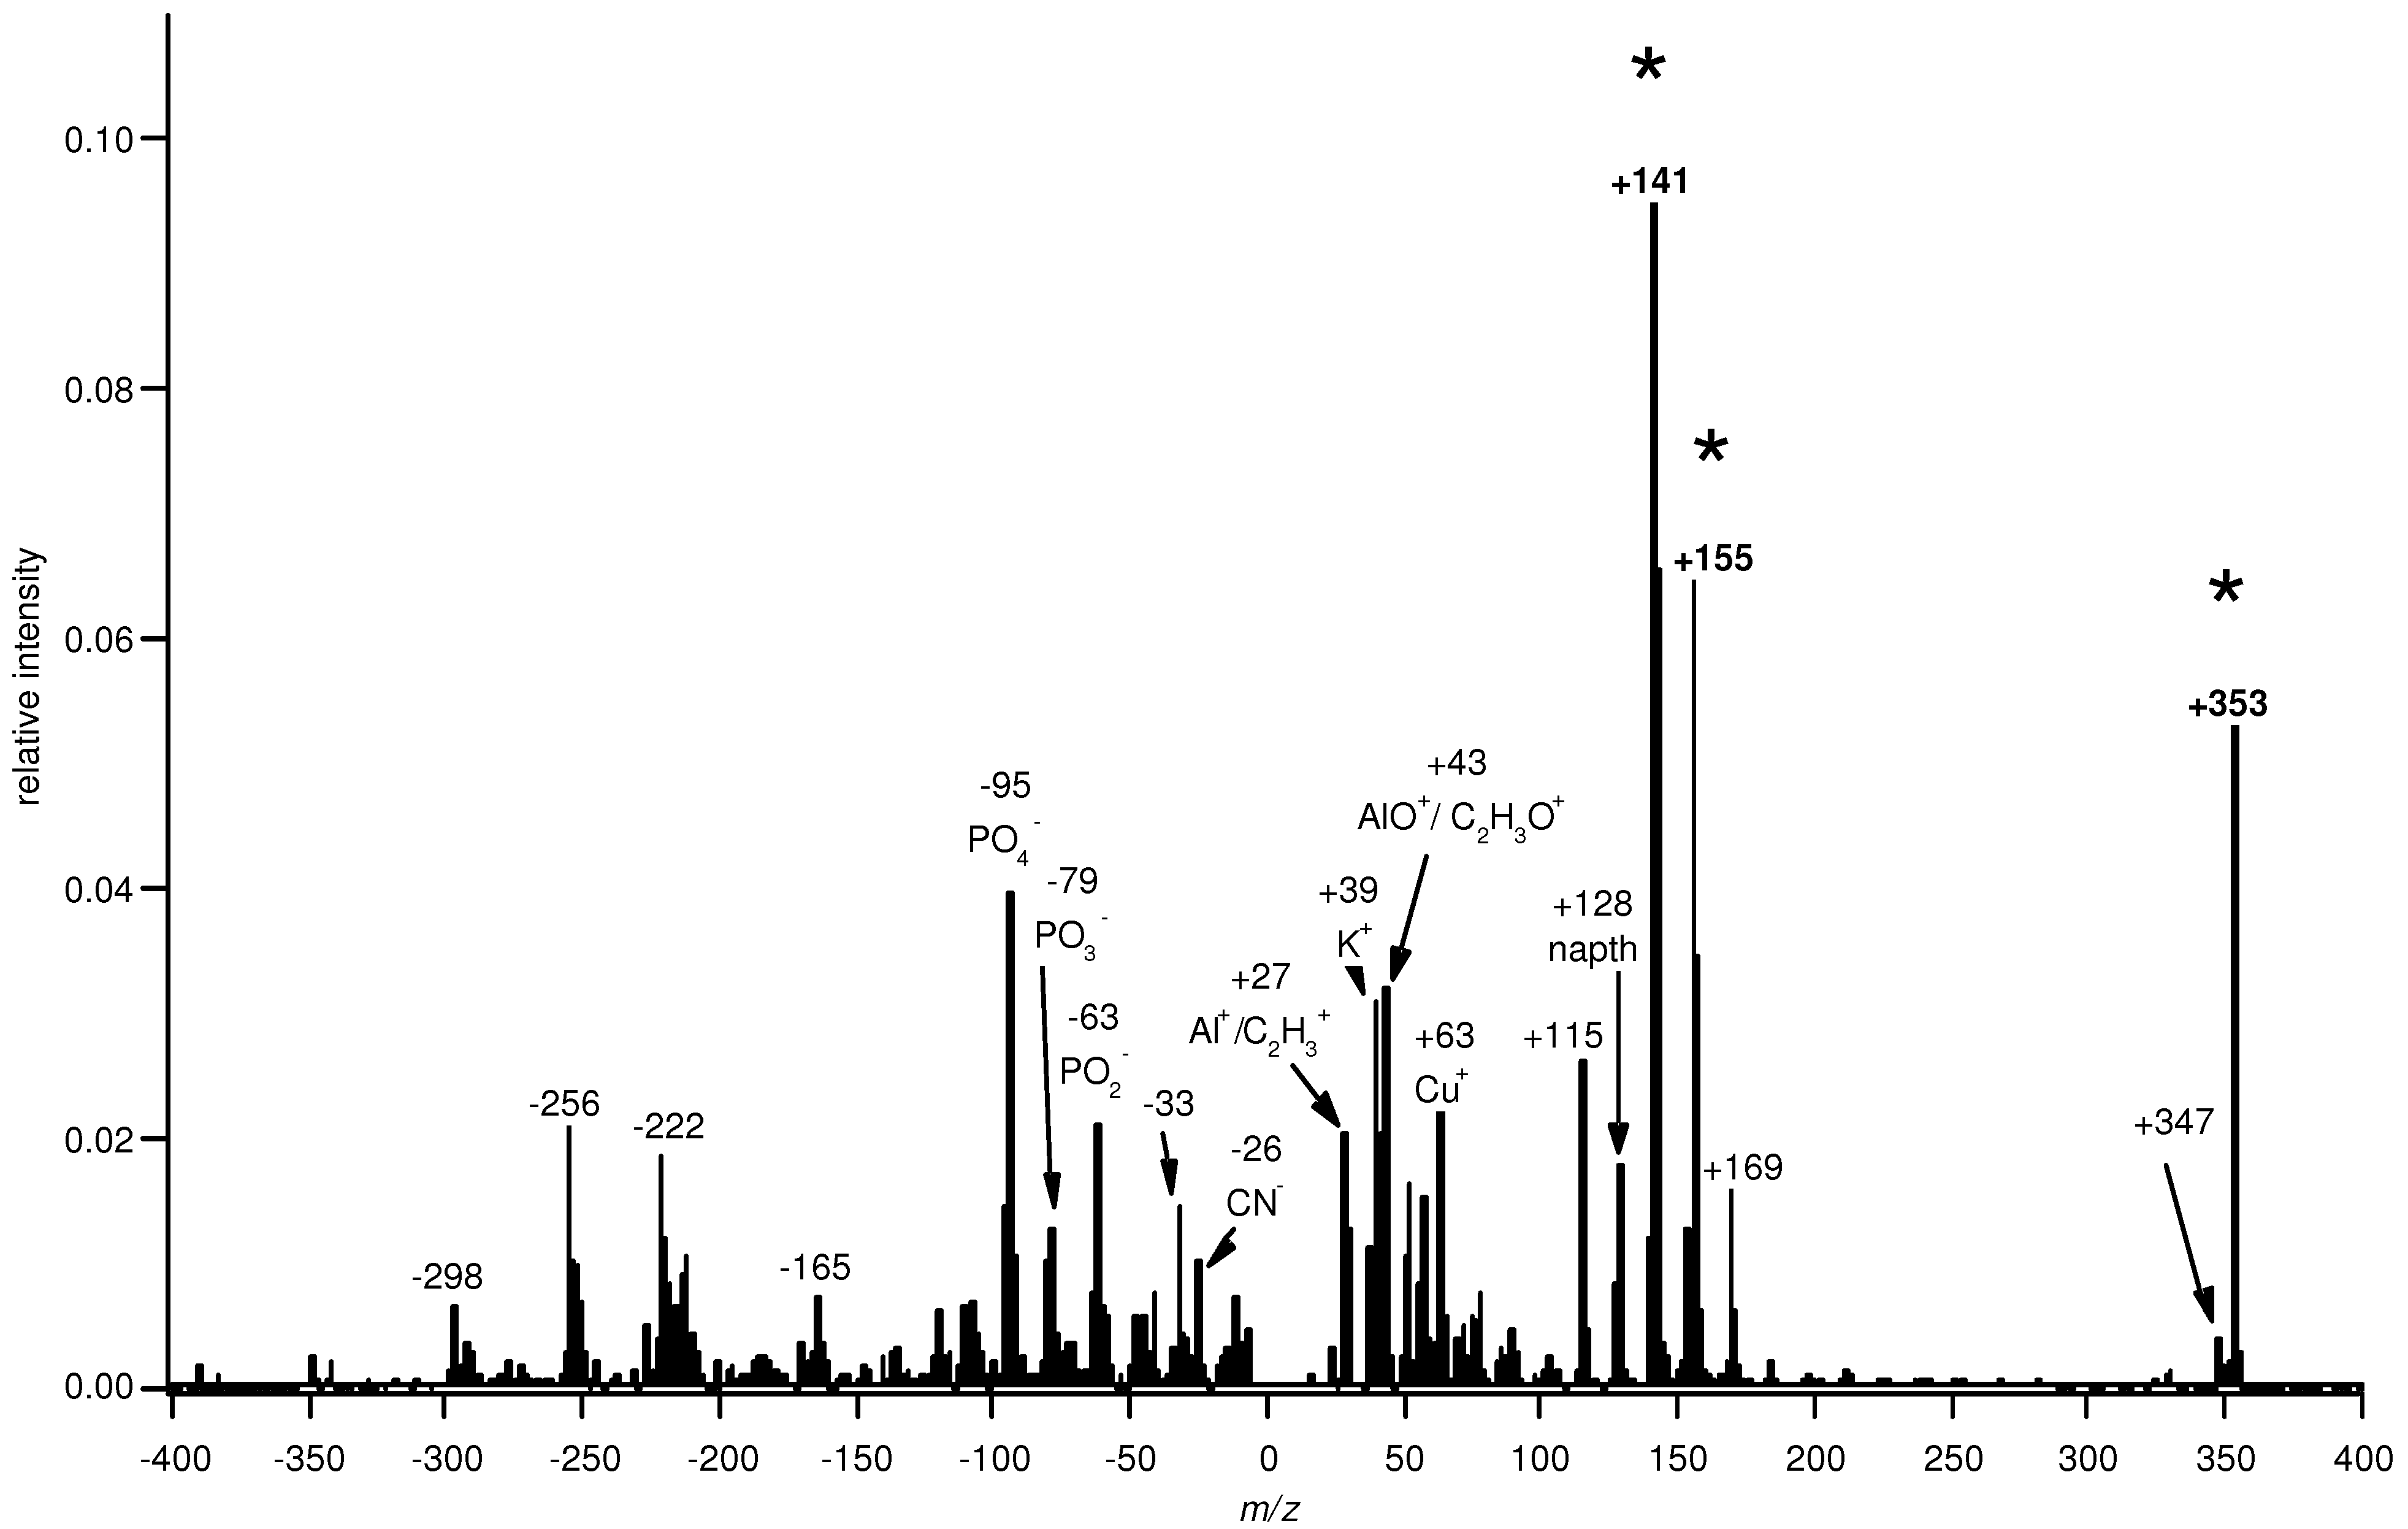
3.3. ATOFMS Measurements
3.4. Clustering Results
3.5. Source Apportionment Implications
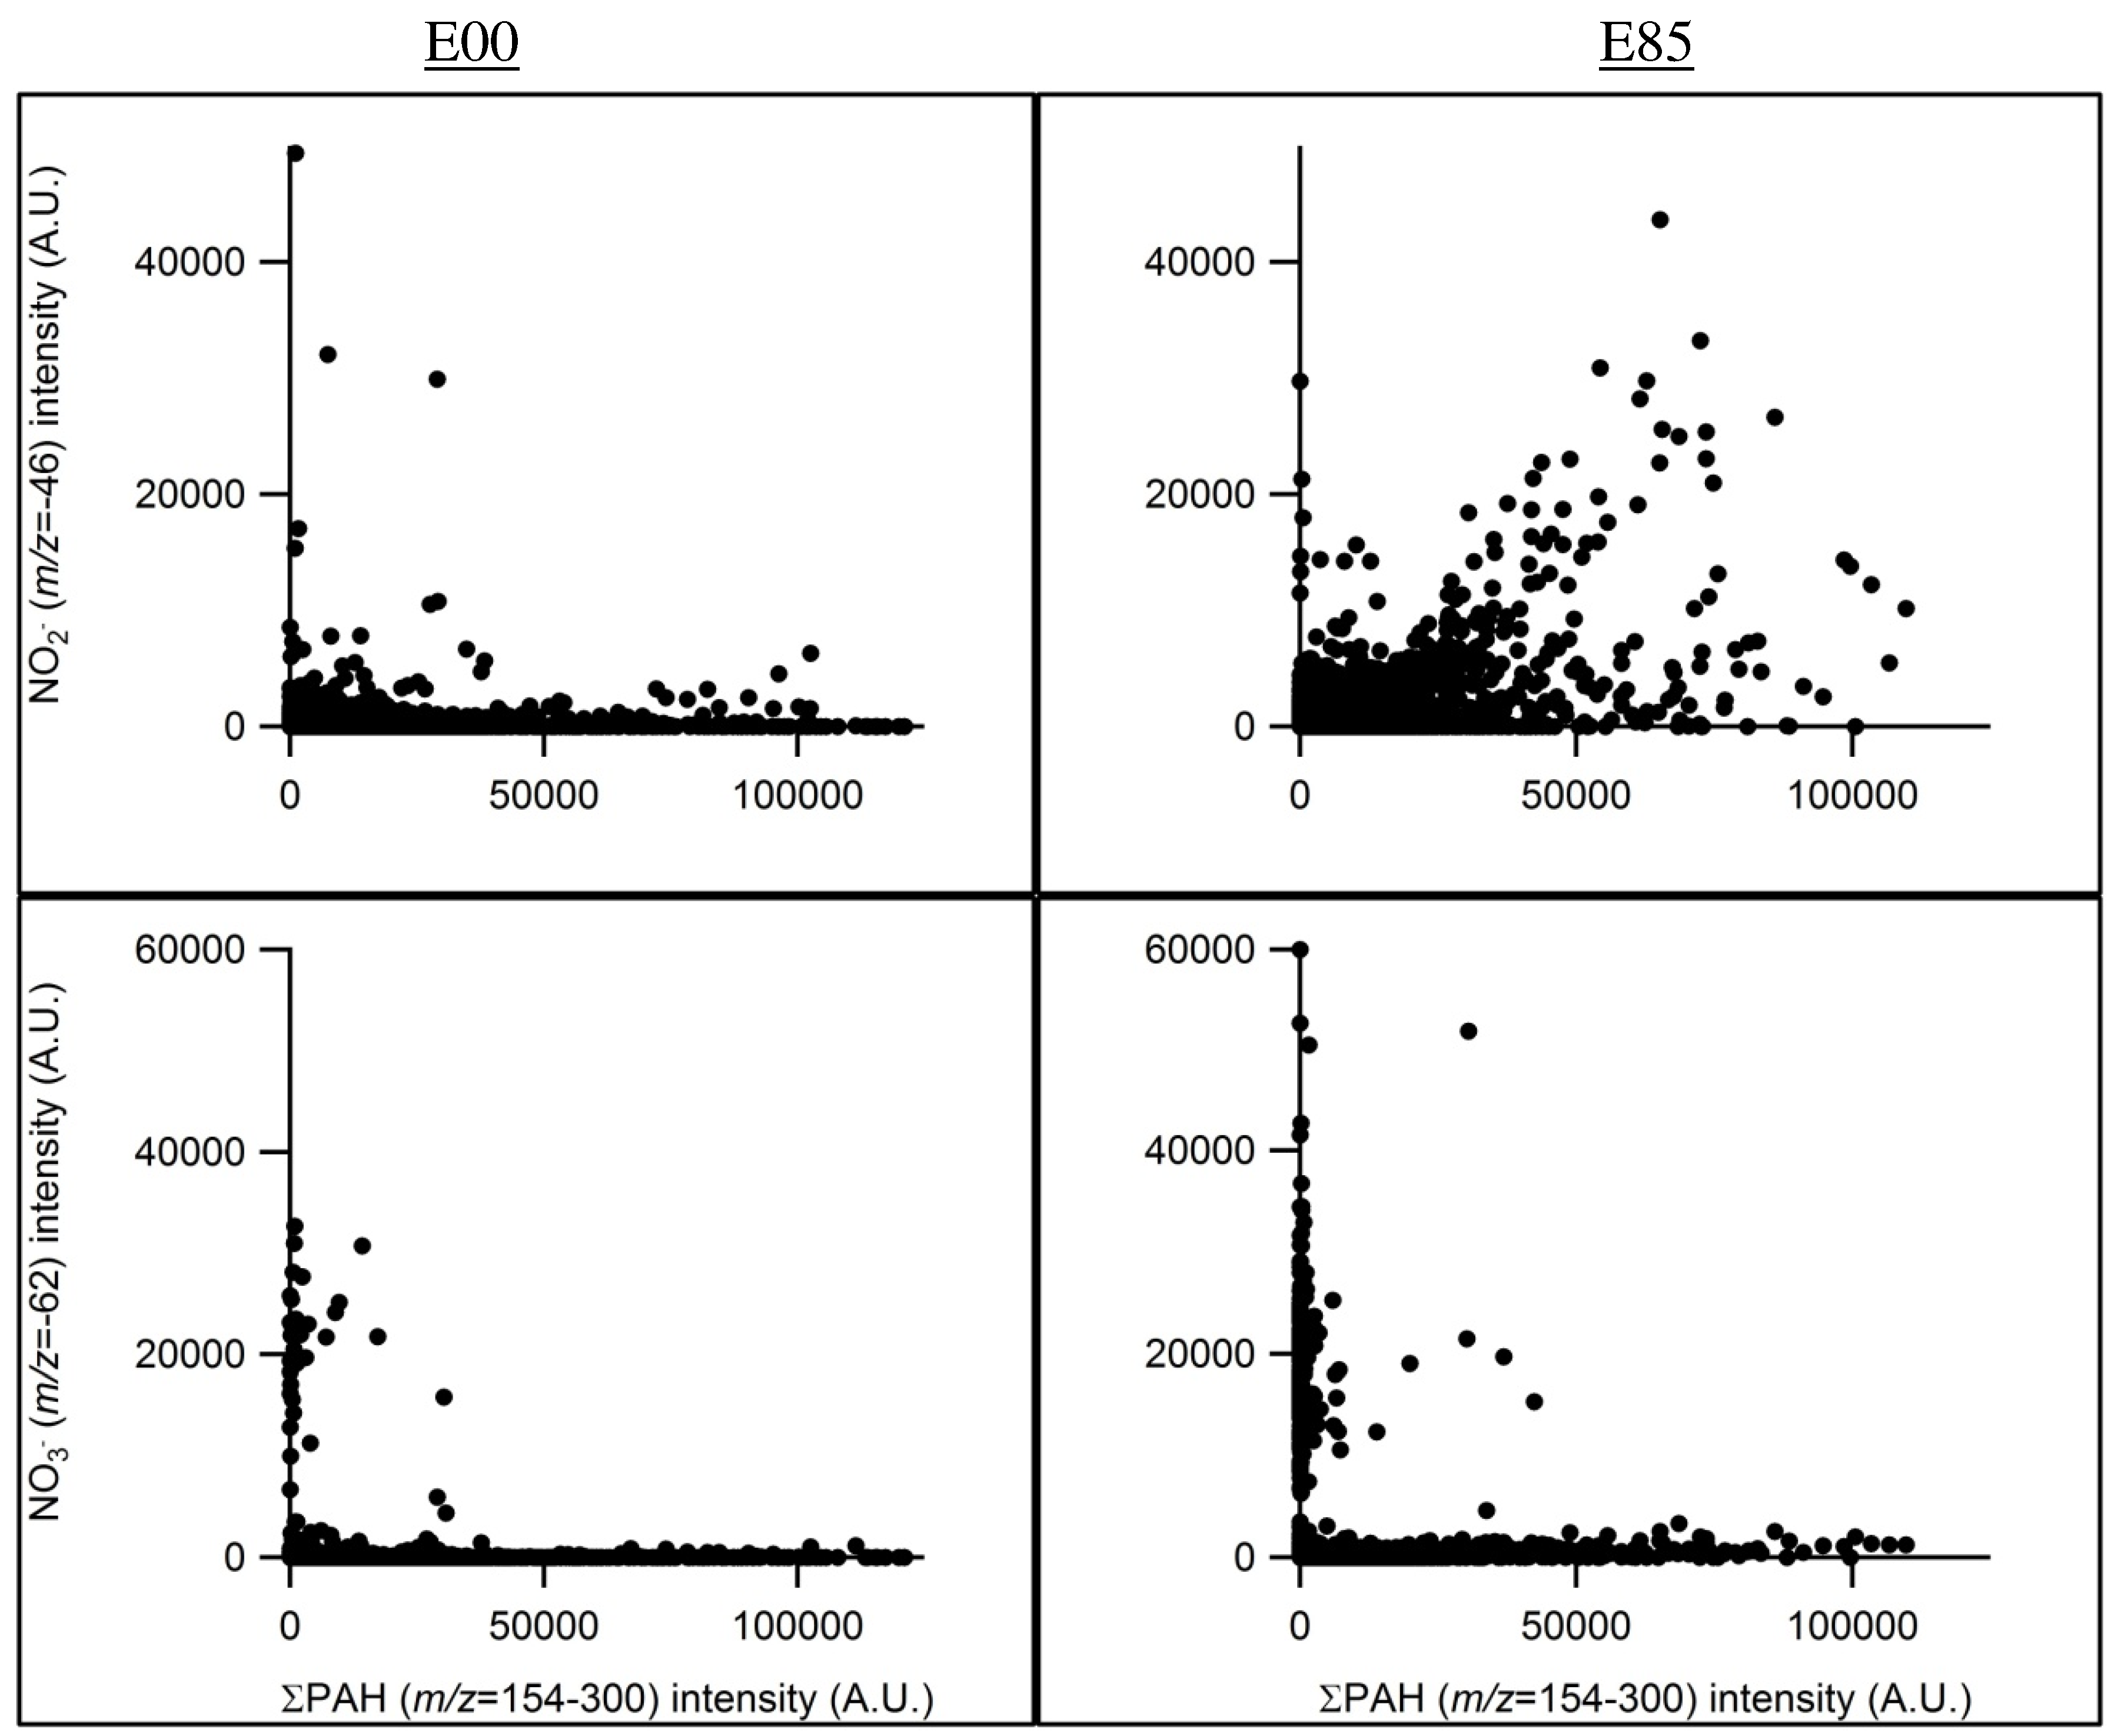
3.6. Health Effect Implications
4. Conclusions


| Fuel | Mass Concentration (μg/m3) | BC ** Concentration (μg/m3) | PAS Signal (mV) |
|---|---|---|---|
| E00 | 150 ± 22 | 150 ± 22 | 1940 ± 117 |
| E20 | * | 78 ± 18 | 1472 ± 183 |
| E40 | * | 74 ± 13 | 235 ± 52 |
| E85 | 60 ± 22 | 71 ± 10 | 92 ± 40 |
Acknowledgments
References
- Al-Hasan, M. Effect of ethanol–unleaded gasoline blends on engine performance and exhaust emission. Energy Convers. Manage 2003, 44, 1547–1561. [Google Scholar]
- Cummins, C.L. Internal Fire: The Internal Combustion Engine 1673-1900 Revised Edition, 3rd ed.; Carnot Press: Lake Oswego, OR, USA, 1976; p. 356. [Google Scholar]
- Niven, R.K. Ethanol in gasoline: Environmental impacts and sustainability review article. Renew. Sustain. Energy Rev 2005, 9, 535–555. [Google Scholar]
- Renewable Fuels Association (RFA). The Industry—Statistics; RFA; Washington DC, USA, 2008. [Google Scholar]
- Boyle, A. How Regulation Fuels Consumption of Ethanol: A Spatial Analysis of Pro-Ethanol Policies in the USA. Ph.D. Thesis, Wilkes Honors College of Florida Atlantic University, Jupiter, FL, USA, 2006. [Google Scholar]
- Mosey, G.; Kreycik, C. State Clean Energy Practices: Renewable Fuel Standards; Technical Report NREL/TP-670-43513; NREL: Golden CO, USA, 2008. [Google Scholar]
- Leiby, P.; Rubin, J. Effectiveness and efficiency of policies to promote alternative fuel vehicles. Transp. Res. Rec. 2001, 1750, 84–91. [Google Scholar]
- Rice, R.; Sanyal, A.; Elrod, A.; BATA, R. Exhaust gas emissions of butanol, ethanol, and methanol-gasoline blends. J. Eng. Gas Turbines Power 1991, 113, 377–381. [Google Scholar]
- Huang, Z.; Miao, H.; Zhou, L.; Jiang, D. Combustion characteristics and hydrocarbon emissions of a spark ignition engine fuelled with gasoline-oxygenate blends. Proc. Inst. Mech. Eng. Part D 2000, 214, 341–346. [Google Scholar]
- Poulopoulos, S.; Samaras, D.; Philippopoulos, C. Regulated and unregulated emissions from an internal combustion engine operating on ethanol-containing fuels. Atmos. Environ. 2001, 35, 4399–4406. [Google Scholar]
- Schifter, I.; Vera, M.; Diaz, L.; Guzman, E.; Ramos, F.; Lopez-Salinas, E. Environmental implications on the oxygenation of gasoline with ethanol in the metropolitan area of Mexico city. Environ. Sci. Technol. 2001, 35, 1893–1901. [Google Scholar]
- Hsieh, W.D.; Chen, R.H.; Wu, T.L.; Lin, T.H. Engine performance and pollutant emission of an engine using ethanol-gasoline blended fuels. Atmos. Environ. 2002, 36, 403–410. [Google Scholar]
- Yüksel, F.; Yüksel, B. The use of ethanol–gasoline blend as a fuel in an SI engine. Renew. Energy 2004, 29, 1181–1191. [Google Scholar]
- Jia, L.W.; Shen, M.Q.; Wang, J.; Lin, M.Q. Influence of ethanol-gasoline blended fuel on emission characteristics from a four-stroke motorcycle engine. J. Hazard. Mater. 2005, 123, 29–34. [Google Scholar]
- Graham, L.A.; Belisle, S.L.; Baas, C.L. Emissions from light duty gasoline vehicles operating on low blend ethanol gasoline and E85. Atmos. Environ. 2008, 42, 4498–4516. [Google Scholar]
- Yanowitz, J.; McCormick, R.L. Effect of E85 on tailpipe emissions from light-duty vehicles. J. Air Waste Manage Assoc. 2009, 59, 172–182. [Google Scholar]
- Mulawa, P.A.; Cadle, S.H.; Knapp, K.; Zweidinger, R.; Snow, R.; Lucas, R.; Goldbach, J. Effect of ambient temperature and E-10 fuel on primary exhaust particulate matter emissions from light-duty vehicles. Environ. Sci. Technol. 1997, 31, 1302–1307. [Google Scholar]
- Ragazzi, R.; Nelson, K. The Impact of a 10% Ethanol Blended Fuel on the Exhaust Emissions of Tier 0 and Tier 1 Light Duty Gasoline Vehicles at 35F; Technical Report for Colorado Department of Public Health and Environment: Denver, CO, USA, 1999. [Google Scholar]
- Hubbard, C.; Shane, M.; Maricq, M. A Study of FTP Emissions on a 06MY TIER2 Bin5 Light Duty Flex Fuel Vehicle Running on e85 Fuel. Proceedings of 17th CRC on-Road Vehicle Emissions Workshop, San Diego, CA, USA, 26–28 March 2007.
- Zhang, M.; Vo, T.; Fuentes, M.; Dzhema, I.; Hou, D.; Ling, R.; Rieger, P. A Comparison of Total Mass, Particle Size Distribution and Particle Number Emissions of Light-Duty Vehicles Tested at Haagen-Smit Laboratory from 2009 to 2010. Proceedings of 21st CRC Real World Emissions Workshop, San Diego, CA, USA, 20–23 March 2011.
- Jacobson, M.Z. Effects of ethanol (E85) versus gasoline vehicles on cancer and mortality in the United States. Environ. Sci. Technol. 2007, 41, 4150–4157. [Google Scholar]
- Schauer, J.J.; Rogge, W.F.; Hildemann, L.M.; Mazurek, M.A.; Cass, G.R.; Simoneit, B.R.T. Source apportionment of airborne particulate matter using organic compounds as tracers. Atmos. Environ. 1996, 41, 241–259. [Google Scholar]
- Kim, E.; Hopke, P.K.; Edgerton, E.S. Improving source identification of Atlanta aerosol using temperature resolved carbon fractions in positive matrix factorization. Atmos. Environ. 2004, 38, 3349–3362. [Google Scholar]
- Miguel, A.H.; Kirchstetter, T.W.; Harley, R.A.; Hering, S.V. On-road emissions of particulate polycyclic aromatic hydrocarbons and black carbon from gasoline and diesel vehicles. Environ. Sci. Technol. 1998, 32, 450–455. [Google Scholar]
- Sodeman, D.A.; Toner, S.M.; Prather, K.A. Determination of single particle mass spectral signatures from light-duty vehicle emissions. Environ. Sci. Technol. 2005, 39, 4569–4580. [Google Scholar]
- Spencer, M.T.; Shields, L.G.; Sodeman, D.A.; Toner, S.M.; Prather, K.A. Comparison of oil and fuel particle chemical signatures with particle emissions from heavy and light duty vehicles. Atmos. Environ. 2006, 40, 5224–5235. [Google Scholar]
- Shields, L.G.; Suess, D.T.; Prather, K.A. Determination of single particle mass spectral signatures from heavy-duty diesel vehicle emissions for PM2. 5 source apportionment. Atmos. Environ. 2007, 41, 3841–3852. [Google Scholar]
- Toner, S.M.; Shields, L.G.; Sodeman, D.A.; Prather, K.A. Using mass spectral source signatures to apportion exhaust particles from gasoline and diesel powered vehicles in a freeway study using UF-ATOFMS. Atmos. Environ. 2007, 42, 568–581. [Google Scholar]
- Myers, M.E. Jr.; Stollsteimer, J.; Wims, A.M. Determination of gasoline octane numbers from chemical composition. Anal. Chem. 1975, 47, 2301–2304. [Google Scholar]
- Burri, J.; Crockett, R.; Hany, R.; Rentsch, D. Gasoline composition determined by 1 H NMR spectroscopy. Fuel 2004, 83, 187–193. [Google Scholar]
- Bayraktar, H. Experimental and theoretical investigation of using gasoline–ethanol blends in spark-ignition engines. Renew. Energy 2005, 30, 1733–1747. [Google Scholar]
- Vander Wal, R.L.; Tomasek, A.J. Soot nanostructure: Dependence upon synthesis conditions. combust Flame 2004, 136, 129–140. [Google Scholar]
- Gard, E.; Mayer, J.E.; Morrical, B.D.; Dienes, T.; Fergenson, D.P.; Prather, K.A. Real-time analysis of individual atmospheric aerosol particles: Design and performance of a portable ATOFMS. Anal. Chem. 1997, 69, 4083–4091. [Google Scholar]
- Thomson, M.W.; Frelund, A.R.; Pallas, M.; Miller, K.D. General motors 2.3 L quad 4 engine. SAE Trans. 1987, 96, 330–348. [Google Scholar]
- Graskow, B.R.; Kittelson, D.B.; Ahmadi, M.R.; Morris, J.E. Exhaust Particulate Emissions from Two Port Fuel Injected Spark Ignition Engines; AE Technical Paper No. 1999-01-1144; SAE International: Warrendale PA, USA, 1999. [Google Scholar]
- Johnson, J.E.; Kittelson, D.B. Deposition, diffusion and adsorption in the diesel oxidation catalyst. Appl. Catal. B 1996, 10, 117–137. [Google Scholar]
- Kittelson, D.; Watts, W.; Johnson, J.; Schauer, J.; Lawson, D. On-road and laboratory evaluation of combustion aerosols—Part 2: Summary of spark ignition engine results. J. Aerosol Sci. 2006, 37, 931–949. [Google Scholar]
- Pimentel, D. Ethanol fuels: Energy security, economics, and the environment. J. Agric. Environ Ethics 1991, 4, 1–13. [Google Scholar]
- Abdul-Khalek, I.; Kittleson, D.; Brear, F. The Influence of Dilution Conditions on Diesel Exhaust Particle Size Distribution Measurements; SAE Technical Paper Series 1999-01-1142; SAE International: Warrendale, PA, USA, 1999. [Google Scholar]
- Wei, Q.; Kittelson, D.; Watts, W. Single-Stage Dilution Tunnel Performance; SAE Technical Paper Series 2001-01-0201; SAE International: Warrendale, PA, USA, 2001. [Google Scholar]
- Liu, P.; Ziemann, P.J.; Kittelson, D.B.; McMurry, P.H. Generating particle beams of controlled dimensions and divergence: I. theory of particle motion in aerodynamic lenses and nozzle expansions. Aerosol Sci. Technol. 1995, 22, 293–313. [Google Scholar]
- Liu, P.; Ziemann, P.J.; Kittelson, D.B.; McMurry, P.H. Generating particle beams of controlled dimensions and divergence: II. experimental evaluation of particle motion in aerodynamic lenses and nozzle expansions. Aerosol Sci. Technol. 1995, 22, 314–324. [Google Scholar]
- Zhang, X. A numerical characterization of particle beam collimation by an aerodynamic lens-nozzle system: Part I. an individual lens or nozzle. Aerosol Sci. Technol. 2002, 36, 617–631. [Google Scholar]
- Hansen, A.D.A.; Rosen, H.; Novakov, T. Real-time measurement of the absorption coefficient of aerosol particles. Appl. Opt. 1982, 21, 3060–3062. [Google Scholar]
- Burtscher, H.; Scherrer, L.; Siegmann, H.C.; Schmidt-Ott, A.; Federer, B. Probing aerosols by photoelectric charging. J. Appl. Phys. 1982, 53, 3787–3791. [Google Scholar]
- Wilson, N.K.; Barbour, R.K.; Chuang, J.C.; Mukind, R. Evaluation of a real-time monitor for fine-particle-bound PAH in air. Polycycl. Aromat. Compd. 1995, 5, 167–174. [Google Scholar]
- Maisels, A.; Jordan, F.; Fissan, H. Dynamics of the aerosol particle photocharging process. J. Appl. Phys. 2002, 91, 3377. [Google Scholar]
- Jung, H.; Kittelson, D.B. Characterization of aerosol surface instruments in transition regime. Aerosol Sci. Technol. 2005, 39, 902–911. [Google Scholar]
- Chen, D.R.; Pui, D.; Hummes, D.; Fissan, H.; Quant, F.; Sem, G. Design and evaluation of a nanometer aerosol differential mobility analyzer (Nano-DMA). J. Aerosol Sci. 1998, 29, 497–509. [Google Scholar]
- Stolzenburg, M.; McMurry, P. An ultrafine aerosol condensation nucleus counter. Aerosol Sci. Technol. 1991, 14, 48–65. [Google Scholar]
- Knutson, E.O.; Whitby, K.T. Aerosol classification by electric mobility: Apparatus, theory, and applications. J. Aerosol Sci. 1975, 6, 443–451. [Google Scholar]
- Keady, B.; Quant, F.; Sem, J. A small, high-flow condensation nucleus counter for clean room particle monitoring. Poster presented at the 2nd International Conference AAAR-GAeF, West-Berlin, Germany, 22–26 September 1986; pp. 22–26.
- Snyder, D.C.; Schauer, J.J. An inter-comparison of two black carbon aerosol instruments and a semi-continuous elemental carbon instrument in the urban environment. Aerosol Sci. Technol. 2007, 41, 463–474. [Google Scholar]
- Szwarc, A. Use of Bio-Fuels in Brazil. Proceedings of Session Workshop on Mitigation, SBSTA 21/COP 10, Buenos Aires, Argentina, 9 December 2004.
- Tan, R. Life-cycle environmental benefits of using bioethanol as a gasoline additive. Philipp. Eng. J.(Philippines) 2002, 23, 45–58. [Google Scholar]
- Mosey, N.J.; Muser, M.H.; Woo, T.K. Molecular mechanisms for the functionality of lubricant additives. Science 2005, 307, 1612–1615. [Google Scholar]
- Zimmermann, R.; Ferge, T.; Gälli, M.; Karlsson, R. Application of Single-particle laser desorption/ionization time-of-flight mass spectrometry for detection of polycyclic aromatic hydrocarbons from soot particles originating from an industrial combustion process. Rapid Commun. Mass Spectrom. 2003, 17, 851–859. [Google Scholar]
- De Abrantes, R.; Vicente de Assunção, J.; Pesquero, C.R.; Bruns, R.E.; Nóbrega, R.P. Emission of polycyclic aromatic hydrocarbons from gasohol and ethanol vehicles. Atmos. Environ. 2009, 43, 648–654. [Google Scholar]
- Noble, C.A.; Prather, K.A. Real-time measurement of correlated size and composition profiles of individual atmospheric aerosol particles. Environ. Sci. Technol. 1996, 30, 2667–2680. [Google Scholar]
- Allen, J.O.; Fergenson, D.P.; Gard, E.E.; Hughes, L.S.; Morrical, B.D.; Kleeman, M.J.; Gross, D.S.; Galli, M.E.; Prather, K.A.; Cass, G.R. Particle detection efficiencies of aerosol time of flight mass spectrometers under ambient sampling conditions. Environ. Sci. Technol. 2000, 34, 211–217. [Google Scholar]
- Park, K.; Kittelson, D.; McMurry, P. Structural properties of diesel exhaust particles measured by transmission electron microscopy (TEM): Relationships to particle mass and mobility. Aerosol Sci. Technol. 2004, 38, 881–889. [Google Scholar]
- Gross, D.S.; Atlas, R.; Rzeszotarski, J.; Turetsky, E.; Christensen, J.; Benzaid, S.; Olson, J.; Smith, T.; Steinberg, L.; Sulman, J.; et al. Environmental chemistry through intelligent atmospheric data analysis. Environ. Model. Softw. 2010, 25, 760–769. [Google Scholar]
- Eiguren-Fernandez, A.; Miguel, A.H. Spark ignition vehicle contributions to atmospheric fine elemental carbon concentrations in coastal, rural and urban communities using polycyclic aromatic hydrocarbon tracers in the cmb model modified for reactivity. J. Braz. Chem. Soc. 2009, 20, 1358–1364. [Google Scholar]
- Dockery, D.W.; Pope, C.A.; Xu, X.; Spengler, J.D.; Ware, J.H.; Fay, M.E.; Ferris, B.G.; Speizer, F.E. An association between air pollution and mortality in six US cities. N. Engl. J. Med. 1993, 329, 1753. [Google Scholar]
- Zanobetti, A.; Franklin, M.; Koutrakis, P.; Schwartz, J. Fine particulate air pollution and its components in association with cause-specific emergency admissions. Environ. Health 2009, 8, 58. [Google Scholar]
- Pearson, J.F.; Bachireddy, C.; Shyamprasad, S.; Goldfine, A.B.; Brownstein, J.S. Association between fine particulate matter and diabetes prevalence in the US. Diabetes Care 2010, 33, 2196. [Google Scholar]
- Venkataraman, C.; Lyons, J.M.; Friedlander, S.K. Size distributions of polycyclic aromatic hydrocarbons and elemental carbon. 1. sampling, measurement methods, and source characterization. Environ. Sci. Technol. 1994, 28, 555–562. [Google Scholar]
- DeCarlo, P.; Slowik, J.G.; Worsnop, D.R.; Davidovits, P.; Jimenez, J.L. Particle morphology and density characterization by combined mobility and aerodynamic diameter measurements. Part 1: Theory. Aerosol Sci.Technol 2004, 38, 1185–1205. [Google Scholar]
- Slowik, J.; Stainken, K.; Davidovits, P.; Williams, L.; Jayne, J.; Kolb, C.; Worsnop, D.; Rudich, Y.; DeCarlo, P.; Jimenez, J. Particle morphology and density characterization by combined mobility and aerodynamic diameter measurements. Part 2: application to combustion-generated soot aerosols as a function of fuel equivalence ratio. Aerosol Sci. Technol. 2004, 38, 1206–1222. [Google Scholar]
- Heyder, J.; Gebhart, J.; Rudolf, G.; Schiller, C.F.; Stahlhofen, W. Deposition of particles in the human respiratory tract in the size range 0.005-15 [Mu] m. J. Aerosol Sci. 1986, 17, 811–825. [Google Scholar]
- Falk, H.L.; Kotin, P.; Mehler, A. Polycyclic hydrocarbons as carcinogens for man. Arch. Environ. Health 1964, 8, 721–730. [Google Scholar]
- Cerniglia, C.E. Biodegradation of polycyclic aromatic hydrocarbons. Biodegradation 1992, 3, 351–368. [Google Scholar]
- Collins, J.; Brown, J.; Alexeeff, G.; Salmon, A. Potency equivalency factors for some polycyclic aromatic hydrocarbons and polycyclic aromatic hydrocarbon derivatives. Regul. Toxicol. Pharmacol. 1998, 28, 45–54. [Google Scholar]
© 2011 by the authors; licensee MDPI, Basel, Switzerland. This article is an open access article distributed under the terms and conditions of the Creative Commons Attribution license http://creativecommons.org/licenses/by/3.0/)
Share and Cite
Dutcher, D.D.; Stolzenburg, M.R.; Thompson, S.L.; Medrano, J.M.; Gross, D.S.; Kittelson, D.B.; McMurry, P.H. Emissions from Ethanol-Gasoline Blends: A Single Particle Perspective. Atmosphere 2011, 2, 182-200. https://doi.org/10.3390/atmos2020182
Dutcher DD, Stolzenburg MR, Thompson SL, Medrano JM, Gross DS, Kittelson DB, McMurry PH. Emissions from Ethanol-Gasoline Blends: A Single Particle Perspective. Atmosphere. 2011; 2(2):182-200. https://doi.org/10.3390/atmos2020182
Chicago/Turabian StyleDutcher, Dabrina D., Mark R. Stolzenburg, Samantha L. Thompson, Juan M. Medrano, Deborah S. Gross, David B. Kittelson, and Peter H. McMurry. 2011. "Emissions from Ethanol-Gasoline Blends: A Single Particle Perspective" Atmosphere 2, no. 2: 182-200. https://doi.org/10.3390/atmos2020182