Nitrogen Isotope Fractionation and Origin of Ammonia Nitrogen Volatilized from Cattle Manure in Simulated Storage

Abstract
: A series of laboratory experiments were conducted to establish the relationship between nitrogen (N) isotope composition of cattle manure and ammonia emissions, potential contribution of nitrogenous gases other than ammonia to manure N volatilization losses, and to determine the relative contribution of urinary- vs. fecal-N to ammonia emissions during the initial stage of manure storage. Data confirmed that ammonia volatilization losses from manure are most intensive during the first 2 to 3 days of storage and this coincides with a very rapid loss (hydrolysis) of urinary urea. Long-term (30 days) monitoring of δ15N of manure and emitted ammonia indicated that the dynamics of N isotope fractionation may be complicating the usefulness of the isotope approach as a tool for estimating ammonia emissions from manure in field conditions. The relationship between δ15N of manure and ammonia emission appears to be linear during the initial stages of manure storage (when most of the ammonia losses occur) and should be further investigated. These experiments demonstrated that the main source of ammonia-N volatilized from cattle manure during the initial 10 days of storage is urinary-N, representing on average 90% of the emitted ammonia-N. The contribution of fecal-N was relatively low, but gradually increased to about 10% by day 10. There appears to be substantial emissions of nitrogenous gases other than ammonia, most likely dinitrogen gas, which may account for up to 25% of N losses during the first 20 days of manure storage. This finding, which has to be confirmed in laboratory and field conditions, may be indicative of overestimation of ammonia emissions from cattle operations by the current emissions factors.1. Introduction
Ammonia (NH3) emitted from animal feeding operations is a major air and water pollutant contributing to surface water eutrophication, soil acidity, and fine particulate matter (PM2.5) formation [1,2]. Current estimates for livestock contribution to anthropogenic NH3 in the U.S. are at 50% [1]. Some reports have indicated, however, that a significant portion of manure N lost during storage may be as non-NH3 gases, such as dinitrogen gas (N2) [3]. The latter authors suggested, for example, that N2 emissions from swine lagoons are many times greater than emissions of NH3. Emissions of N2 from cattle manure may be also high, particularly during the initial stage of manure storage when the bulk of urinary N is volatilized. If this is the case, mass balance, or other indirect approaches (i.e., not measuring NH3 emissions directly; isotope, manure minerals:N ratios [4]) for estimating NH3 emissions may not be accounting for gaseous non-NH3-N losses and thus, NH3 emissions from cattle operations may be overestimated. For example, 25 and almost 50% of the daily N flow in dairy and beef cattle operations, respectively, were unaccounted as milk, daily body weight gain, or manure [2]. How much of this loss is NH3 and how much non-NH3-N is unknown. It is important to point out that N2 is an inert gas and, unlike NH3, is not considered an air pollutant.
Of the two major N pools in cattle (or most farm animals) manure, feces and urine, the latter (specifically, urinary urea in cattle) is generally considered to be the major source of emitted NH3 [5]. Although the biological and biochemical ground for such an assumption is solid, there is surprisingly little experimental data to support it. For example, the conclusions of Bussink and Oenema [5] are primarily based on a study with soil application of synthetic urinary N compounds [6]. To our knowledge, only one study directly investigated urinary vs. fecal N contribution to volatile N emissions from animal manure [7]. Nitrogenous gas emissions from manure are to a large extent dependent on manure composition [2], which in turn depends on the animals' diet. Thus, it is important to quantify the actual contribution of urinary N to these emissions, particularly in the initial stages of manure storage when emissions are most intensive, which would allow for successful mitigation of manure emissions through dietary means.
A substantial part of mitigating manure emissions, including NH3, is the availability of accurate and practical methods for estimating emissions. Direct measurement techniques are “the gold standard”, but are affected by a multitude of environmental factors (temperature, wind velocity; see later discussion) and are of limited value when, for example, the effect of diet on manure emissions is evaluated [2,8]. The U.S. Environmental Protection Agency (EPA) recently released data from the National Air Emissions Monitoring Study [9], in which gaseous emissions, including NH3, from several commercial dairy operations were monitored. In this study, barn NH3 emissions varied from 4.6 (a California dairy) to 78 g/cow/day (a Washington dairy). Similar large variability in directly monitored NH3 emissions from dairy farms (0.82 to 250 g NH3/cow/day) or beef feedlots (50 to 283 g NH3/animal/day) was reported in a recent literature review [2]. With such large variability, determining the specific effect of diet is practically impossible. Therefore, we have investigated indirect methods for estimating manure NH3 emissions, utilizing minerals:N ratios and natural N isotope fractionation [4]. The isotope method appeared promising, however, the relationship between δ15N of manure and NH3 volatilization is a dynamic process and longer monitoring periods are necessary to determine the usefulness of this approach for practical applications.
In this study, a series of laboratory experiments were conducted with the following objectives: (1) establish the relationship between manure N isotope composition and NH3 emissions beyond 10 days of storage; (2) investigate the potential contribution of nitrogenous gases other than NH3 to manure N volatilization losses; and (3) determine the relative contribution of urinary- vs. fecal-N to NH3 emissions during the initial stage of manure storage. We hypothesized that: (1) δ15N of NH3 and manure N will continue to increase beyond 10 days and will reach a plateau; (2) non-NH3 gases, such as N2, may account for a significant portion of manure N losses, particularly during the initial storage phase; and (3) urinary urea-N is the primary source of NH3-N emitted from cattle manure during the initial, most intensive, phase of manure N volatilization losses.
2. Materials and Methods
2.1. Manure Preparation and Experimental Settings
Feces and urine for these experiments were collected from dairy cows fed a diet containing approximately 60% forage (corn silage, alfalfa haylage, and grass hay) and 40% concentrate (corn grain, whole-heated soybeans, canola meal, a bakery byproduct, cottonseed hulls, a sugar blend, a non-protein N source, and a mineral/vitamin premix) as a total mixed ration. The diet contained (as % of dry matter, DM): crude protein, 15.5; neutral-detergent fiber, 32.9; non-structural carbohydrates, 41.6, and total digestible nutrients, 72.3. Cows were on average 149 ± 40 days in milk, produced 44 ± 1.4 kg/day milk, and were housed at the Pennsylvania State University's dairy research center. All procedures involving animals were reviewed and approved by the Pennsylvania State University's Institutional Animal Care and Use Committee.
In each experiment, 2 cows were used as donors of feces and urine. Feces and urine were collected directly from the rectum and by massaging the vulva, respectively, and combined on an equal weight basis to produce one composite fecal and one urine sample for each experiment. The samples were stored frozen (−20 °C) until needed. Feces and urine were thawed and mixed immediately before being used in a 1:1 ratio (w/w) to produce manure for each experiment. Combined feces and urine (800 g fresh weight) were incubated in a modified continuous culture fermenter system [10]. Briefly, the system consisted of 2 L capacity incubation vessels with ports allowing manure sampling and collection vessels containing 500 mL of 0.5 M H2SO4 to capture the released ammonia. Air, moisturized by passing through a sealed water jar, was continuously propelled through the system at a rate of 1 L/min to maintain positive pressure and carry manure gases through the acid solution. The acid solution was replaced daily and aliquots were analyzed for NH3-N and 15N. All experiments were carried out at 25 °C for 10, 20, or 30 days.
Two experiments (Exp. 1 and 2) were designed to quantify NH3-N volatilization losses, manure urea hydrolysis, and investigate N isotope fractionation during manure storage. In each experiment,3 incubation vessels were used (n = 3). The incubations were carried out for 20 or 30 days (Exp. 1 and 2, respectively). Manure samples (20 to 40 g each) were collected for total N, 15N, and urea-N analyses on day 0, 1, 2, 3, 4, 5, 6, 7, 8, 9, 10, 12, 14, 16, 18, 19 and 20 (Exp. 1), or day 0, 1, 3, 5, 8, 11, 16, 21, 26, and 31 (Exp. 2). Net manure N or 15N loss was calculated with correction for the amount of N or 15N removed with sampling (assuming an equivalent proportion of N or 15N lost from the sample as from manure remaining in the incubation vessel). Similarly, NH3-N or NH3-15N recovered in the acid trap was corrected for NH3-N or NH3-15N that would have been emitted from the samples removed from the incubation vessels.
The N isotope composition of manure- and emitted NH3-N was expressed as delta 15N (δ15N) and calculated as:
Experiment 3 was designed to quantify the contribution of NH3-N to total N volatilization losses from manure. Incubation length and sampling were as for Exp. 1, except that the manure urea-N pool was labeled by incorporating 200 mg [15N2] urea (98 atom % 15N; Cambridge Isotope Laboratories Inc., Andover, MA) at day 0. Daily manure and acid-NH3 solution samples were analyzed for 15N-enrichment, expressed as atom % excess [APE; atom % 15N - 0.3663 (the natural abundance of 15N in air)].
Experiment 4 was designed to investigate the relative contribution of fecal and urinary N to NH3-N emitted from manure. Two-ruminally cannulated cows were used as donors of feces and urine. Feces and urine were collected in 2 separate sampling periods (Periods 1 and 2). In Period 1, unlabeled with 15N feces and urine were collected. In Period 2, the cows received intraruminal doses of 99 atom % 15NH4Cl (Cambridge Isotope Laboratories Inc.) to produce 15N-labeled feces and urine. A total of 4 g/day 15NH4Cl were dosed intraruminally to each cow for 5 consecutive days. The isotope was dissolved in 1 L distilled water and dosed twice daily (2 g at each dosing), immediately before the morning and afternoon feedings. Approximately 10 kg of ruminal contents were removed from the rumen of each cow, the isotope solution was mixed in, and the labeled contents were returned to the rumen. Feces and urine were collected on day 4 (at 0700 and 1500 h) and 5 (1100 h) of each sampling period (i.e., allowing 3 day for labeling of animal excreta) and frozen. Samples of unlabeled or 15N-labeled feces and urine were thawed and composited on an equal weight basis immediately before being used in Exp. 4. Manure containing 15N-labeled feces (FLM) was prepared by mixing 400 g (fresh weight) of unlabeled urine and 400 g of 15N-labeled feces (per incubation vessel). Manure containing 15N-labeled urine (ULM) was prepared by mixing 400 g of 15N-labeled urine and 400 g of unlabeled feces. Incubation conditions were as for Exp. 1, except incubation length was 10 days. Incubation vessels were replicated within incubation and incubation was repeated (n = 4 for the isotope data, or n = 8 for the manure composition and NH3-N emission data). Nitrogen-15 enrichment of manure and NH3-N recovered in the acid solution were used to calculate fecal and urinary N contribution to NH3-N emitted from manure as follows:
NH3-N originating from fecal N (FLM manure) = 15N-enrichment (APE) of NH3-N ÷ 15N-enrichment (APE) of 15N-labeled feces
NH3-N originating from urinary N (ULM manure) = 15N-enrichment (APE) of NH3-N ÷ 15N-enrichment (APE) of 15N-labeled urine
2.2. Sample Analyses
Daily manure samples were immediately acidified with 2 mL of 0.5 M H2SO4 and freeze-dried (VirTis Ultra 35XL freeze-drier; SP Scientific, Gardiner, NY) to determine DM content. An aliquot of the dried manure sample was pulverized using Mixer Mill MM 200 (Retsch, Newtorn, PA) and analyzed for N and 15N on a Costech ECS 4010 C/N/S elemental analyzer (Costech Analytical Technologies, Inc., Valencia, CA) interfaced to a Delta V Advantage Isotope-Ratio Mass Spectrometer (ThermoFinnigan MAT GmbH, Bremen, Germany). Urine samples (60 μL) were weighed directly into tin capsules (Costech Analytical Technologies, Inc.), freeze-dried, and analyzed for N and 15N. Aliquots (20 mL) of the daily manure samples were centrifuged at 20,000 × g for 20 min, the supernatant was precipitated with 65% (w/v) trichloroacetic acid solution (5% w/v final concentration), recentrifuged at 20,000 × g for 20 min, and analyzed for NH3-N [11] and urea-N (Stanbio Urea Nitrogen Kit 580, Stanbio laboratory, Inc., San Antonio, TX) concentrations. Samples for analysis of 15N enrichment of NH3-N were prepared utilizing the diffusion method [12].
2.3. Statistical Analysis
Manure composition and ammonia losses data were analyzed by analysis of variance using the GLM procedure of SAS (2003; SAS Inst. Inc., Cary, NC) with experiment in the model. Data from Exp. 4 were analyzed by analysis of variance using the GLM procedure of SAS with treatment (i.e., 15N-labeled feces or urine), incubation, and treatment × incubation interaction included in the model; the interaction was not significant for any variable. The 15N-enrichment data model included only treatment. Significant differences were declared at P ≤ 0.05. Means are presented as least squares means. When the main effect was significant, means were separated by pairwise t-test (diff option of PROC GLM). Manure-, urea-, and NH3-N concentrations and 15N data were fitted to various non-linear regression models (exponential decay, exponential rise to a maximum, or sigmoid; SigmaPlot 10.0, Systat Software Inc., San Jose, CA).
3. Results and Discussion
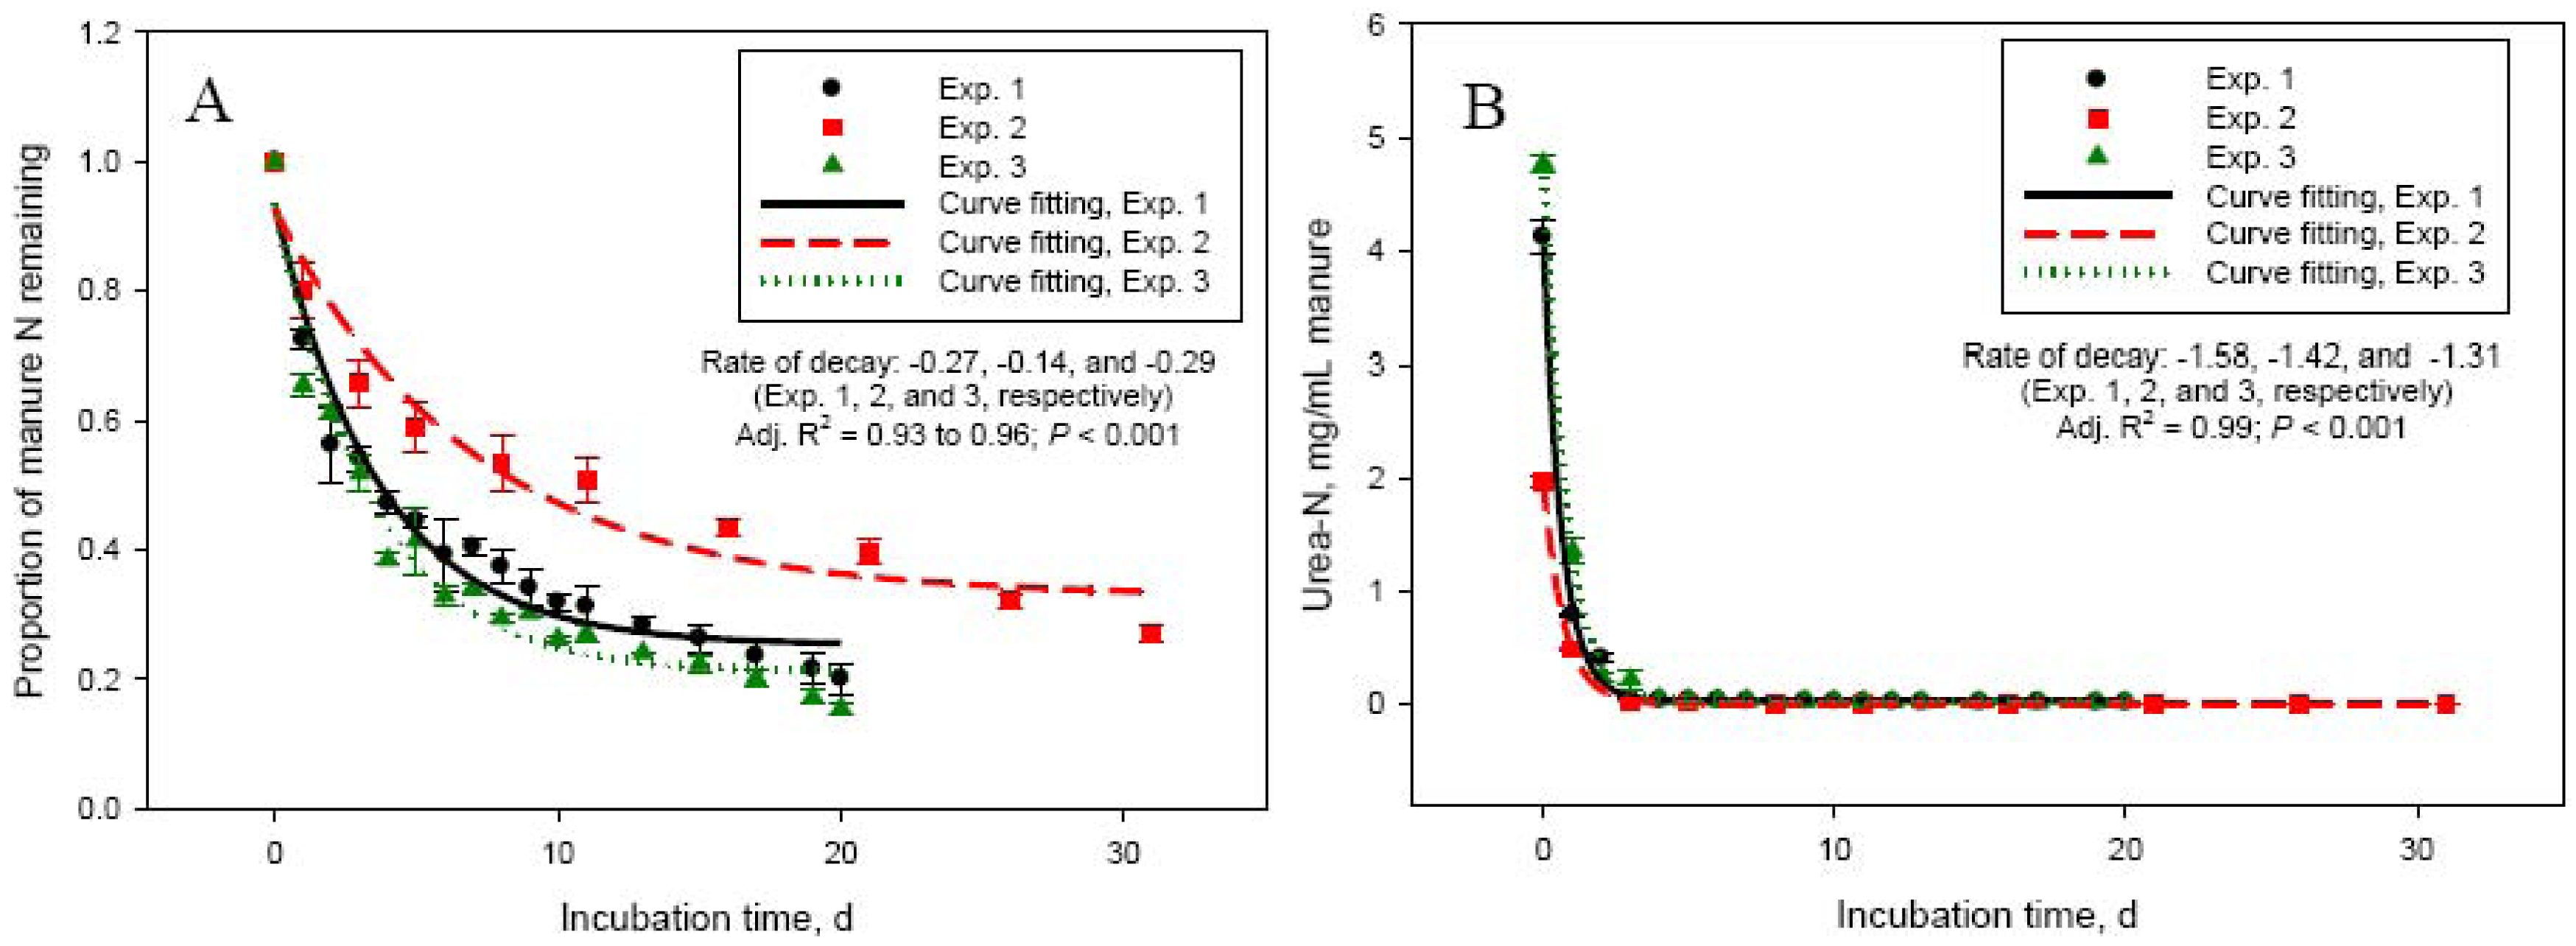
Dry matter and concentration of total and urea-N in manure used in this study varied significantly among experiments (Table 1). Manure N and specifically urea-N are important factors determining NH3-N volatilization losses from cattle manure [2]. Manure in Exp. 2 had about 50 to 60% lower (P < 0.001) urea- and total-N concentrations compared with manure used in Exp. 1, 3, and 4. This led to significantly lower daily manure N losses in Exp. 2, compared with Exp. 1, 3, and 4. The highest (P < 0.001) daily N losses were in Exp. 4, which can be explained by the shorter duration of this experiment (10 days), compared with the other experiments (20 or 30 days). The most rapid loss of manure N and most intensive NH3-N emissions occurred during the first 5 to 6 days (Figure 1A,C). This was matched by an equivalent rapid increase in NH3-N concentration in manure, reaching a peak at day 2 to 5. Initial concentration of ammonium in manure was negligible, but rapidly increased (to about 3 to 5 mg/mL manure) through day 5 in both Exp. 1 and 2 due to hydrolysis of urinary urea (data not shown). The much more rapid decline in manure urea-N concentration (Figure 1B) suggests that although urea hydrolysis took place immediately following mixing of feces and urine, NH3-N volatilization was a slower process. As shown in Table 1 and Figure 1 (Panels A and C), the quantity and intensity of manure N losses and NH3-N emissions were much lower in Exp. 2. As a proportion of manure N at day 0, N losses were similar (P > 0.05) between Exp. 1, 2, and 4, even though the duration of Exp. 2 was 30 days (compared with 20 or 10 days for Exp. 1 and 4, respectively). This again, emphasizes the importance of urinary urea-N concentration in the early stages of storage for the magnitude of NH3-N losses from manure. The daily NH3-N losses were the lowest (P < 0.001) in Exp. 2, but the highest as a proportion of manure N losses compared with the other experiments (Table 1). The lowest total recovery of manure N lost during the incubation was for Exp. 4, which had the shortest incubation length (10 days).
The higher manure N recovery as NH3-N in Exp. 3 vs. Exp. 1 (both 20 days in length) can be related to the lower N concentration of manure in Exp. 3. The relationship between manure N concentration and manure N recovery as NH3-N, which was linear and negative for Exp. 1, 2, and 3 [147.7 − 11.0 × N concentration in manure (%); R2 = 0.86; P < 0.001], presents an interesting phenomenon. Recovery of manure N as NH3-N captured in the acid trap was generally low. Recovery was even lower in the initial stages of the incubation (on average, 19.2 ± 0.72% during the first 3 days of incubation) suggesting that: (1) the acid trap did not effectively capture NH3-N emitted from manure, particularly when emissions were most intensive, or (2) N was being lost from manure in forms other than NH3-N. We have investigated the factors affecting the NH3-N trapping efficiency of acid solutions and reported that efficiency decreases with increasing the amount of NH3-N being emitted [13]. Decreased trapping efficiency, however, could not explain the large discrepancy between manure N losses and NH3-N captured in the acid trap in Exp. 1 through 3. To further eliminate the NH3-N trapping capacity of the acid solution as a factor for the low recovery of manure N lost during the incubation process, we conducted a series of experiments comparing the acid trap system with direct measurement of NH3-N emitted from the incubation vessels using a photoacoustic gas analyzer INNOVA 1412 (AirTech Instruments, Ballerup, Denmark), which allowed continuous monitoring of NH3-N concentration in the gas flowing out of the system. The conclusion from these experiments was that the 2 measurement methods gave similar NH3-N recovery. For example, cumulative NH3-N emissions were 108 vs. 121 mg in 24 h (SEM = 4.99; P = 0.10) and 128 vs. 136 mg in 72 h (SEM = 6.40; P = 0.50) for the acid trap and the INNOVA gas analyzer, respectively.
The possibility of a significant gaseous N loss, other than NH3-N, was further investigated. Nitrous oxide emission is expected to be negligible in conditions as those utilized in the current study due to the lack of nitrifying and denitrifying microorganisms in cattle feces [14] and relatively short storage time. Adviento-Borbe et al. [15] and Arriaga et al. [16], for example, reported insignificant N2O emissions off the barn floor in dairy farms. In an experiment related to this study, N2O emissions were negligible from dairy manure stored in laboratory conditions or during the first 100 h following soil application [17]. If sufficient time (at least 3 weeks) is allowed, however, cattle manure will generate N2O in simulated storage conditions [18]. Bussink and Oenema [5] and Harper et al. [19] indicated that some N may be lost from lagoons/retention ponds via reduction of nitrate to N2O and dinitrogen gas (N2). A number of possible chemical and biological mechanisms may exist for formation of N2 during manure storage [20] and such processes, including chemical, non-biological conversion of ammonium to N2 (termed “chemo-denitrification”) have been reported to be responsible for a significant amount of gaseous N losses from swine lagoons [3]. In a separate series of experiments we used pure argon gas (99.99%; GTS-Welco, Allentown, PA) instead of air to provide airflow in the manure storage system used in Exp. 1 through 4 and analyzed the composition of the gas flowing out of the system. Preliminary results from these experiments (data not shown) indicated very intensive N2 emissions in the first 5 h of simulated manure storage, suggesting that N2 gas may represent a significant N loss in the initial stages of the manure storage process and likely accounts for a significant part of the N losses observed in the current study.
As discussed earlier, farm NH3 emissions are influenced by important environmental factors and such data are not suitable for evaluating the impact of dietary mitigating strategies. For example, in a current on-farm project with 12 commercial Pennsylvania dairy farms, we monitored barn floor NH3 emissions in spring and fall of Year 1 and then again in Year 2 of the project, after dietary crude protein concentrations were reduced by about 1%-unit [21]. On average, barn floor NH3 emissions for the farms, in which the dietary protein reduction was documented by regular sampling, were reduced by about 65% (445 vs. 156, mg/m2/h). However, average air temperatures during the emission measurements were 14 °C and 5 °C, respectively. Thus, in this particular project, it was impossible to distinguish the effect of diet from the effect of environment. Manure samples from the same farms (collected, stored, processed, and analyzed as in the current study) showed unequivocally a reduction in laboratory NH3-N emissions by about 36% for the low-protein period compared with the control, high-protein feeding period. Laboratory methods, naturally, have the limitation of not accounting for the environmental factors affecting emissions, but are useful in quantifying the effect of dietary manipulations on the gas-emitting potential of manure [2].
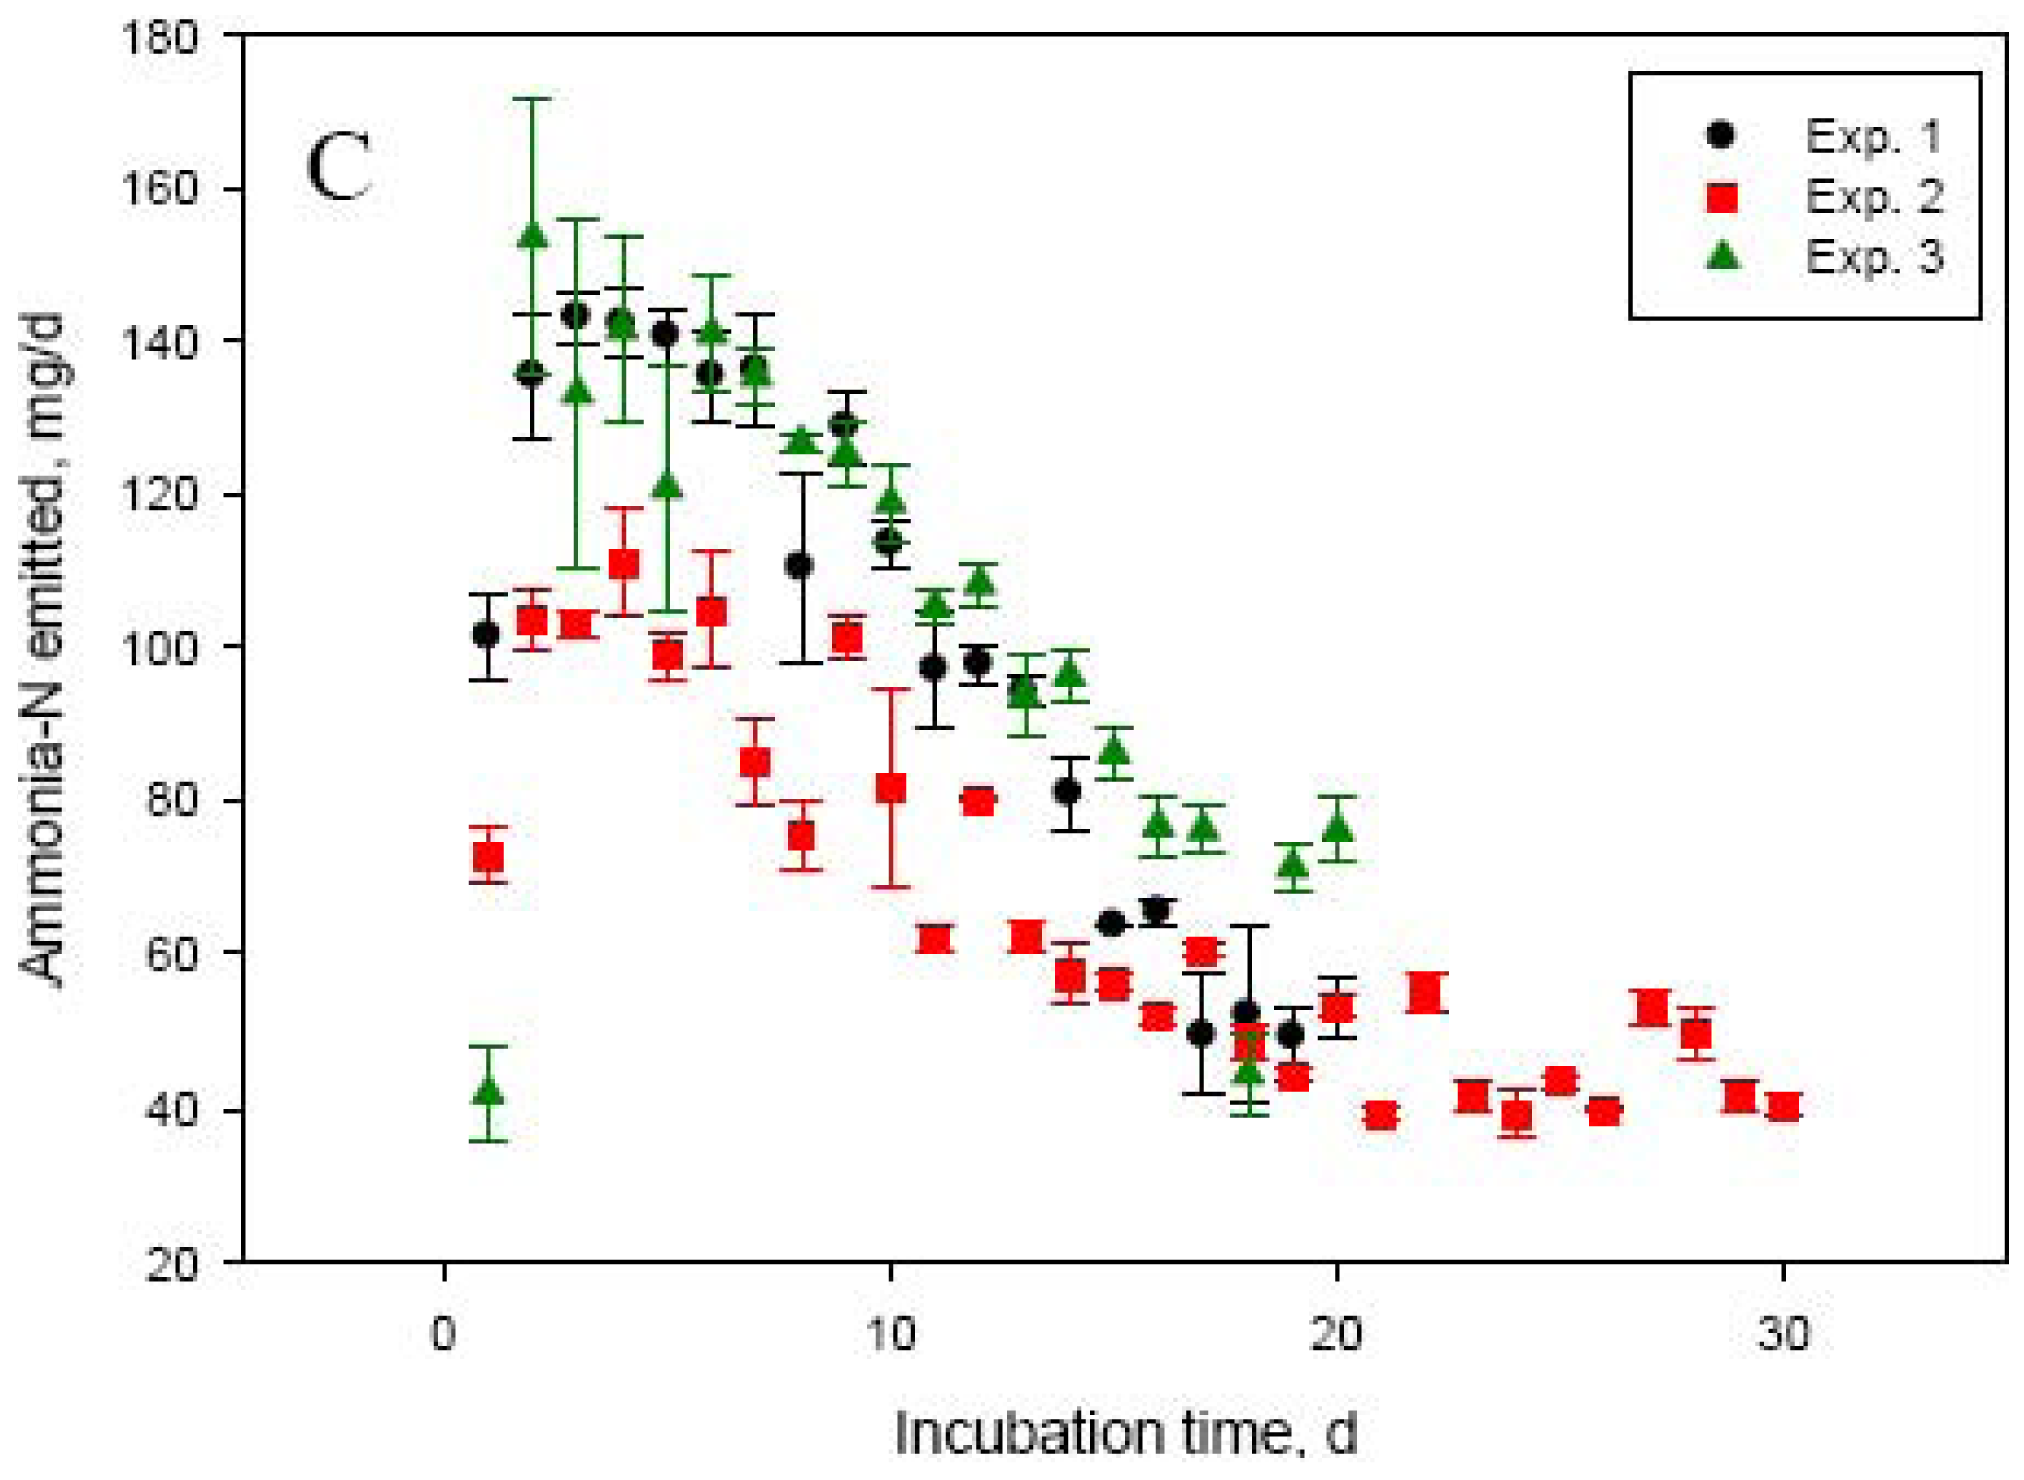
One of the objectives of the current study was to further investigate the relationship between NH3-N volatilization and N isotope composition of manure. We first reported a significant N isotope fractionation in cattle manure during storage due to NH3-N volatilization [4,22]. The isotope fractionation factor associated with NH3-N volatilization is one of the highest in the N cycle (∼1.029, [23]), which would result, when conditions are favorable, in a rapid increase in δ15N of manure during storage. The process has been discussed in length [4]. Experiments 1 and 2 were used to determine N isotope ratios beyond the short incubation time utilized in our original studies [4,22].
Delta 15N of manure rapidly increased from 0.09 ± 0.36 (day 0) to 10.1 ± 0.42 (day 5) in Exp. 1 and from −1.12 ± 0.61 (day 0) to 5.99 ± 0.40 (day 5) in Exp. 2 (Figure 2A). This rapid increase in δ15N was due to the loss of depleted in 15N NH3-N. Delta 15N of volatilized NH3 was −22.5 ± 0.68 on day 1 in Exp. 1 and −15.1 ± 0.17 on day 2 (day 1 measurement was lost) in Exp. 2 and increased to −16.5 ± 0.09 (day 5) and −1.3 ± 2.55‰ (day 20) in Exp. 1 and to −14.9 ± 0.90 (day 5) and 2.38 ± 1.45‰ (day 30) in Exp. 2 (Figure 2B). As hydrolysis of urea to ammonium (which as Figure 1B shows is a very rapid process), NH3-N volatilization, and N isotope fractionation take place, δ15N of NH3-N and the dissolved in manure ammonium will continue to increase until the ammonium is exhausted and the NH3-N obtains the δ15N value of the original ammonium. Indeed, as Figure 2B shows, δ15N of volatilized NH3-N continued to increase in a sigmoid fashion through day 30 of Exp. 2. The lower asymptote levels for both Exp. 1 and 2 indicated highly depleted in 15N NH3-N at the beginning of the manure storage process. The length of Exp. 1, however, was apparently too short to clearly observe the point of equilibrium visible in Exp. 2 (δ15N upper asymptote: 19.8‰). The inflexion point (i.e., the point of maximum rate of δ15N increase) was around day 13 and day 16 for Exp. 1 and Exp. 2, respectively. Delta 15N of manure reached a plateau beyond day 6 (Figure 2, Panel A), which coincided with the decline in NH3-N emission rates. Although changes in δ15N of manure parallel NH3-N losses, the dynamics of δ15N of NH3-N will likely make application of the N isotope approach for estimating manure NH3-N emissions difficult in practical farm conditions, which was our original goal [4]. Nevertheless, the relationship between manure δ15N and NH3-N volatilization losses appears to be linear in the initial stages of manure storage, when NH3-N losses are most intensive, and deserves further investigation.
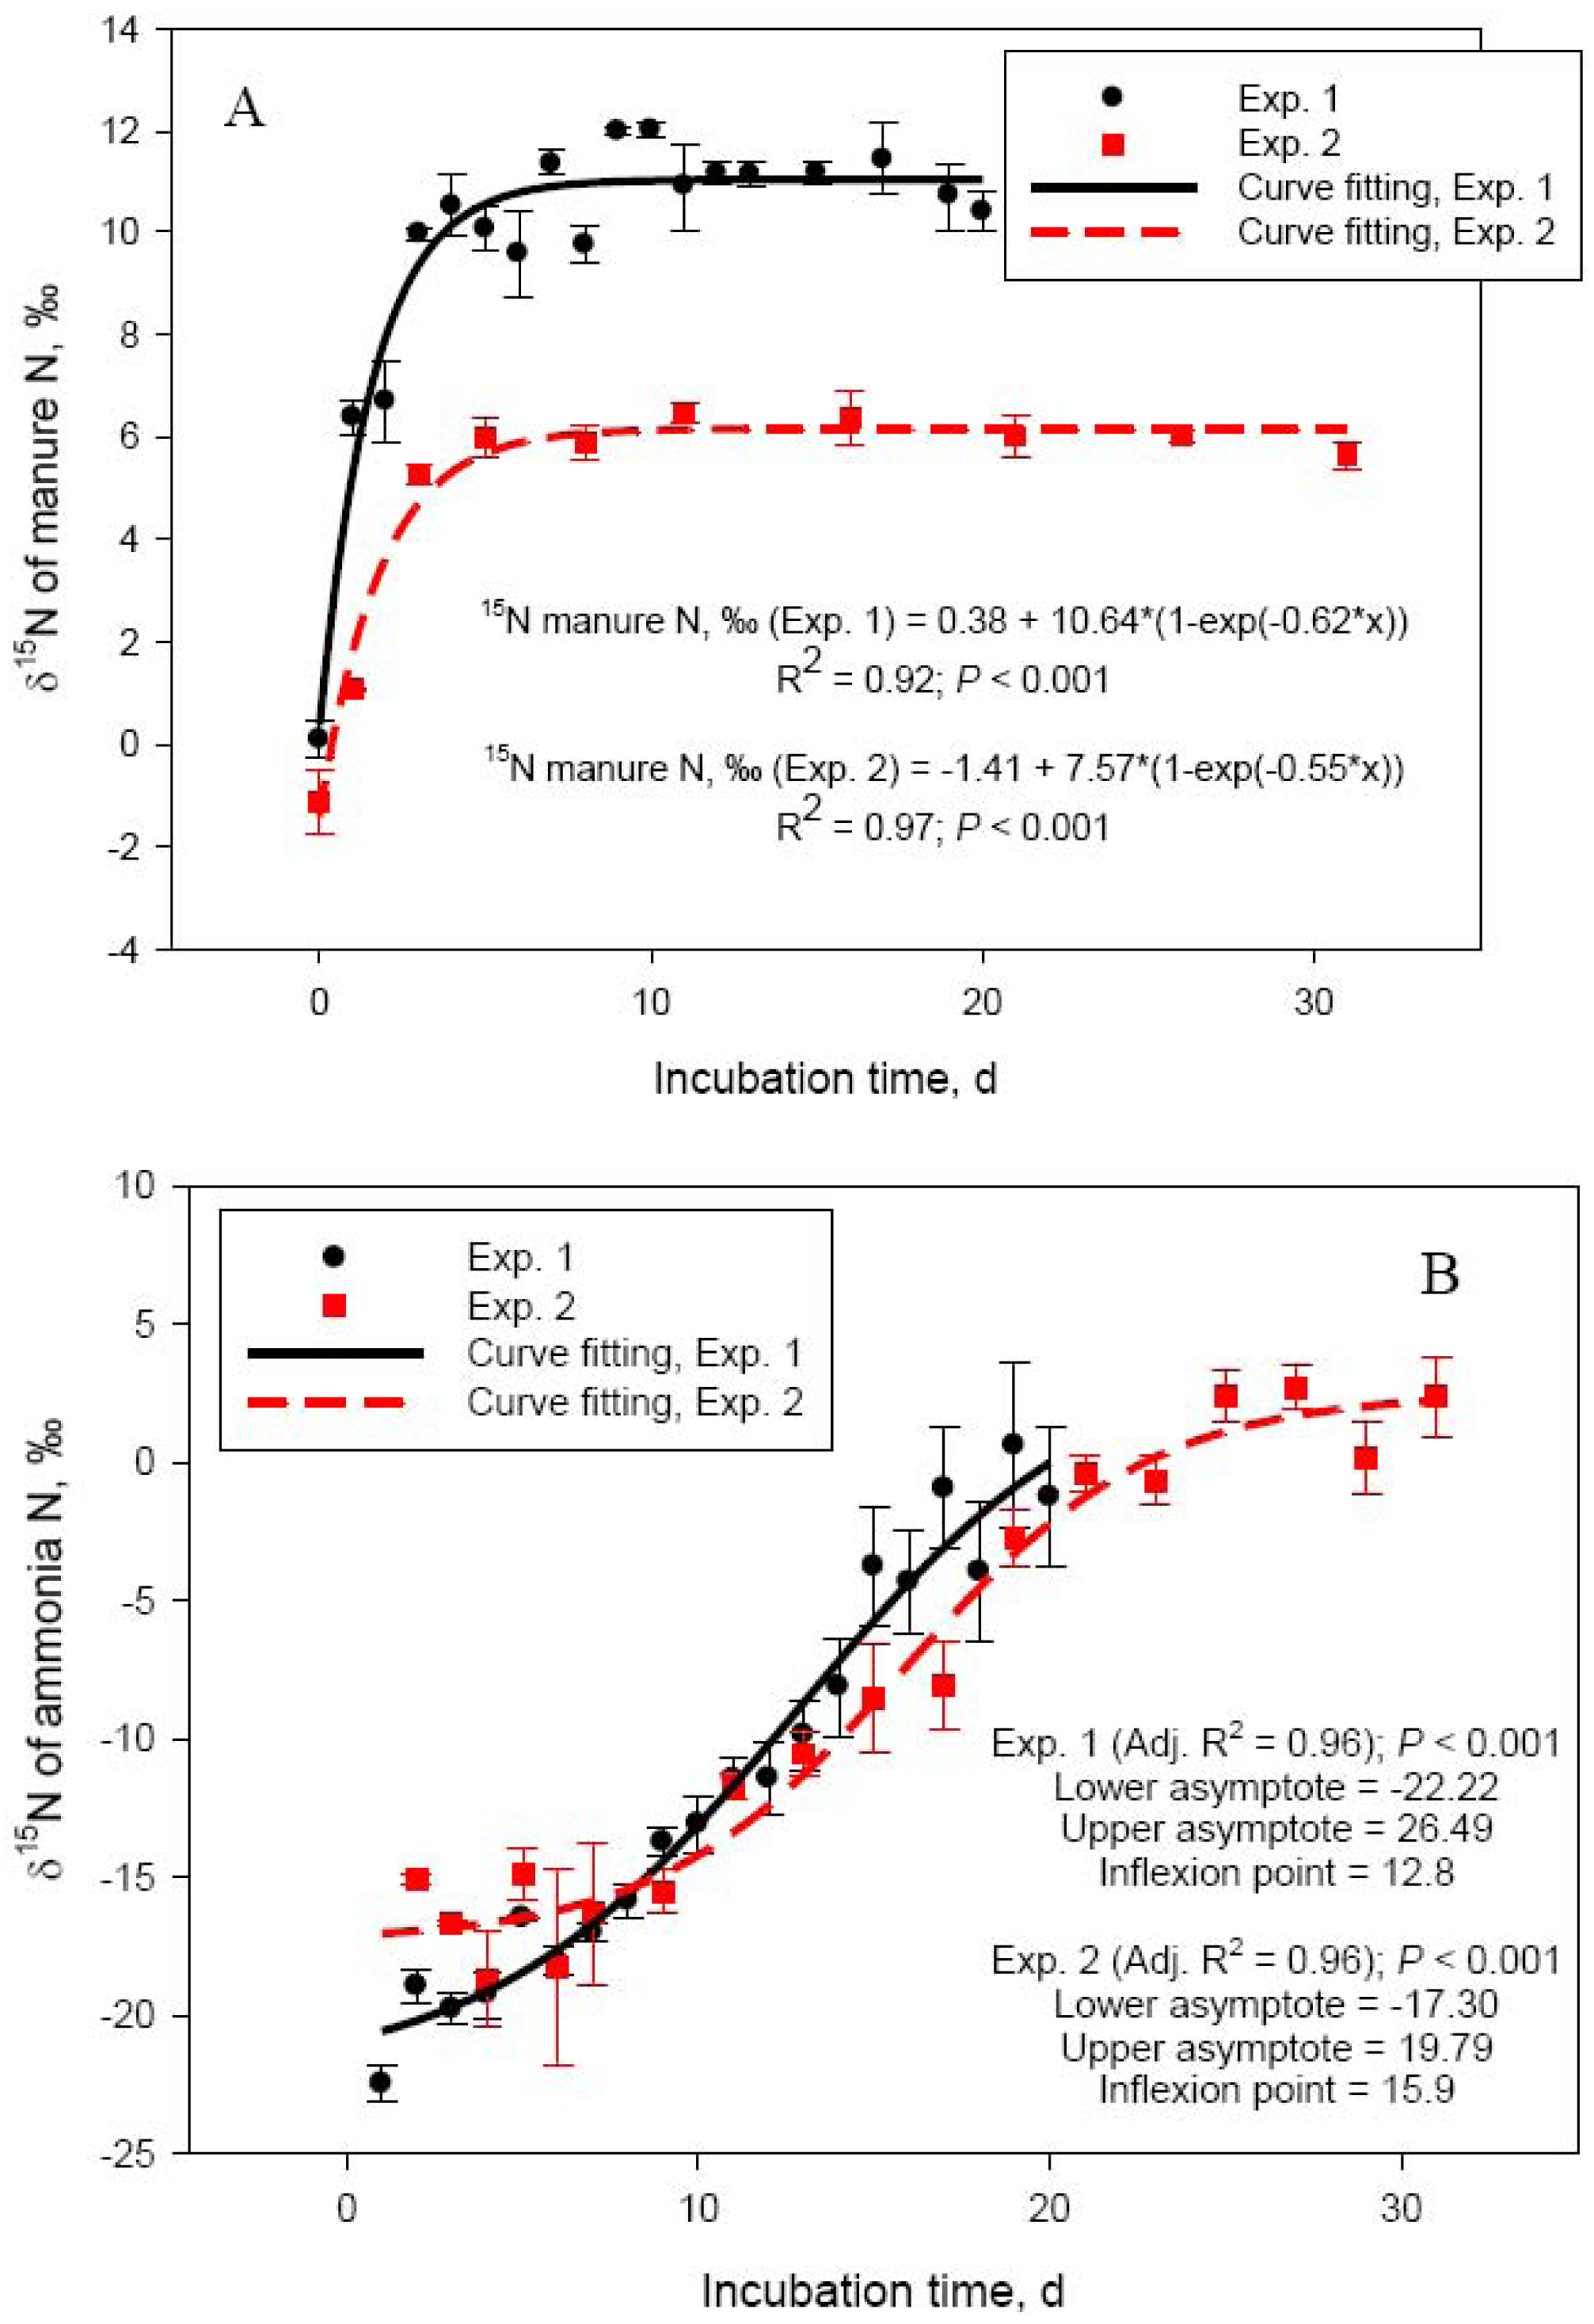
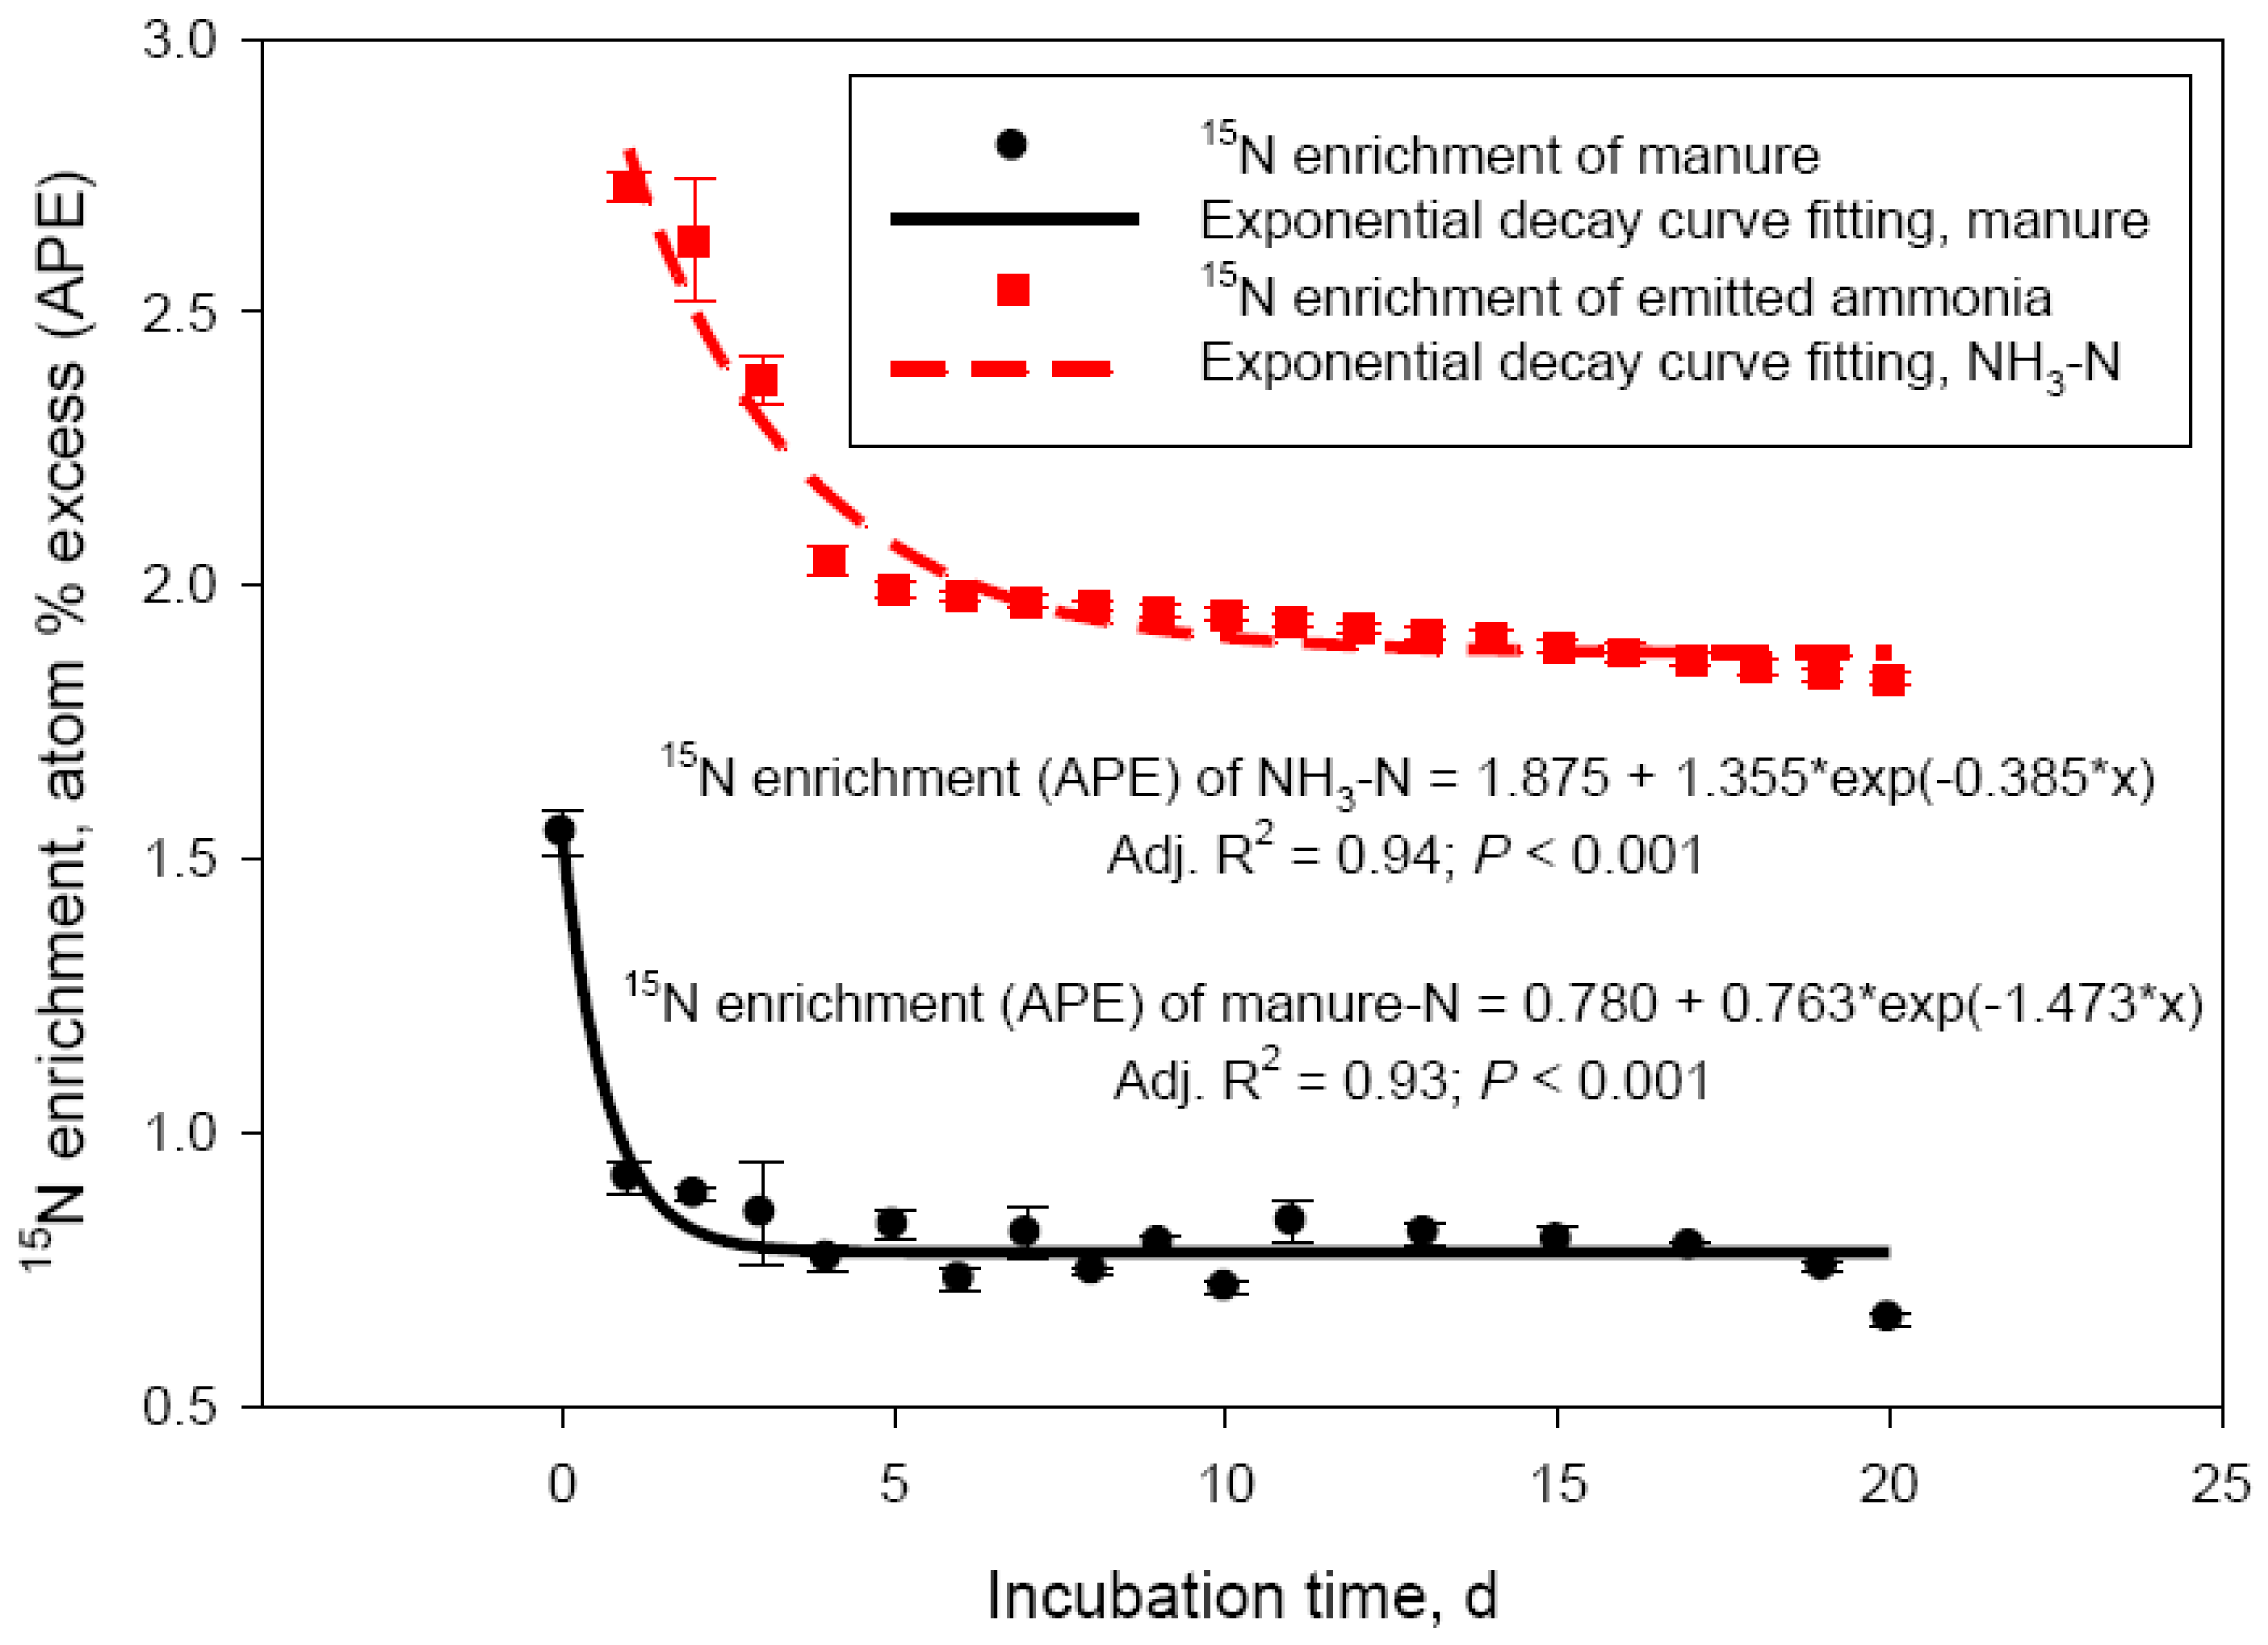
The discrepancy between net manure N losses and NH3-N recovered in the acid trap was further investigated in Exp. 3. By labeling the urea N pool with 15N, the main source of emitted NH3-N could be traced. Results of this experiment are shown in Figure 3. Nitrogen-15 enrichment of both manure- and NH3-N pools rapidly declined within 5 days of the incubation (Figure 3), representing the most intensive phase of NH3-N losses. For the manure-N pool, the 15N decay clearly reflected loss of highly enriched in 15N volatile N. The decline in 15N-enrichment of the NH3-N pool followed the 15N decay of the source manure N pool and reflected the rapid decline in urea-N concentration observed in these experiments (Figure 1B). The decline in 15N-enrichment, however, was much more rapid for manure- compared with NH3-N (rate constants of 1.473 and 0.385 APE/day, respectively). This would clearly represent 15N loss other than NH3-N, which is in agreement with the suggested large N2 loss in the initial hours of manure storage (see earlier discussion) and is supported by the studies of Harper et al. [3] with swine manure. Although isotope fractionation and discrimination against the heavier N isotope, as reported for Exp. 1 and 2, were undoubtedly taking place in Exp. 3, the δ15N values of the manure-N pool in this experiment (δ15N 4306 ± 77.7‰) was so much greater than the natural abundance of 15N in manure (δ15N ‒0.51± 0.42‰; Exp. 1 and 2) that these processes could not have had a measurable impact on the 15N-enrichment data from Exp. 3. The absolute losses of 15N during the 20 day simulated manure storage were on average 68.2 ± 2.45 mg. This represented approximately 70% of the 98 mg urea-15N introduced into each incubation vessel at day 0 (200 mg of 98 atom % 15N-urea). The amount of 15N recovered as NH3-N was 51.2 ± 1.85 mg, or 75.2 ± 4.04% of the urea-15N lost in 20 days as NH3-N. The difference of urea-15N lost and trapped as NH3-N (about 25%) is supportive of the hypothesis that gaseous N losses other than NH3 may be responsible for part of manure N losses during storage. This process is likely taking place exclusively in the initial days of manure storage. Averaged manure-15N and NH3-15N losses data were fitted to a non-linear model (double exponential decay; data not shown) and the predicted value were used to calculate urea-15N recovery as NH3-N during the initial 3 days of manure storage. As expected, recovery of daily urea-15N lost from manure as NH3-N was the lowest at day 1 (30.4%) and day 2 (45.4%) of the incubation; recovery was complete (102.7%) by day 3. This trend supports the concept that volatile nitrogenous compounds other than NH3 (likely N2) could account for as much as 50 to 70% of the N losses during the initial 48 h of cattle manure storage. Harper et al. [3] reported 2 to 8 times greater N2 than NH3-N emissions from swine lagoons in Georgia and North Carolina. Dinitrogen gas emission would be still dependent on manure composition, specifically urinary urea excretion by the animal; lagoon ammonium concentration was the primary factor determining N2 emissions in the Harper et al. [3] study. These authors concluded that swine lagoons emit much less NH3-N than previously estimated. Based on results from the current study, similar conclusion may be drawn for cattle manure. Our laboratory data, indicating about 25% manure N losses unaccounted as NH3-N (in 20 days), need to be confirmed in field experiments, where a multitude of environmental factors affect N volatilization losses from dairy and beef cattle operations [2].
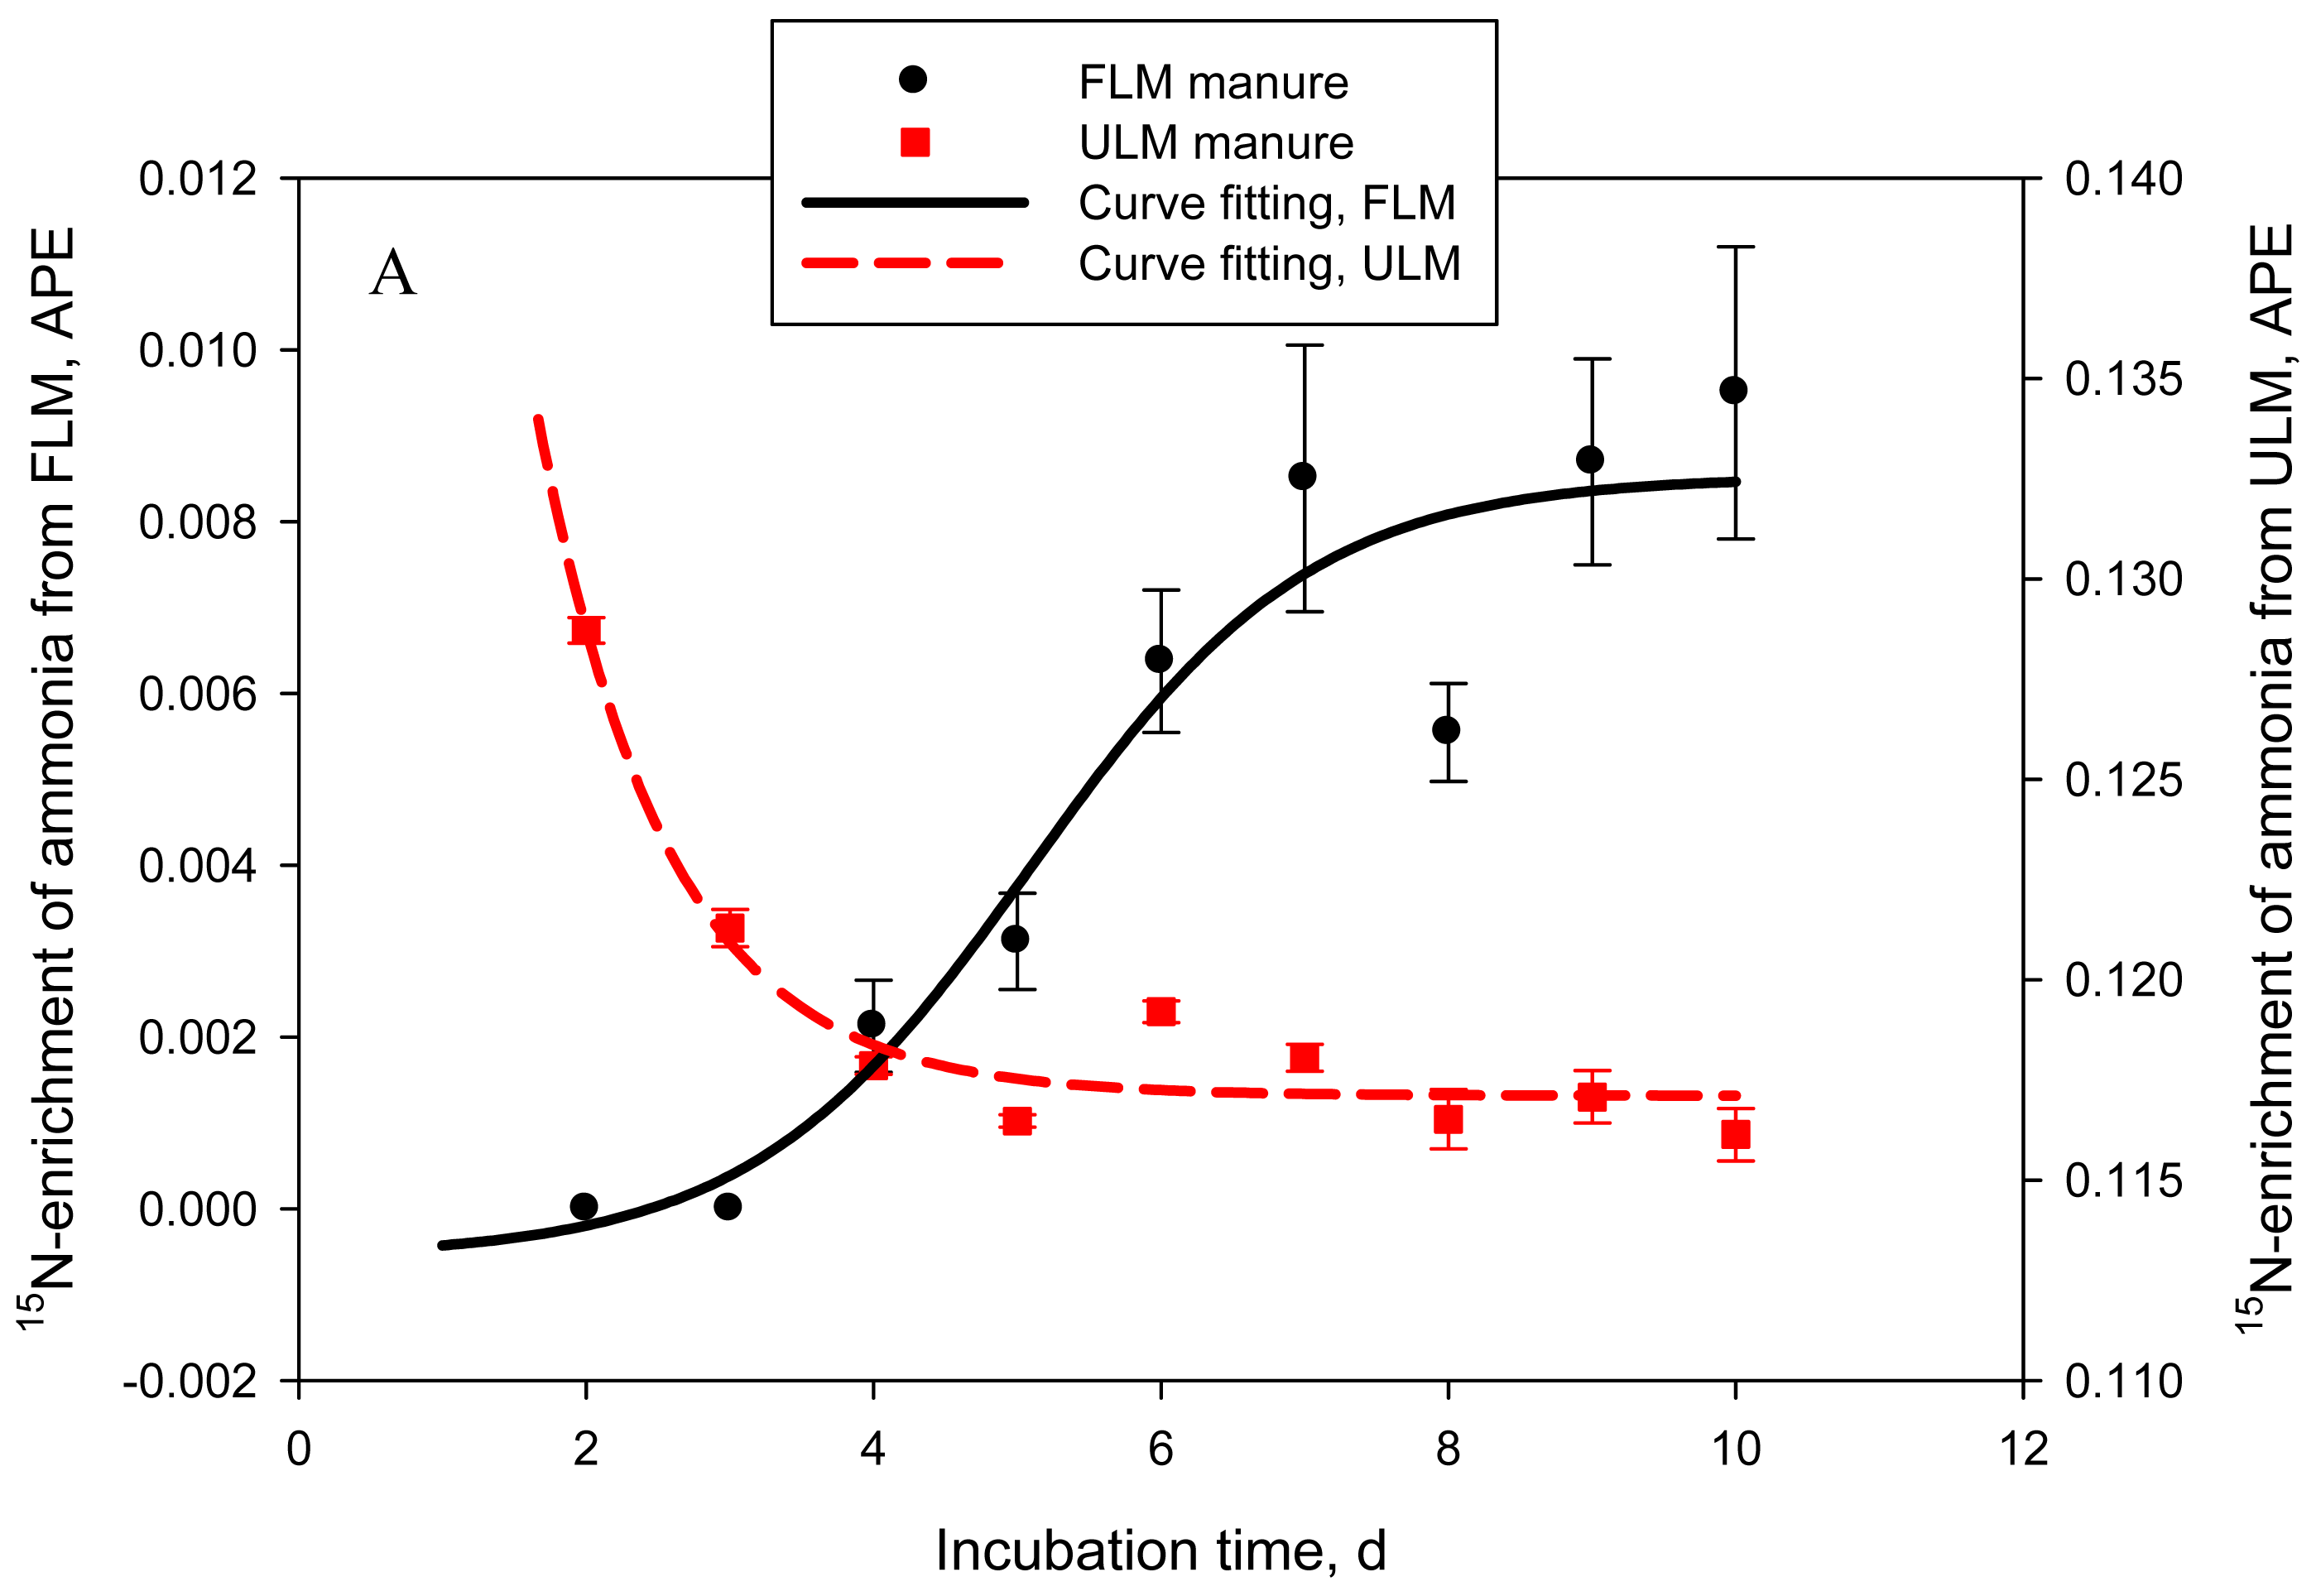
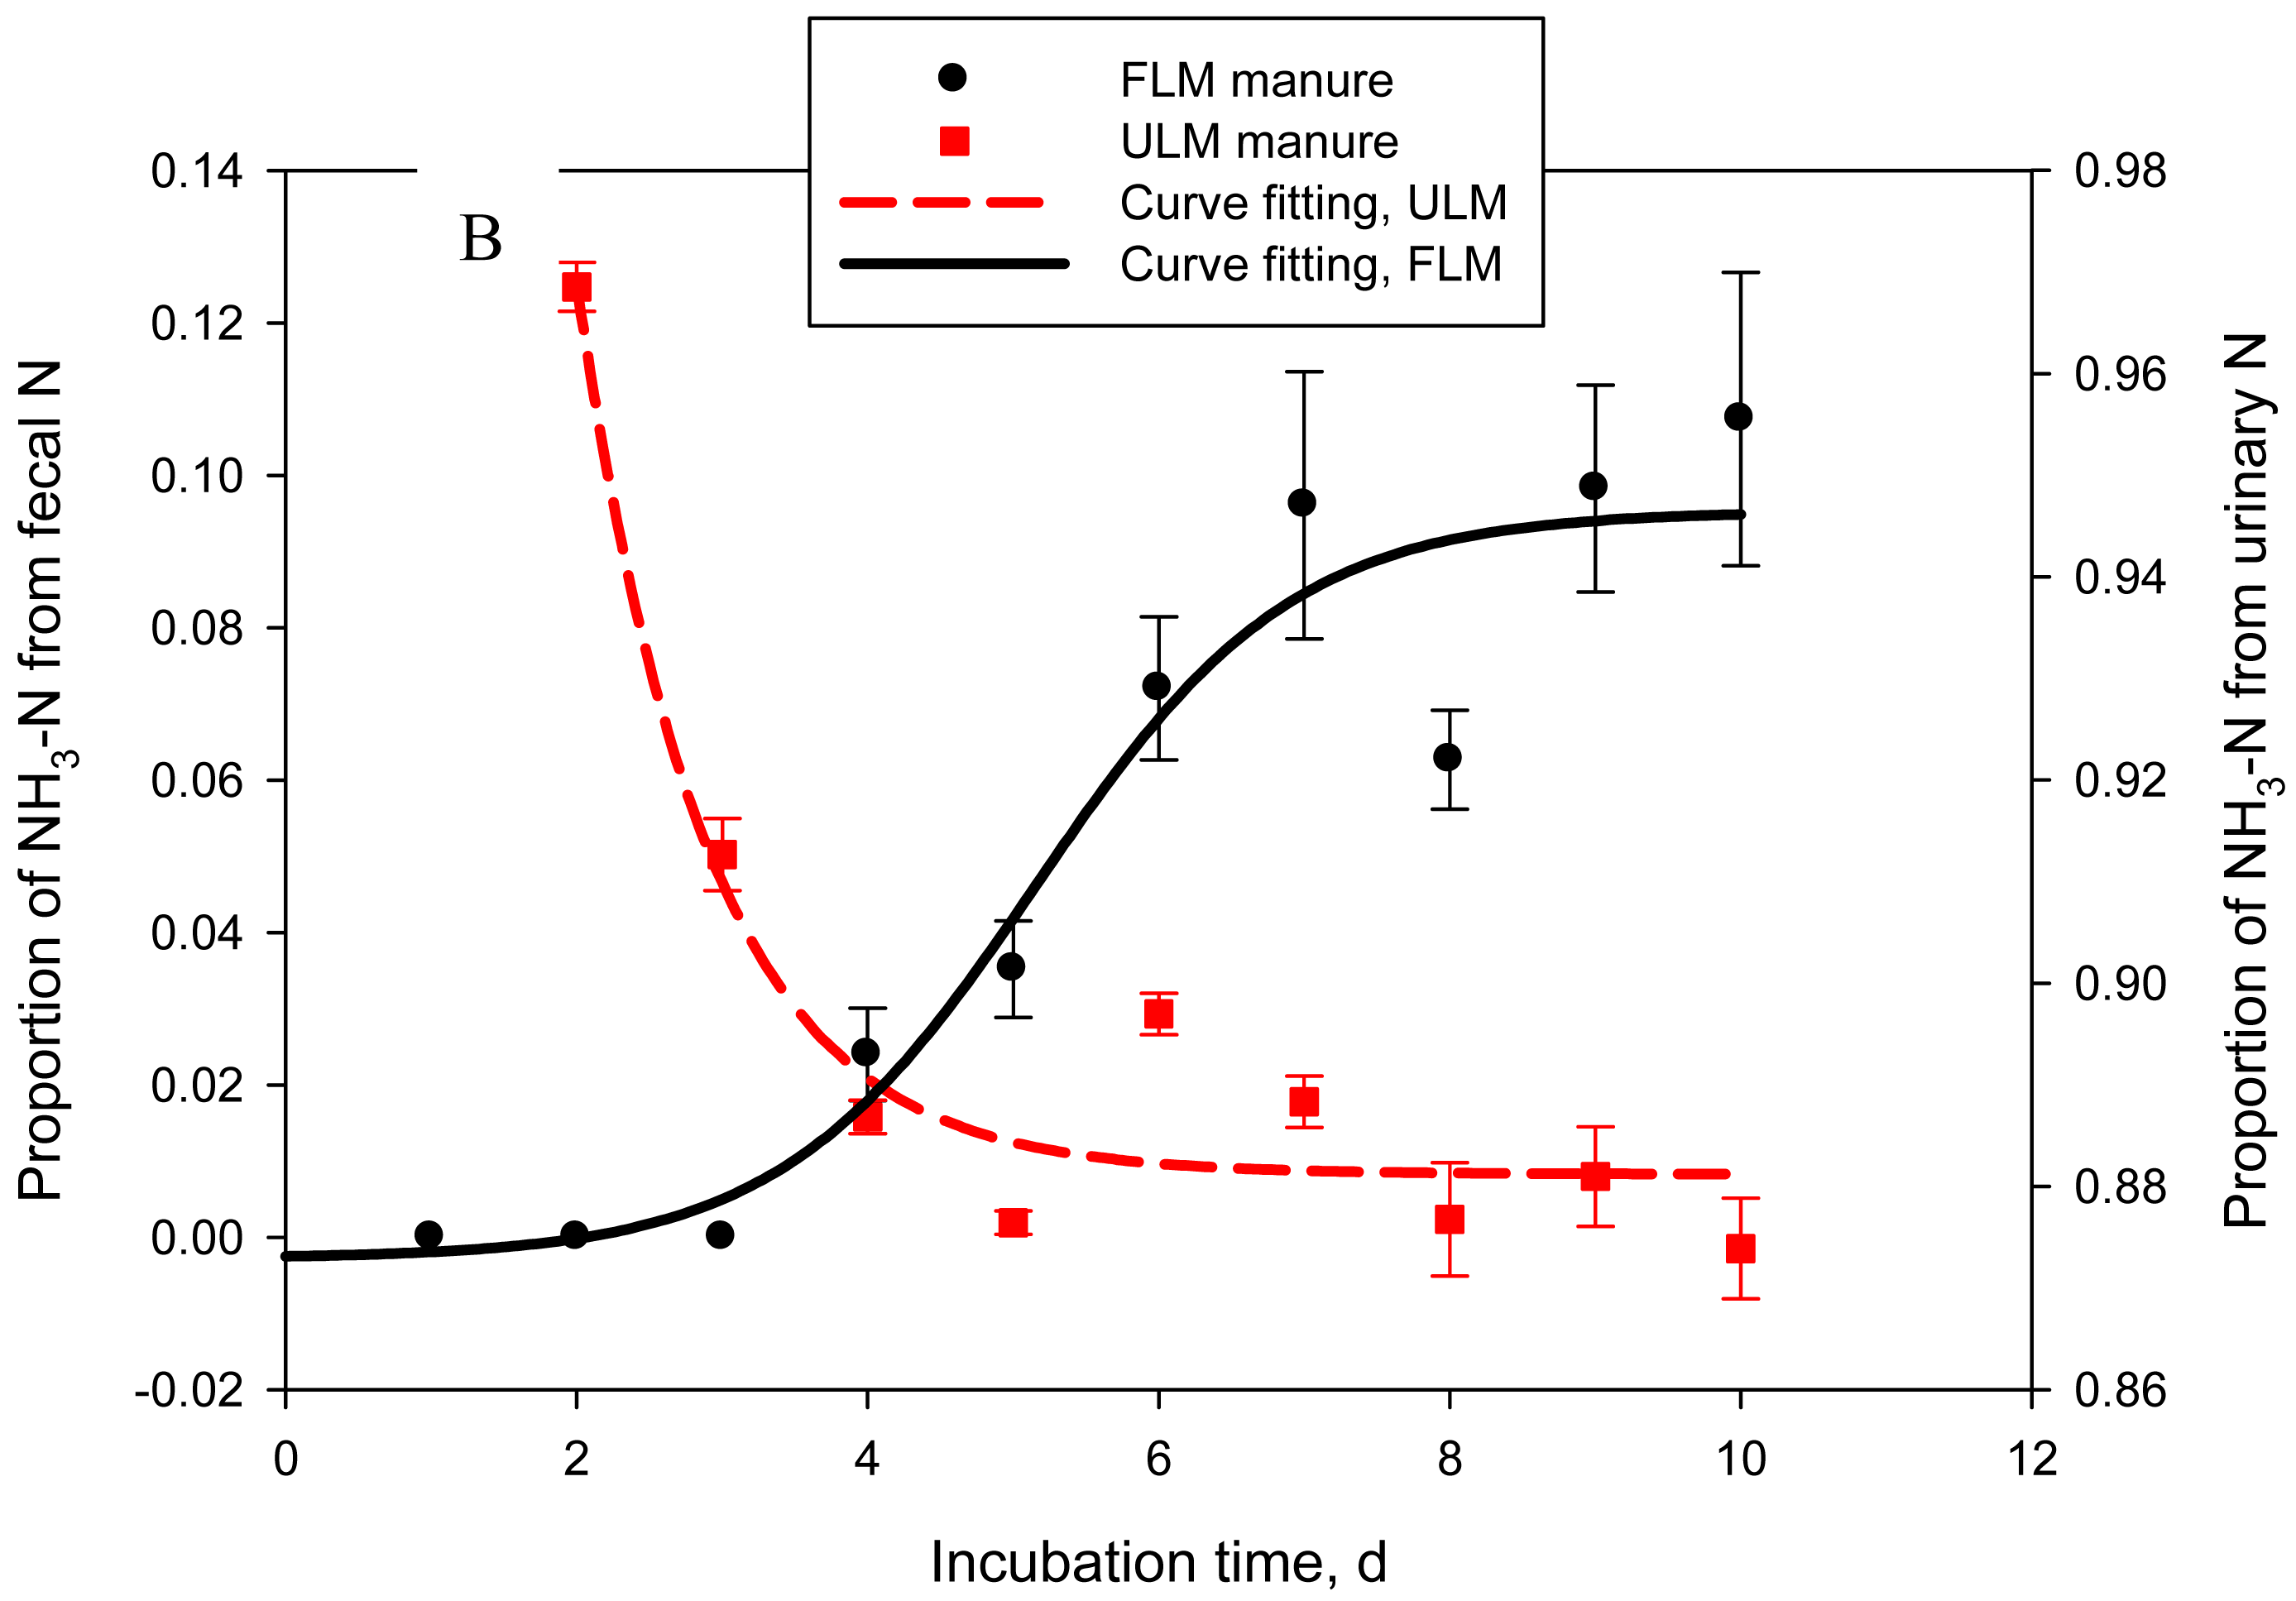
One of the objectives of this study was to quantify the contribution of urinary- vs. fecal-N to NH3-N emitted from cattle manure. In Exp. 4, 2 types of manure were produced: FLM, 15N-labeled feces and unlabeled urine and ULM, unlabeled feces and 15N-labeled urine. Labeled and unlabeled feces or urine used to prepare FLM and ULM had similar N concentrations: on average 0.48 ± 0.01 and 1.01 ± 0.02%, respectively. As a result, both types of manure had similar (P = 0.14 to 0.44) DM (data not shown), N, and urea-N concentrations (Table 2). Consequently, cumulative or daily NH3-N emissions were also not different (P = 0.59) between the 2 treatments. The goal of labeling feces or urine with 15N was successfully achieved. Delta 15N of feces in FLM manure was approximately 17-times higher (P = 0.022) than that of feces in ULM manure. Similarly, δ15N of urine in ULM manure was drastically higher (P < 0.001) than that of urine in FLM, which resulted in δ15N of ULM being higher (P < 0.001) than δ15N of FLM. Delta 15N of unlabeled feces and urine for both types of manure was within the range of natural δ15N reported for dairy cows [4]. Nitrogen-15 enrichment of NH3-N followed a sigmoid trend for FLM and an exponential decay trend for ULM (adjusted R2 = 0.86 and 0.92, P = 0.005 and < 0.001, respectively; Figure 4A). The estimated proportion of NH3-N originating from fecal N (FLM) was negligible in the first 48 h of manure storage, represented 0.04 ± 0.006 by day 5, and then gradually increased to 0.11 ± 0.019 of the emitted NH3-N by day 10 (logistic regression model; adjusted R2 = 0.91, P < 0.001) (Figure 4B). The proportion of NH3-N originating from urinary N (ULM) represented 0.94 ± 0.027 at 24 h, 0.97 ± 0.002 at 48 h, 0.91 ± 0.004 at 72 h, and gradually decreased to 0.87 ± 0.005 by day 10 (exponential decay model; adjusted R2 = 0.92, P < 0.001). This experiment clearly identified urinary N as the principal source of NH3-N volatilized from cattle manure during the initial 10 days of storage, accounting for an average of 90% of the emitted NH3-N. The contribution of fecal N was relatively low, but gradually increased to about 10% by day 10. Using a similar approach, Thomsen [7] estimated that urinary N accounted for 79% of the total N losses from sheep manure after 7 days of composting, decreasing to 64% at the end of the 86-day storage period. In manure stored anaerobically, urinary N accounted for 94% of the total N losses after 28 days and for 68% at 86 days [7].
4. Conclusions
These series of laboratory experiments confirmed that NH3 volatilization losses from manure are most intensive during the first 2 to 3 days of manure storage and this coincides with a rapid loss (hydrolysis) of urinary urea. The relationship between δ15N of manure and NH3 emission appears to be linear during the initial stages of manure storage (when most of the NH3 losses occur) and should be further investigated. The main source of NH3-N volatilized from cattle manure during the initial 10 days of storage is urinary-N, representing on average 90% of the emitted NH3-N. The contribution of fecal N was relatively low, but increased to about 10% by day 10. There appears to be substantial emissions of nitrogenous gases other than NH3, most likely dinitrogen gas, which may account for up to 25% of N losses during the first 20 day of manure storage. This finding, which has to be confirmed in laboratory and field experiments, may be indicative of overestimation of NH3 emissions from cattle operations by the current emissions factors.


| Item | Experiment | SEM | P-value 1 | |||
|---|---|---|---|---|---|---|
| Exp. 1 | Exp. 2 | Exp. 3 | Exp. 4 | |||
| Incubation length, day | 20 | 30 | 20 | 10 | ||
| Manure composition | ||||||
| Dry matter (DM), % | 11.2 b | 11.2 b | 9.5 c | 13.3 a | 0.42 | <0.001 |
| Nitrogen, % of DM | 7.16 a | 4.95 d | 6.41 b | 5.71 c | 0.230 | <0.001 |
| Urea-N, mg/mL manure | 4.11 a | 1.98 b | 4.77 a | 4.56 a | 0.228 | <0.001 |
| Manure N lost, mg/day | 154 b | 76 c | 137 b | 292 a | 14.4 | <0.001 |
| Manure N loss, % 2 | 47.9 b | 48.6 b | 56.3 a | 47.3 b | 1.53 | <0.01 |
| Emitted NH3-N, mg/day 3 | 105 b | 67 c | 107 b | 135 a | 4.1 | <0.001 |
| Emitted NH3-N, % 4 | 68.2 c | 88.1 a | 78.1 b | 48.0 d | 2.21 | <0.001 |
1P-value for the main effect of experiment;2Cumulative manure N lost as % of manure N at day 0;3Manure N recovered as NH3-N in the acid solution;4Emitted NH3-N, % of manure N lost (corrected for sampling);a, b, c, dWithin a row, means without a common superscript letter differ (P < 0.05).
| Item | FLM 1 | ULM | SEM | P-value 2 |
|---|---|---|---|---|
| Total N, % of dry matter | 5.66 | 5.76 | 0.080 | 0.44 |
| Urea-N, mg/mL manure | 4.74 | 4.38 | 0.134 | 0.14 |
| NH3-N emission, g | 1.4 | 1.3 | 0.05 | 0.59 |
| Day 0 δ15N, ‰ | ||||
| Feces | 246 | 13.8 | 5.59 | 0.022 |
| Urine | 1.3 | 364 | 0.06 | <0.001 |
| Manure | 94 | 256 | 1.94 | <0.001 |
1FLM = manure with 15N-labeled feces; ULM = manure with 15N-labeled urine;2P-value for the main effect of treatment (i.e., FLM vs. ULM);3Cumulative, 10-d NH3-N emissions. Daily emissions were 137 and 133 mg/day FLM and ULM, respectively; SEM = 5.1, P = 0.59).
Acknowledgments
The authors would like to thank Cristina Saro Higuera in the Department of Animal Production, the Leon University, for assisting with parts of this project and the staff of the Department of Dairy and Animal Science Dairy Center, Pennsylvania State University, for their conscientious care of the experimental cows.
References
- USEPA (U.S. Environmental Protection Agency). Ammonia Emissions from Animal Husbandry Operations. In National Emission Inventory; USEPA: Washington, DC, USA, 2004. [Google Scholar]
- Hristov, A.N.; Hanigan, M.; Cole, A.; Todd, R.; McAllister, T.A.; Ndegwa, P.M.; Rotz, A. Ammonia emissions from dairy farms and beef feedlots: A review. Can. J. Anim. Sci. 2011, 91, 1–35. [Google Scholar]
- Harper, L.A.; Sharpe, R.R.; Parkin, T.B.; de Visscher, A.; van Cleemput, O.; Byers, F.M. Nitrogen cycling through swine production systems: Ammonia, dinitrogen, and nitrous oxide emissions. J. Environ. Qual. 2004, 33, 1189–1201. [Google Scholar]
- Hristov, A.N.; Zaman, S.; vander Pol, M.; Campbell, L.; Ndegwa, P.; Silva, S. Nitrogen losses from dairy manure estimated through nitrogen mass balance or using markers. J. Environ. Qual. 2009, 38, 2438–2448. [Google Scholar]
- Bussink, D.W.; Oenema, O. Ammonia volatilization from dairy farming systems in temperate areas: A review. Nutr. Cycling Agroecosyst 1998, 51, 19–33. [Google Scholar]
- Whitehead, D.C.; Lockyer, D.R.; Raistrick, N. Volatilization of ammonia from urea applied to soil: Influence of hippuric acid and other constituents of livestock urine. Soil Biol. Biochem. 1989, 21, 803–808. [Google Scholar]
- Thomsen, I.K. C and N transformations in 15N cross-labeled solid ruminant manure during anaerobic and aerobic storage. Biores. Technol. 2000, 72, 267–274. [Google Scholar]
- Ni, J.Q.; Heber, A.J. Sampling and measurement of ammonia at animal facilities. Adv. Agron. 2008, 98, 201–269. [Google Scholar]
- USEPA (U.S. Environmental Protection Agency). Air Emissions Monitoring Study. USEPA: Washington, DC, USA, 2011. Available online: http://www.epa.gov/agriculture/airmonitoringstudy.html (accessed on 28 July 2011). [Google Scholar]
- Varga, G.A.; Hoover, W.H.; Junkins, L.L.; Shriver, B.J. Effects of urea and isoacids on in vivo fermentation of diets containing formaldehyde treated soybean meal. J. Dairy Sci. 1988, 71, 737–744. [Google Scholar]
- Chaney, A.L.; Marbach, E.P. Modified reagents for determination of urea and ammonia. Clin. Chem. 1962, 8, 130–132. [Google Scholar]
- Hristov, A.N.; Huhtanen, P.; Rode, L.M.; McAllister, T.A.; Acharya, S.N. Comparison of the ruminal metabolism of nitrogen from 15N-labeled alfalfa preserved as hay or as silage. J. Dairy Sci. 2001, 84, 2738–2750. [Google Scholar]
- Ndegwa, P.M.; Vaddella, V.; Hristov, A.N.; Joo, H.S. Measuring concentrations of ammonia in ambient air or exhaust air stream using acid traps. J. Environ. Qual. 2009, 38, 647–653. [Google Scholar]
- Dowd, S.E.; Callaway, T.R.; Wolcott, R.D.; Sun, Y.; McKeehan, T.; Hagevoort, R.G.; Edrington, T.S. Evaluation of the bacterial diversity in the feces of cattle using 16S rDNA bacterial tag-encoded FLX amplicon pyrosequencing (bTEFAP). BMC Microbiol. 2008, 8, 125–132. [Google Scholar]
- Adviento-Borbe, M.A.A.; Wheeler, E.F.; Brown, N.E.; Topper, P.A.; Graves, R.E.; Ishler, V.A.; Varga, G.A. Ammonia and greenhouse gas flux from manure in freestall barn with dairy cows on precision fed rations. ASABE 2010, 53, 1251–1266. [Google Scholar]
- Arriaga, H.; Salcedo, G.; Martinez-Suller, L.; Calsamiglia, S.; Merino, P. Effect of dietary crude protein modification on ammonia and nitrous oxide concentration on a tie-stall dairy barn floor. J. Dairy Sci. 2010, 93, 3158–3165. [Google Scholar]
- Lee, C.; Hristov, A.N.; Dell, C.; Feyereisen, G.; Kaye, J.; Beegle, D. Effect of dietary protein level on ammonia and greenhouse gas emissions from dairy manure. J. Dairy Sci. 2011. submitted for publication. [Google Scholar]
- Külling, D.R.; Menzi, H.; Krober, T.F.; Neftel, A.; Sutter, F.; Lischer, P.; Kreuzer, M. Emissions of ammonia, nitrous oxide and methane from different types of dairy manure during storage as affected by dietary protein content. J. Agric. Sci. 2001, 137, 235–250. [Google Scholar]
- Harper, L.A.; Sharpe, R.R.; Parkin, T.B. Gaseous nitrogen emissions from anaerobic swine lagoons: Ammonia, nitrous oxide and dinitrogen gas. J. Environ. Qual. 2000, 29, 1356–1365. [Google Scholar]
- Jones, M.L.; Liehr, S.K.; Classen, J.J.; Robarge, W. Mechanisms of dinitrogen gas formation in anaerobic lagoons. Adv. Environ. Res. 2000, 4, 133–139. [Google Scholar]
- Hristov, A.N. Pennsylvania State University: University Park, PA; Improving the efficiency of nitrogen use and reducing ammonia emissions from Pennsylvania dairies; Unpublished work; 2011. [Google Scholar]
- Hristov, A.N.; Campbell, L.; Harrison, J.H. Evolution of 15N abundance in cattle manure in relation to cumulative ammonia losses. Presented at the ADSA-ASAS Joint Meeting, Minneapolis, MN, USA, July 2006.
- Högberg, P. 15N natural abundance in soil-plant systems. New Phytol 1997, 137, 179–203. [Google Scholar]
© 2011 by the authors; licensee MDPI, Basel, Switzerland. This article is an open access article distributed under the terms and conditions of the Creative Commons Attribution license (http://creativecommons.org/licenses/by/3.0/).
Share and Cite
Lee, C.; Hristov, A.N.; Cassidy, T.; Heyler, K. Nitrogen Isotope Fractionation and Origin of Ammonia Nitrogen Volatilized from Cattle Manure in Simulated Storage. Atmosphere 2011, 2, 256-270. https://doi.org/10.3390/atmos2030256
Lee C, Hristov AN, Cassidy T, Heyler K. Nitrogen Isotope Fractionation and Origin of Ammonia Nitrogen Volatilized from Cattle Manure in Simulated Storage. Atmosphere. 2011; 2(3):256-270. https://doi.org/10.3390/atmos2030256
Chicago/Turabian StyleLee, Chanhee, Alexander N. Hristov, Terri Cassidy, and Kyle Heyler. 2011. "Nitrogen Isotope Fractionation and Origin of Ammonia Nitrogen Volatilized from Cattle Manure in Simulated Storage" Atmosphere 2, no. 3: 256-270. https://doi.org/10.3390/atmos2030256