Cloud Processing of Gases and Aerosols in Air Quality Modeling

Abstract
: The representations of cloud processing of gases and aerosols in some of the current state-of-the-art regional air quality models in North America and Europe are reviewed. Key processes reviewed include aerosol activation (or nucleation scavenging of aerosols), aqueous-phase chemistry, and wet deposition/removal of atmospheric tracers. It was found that models vary considerably in the parameterizations or algorithms used in representing these processes. As an emerging area of research, the current understanding of the uptake of water soluble organics by cloud droplets and the potential aqueous-phase reaction pathways leading to the atmospheric secondary organic aerosol (SOA) formation is also reviewed. Sensitivity tests using the AURAMS model have been conducted in order to assess the impact on modeled regional particulate matter (PM) from: (1) the different aerosol activation schemes, (2) the different below-cloud particle scavenging algorithms, and (3) the inclusion of cloud processing of water soluble organics as a potential pathway for the formation of atmospheric SOA. It was found that the modeled droplet number concentrations and ambient PM size distributions were strongly affected by the use of different aerosol activation schemes. The impact on the modeled average ambient PM mass concentration was found to be limited in terms of averaged PM2.5 concentration (∼a few percents) but more significant in terms of PM1.0 (up to 10 percents). The modeled ambient PM was found to be moderately sensitive to the below-cloud particle scavenging algorithms, with relative differences up to 10% and 20% in terms of PM2.5 and PM10, respectively, when using the two different algorithms for the scavenging coefficient (Λ) corresponding to the lower and upper bounds in the parameterization for Λ. The model simulation with the additional cloud uptake and processing of water-soluble organic gases was shown to improve the evaluation statistics for modeled PM2.5 OA compared to the IMPROVE network data, and it was demonstrated that the cloud processing of water-soluble organics can indeed be an important mechanism in addition to the traditional secondary organic gas uptake to the particle organic phase.1. Introduction
Clouds play an active role in the processing and cycling of chemical tracers in the atmosphere. Gases and aerosol particles can enter cloud droplets through absorption/condensation (of soluble gases) and activation and impact scavenging (of aerosol particles) [1,2]. Once inside the cloud droplets these tracers can dissolve, dissociate, and undergo chemical reactions [3]. In particular, it has long been recognized that a large portion of the atmospheric particulate sulphate, which contributes to a significant fraction of the total PM mass, is produced in cloud via aqueous-phase oxidation. Past studies have estimated that the aqueous-phase oxidation reactions account for up to 80% of the total production of sulphate globally and are responsible for roughly 50% of the global sulphate burden (e.g., [4,5]). At a regional scale, about 30% of the ambient particulate sulphate concentration in eastern North America can be attributed to the aqueous-phase oxidation production (e.g., [6]). On the other hand, clouds also act as an effective sink for gases and aerosols through precipitation and wet deposition. As a large fraction of clouds globally are non-precipitating [7,8], a significant portion of the cloud processed tracers, often physically and chemically modified, will be released back to the atmosphere. Another aspect of cloud processing is its role in the vertical transport and redistribution of tracers, through the updraft and downdraft often associated with convective clouds [9–11] and through precipitation evaporation which brings the tracers processed in cloud to lower levels (closer to the ground).
Cloud processing of gases and aerosols has always been an important aspect in air quality modeling. In the late 1980s and early 1990s, relating to acid rain issues, there were numerous modeling studies investigating the role of cloud processing in producing atmospheric ambient sulphate (e.g., [8,12–17]). There have been a number of studies dedicated to the role of cloud chemistry processing on tropospheric photochemistry (e.g., [18–20]). In the context of cloud-aerosol interaction and climate change issues, modeling studies (mostly general circulation models, or GCMs) have been conducted to examine the impact of cloud processing on the global sulphur cycle and on aerosol direct and indirect radiative forcing (e.g., [4,21–26]). More recently, there has been an increasing interest in looking at aerosol-cloud interaction in the context of feedback to dynamics and weather systems using fully coupled models (e.g., [27,28]). There is a wide range of sophistication and completeness in the representation of the various cloud processes in these models. Cloud processing of gases and aerosols remains to be a major source of uncertainty in current air quality models.
Just as particulate sulphate contributes to a significant fraction of the total atmospheric PM mass, particulate organic matter is also a major contributor [29]. In recent years, the air quality modeling community has noted the poor performance, shared by almost all models, in predicting atmospheric organic aerosol mass (OA). Modeled OA, with the traditional secondary organic aerosol (SOA) formation mechanism, mostly based on dry or nearly dry smog chamber data, tends to be much lower than the observations. Recently there is increasing evidence that reactions involving organic compounds in the aqueous phase may be an important pathway in the formation of SOA in the atmosphere. Ambient oxygenated organic aerosols with higher organic mass to organic carbon (OM/OC) ratios than the secondary organic aerosol (SOA) formed in smog chambers from volatile organic compound (VOC) precursors have been observed [30], suggesting that our current understanding of ambient organic aerosol chemical processes may be incomplete. It has been postulated that cloud and wet aerosol processing of water soluble organic gases could be a missing source of SOA. The water soluble organic gases are very likely of secondary formation (e.g., glyoxal, methylglyoxal, glycolaldehyde). In traditional SOA formation, precursors produce gas-phase semi-volatile products, in only a few oxidation steps, which can then partition to the organic phase. In contrast, aqueous SOA precursors tend to be smaller molecules because they must be water soluble. When oxidation occurs on molecules with low carbon number, the products can have very high OM/OC ratios (e.g., oxalic acid OM/OC = 3.8; oligomers of methylglyoxal, glycolaldehyde, phenol OM/OC = 2.0 – 2.6). The aqueous phase is unique compared to the gas phase as it concentrates water soluble species. Water soluble aldehyde species enter hydrolysis equilibria creating diols. These diol species react with OH to form peroxy radicals which can decompose efficiently to form an acid group. The OM/OC ratio of the water soluble organic aerosol fraction in aged ambient aerosol has been measured in several studies and ranges from 1.6 to 2.5 ([31–33]). The OM/OC ratio for ambient aerosol has been analyzed with the aerosol mass spectrometer (AMS) data using positive matrix factorization (PMF). The AMS PMF hydrocarbon-like organic factor (HOA) and lowest volatility oxygenated organic factor (OOA-1) factors typically span the lower and upper limit and are typically ∼1.3 and ∼2.4, respectively [30]. Overall, aqueous oxidation chemistry can help explain the high OM/OC ratios for the water soluble organic fraction of aerosol.
Furthermore, ambient particle size distributions for organic species have been found in the droplet-mode size range (centered at diameter 0.7 μm), similar to the droplet-mode sulphate size range [34,35]. Sorooshian et al. [36] measured cloud droplet residuals and observed a strong correlation between oxalate and sulphate. Also, Crahan et al. [37] measured two and three times more air equivalent concentrations of sulphate and oxalate in cloud water as compared to ambient below cloud air, respectively. Several modeling studies have simulated the formation of low-molecular weight dicarboxylic acids from in-cloud chemistry [38–40]. Current knowledge indicates that dicarboxylic acids are only produced in the aqueous phase. Sorooshian et al. [36] obtained a good agreement for the relative production of sulphate to oxalate from in-cloud chemistry between the calculation using a cloud parcel model (constrained by measurements of liquid water content and precursor VOCs) and observed ratios of sulphate to oxalate. Although the mechanisms for SOA formation via aqueous phase are now being explored, there have been a limited number of modeling studies (at regional scale) attempting to assess the impact of these potential additional SOA production pathways on model predictions [39,41,42]. In-cloud processing of organic gases also has the potential to alter the vertical distribution of ambient OA as cloud processing occurs at cloud level. Using a regional chemical transport model, Carlton et al. [41] showed large improvement in OA concentration bias and correlation for a flight designed to investigate clouds.
In this paper we review the various approaches and algorithms in representing cloud processing of gas and aerosols in some of the state-of-the-art regional air quality models in North America and Europe. The review will be focused on some of the key processes, such as aerosol activation (Section 2), aqueous-phase chemistry, including the potential pathways for SOA formation via aqueous phase (Section 3), and wet deposition (Section 4). We will explore the variability in the approaches taken in these current air quality models in each of these areas, and assess, wherever possible, the impact of the different approaches on the modeled regional air pollutants based on existing work and sensitivity model runs conducted for this study. Conclusions and recommendations are provided at the end.
2. Aerosol Activation (Nucleation Scavenging)
The cloud processing of gases and aerosols starts from aerosol activation. Aerosol particles, particularly those that are water-soluble or that contain water-soluble components, can serve as cloud condensation nuclei (CCN). Under suitable supersaturation conditions, condensation of water vapor on these CCN can proceed rapidly and lead to the formation of cloud droplets, i.e., aerosol activation process (or droplet nucleation). Aerosol activation is a key process in aerosol-cloud interaction. It controls the cloud droplet number concentration, which has direct implication on cloud optical properties and precipitation formation; it can affect droplet acidity which may in turn affect the uptake of gases and aqueous phase reactions; it also determines where the aerosol mass addition, due to in-cloud production (e.g., of sulphate), will reside after cloud evaporation and, hence, the cloud processed aerosol size spectrum, which will affect aerosol activation in subsequent cloud cycles (e.g., [43,44]). The modification of aerosol size spectrum will have an impact on other aerosol dynamic and physical processes, such as coagulation, sedimentation, and removal (dry and wet) due to the size dependant nature of these processes.
It has long been known that the nucleation of cloud droplets at the base of clouds is controlled primarily by the aerosol particles that behave as CCN and by the rate of cooling of the air parcel [3,45–47]. The activation theory, commonly expressed in a form of the Köhler equation is well established [3,47]. One can determine, based on this equation, the equilibrium supersaturation needed for a CCN of given size and physical and chemical properties (e.g., surface tension and solubility) to reach its critical size for growth by water condensation and continue to grow beyond this point even if the supersaturation decreases, i.e., for this CCN to be activated. In the real world situation for a population of aerosol particles the competition between rate of cooling of the rising air parcel and the rate of water condensation on particles results in a maximum supersaturation within the cloud several meters above the base. Under equilibrium, the particles with their critical supersaturation lower than the maximum supersaturation will be activated while the others will remain as interstitial particles, although there are conditions when kinetic limitations may prevent some of the particles from growing to their critical sizes even with their critical supersaturation lower than the maximum supersaturation in the updraft [48,49]. The critical supersaturation of a particle is largely influenced by the amount of material it contains that will dissolve in the solution droplet and the degree to which it dissociates (e.g., [3]). Because of their generally lower hygroscopicity in water, organic components appear to have a reduced impact on the nucleation of cloud droplets relative to the inorganic component in terms of the Raoult effect (e.g., [50]). Organic material may enhance activation by reducing the surface tension (e.g., [51–53]) or inhibit activation by lowering the rate of accommodation of water molecules by the droplet surface (e.g., [54,55]). Readers are referred to McFiggans et al. [56] for an in-depth review on the effect of physical and chemical aerosol properties on warm cloud droplet activation.
The representation of aerosol activation in 3-D large scale (global and regional) models however is challenging due to the scale difference between the actual process and the model spatial and temporal resolution. It is impractical, if not impossible, to carry out an explicit first principle calculation of aerosol activation in these models. Rather, the process will have to be parameterized. The parameterization varies from primarily empirically based, e.g., linking droplet number concentration to either aerosol mass or number concentration (e.g., [57,58]), to more mechanistically or physically based, often relying on a parcel model concept (e.g., [59,60]). Most of the attention on the representation of aerosol activation and droplet spectrum has been within the climate modeling community as it poses a critical uncertainty in assessing the aerosol indirect effect on climate forcing. Studies have shown that there can be significant variability in modeled droplet number concentrations from these different activation parameterizations under certain conditions (e.g., [24,25]). There is a tendency within the climate modeling community to move away from the more empirically based parameterizations to more physically based mechanistic approaches for representing the aerosol activation processes. On the other hand, these mechanistic approaches have not reduced the uncertainty range of the indirect aerosol effect due to new uncertainties in characterizing size-dependent aerosol mass, composition, and mixing state, and the required parameters for the mechanistically based algorithms [24–26,61,62]. Within the air quality modeling community, the attention so far has mainly been focused on the prediction of aerosol mass (e.g., PM2.5 and PM10 mass) rather than the prediction of aerosol size distribution. However, as alluded to earlier, aerosol activation (or nucleation scavenging), which primarily affects aerosol size distribution, can also have an impact on aerosol mass: it directly affects the wet removal of aerosols in the case of precipitation production (“rain-out”, see Section 4) and indirectly the dry removal of aerosols through the impact on the size distribution of cloud-processed aerosols.
Table 1 summarizes the various representations of aerosol activation (or nucleation scavenging) in some of the current regional air quality models. It is not intended to be an exclusive or exhaustive list but these models are representative of the current state of regional air quality modeling in North America and Europe. Amongst the models listed, only a few have a specific representation of the aerosol activation process. In part, how this process is represented in a model is constrained by its aerosol size representation. For example, it is much more difficult to consider partial activation of a mode with a modal representation of aerosol size spectrum without mode splitting—the activation and the subsequent in-cloud production of secondary aerosol tend to modify aerosol size spectrum creating a so-called “Hoppel minimum” [63,64]. With a sectional approach, the division of size sections (or resolution) may also dictate the sophistication of the representation of the activation process. Zhang et al. [65] conducted a study dedicated to the impact of aerosol size representation on modeling aerosol-cloud interactions, and demonstrated the limitation of modal approach in representing aerosol size distribution when aqueous-phase chemistry is included. The treatment for aerosol activation in these models is widely varied, from explicit mechanistic representation (e.g., GATOR) to simply assuming all aerosol particles are incorporated in droplets in presence of clouds (e.g., the 2-bin version of CAMx). The GATOR model [66–69] has the most detailed treatment of the process amongst all, by integrating explicit growth (by water condensation) equations for size resolved (sectional) aerosols. A mechanistic parameterization of Abdul-Razzak and Ghan for multi-mode [59] and sectional [70] aerosols is used in WRF-CHEM [71–73]. AURAMS [74–76], in its current version, employs an empirical parameterization simply relating cloud droplet number concentration to that of aerosol particles with an upper limit of 375 cm−3 [77]; the critical diameter for activation is obtained by counting down aerosol numbers from the top end of the size bins until the total droplet number is reached [74]. CMAQ [78,79] with its modal representation of aerosol size distribution assumes all particles in accumulation mode are activated while the Aitken mode particles remain as interstitial [80]. For CAMx ([81,82]) a fixed activation diameter of 0.7 μm is imposed when using a 10-bin configuration while in a 2-bin configuration all aerosol particles are assumed to exist in cloud water in presence of cloud (resolved cloud only). There is no specific representation of aerosol activation in STEM [83,84], it is assumed that once the cloud forms the number of sulphate aerosols activated is the same as the number of cloud droplets [85]. For most of the current European regional air quality models (CHIMERE, COSMO-MUSCAT, EMEP), aerosol activation is only considered as part of the wet removal by precipitation (or in-cloud scavenging) and represented by a first order scavenging rate, parameterized by precipitation rate and an experimentally estimated scavenging efficiency for Aitken, accumulation, and coarse mode, respectively [86,87]. The LOTOS-EUROS model does not represent nucleation scavenging in its present version [88].
To illustrate the impact of aerosol activation on modeled regional aerosols, sensitivity runs using AURAMS were carried out for 1 July–31 August 2004, employing two different aerosol activation schemes: the empirical parameterization of Jones et al. [77] as in the current AURAMS version (see Table 1) and a newly implemented mechanistically-based Abdul-Razzak and Ghan scheme [70]. In contrast to the Jones scheme, which links droplet number concentration empirically to aerosol number concentration only, the Abdul-Razzak and Ghan scheme establishes a parameterized relationship (based on the Kohler theory) between the maximum supersaturation reached by an air parcel (under given updraft) and an effective critical supersaturation which can be evaluated from the critical supersaturation of the individual sections/bins. For this particular implementation, the standard deviation of updraft, used as the characteristic updraft in the calculation of aerosol activation [113,114], is parameterized as a function of liquid water content [115], and the aerosol wet size at critical supersaturation is used as a first guess for evaluating droplet size dependent parameters. A separate manuscript is under preparation on more extensive testing and evaluation (with available aircraft and satellite observations) of the aerosol activation schemes in AURAMS. Other processes represented in the off-line AURAMS CTM include emissions from surface and from elevated sources, horizontal and vertical advection, vertical diffusion, gas-phase, aqueous-phase, and inorganic heterogeneous chemistry, secondary organic particle formation, dry and wet deposition, and particle nucleation, condensation, coagulation, and sedimentation [74–76].
The simulations were carried out at two horizontal resolutions: 42-km, over a domain covering most of the continental US and Canada, and 15-km, over a smaller domain covering eastern U.S. and south-eastern Canada. The simulation at 42-km resolution provided time-varying boundary conditions for the 15-km resolution simulation. The period coincides with one of the major air quality field campaign conducted over eastern North American and the North Atlantic (ICARTT 2004, [116]) and was chosen for a comparative model evaluation study [117]. The details of model set-up are given in [117].
Figure 1 shows the modeled droplet number concentration for a 24-h period (10 August 2004) at the 1235 m model level from the base run (with Jones scheme) and the sensitivity run (with Abdul-Razzak & Ghan scheme). The differences in modeled droplet number concentration from the two different aerosol activation schemes are evident. One immediate observation from Figure 1 is that the Jones scheme seems to result in a more homogeneous droplet number concentration field, which is in part due to its capping at 375 cm−3, while the Abdul-Razzak & Ghan scheme results in significant higher peak values and more in-homogeneity corresponding to the variation in updraft. Although the aim here is to demonstrate the variability in modeled droplet number concentration due to different activation schemes rather than evaluation, the cap imposed by the Jones scheme may be too low, particularly under continental polluted conditions, as much higher cloud droplet number concentrations have been reported from both aircraft and surface-based high-elevation measurements (e.g., [118,119]).
As the primary concern in air quality modeling community has been mass concentration of particulate matter (e.g., PM2.5), modeled surface concentration of sulphate2.5 and sulphate1.0 from the two activation schemes are compared in Figure 2. As seen, while the difference in aerosol activation has limited impact on modeled sulphate2.5 (a few percents), the impact is considerably more significant on modeled sulphate1.0 (up to 10 percents). This is due to the shift in the activation diameter from the difference in the activation scheme: the Abdul-Razzak & Ghan scheme tends to activate more aerosols (i.e., smaller activation radius) compared to the Jones scheme causing the cloud processed aerosol size distribution to shift towards smaller sizes. This is illustrated in Figure 3 which shows the modeled averaged size distribution of sulphate mass at two grid locations coinciding with two monitoring sites (Dolly Sods in West Virginia and Presque Isle in Maine) within the IMPROVE network. It is seen that, compared to the Jones scheme used in the base-case simulation, the use of Abdul-Razzak & Ghan scheme leads to an increase in mass at smaller sizes and a decrease at larger sizes with the switchover at around 0.5 μm. With the increase and decrease in mass over the size spectrum largely cancelling out each other, the overall impact on the bulk aerosol mass is considerably reduced.
The simple sensitivity test shown above provides an indication of the kind of variability in modeled droplet number concentrations one can expect from how the aerosol activation is represented in the model. This is of particular importance for looking at the feedback to radiation through cloud and aerosol optical properties and to cloud microphysics, e.g., precipitation production and subsequent aerosol activation, in fully coupled models (see Zhang [120] for a detailed review of online coupled meteorology and chemistry models; note that while AURAMS is an off-line model, i.e., it does not include the feedback from aerosol to cloud microphysics and dynamics, the change in aerosol size distribution as a result of change in droplet number may affect the diagnosed supersaturation in subsequent aerosol activation). It also demonstrates the strong influence on modeled aerosol size spectrum from the activation parameterization, although the impact on overall modeled bulk aerosol mass is less significant. It needs to be pointed out, however, that the sensitivity shown here could well be influenced by the model parameterizations of the various relevant processes (such as coagulation, wet and dry deposition, and gravitational settling, which may be impacted by the difference in modeled aerosol size distribution due to different activation schemes) and by the aerosol size resolution used (for example, greater impact on aerosol size distribution from the different activation schemes may be expected with higher size/bin resolution). In addition, it is important to note that, while the aerosol activation seems to have limited impact on PM2.5 mass from this sensitivity demonstration, its impact on PM1.0 is much more significant; the latter is relevant to ambient measurements of aerosols as some of the current continuous speciated PM measurement technologies experience significant decrease in transmission efficiency for particles greater than 1 μm (e.g., aerosol mass spectrometer: [121]). Finally, the variability tested here (the two different activation schemes) does not cover the full range of variability in the parameterization of the various factors affecting aerosol activation, such as influence of organic surfactants (e.g., [122,123]), updraft velocity (e.g., [113,123]), and entrainment (e.g., [124]).
3. Aqueous-Phase Chemistry
Aqueous-phase chemistry usually refers to several processes, including mass transfer between the gas phase and aqueous phase (solution droplets), i.e., gas phase diffusion to/from aqueous droplets, surface accommodation, hydrolysis/dissociation of certain dissolved species, diffusion in aqueous solution, and chemical reactions amongst various species in aqueous solution [3]. The nature of these processes and the pollutants involved may be quite different for concentrated solution, e.g., aqueous aerosols or haze particles, and dilute solution, e.g., cloud droplets. Since this article deals with cloud processing of gases and aerosols, we will focus on the aqueous-phase chemistry in dilute solution droplets (or close to ideal solution) [125].
Driven by acid deposition issues, a significant body of work in the 80's has been dedicated to the development and testing of reaction mechanisms for atmospheric aqueous-phase chemistry in cloud and rain including the mass transfer aspect (e.g., [96,98–100,126–130]). The mechanisms generally cover oxygen-hydrogen chemistry, carbonate chemistry, chlorine chemistry, nitrite and nitrate chemistry, organic chemistry focused on formaldehyde oxidation, and sulphur chemistry [96]. By conducting a formal sensitivity analysis on a comprehensive atmospheric aqueous-phase chemistry mechanism, Pandis and Seinfeld [96] found that, by comparing the sensitivity of various aqueous-phase species concentrations with respect to each of the individual reactions in the mechanism, the dominant reaction in the system is the oxidation of S(IV) to S(VI) by H2O2 followed by other S(IV) oxidation pathways, e.g., catalyzed oxidation and oxidation by O3. Reactions that produce or consume H2O2 are important as they influence the S(IV)-to-S(VI) conversion, and aqueous phase reactions are also important pathways for the production of formic acid through the reaction of dissolved formaldehyde with OH. The mechanisms developed in the 80s formed the basis for the aqueous-phase chemistry mechanism used in the current air quality models.
In more recent years, the atmospheric chemistry community has again turned its attention to aqueous-phase processes to look for possible pathways contributing to atmospheric SOA formation (e.g., [34,131]). There is increasing evidence that cloud processing of water soluble organics may indeed be playing a role in the formation of atmospheric SOA. These missing pathways from the current atmospheric models may at least partly explain the under-prediction of organic aerosol mass commonly found with these models (e.g., [132–136]).
In the following, we will first review the representations of cloud aqueous-phase chemistry in current regional air quality models; we will then discuss some of the recent studies on the possible cloud aqueous-phase oxidation pathways leading to atmospheric SOA formation and some preliminary assessments of their potential impact on modeled aerosol mass on a regional scale.
3.1. Representation of Aqueous-Phase Chemistry in the Current Regional Air Quality Models
The last two columns in Table 1 summarize the treatment of aqueous phase chemistry and its feedback to atmospheric gases and aerosols in some of the current regional air quality models. As seen, all models have some representation of in-cloud sulphate production through aqueous-phase oxidation. The various representations can be grouped into three categories as far as aqueous-phase chemistry mechanism is concerned: (1) models employing more complete aqueous-phase chemistry mechanism, such as GATOR, STEM, CAMx (with CMU aqueous-phase chemistry) and WRF-CHEM (PNNL version); (2) models employing more condensed mechanisms focusing on aqueous-phase sulphur chemistry only, such as AURAMS, CAMx (with RADM aqueous-phase chemistry), CMAQ, CHIMERE, and EMEP unified model; and (3) models employing a highly parameterized representation of sulphur conversion in aqueous-phase, such as COSMO-MUSCAT and LOTUS-EUROS. The more complete mechanisms include not only the sulphur chemistry but also reactions involving other groups, e.g., the oxygen-hydrogen, chlorine, carbonyl. The ADOM (acid deposition and oxidant model, [13]) aqueous-phase chemistry mechanism, used by AURAMS, and the RADM (regional acid deposition model, [12]) aqueous-phase chemistry mechanism, used in CMAQ and CAMx, are very similar. Both include the mass transfer and aqueous-phase dissociation reactions (for SO2, O3, H2O2, organic peroxides, HNO3, NH3, and CO2) and S(IV)-to-S(VI) oxidation by H2O2, O3, organic peroxides, and O2 (catalyzed by iron and manganese). Comparing with the more complete mechanism, this sulphur oxidation-focused mechanism does not resolve the additional sources and sinks of peroxy radicals and peroxides in aqueous phase (through the oxygen-hydrogen chemistry) which will affect aqueous-phase sulphur oxidation. However if the system is not oxidant-limited this omission may not have as much impact as far as sulphur oxidation is concerned. On the other hand, the impact on tropospheric photo-oxidant chemistry from the aqueous-phase oxygen-hydrogen chemistry and the aqueous-phase sink for formaldehyde can be significant [18,20]. The approach taken by LOTUS-EUROS and COSMO-MUSCAT is to represent the aqueous-phase sulphur oxidation by a single first order reaction with a fixed base rate constant modulated by cloud cover and relative humidity [88,111]. Although this approach may work well in some cases, it may not be as robust given the use of a single fixed base rate constant which in effect will impose a certain level of oxidants which may or may not be representative of any given region and/or season.
Almost all models use a bulk representation for aqueous-phase chemistry. The variable size resolution model (VSRM, [92]) is used in CAMx (as an option) and WRF-CHEM, by which, depending on a set of criteria, the aqueous-phase chemistry is solved either in bulk or in two bins (sections) separating the droplets formed on larger, more alkaline particles from those formed on smaller, more acidic particles. Past studies (e.g., [64,137–139]) have shown enhanced sulphate production from a size-resolved representation of aqueous-phase chemistry compared to a bulk representation. The difference is mainly due to the inhomogeneity of pH amongst cloud droplets and the strong pH dependency of the aqueous-phase SO2–O3 reaction rate. Kreidenweis et al. [64] showed that, for a parcel-model comparison case, nearly three times more sulphate is produced through the ozone oxidation pathway from the size-resolved models than from the bulk models. However, sulphate production through the H2O2 oxidation pathway is less from the size-resolved models, and the net enhancement in sulphate production from the size-resolved calculation is about 15% for the case considered. Barth [140] looked into the importance of droplet size representation from the cloud photochemistry perspective and found that, for species such as formaldehyde and formic acid, model prediction is very sensitive to the droplet size representation since the fate of these species in aqueous phase is highly dependent on pH.
Other variability in aqueous-phase chemistry representation amongst the various models includes the treatment of mass transfer between gaseous and aqueous phase and cloud water pH. Almost all the models with explicit aqueous-phase chemistry mechanism, whether more complete or more condensed, assume Henry's law equilibrium between gaseous and aqueous phase concentrations for species involved in mass transfer processes. In contrast, AURAMS employs a kinetic approach for mass transfer between gas and aqueous phase (except for O3 and CO2) using the Fuchs and Sutugin [141] formulation for diffusion coefficients. Under most of the atmospheric conditions, the Henry's law equilibrium can be established very quickly for moderately and less soluble species. For highly soluble species such as HNO3 the equilibrium partitioning between gas and aqueous-phase may not be achieved easily. As to the cloud water pH, most of the models that do treat the pH-dependent dissociation and oxidation reactions diagnose pH (or hydrogen ion concentration) from charge balance, while EMEP unified model uses a fixed pH of 4.5, a value which may be representative of an average condition found in Europe but may not be representative at a finer resolution (i.e., at a local scale). Even for the diagnosed pH, the model may not have the representation of the full set of base cations and therefore pH may be underestimated (i.e., more acidic) from an incomplete charge balance.
Models do vary in how the aqueous-phase mass production (bulk) feeds back to aerosols after cloud evaporation. Depending on the aerosol size representation in a model, the bulk mass increment due to the aqueous-phase S(IV)-to-S(VI) oxidation may be added to the aerosol size spectrum in various ways. For three of the sectional models (AURAMS, GATOR, and WRF-CHEM PNNL version), the bulk mass increment is distributed to the aerosol size spectrum according to the ratio of the liquid water content in each aerosol size sections to the total (bulk) liquid water content, although each model has a different way of determining the liquid water in each size sections. In AURAMS, the bulk cloud liquid water (provided by the meteorological driver model) is distributed evenly to all activated aerosol particles and the liquid water in each size sections is determined by the aerosol number in each activated or partially activated sections [74]; in GATOR, cloud (bulk) microphysics is solved first for both sub-grid scale and resolved clouds, and the water vapor evaporated/sublimated from the bulk microphysics is then re-condensed/re-deposited onto aerosol particles along with other aerosol-hydrometeor and hydrometeor-hydrometeor interactions to produce aerosol/hydrometeor spectrum [69]; in WRF-CHEM (PNNL version) a Gamma distribution of droplets and a maximum correlation between droplet size and dry particle size are assumed, i.e., the largest activated aerosol particles are associated with the largest droplets, [65]. For the CMAQ model with modal representation, the bulk mass due to aqueous-phase oxidation is added to the accumulation mode only, maintaining total number and geometric standard deviation of the mode [80]. In STEM, the sulphate produced in cloud due to aqueous-phase oxidation is re-injected into gas phase as hydrometeors evaporate [14], which can then be partitioned to the aerosol phase, e.g., using a thermodynamics module for inorganic gas-particle equilibrium partitioning, SCAPE-II (Simulating Composition of Atmospheric Particles at Equilibrium, [142–144]) [84]. For those models with very coarse size resolution for the aerosol size spectrum, e.g., two bins (modes), the bulk mass addition may be added to one or two of the bins (modes) depending on the size cut. As discussed in Section 2 above, the modification of aerosol size spectrum from cloud processing (particularly, aerosol activation and sulphate production in cloud) and its representation will have a direct impact on modeled aerosol optical properties (important for direct aerosol radiative forcing) and on aerosol hygroscopicity (important for subsequent cloud processing). The difference in cloud processed aerosol size distribution due to the different model representations will also impact some of the size dependant aerosol microphysical and dynamic processes, which will in turn have an impact on modeled aerosol mass concentrations. In a fully coupled chemistry-dynamic system, the modified aerosol size spectrum (both mass and composition) through cloud processing will feed back to subsequent cloud microphysics which will, in turn, impact aqueous-phase chemistry, although the majority of current regional air quality models do not have the representation of this feedback mechanism.
Although it is outside the scope of this review, it is worth pointing out that the largest uncertainty by far, in modeling cloud aqueous-phase chemistry, may be from modeled cloud, including timing, location, and liquid water content. Through their sensitivity analysis, Pandis and Seinfeld [96] demonstrated that the liquid water content is one of the most important parameters of the aqueous-phase chemistry system. Particularly, the aqueous-phase sulphate mass production is very sensitive to the liquid water content. Modeling clouds in large scale models is extremely challenging due to the spatial and temporal scales of the processes involved and their feedback to the dynamic system. Zhang et al. [145] conducted an evaluation of modeled cloud properties against in-situ measurements for air quality application, and found that the model's ability to reproduce observed clouds depends on the model resolution, the particular microphysics parameterization employed, and the type of clouds modeled. The uncertainty in modeled in-cloud production of aerosol mass is expected to be large due to the uncertainty in the model predicted cloud and liquid water content.
3.2. Organic Chemistry and Possible Oxidation Pathways for SOA Formation in Cloud Droplets
3.2.1. Mechanism for Cloud Processing of Organic Gases
The hypothesis is that some of the gaseous organic species will be taken up by droplets, and some of them will undergo irreversible reactions (oxidations) and form products of low volatility which after cloud droplets evaporate will be partitioned in particle phase.
Similar to aqueous phase inorganic chemistry, the uptake of gaseous organic species by droplets will be affected by a number of processes (steps): gas phase diffusion, surface accommodation (or transfer across the interface), attainment of aqueous-phase equilibrium (solubility and hydrolysis), and possible reactions in aqueous phase. Gas-phase diffusion is usually fast and there is not a vast variation amongst different species. Surface accommodation, described by an accommodation (or sticking) coefficient, is also unlikely to be a rate limiting step (unless the accommodation coefficient is much smaller than 0.01). The remaining key factors affecting the uptake of an organic gaseous species would be solubility and hydrolysis of a given species and its possible reactions in the aqueous phase. Mathematically, the uptake of gaseous organic species may be formulated as follows [141,146–149]:
Henry's law coefficients describe the solubility or dissolution of an organic (or inorganic) gas in aqueous solution. Hydration equilibrium coefficients can be combined with Henry's law coefficients to form effective Henry's law coefficients (KH). Table 2 summarizes the KH for some water soluble organic species from existing work as listed in the 4th column of the table. Interestingly, glycolaldehyde has a larger Henry's law coefficient compared to glyoxal; however, glyoxal has a very large hydration coefficient resulting in glyoxal having an order of magnitude larger effective KH than glycolaldehyde. In looking at equation (E2), the 3rd term includes the product of KH, krxn and DL. However, if one considers that krxn and DL have physical upper limits, then one can calculate a minimum KH for which uptake becomes important. Gelencser and Varga [149] estimated a threshold effective Henry's law coefficient of 103 M/atm, above which mass transfer to droplets becomes important. A review of the structure-activity relationships to estimate KH [150] based on specific functional groups in a molecule revealed that, in general, monofunctional alcohols, peroxides, ethers, aldehydes, ketones, organic nitrates, nitro compounds, and esters do not meet the threshold of 103 M/atm. Aromatic alcohols and organic acids do meet the general rule of thumb. Many bifunctional compounds meet the threshold and need to be further assessed; however, species with ether and ester groups, ether and ketone groups, two ether groups, two ketone groups, two ester groups, two nitrate groups, two halide groups, nitro-aromatics and ketone groups, and nitro-aromatics and alcohol groups did not meet the criteria. All bifunctional species with at least one aldehyde group met the criteria. For trifunctional species, the majority met the criteria with the exception of species with all halide groups.
Once an organic species is dissolved in solution, it can undergo irreversible oxidation reactions. For organic species, OH-initiated oxidation is likely the most important pathway [161]. Dutot et al. [62] developed a neural network method to estimate aqueous OH-rate coefficients for organic compounds. Their training database was based largely on compilation of rate coefficients in [163]. Chemical groups considered include aliphatic bonds, unsaturated bonds and functional groups including alcohols, carboxylic acids, carboxalate ions, ketones, aldehydes, esters, ethers and aromatic functional groups, but not hydroperoxide and nitrate groups because of insufficient data. Also, Monod et al. [164] and Monod et al. [165] developed structure-activity relationships (SAR) for aqueous OH-reactivity, similar to gas-phase SAR methods developed by Atkinson [166]. Table 3 lists the OH-initiated aqueous oxidation rate coefficients for several C2 compounds with different functional groups based on Monod et al. [165]. An examination of Table 3 shows that the OH reaction rate is faster for ethanol, the unhydrated form of acetaldehyde, and the glyoxalate, CHOCOO– relative to the ethane reaction rate. The hydrated acetaldehyde, hydrated glyoxal, glycolaldehyde all have ratios relative to ethane between 0.2 and 1.0. Acetone, methyl peroxide, acetic acid, oxalic acid dissociation ions have values between 0.01 and 0.2. Thus, on inspection, aldehydes, alcohols and acid groups adjacent to carbon chains do not vastly affect the H-abstraction from the adjacent carbon chain. The non-dissociated dicarboxylic acid, oxalic acid, does have a vastly slower reaction rate relative to ethane, 8.8 × 10⁻⁴. Also noted from Table 3, anions usually react faster than their corresponding acids with OH because of different mechanisms (electron transfer compared to H-abstraction) [167].
Based on recent literature, the following summarizes some of the key atmospheric soluble organic species that can undergo aqueous OH-initiated oxidation with the potential to form SOA:
In cloud droplets, during daylight hours, glyoxal will react with OH to irreversibly form glyoxalic acid which, in turn, can form oxalic acid ([169]; Table S1 of [125] for reaction mechanism). At cloud relevant glyoxal concentrations (10−5 to 10−4 M glyoxal), the predicted mass yields of oxalic acid are 140% related to the change in aqueous glyoxal concentration [125]. In wet aerosol, irreversible reactions with OH help produce high molecular weight oligomers (with lower volatility than oxalic acid) via radical-radical reactions.
At lower methylglyoxal concentrations typical of cloud concentrations (dissolved methylglyoxal ∼μM order), the predicted temporal evolution of methylglyoxal products (oxalic acid, pyruvic acid) and total water soluble organic carbon compared quite well to the measurements in an UV illuminated reaction vessel (aqueous scheme with 19 reactions specific to methylglyoxal oxidation, Table 1 in [170]). After irradiation conditions representative of one cloud cycle ([OH] ∼ 4 × 10⁻¹² M for 10 min), the pyruvic acid mass yield per mass of methylglyoxal reacted was 108%. After 90 min of irradiation, acetic acid reached a maximum concentration, pyruvic acid was decreasing and oxalic acid was increasing. After 210 min of irradiation, oxalic acid reached a maximum, acetic acid was slowly declining and pyruvic acid was a minor product (Figure 2 in [170]). All of these acid species have effective Henry's law coefficients higher than 103 M/atm and thus remain, in part, in the cloud phase. As the cloud droplets evaporate, some of the (semi-)volatile species will return to gas phase while other (semi-)volatile species may remain bound in particle phase due to oligomerization reactions (refer to Section 3.2.3 for wet aerosol chemistry).
Hydrated formaldehyde can react with OH to form formic acid with a rate coefficient of 1.1 × 10⁻⁹ M−1·s−1. The non-hydrated form of HCHO can also react with HSO3− to form HOCH2SO3− + OH−. In turn, the HOCH2SO3− can react with OH to form formic acid, HO2 and SO32−. While formaldehyde does affect the aqueous OH budget, it is not likely a critical precursor to in-cloud SOA production.
Acetone has an intermediate reactivity and effective Henry's law coefficient and, thus, has the potential to make a small contribution in terms of the in-cloud production of formaldehyde, methylglyoxal, hydroxyacetone and acetic acid [171].
Methyl peroxide has two major in-cloud reaction pathways, namely, OH reaction to form the methyl peroxy radical, CH3O2, and reaction with HSO4− to form SO42−, H+ and methanol. Since the cloud phase is depleted in oxides of nitrogen relative to the gas-phase, then the methyl peroxy radicals can recombine to reform organic peroxides. While methyl peroxide does affect the aqueous radical budget, it is not likely a critical precursor to in-cloud SOA production.
Liu et al. [172] and Zhang et al. [173] proposed cloud-relevant radical chemistry mechanisms for methacrolein (MACR) and methyl vinyl ketone (MVK) initiated by OH-oxidation. The mechanisms were successful at predicting the first-generation oxidation products of MACR and MVK for laboratory experimental conditions, but high carbon number organic acids were poorly predicted. It was postulated that the decomposition of higher oligomers contributed to the oxalate ion. El Haddad et al. [174] investigated the fate of MACR under cloud conditions and measured an aqueous SOA yield of 2–12% relative to a change in the initial MACR aqueous concentration. These aqueous in-cloud SOA yields are not directly comparable to the cloud-free isoprene SOA yield measured (1–3% relative to a change in gas-phase precursor concentration) in low relative humidity smog chambers [175]. The Henry's law coefficients for MVK and MACR are relatively low, 41 M/atm and 6.5 M/atm, respectively ([153], 298K), and thus it is unlikely that these carbonyl compounds will be significant contributors to atmospheric SOA. The current aqueous yields were also measured at higher initial MACR molarities (mM range typical of wet aerosol) and after long reaction times (22 h). Further laboratory studies are recommended at ambient aqueous MACR molarities. Chemical transport modelling sensitivity studies with and without the aqueous pathway are required to assess its importance on regional atmospheric scales over forest ecosystems. Glycolaldeyde is a water-soluble species with KH > 4 × 10⁴ M/atm [161] and has been observed in the μM concentration range in cloud water [176]. In the cloud-phase, glycolaldehyde is expected to oxidize to glyoxal and glycolic acid, which can, in turn, oxidize further to form glyoxalic acid and oxalic acid [177]. At early times (<25 min), glycolic acid is the dominant product species and SOA yields are 50–60% relative to the change in aqueous glycolaldehyde concentration. After 100 min, oxalic acid is the dominant product and the SOA yield dropped to a relatively constant value of 30% relative to the change in aqueous glycolaldehyde (see Table 1 in [177] for reaction mechanism). Given the large gas-phase yields of glycolaldehyde from MVK (∼70% by mass) and large KH, it is possible that glycolaldehyde could contribute to aqueous-phase SOA production. Glycolaldehyde is also efficiently produced in the gas-phase from the oxidation of anthropogenic ethane and is emitted directly from the smouldering stage of biomass burning [178].
Cloud processing of phenolic species (phenol, guaiacol, syringol) has been shown to produce SOA with mass yields near unity relative to a change in aqueous precursor concentration [179]. The lifetime of phenols is a couple of hours at midday summertime conditions for both gas-phase and aqueous-phase OH-initiated oxidation. Henry's law coefficient (at cloud temperatures of 5 °C and liquid water content of 0.3 g/m3) predicts a phase partitioning of 3% phenol (KH ∼ 5.5 × 10³ M/atm), 4% guaiacol (KH ∼ 7.2 × 10³ M/atm), and 15% syringol (KH ∼ 2.7 × 10⁴ M/atm), by mass, in the cloud-phase. The OM/OC ratios measured are in the range 2.2–2.6 [179] which corresponds to the oxidation states observed for the aerosol mass spectrometer lowest volatility factor in the positive matrix factorization analysis (termed OOA-1). The SOA mass spectra show evidence for the formation of dimers and higher oligomers via C–O and C–C linkages of phenoxyl radicals [179]. Prominent mass spectra peaks observed in the cloud processing of wood combustion are consistent with the peaks in the phenolic OH-initiated aqueous oxidation product mass spectra. The reader is also referred to a recent, more detailed review focusing on many aspects of aqueous phase SOA chemistry [180].
Chen et al. [39] coupled a near explicit gas-phase chemical mechanism (Caltech Atmospheric Chemistry Mechanism, CACM) to a cloud chemistry mechanism. In their study, 14 C1–C3 organic species are explicitly treated and partitioned between the gas and cloud phase based on individual species properties. In addition, 58 semi-volatile species are lumped into 11 surrogate species of which 4 are considered hydrophilic and reactive enough to participate in aqueous cloud oxidation chemistry (47 aqueous reactions, Table 1 in [39]). Two of these surrogates are formed from aromatic oxidation chemistry and two are from monoterpene oxidation chemistry. Aqueous-phase OH-initiated reactions for these 4 surrogates are considered and each reaction forms one non-volatile product with unity yield. Three of the multi-functional products have organic acid groups and, thus, these species can enter dissociation equilibrium. A 48-h averaged box model simulation for a rural scenario showed an average 32% increase in PM2.5 SOA due to cloud processing for 3-h per day. A 48-h averaged box model simulation for an urban scenario showed an average 11% increase in PM2.5 SOA due to cloud processing for 3-h per day.
The most detailed aqueous-phase mechanism (CAPRAM v3.0i, C1–C5 chemistry, [181]) has been reduced to a version potentially applicable to regional chemical transport models, CAPRAM-RED [161]. The number of aqueous phase species decreased from 380 in the full mechanism to 130 in the reduced mechanism (40% reduction in computation times). The averaged percentage differences calculated between the two mechanisms were below 5% for most important organic species (ketones, alcohols, aldehydes, organic acids). A 2-D version of the COSMO-MUSCAT modeling system [106] was developed to compare the CAPRAM-RED mechanism to a simpler inorganic only aqueous mechanism for a prescribed cloud case with two different emission scenario tests (urban and remote). The 2-D test simulations with the reduced organic mechanism and the inorganic only mechanism showed large differences in oxidant levels for the urban case (up to a factor of 4 lower gas-phase OH mixing ratio with the reduced organic mechanism) and smaller differences for the remote case. For the remote test case, oxalate and glycolate were the dominant organic acids predicted downwind of the cloud, whereas, for the urban case, oxalate and pyruvate were the dominant organic acids predicted.
3.2.2. Impact of Cloud Processing of Organic Gases on SOA Mass Concentrations at Regional Scales (Upper Limit Assessment)
There are only a few studies which attempted to assess the atmospheric implications of cloud processing of organic gases on a regional scale, all with the use of the Community Multiscale Air Quality (CMAQ) model [39,42,169]. Carlton et al. [41] assumed Henry's law equilibrium for glyoxal and methylglyoxal (lumped together) to the cloud-phase followed by aqueous-phase OH-initiated oxidation to form non-volatile SOA mass (4% molar yield). More recent laboratory and box model studies suggest the 4% molar yield is a conservative estimate [125]. Nevertheless, Carlton et al. [41] did observe significant improvement in both the SOA bias and model vs. measurement correlation coefficient for comparisons where aircraft measurements were impacted by clouds and model results adequately predicted cloud location. CMAQv4.7 was also run with a continental U.S. domain (36 km grid spacing) over an annual cycle for 2003. When averaged by month across 97 ground sites, the temporal correlation did show a significant improvement, but there still remained a negative model bias for the surface SOA mass concentration during the summer months [42].
The Chen et al. [39] mechanism discussed above was also incorporated into CMAQ and run for a short, 2-day summertime 2004 period, but with the detailed gas-phase Cal-Tech Atmospheric Chemistry Mechanism and 47 reaction aqueous-phase scheme. On average, over an eastern U.S. domain, surface SOA predictions increased by 9% for a 2-day August 2004 period. Results also indicated that the maximum contribution of SOA from irreversible aqueous phase organic reactions was 0.6 μg/m3 for several one-hour averaged grid-cell locations.
Recently, an aqueous-phase organic oxidation scheme was placed inside the global model, TM4-ECPL, to study the oxalic acid budget [182]. An empirical reaction scheme (based on [38,169,183,184]) was employed assuming Henry's law equilibrium for formic acid, acetic acid, glyoxal, methylglyoxal and glycolaldehyde. Model predictions of oxalate at rural locations were consistent with predictions in terms of both bias and correlation. Most oxalate was formed from in-cloud processing rather than wet aerosol; 66% of oxalate was removed by deposition processes and 34% by further aqueous oxidation. The oxalate production originated largely from gas-phase isoprene oxidation. The condensed phase net source of oxalate in conjunction with a global mean turnover time against deposition of about 5 days, maintained oxalate's global tropospheric burden at 0.2–0.3 Tg (i.e., 0.05–0.1 Tg-C) which is about 5–9% of model-calculated water soluble organic carbon burden, though the model prediction of total organic carbon was lower by approximately a factor of 2 relative to observations.
To get a broad idea of how the potential cloud processing of organic gases may impact model predicted organic aerosol component on a regional scale over North America, a sensitivity run was conducted using AURAMS. AURAMS uses the ADOM-II gas-phase chemical mechanism [185,186] and three water soluble organic species were selected to partition to the cloud-phase: MGLY (C2–C3 dicarbonyl), DIAL (larger dicarbonyls, from aromatic oxidation) and CRES (from aromatic oxidation and emission). A group contribution method to estimate effective Henry's law coefficients at 25 °C [150] yielded KH > 1 × 10³ M/atm for these three surrogate species (model values listed in Table 2 footnotes). A pseudo-first order uptake was assumed for the calculation of mass transfer to the modeled cloud LWC (assuming 10 μm diameter drops), following (E2). Gas-phase diffusion constants and molecular velocities were calculated at 288 K (in the range Dg = 1.0 × 10⁻⁵ to 1.2 × 10⁻⁵ m2/s, v = 268–316 m/s). Model KH values were calculated depending on the model grid cell temperature using enthalpy's of vaporization (see Table 2 footnotes). An accommodation coefficient of 0.023 was estimated for MGLY [40], and 0.05 for DIAL and CRES [39]. Aqueous reactions were assumed to form non-volatile SOA mass with a yield of unity. A maximum pseudo-first order OH-initiated aqueous reaction rate coefficient of 10−4 s−1 was assumed and scaled by the cosine of the solar zenith angle. The aqueous SOA was not assumed to oxidize further. These assumptions likely represent an upper limit for cloud organic oxidation chemistry to form SOA. A significant difference between our base case and sensitivity run would suggest that computationally efficient, reduced mechanisms for cloud organic chemistry should be tested and implemented into CTMs, such as the mechanisms proposed by Deguillaume et al. [161] and Lim et al. [125] (see Section 3.2.1 above). A small difference between runs would suggest that organic aerosol produced by cloud uptake and cloud aqueous chemistry is small compared to organic aerosol produced from traditional SOA formation mechanisms.
For the simulation, hourly anthropogenic point, area, and mobile emission files were prepared for the CTM using the 2005 Canadian and 2005 US emissions inventories and version 2.3 of the SMOKE emissions processing system (Sparse Matrix Operator Kernel Emission, [187]). Biogenic emissions were calculated on-line by AURAMS using BEIS version 3.09, the Biogenic Emissions Landcover Database (BELD3) vegetation data set, (30 tree species and 20 crop species used for Canada), and the modeled meteorological fields (temperature and irradiance). Biogenic VOC emissions are speciated into four groups: isoprene (ISOP), monoterpenes (PINE), sesquiterpenes (SESQ) and “other VOCs”. For the soluble organics species partitioned to cloud phase in this sensitivity test, isoprene is the sole relevant biogenic precursor species. Its standard emission fluxes (defined at 30 °C and photosynthetically active radiation, PAR, at 1000 μmol/m2/s) from oak, populus, maple and fir trees were 26,000, 21,000, 38, and 150 μgC/m2/h, respectively, (product of basal emission rate, leaf area index and leaf mass density); the actual emission flux in the model is modulated by prognostic temperature and radiation (irradiance).
Similar to the setup for the AURAMS sensitivity run on aerosol activation in Section 2, a 2-month simulation with the simple implementation of the additional SOA formation from cloud processing of water soluble organics was performed for the period of 1 July to 31 August 2004 at two horizontal grid resolutions (42-km and 15-km). Figure 4a is the modeled 2-month averaged PM2.5 SOA mass concentration from the base-case simulation, and Figure 4b shows the difference between the sensitivity run (with the cloud-phase non-volatile SOA production) and the base case. It is seen that the modeled PM2.5 SOA is enhanced quite significantly by the inclusion of in-cloud production of SOA (up to 40%). There is a clear indication of biogenic origin of the modeled SOA, as has been observed in other studies by Chen et al. [39] and Hennigan et al. [188]. Shown in Figure 4c is a model-observation comparison of PM2.5 organic aerosol (OA) component at available IMPROVE network sites in terms of averages over the period. Speciated PM2.5 measurements from filter samples (24-h, one in 3 days) are available at 54 sites over the simulation period. Table 4 summarizes the PM2.5 OA performance statistics for the two simulations as compared to the IMPROVE network data. It is evident that the sensitivity run including a simple representation of aqueous organic chemistry mechanisms improves predictions in terms of the bias and root mean square error as well as the slope for PM2.5 OA (refer to Figure 4c, model vs. measurement OA mass concentration correlation). Although these results need to be taken in with caution as the representation is very simplified, designed to give an upper bound, and subject to many uncertainties, they do imply that the potential impact on modeled SOA from the cloud processing of water soluble organics can be significant. Further study is definitely warranted.
3.2.3. Uncertainties in Mechanisms for Cloud Processing of Organic Gases
A key uncertainty related to forming SOA from cloud processing arises from the current lack of understanding of the processes that occur as cloud droplets evaporate. As water evaporates from cloud droplets, solute concentrations increase which can result in complex radical and non-radical chemistry:
Radical chemistry: Volkamer et al. [189] showed that photochemistry enhanced SOA formation from glyoxal uptake to wet aerosol. They observed that in the presence of UV light, the rate of volume growth for glyoxal was 2–3 orders of magnitude larger as compared to dark conditions. Observed SOA formation rates in laboratory experiments were shown to scale linearly with aqueous phase OH. In evaporating wet particles, the uptake of glyoxal and their subsequent OH-oxidation allows the accumulation of alkyl radicals in the particle phase [190]. These alkyl radicals either react with O2 or recombine with other alkyl radicals. In a drying particle, the concentration of alkyl radicals increase which favors the recombination reactions. This leads to an increase in the molecular size of products ([125,183]). Guzman et al. [190] also observed that the alkyl radical + O2 reaction rate coefficients were considerably smaller in the aqueous phase due to hydrogen bonding and/or a H2O cage around the alkyl radicals inhibiting O2 attack. Aqueous particles are believed to have greater OH concentrations compared to large cloud drops due to faster OH diffusion rates to a particle (λ ∝ 1/a in first term of E2 where a is the radius), thus small wet particles may have greater alkyl radical production which favors the self-bimolecular termination reactions.
Non-radical chemistry: As droplets evaporate, glyoxal and methylglyoxal can undergo self-oligomerization by hemiacetal formation and/or aldol condensation and the sensitivity of this pathway to acidity is still uncertain [189,191,192].
Oligomer formation through amino acid catalyzed and ammonium ion catalyzed aldol condensation [184,193] has been observed in concentrated acetaldehyde solutions representative of wet aerosol.
Reactions of glyoxal and methylglyoxal with amino acids, methylamine and (NH4)2SO4 have also been observed in wet aqueous aerosol and evaporating cloud drops. Their results are consistent with rapid imine formation followed by the formation of nitrogen-containing oligomers, methylimidazole and dimethylimidazole products [184,192–197].
The mechanism of organosulphate formation in evaporating drops is uncertain. Organosulphate (sulphate esters) can form by (1) the acid catalyzed esterification reaction of an alcohol (hydrated aldehyde group) with sulfuric acid followed by dehydration or by (2) radical-radical reactions. Recent studies have shown that organosulphate yields for precursor alkenes vary with OH radical concentrations (i.e., sunlight conditions) and provide strong evidence for the radical-radical mechanism [195,198]. The OH• radicals can convert (1) bisulphate ion, HSO4−, to the SO4− radical, (2) sulphuric acid to the HSO4 radical and, (3) RH (alkenes, aldehydes) to the R alkyl radical. The alkyl radical can then react with either the SO4− radical or the HSO4 radical to produce organosulphates. With a time constant of several hours for radical-radical reactions, these reactions are more plausible in the atmosphere compared to the slower time scales for esterification [170]. Fundamental aqueous-phase kinetic rate coefficients are clearly needed for all the above processes under ambient aqueous solution conditions from bulk (reaction-vessel) laboratory experiments.
The reversibility of oligomer formation is uncertain in terms of extent of reactions and timescales. There are several studies that suggest photochemically formed oligomers are irreversible whereas oligomers formed in the absence of radicals are reversibly formed [125,183]. Hastings et al. [199] observed oligomer formation and no significant evaporation of dehydrated glyoxal when drying solutions. Loeffler et al. [192] suggest that oligomer formation during cloud evaporation and in wet aerosol is fast compared to evaporation of the surface dehydrated glyoxal and de-oligomerization is slow allowing oligomers to stabilize. Schwier et al. [200] also observed no reversible process of glyoxal oligomers upon dilution over several hours. Other studies suggest the process is only partially reversible. Future experiments on evaporating drops are clearly warranted. The weight of evidence suggests that glyoxal oligomers formed through acid catalyzed pathways are reversible based on thermodynamic considerations, but kinetically the glyoxal oligomers appear to be stable, at least for timescales of hours [125].
The impact of hydrophobic surfactants on the evaporating cloud droplet surface is an additional uncertainty related to surface accommodation/evaporation of water soluble gases. Biogenic fatty-acid coatings of the kind reported by Tervahattu et al. [201] appear to be more effective at inhibiting mass transport across the air-water interface than shorter, more soluble organic surfactants. Both short-chain and longer surfactants can affect the rates of surfacial chemical reactions; for the reactions studied to date, this effect is primarily through enhancing solvation of reagents at the surface. For a comprehensive review of atmospheric aerosol organic films the reader is referred to Donaldson and Vaida [202].
Our mechanistic understanding of the gas-phase formation of multi-functional organic compounds is limited by the availability of fundamental laboratory kinetic and product studies:
Of particular interest is aromatic ring fragmentation as this reaction channel is known to produce dicarbonyls in high gas-phase yields. Dicarbonyls can hydrate efficiently in solution to form diols and, thus, have high effective Henry's law coefficients.
Our ability to predict Henry's law coefficients and OH-oxidation rate coefficients from structure-activity relations is limited for some functional groups such as organic nitrates [150,156,158].
4. Wet Deposition
Wet deposition refers to the processes of tracer scavenging and transport by precipitation. Atmospheric tracers (gaseous and particulate) can enter hydrometeors in various ways. Particles can be incorporated into hydrometeors through either nucleation scavenging (i.e., serving as CCN or ice nuclei, see Section 2) or impaction scavenging (i.e., being collected, through collision, by hydrometeors including cloud droplets, raindrops, and snow crystals). The incorporation of gaseous pollutants in hydrometeors is mainly through diffusion and subsequent aqueous-phase chemistry processes (see Section 3). The wet deposition (or removal) is contributed by both tracer transfer from cloud droplets to raindrops due to autoconversion (precipitation production), sometimes referred to as “rain-out”, and the direct impact scavenging of aerosol particles and soluble gases by falling hydrometeors, sometimes referred to as “below-cloud” scavenging or “wash-out”. Tracers captured in precipitation are removed from the atmosphere once the precipitation reaches the ground. However, part or all of the precipitation may evaporate before reaching the ground, in which case the tracers may be released back to the atmosphere from the evaporating hydrometeors. This can be an effective mechanism for tracer redistribution in the vertical.
In this section, we will mainly focus on the below-cloud scavenging aspect. Scavenging schemes for particles and gases by liquid and solid precipitation in some of the current North American and European regional air-quality models (same as listed in Table 1) are summarized in Table 5 and will be discussed below. The treatment of tracer release due to precipitation evaporation and the relative importance of in- and below-cloud scavenging to total wet deposition are also briefly discussed.
4.1. Below-Cloud Particle Scavenging
Below-cloud particle scavenging processes depend on the net action of various forces influencing the relative motions of aerosol particles and hydrometeors. Ideally, both aerosol particles and hydrometers need to be size-resolved in air quality models in order to quantify the below-cloud particle removal. Such an approach is used in GATOR in which the detailed coagulation processes between size-resolved aerosol particles and hydrometeors are treated explicitly [69]. Both liquid phase and solid phase hydrometeors are considered in GATOR. Despite the explicit treatment of the coagulation process, the uncertainties can be significant due to the parameterizations used for the various collection efficiency mechanisms (e.g., Brownian diffusion enhancement, turbulent inertial motion, turbulent shear, gravitational settling, thermophoresis, diffusiophoresis, and electric charge) and for droplet gravitational settling velocities [211].
Due to the computational constraint, the majority of the air quality models reviewed here choose to use bulk precipitation information, although the aerosol particles are size-resolved to some degree in these models, either with a sectional approach (e.g., AURAMS, CAMx, STEM, WRF-CHEM/MOSAIC, CHIMERE) or a modal approach (CMAQ, WRF-CHEM/MADE/SORGAM, EMEP unified model, COSMO-MUSCAT, LOTOS-EUROS). In many of these models the below-cloud particle removal by rain is assumed to follow a first-order decay and quantified by a parameter called scavenging coefficient, Λ(d), parameterized as a function of precipitation intensity (P), droplet-aerosol collection efficiency (E), mean droplet size (D) or mean droplet setting velocity (Vt) (see the second column in Table 5). A recent detailed review on size-resolved Λ(d) by rain [211] suggested that the use of a mean (or representative) droplet size in place of a full droplet spectra may be acceptable because the sensitivity of Λ(d) to droplet size spectrum is smaller compared to the sensitivity of Λ(d) to the collection efficiency parameterization. The study also recommended to use the parameterization for E which includes the considerations for such collection mechanisms as thermophoresis, diffusiophoresis, and electrostatic forces, in additional to the primary collection mechanisms (e.g., Brownian diffusion, interception, and inertial impaction). This is in consideration that even with the enhanced collection efficiency, the theoretical Λ(d) values were still much lower than those derived from field observations. However, a subsequent numerical sensitivity study following [211] suggests that the large apparent underestimation of Λ(d) by the theoretical formulation, compared to the field derived values, can be mostly explained by the fact that the field derived scavenging coefficients are inherently affected by the vertical turbulent diffusion, which is not part of the scavenging process (hence not accounted for by the theoretical formulation) but does impact the field observations [212]. The study therefore concludes that the current theoretical framework for Λ(d) can provide a reasonable approximation of below-cloud aerosol particle scavenging by rain in size-resolved aerosol transport models as long as the vertical diffusion process is represented in the models [212].
Several of the air-quality models reviewed here choose to ignore snow scavenging of aerosol particles, while a few others (e.g., AURAMS, CAMx) use a similar formulation for Λ(d) as for particle scavenging by rain but with a different parameterization for the collector (hydrometeors) size (D) and collection efficiency (E) for scavenging of aerosol particles by snow and ice. At present, there has not been a systematic study on the magnitude of differences between different snow-scavenging formulations. It is expected that the uncertainty in the parameterization of particle scavenging by snow may be greater than that by rain due to the difficulty in quantifying the non-spherical shape, orientation, and size spectrum of snow and ice particles [213–215], although this needs to be confirmed through a detailed assessment of the uncertainties of existing snow scavenging parameterizations and associated parameters. Furthermore, the relative importance of particle scavenging by rain vs. by snow has not been assessed, though intuitively the scavenging by snow may be more efficient.
Besides the two approaches discussed above (i.e., the explicit coagulation approach and the scavenging coefficient approach), two models (CMAQ, STEM) treat the precipitation scavenging process through a diagnostic cloud column model that treats cloud dynamics (entrainment/detrainment), aqueous-phase chemistry, and wet deposition [94,208] for certain species (sulphate, nitrate, ammonium).
To get a sense of how sensitive the modeled aerosol mass concentration is to the use of different Λ(d) formulas, the AURAMS base-case simulation at 15-km resolution as described in Section 2 was repeated for two days (August 9 and 10, 2004) using two different Λ(d) schemes, Andronache et al. [216] and Mircea et al. [217]. As shown in [211] these two scavenging schemes encompass the extent of the variation in the current Λ(d) parameterizations, with the Andronache scheme giving highest Λ(d) and the Mircea scheme the lowest; hence, this pair of runs will provide a ballpark for the model uncertainty (in terms of modeled PM mass) due to the variability in the current Λ(d) formulations. Note that the scavenging process is more efficient for large particles dominating PM10 mass than for fine particles determining the PM2.5 mass. Thus, the differences in predicted mass concentrations from using the different scavenging coefficient parameterizations are expected to be larger for PM10 than for PM2.5 on short (hourly to daily) time scales. This assumption is confirmed by sensitivity test results from AURAMS. As seen from Figure 5b,c, the relative difference in the modeled daily mean mass concentrations between the two schemes are up to 10% for PM2.5 and up to 20% for PM10 in areas with moderate to heavy precipitation. It is noticed that the patterns in Figure 5b,c are slightly different from the precipitation distribution pattern in Figure 5a, e.g., the largest differences in Figure 5b,c are not necessarily at areas with largest amount of precipitation. This is because, for areas with heavy precipitation, if the majority of the PM mass has been removed rapidly and new particles have not replenished in time, the differences in mass concentrations from using different schemes would become smaller at later times. This is consistent with results from [211] where it was shown that the difference in bulk mass from using different Λ(d) schemes increased with time during the first several hours and then decrease with time at later times under heavy rain conditions.
4.2. Below-Cloud Gas Scavenging
The simplest approach for treating the below-cloud gas scavenging by rain in air quality models is perhaps the ‘scavenging coefficient’ approach (Λ(g), with g denoting different gaseous species), where the depletion of atmospheric gaseous concentration is assumed to follow a first-order decay (irreversible scavenging), similar to the Λ approach for particle scavenging discussed above. In AURAMS, this approach is used only for very soluble species (e.g., HNO3, NH3, H2O2, ROOH) while in CAMx, this approach is used for all gaseous species.
The Λ(g) approach does not require information on aqueous phase concentrations. Instead, Λ(g) is parameterized as a function of the gaseous diffusivity, precipitation rate, mean droplet size and settling velocity. The scavenging process involves the diffusion of gases to droplets and the subsequent aqueous-phase reactions. Thus, it is expected that Λ(g) depends more on total droplet surface area than on the precipitation rate, which is confirmed in a numerical study by Zhang et al. [218] for moderately to highly soluble species (SO2, HNO3, NH3, H2O2) under weak precipitation conditions. Unless the parameterized mean droplet size can properly represent the total droplet surface area under various precipitation conditions, it is likely that parameterizing Λ(g) using a single droplet size without the consideration of a full droplet spectra will introduce large errors in modeling the scavenging for soluble species. The same study also showed that Λ(g) for several soluble species (such as SO2 and H2O2) can vary by one order of magnitude depending on conditions such as droplet pH value and concentrations of other chemical species, due to the aqueous-phase reactions. Therefore parameterizing Λ(g) only as a function of physical parameters of precipitation (e.g., precipitation rate, mean droplet size) may cause large uncertainties. Given the same precipitation amount, uncertainties in the Λ(g) approach are expected to be larger in weak precipitation, which has a large amount of smaller droplets and hence large droplet surface area, than in strong precipitation.
The second relatively simple approach is the Henry's law equilibrium approach which assumes that the gas- and aqueous-phase concentrations are in equilibrium always (i.e., reversible scavenging). This approach is used in several models reviewed here for some or all gaseous species (see the third column in Table 5 for details). Theoretically, only weakly soluble species can reach equilibrium with small size droplets [208,219]. For example, equilibrium assumption should work well for species like O3 and CO2, but not for very soluble species. Deviation from Henry's law equilibrium can be significant for moderately to very soluble species (e.g., SO2, H2O2, HNO3), even for very small droplets [218,220]. Errors in this approach are largest for very soluble species and for large droplets (or heavy precipitation).
The theoretically correct and more complex approach is the kinetic mass transfer approach (also reversible scavenging) for those species whose gas-liquid phase equilibrium cannot be established readily. This approach is of course much more computationally intensive, having to integrate kinetic equations. Uncertainties in this approach can arise from the representation of droplet spectra and the modeled aqueous-phase concentrations. This approach is used in CMAQ, STEM, WRF-CHEM for some soluble species.
The impact on model prediction of gaseous pollutant concentrations due to the different representations of below-cloud scavenging of gases has not been assessed. In theory, errors from using the kinetic approach should be smaller than those from using other approaches; however, this does not guarantee better model results due to its complexity and the uncertainty in the parameters for describing the kinetic uptake. Considering that the below-cloud scavenging of gases is much more effective compared to the below-cloud scavenging of aerosol particles (except for very large ones), further detailed studies are needed to quantify the uncertainties from this process and to identify the best approaches for use in air quality models.
Gas scavenging by snow is ignored in most air-quality models. A scavenging coefficient approach is used in CAMx, and only a few gases (e.g., HNO3, NH3) are considered in AURAMS and STEM. In AURAMS, the scavenging of these species by snow is treated similarly to the scavenging of H2SO4 vapor which is based on an analogy to water vapor deposition rate on snow and ice [74]. Apparently, knowledge of gas scavenging by snow is very limited and more studies are needed both in field and laboratories and through targeted experiments.
4.3. “Rain-Out” vs. “Wash-Out” and Precipitation Evaporation
As mentioned in the beginning of this section, wet deposition and removal of atmospheric tracers consist of both the below-cloud scavenging and removal, or “wash-out”, and the removal of tracers in cloud water (through any of the processes: nucleation scavenging, impact scavenging of interstitial aerosol particles, gas diffusion and condensation on droplets, and in-cloud production) due to precipitation production (auto-conversion), or “rain-out”. Most of the models reviewed here do consider both wet deposition/removal processes with the exception of LOTIS-EUROS, which does not currently consider the rain-out component [88]. GATOR has a full, size resolved representation for the hydrometeor-hydrometeor and hydrometeor-aerosol microphysics, and hence the autoconversion (or precipitation production) and the tracer transfer (from cloud droplets to rain droplets) are represented explicitly. The approaches taken in AURAMS and WRF-CHEM are similar, i.e., using the bulk autoconversion rate (or precipitation production rate) as the tracer removal rate [73,74]. Both CMAQ and STEM treat rain-out removal within their respective diagnostic 1-D cloud models [94,208]. In CAMx, the rain-out process is treated as accretion of cloud droplets (or collection of cloud droplets by precipitation) with a scavenging coefficient parameterized by mean droplet diameter, droplet fall speed, collection efficient, and hydrometeor number density [91]. CHIMERE, COSMO-MUSCAT, and the EMEP unified model share the same algorithm for in-cloud scavenging and removal, i.e., using a first order scavenging rate parameterized by precipitation rate and prescribed scavenging efficiency (see Table 1). The relative importance of the rain-out mechanism vs. the wash-out mechanism differs for particles and gases. For gases, the wash-out process is expected to be more important than rain-out because of higher tracer concentrations at lower levels compared to at cloud levels. However, the removal of atmospheric aerosol particles through rain-out is more important (as far as mass is concerned) than wash-out due to the low efficiency of impact scavenging (except for very large particles; see for example the Λ(d)-vs.-size plot in [211]: the scavenging coefficient is several orders of magnitude smaller for particles in 0.1–1 μm range than for particles in the 10 μm and up range). In contrast, with an average activation diameter around 0.1 μm, nucleation scavenging is much more efficient for particles in accumulation range. In addition, tracer mass removed through rain-out would also include the fraction produced via aqueous-phase oxidation; for example, a past study has indicated that a considerable portion (about 50%) of wet deposited sulphate can be attributed to in-cloud production [74].
Another process that will have an impact on wet deposition and removal of atmospheric tracers is precipitation evaporation. It can play an important role in redistributing tracer mass in the vertical. As rain falls through unsaturated air, some or all may evaporate before reaching the ground, and consequently tracers present in the rain (due to in-cloud or below-cloud scavenging or in-cloud production) may be released back into the atmosphere closer to the ground. Whether and how the tracer release during precipitation evaporation is treated can have a significant impact on model predictions of ambient tracer concentrations and wet deposition. The raindrops may evaporate completely or only partially before hitting the ground. Depending on the phase (i.e., dissolved in solution or as solid core) and volatility of the tracers in the raindrops, they may be released to the gas phase (through equilibrium mass transfer) as the raindrops evaporate or remain in the drops until complete evaporation has occurred. Amongst the models reviewed here, only two do treat the precipitation evaporation process. GATOR has explicit treatment for the hydrometeor evaporation/sublimation during settling by accounting for vapor exchange and change in hydrometeor surface temperature [69]. Aerosol cores are retained in droplets until complete evaporation. AURAMS simply assumes that the rate for the release of tracers to the atmosphere equals to that of the bulk precipitation evaporation. As discussed in [74] this simple approach is likely to result in overestimation of the release of particles since they may have a tendency to remain in the rain droplets until complete evaporation. A sensitivity test by turning off the release of particles from precipitation evaporation showed a significant impact on the modeled ambient concentration and wet deposition flux of sulphate [74]. Although the majority of models reviewed here do not explicitly consider the evaporation process, the effects of evaporation on gases may be implicitly represented in some of the models using equilibrium partition between gas and aqueous phase (rain water).
Similar to the case of modeling aqueous-phase chemistry, large uncertainty in modeling precipitation scavenging can arise from the modeled precipitation and other relevant microphysical parameters, such as autoconversion and precipitation evaporation. Our confidence in these modeled microphysical parameters is relatively low.
5. Conclusions
In this paper we reviewed the representations of cloud processing of gases and aerosols in some of the current regional air quality models in North America and Europe. We have focused on a number of key processes: aerosol activation (or droplet nucleation), aqueous-phase chemistry, and wet deposition (removal) by precipitation, and we have mostly focused on warm cloud processes. Through some simple sensitivity tests we attempted to illustrate some of the potential impact on modeled regional air quality from the variability in current representations for several processes, namely aerosol activation, potential droplet aqueous-phase pathways for atmospheric secondary organic aerosol formation, and the parameterization of below-cloud scavenging of aerosol particles. The following are some of the findings.
5.1. Aerosol Activation
Although aerosol activation or nucleation scavenging of aerosols is an important process in aerosol-cloud interaction and has been an active area of research within the climate modeling community, it has not been a process attracting significant attention within the air quality modeling community. The approaches to represent this process in the current regional air quality models are varied. A few of the sectional models have explicit representations, from mechanistically based parameterizations to simple parameterizations of using an empirical formula or a fixed activation diameter. For models with modal or broad sectional (2–4 sections or modes) representation for the aerosol size spectrum, it is usually assumed that all the accumulation mode aerosol particles, or all particles in the accumulation mode range, are activated and incorporated in droplets in the presence of cloud. The sensitivity model runs conducted, for a two-month period over eastern North America, with two different activation parameterization schemes, showed a significant impact on the modeled droplet number concentration and on the averaged size distribution of the modeled ambient particulate matter. The impact on the modeled average (over the 2-month period) ambient PM2.5 concentration is limited (∼a few percents), but the impact on the modeled average PM1.0 concentration is considerably higher (up to 10 percents). Also, with the increasing interest in the area of air quality-climate interaction and the potential model applications in this area, there is a need to re-examine the representation of aerosol activation in current air quality models.
5.2. Inorganic Aqueous-Phase Chemistry
Almost all of the regional air quality models reviewed here have some representation for the aqueous-phase oxidation pathways leading to the production of sulphate in cloud. The models differ in chemistry mechanisms, from more complete atmospheric aqueous-phase chemistry, to sulphur oxidation focused chemistry, to highly parameterized single first-order reaction representation. Almost all models use a bulk approach for the aqueous-phase chemistry; a few have an option to use a variable-size-resolution-model approach to allow either a bulk or, when necessary, a two-bin representation in order to separate the droplets formed on larger, more alkaline particles from those formed on smaller, more acidic particles. Models also differ in how cloud water pH is determined, which will have an impact on aqueous-phase production of sulphate under certain conditions. As pointed out, though not reviewed here, the largest uncertainty in modeled aqueous-phase sulphate production may arise from the uncertainty in modeled cloud and liquid water content.
To date, the emphasis with regard to aqueous-phase feedback to aerosols is on the aerosol bulk mass within the air quality community. A few of the current sectional models do consider size distributed mass addition over the aerosol size spectrum from the aqueous-phase production, whereas this process is difficult to resolve in other air quality models due to their particular (or lack of) aerosol size representations. As discussed, the combination of aerosol activation and aqueous-phase secondary aerosol production has profound impact on the cloud processed aerosol size distribution and hence on aerosol optical properties. Again, this area may deserve some attention within the air quality modeling community.
5.3. Cloud Processing of Water-Soluble Organics
The cloud processing of water soluble organics and its potential impact on atmospheric SOA formation is a new area of active research within the atmospheric chemistry community. Given the large mass of biogenic and anthropogenic VOCs emitted into the atmosphere compared to the SO2 emissions, it is important to assess the role of aqueous-phase production of SOA. Based on the current literature, in most cases, the liquid phase reaction term (in E2) is the rate limiting step in the uptake of water soluble organic gases. Thus, water soluble gas uptake to cloud droplets depends critically on available liquid water content, species KH, species liquid reaction rate, and species liquid diffusion coefficient. Existing studies have assessed the importance of the effective KH in determining the potential for a given species to partition to the aqueous phase and have suggested a minimum value of 103 M/atm. A recent review of the structure activity relationships (needed for the calculation of effective KH) has revealed that most bifunctional species have KH greater than the 103 M/atm threshold, especially if one of the functional groups is an aldehyde or a peroxide. The weight of evidence from recent laboratory studies suggests that during the daytime the radical reactions dominate cloud organic chemistry, largely OH-initiated oxidation converting aldehyde groups to carboxylic acid groups. Of course, the details of the daytime radical chemistry (propagation vs. termination reactions, role of reservoir cycling) remain to be determined for atmospherically-relevant cloud conditions.
The results from the AURAMS sensitivity run, designed to give an upper-limit estimation of the impact of potential cloud droplet processing of atmospheric water soluble organic gases on SOA formation, suggest that indeed water soluble organic gas uptake to clouds and subsequent processing can be an important mechanism in addition to the traditional secondary organic gas uptake to the particle organic phase. The simple test with the additional pathway seems to result in improved evaluation statistics for modeled PM2.5 OA compared to the IMPROVE network data for a 2-month period, e.g., reduced negative model bias and RMSE and improved slope for the linear correlation between model and observation. It should be noted that aqueous production of SOA occurs under different conditions than traditional SOA partitioning, such as high liquid water contents (clouds, high relative humidity). This will be particularly true in locations with large isoprene emissions and high cloud liquid water contents such as the southeastern US. Overall, aqueous chemistry can also help explain the high OM/OC ratios and dicarboxylic acid measurements in ambient particles.
5.4. Wet Deposition
The majority of the models reviewed here use the scavenging coefficient (Λ) approach for below-cloud aerosol scavenging by rain or snow. The AURAMS sensitivity test for a two day period showed that the modeled daily ambient concentrations under rain conditions can differ by up to 10% for PM2.5 and by up to 20% for PM10, using two different theoretical Λ parameterizations (corresponding to the lower and upper bounds). This suggests that the uncertainties in below-cloud aerosol scavenging process are smaller than many other processes considered in the model. This is because particle mass is dominated by large particles and existing theoretical scavenging coefficient formulas agree with each other quite well for particles larger than 3 μm. It is also due to the fact that particles in the size range of 0.1–2 μm have lowest sensitivity to the scavenging process. The current Λ formulas used in the air quality models for snow scavenging are similar to those for rain scavenging. There is a lack of detailed and systematic studies to assess the uncertainty in the parameterization for scavenging by snow. Given the same precipitation amount, snow scavenging is expected to remove more particles from the atmosphere than rain scavenging due to the larger surface area of snow particles; and it is also expected that the uncertainties in current snow scavenging parameterizations will be larger than those in rain scavenging.
Various methods have been used for gas scavenging by rain, including the Λ approach (irreversible scavenging), Henry's law equilibrium (reversible scavenging), and kinetic mass transfer approach (also reversible scavenging). In some cases different approaches are used in the same model for different species (depending on the physical and chemical properties of the species). The uncertainties in gas scavenging by precipitation are known to be large, and further assessment of the uncertainties by comparing the different approaches within the same model framework would be worth pursuing. Scavenging (or uptake) of gases by snow is also an area needing further study both in the context of deposition and as part of snow chemistry and processing.


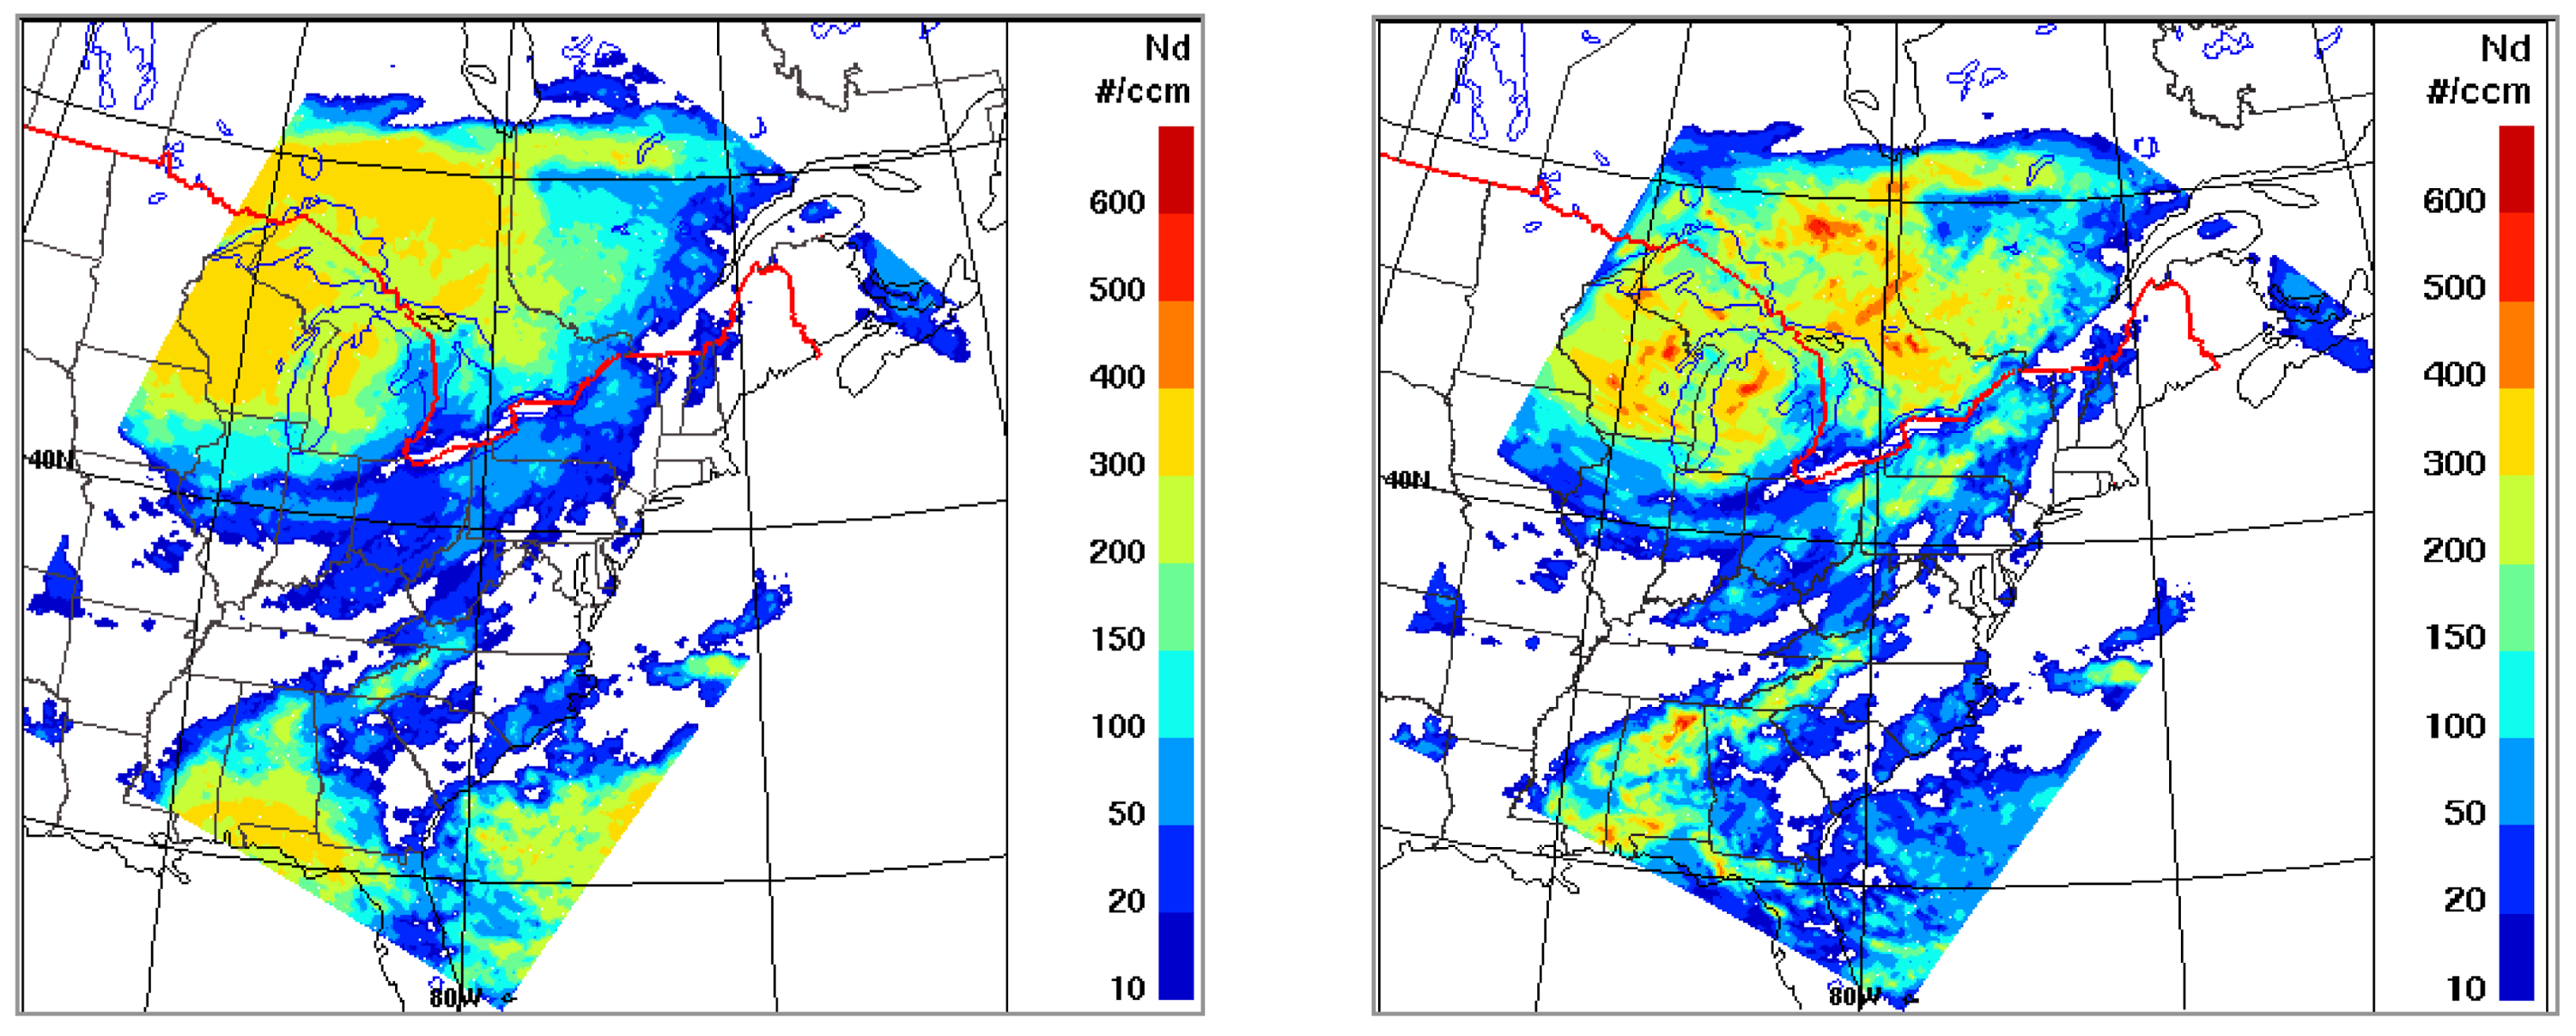
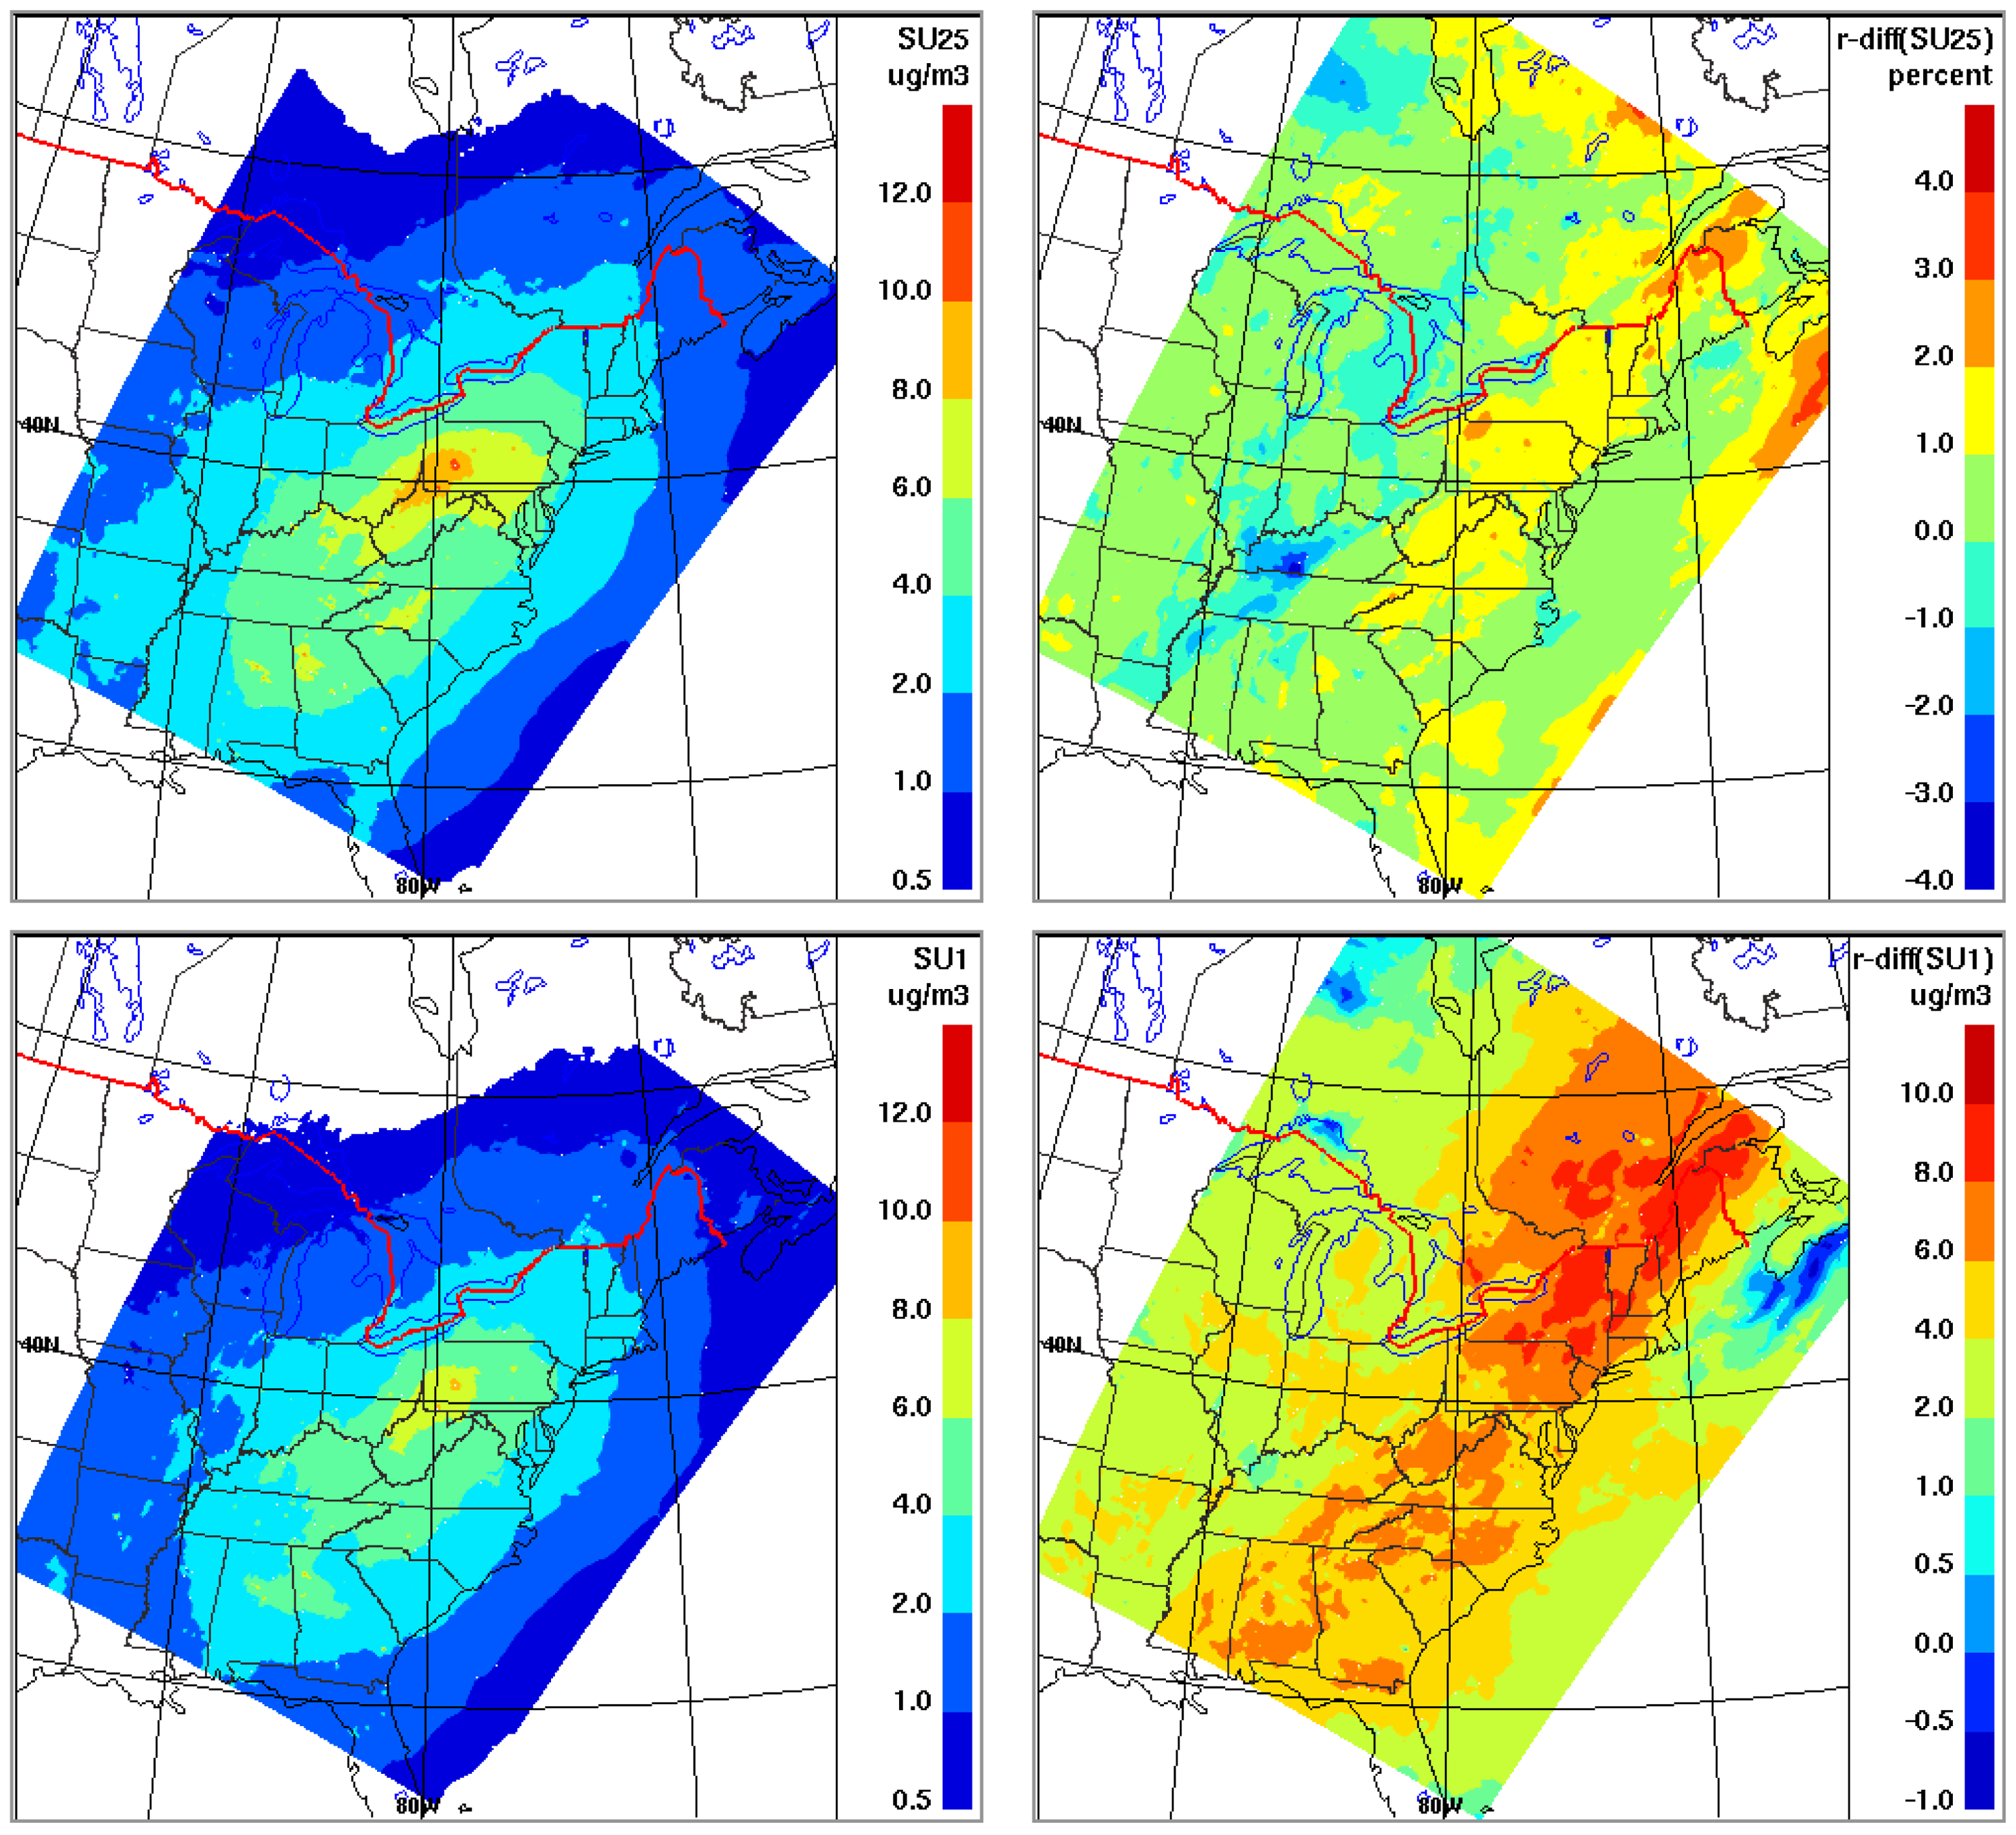
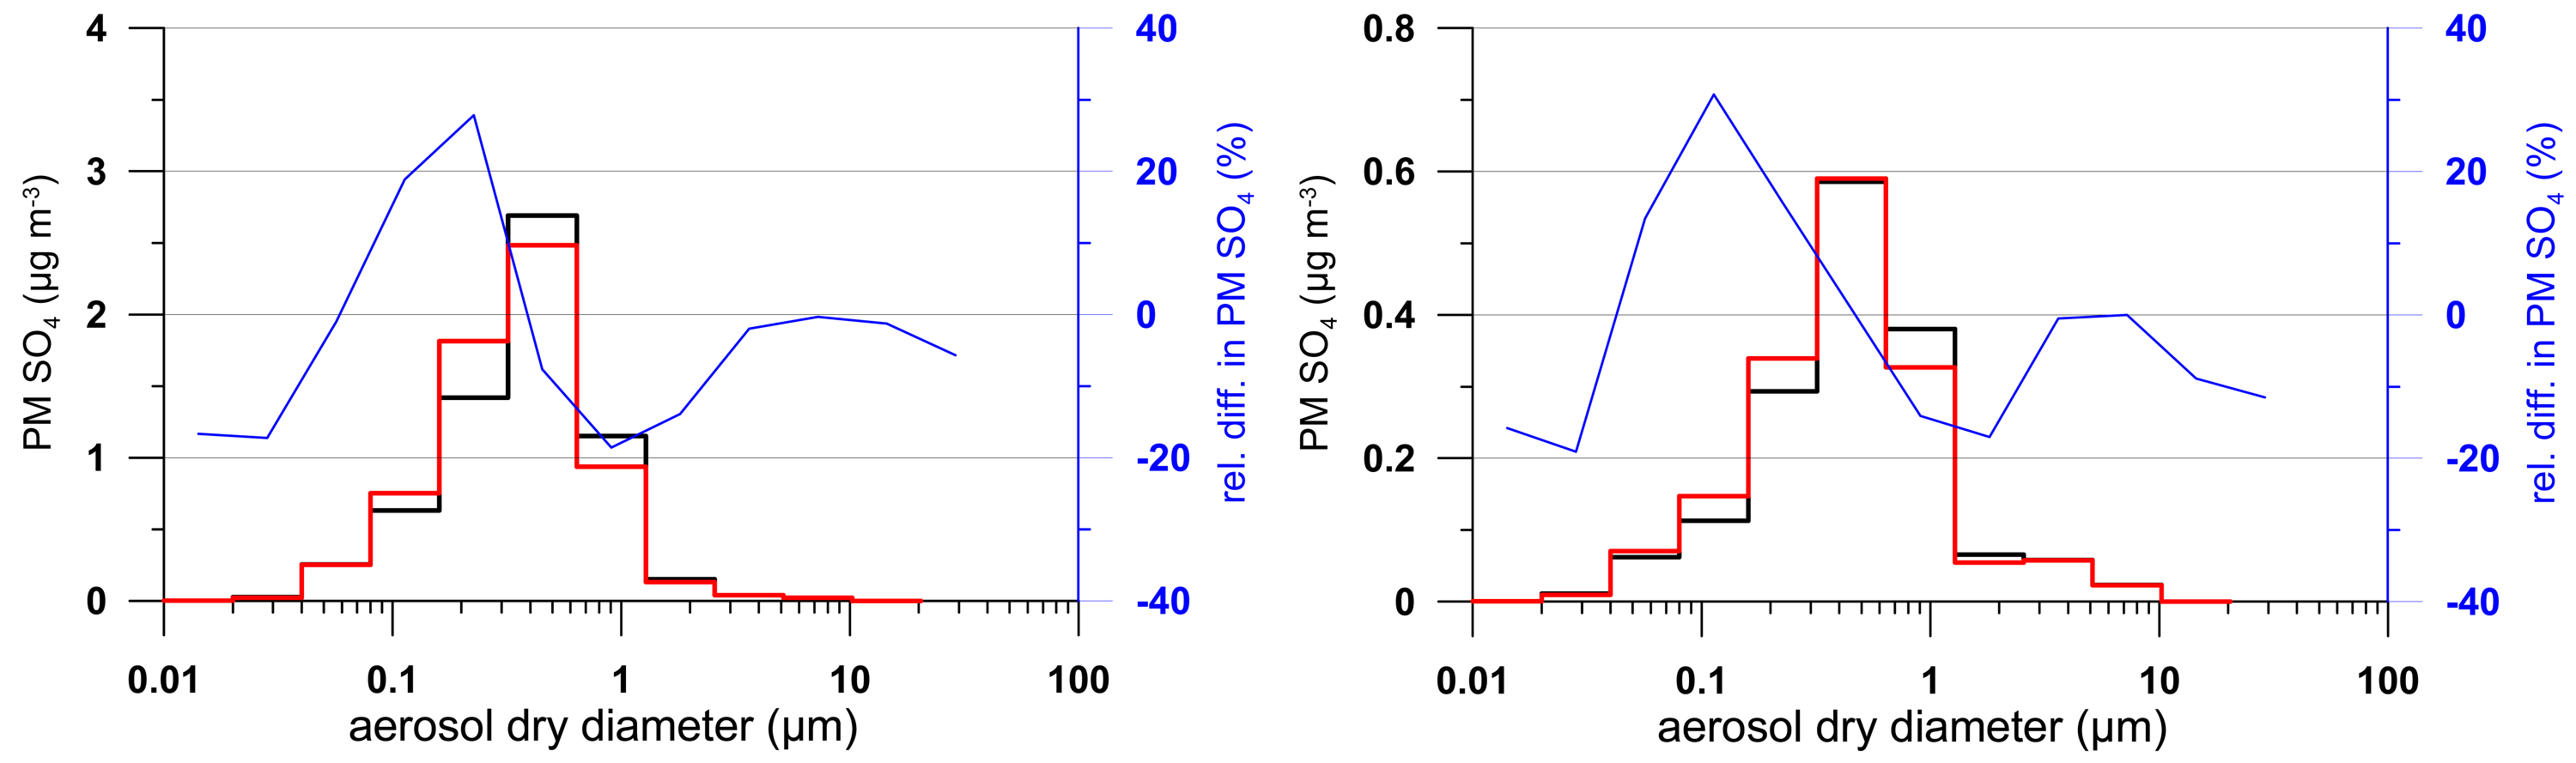
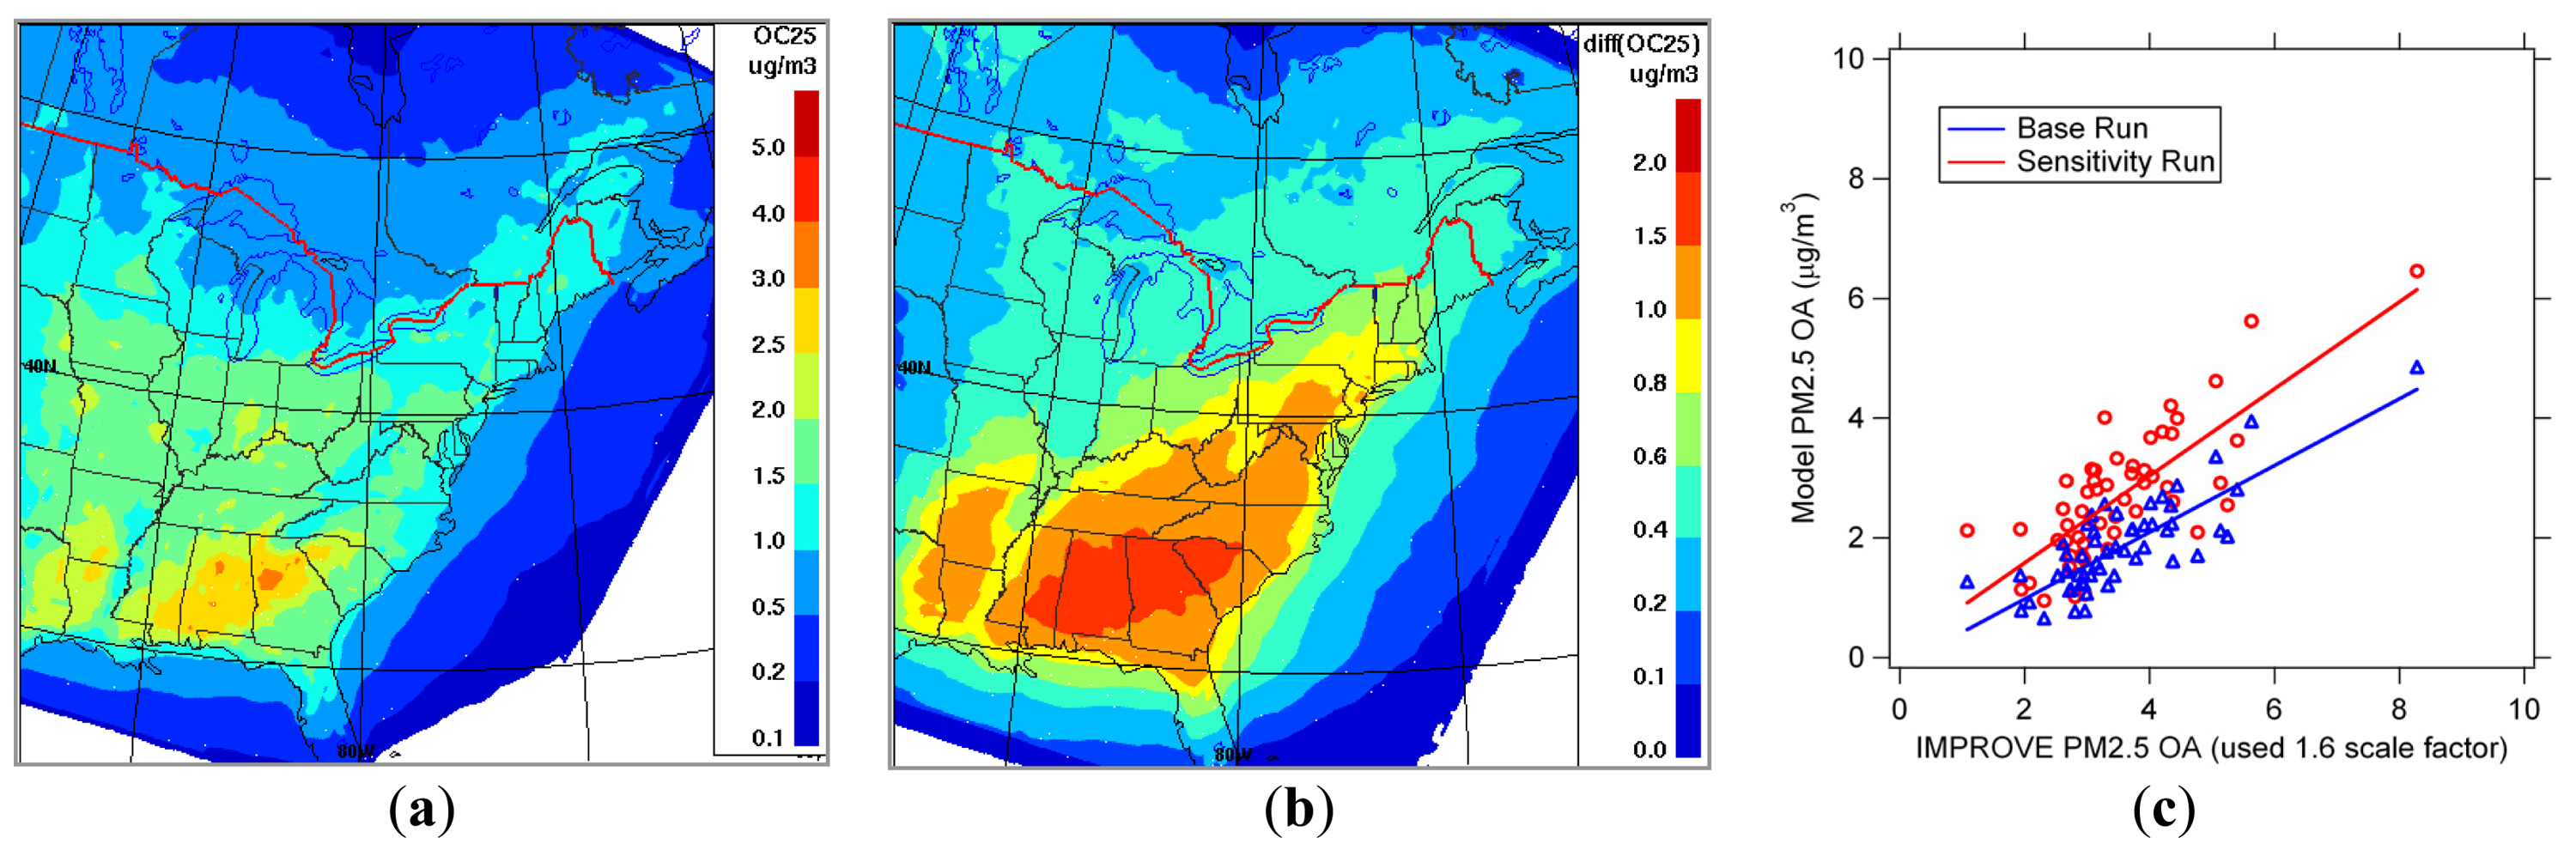
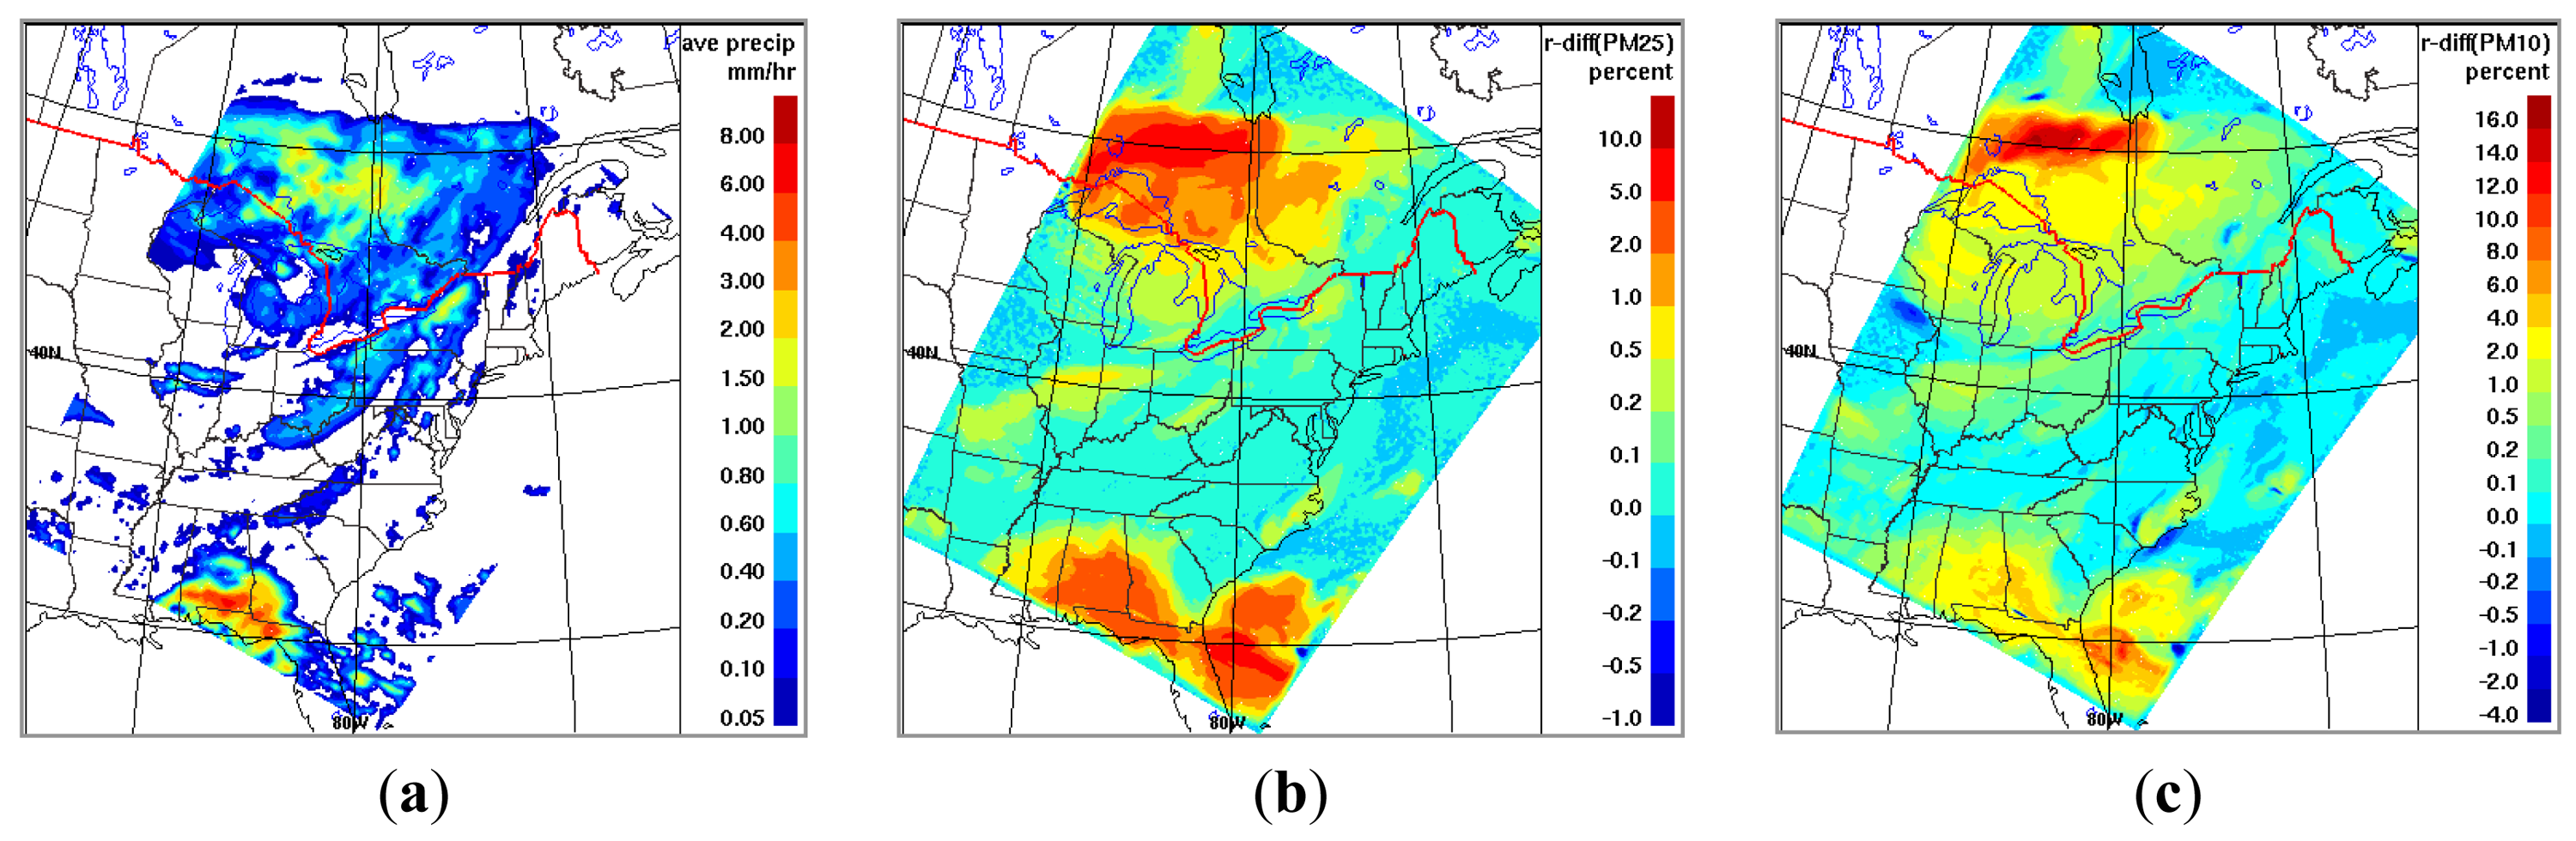
| AQ models (developer/institute, reference) | Aerosol size representation; component | Aerosol activation (droplet nucleation) | Droplet aqueous-phase chemistry | Cloud processed aerosols |
|---|---|---|---|---|
| AURAMS (A Unified Regional Air-quality Modeling System, Environment Canada, [74]) | Sectional, 12 bins (0.01–40.96 μm in diameter *); 9 components (sulphate, nitrate, ammonium, sea salt, primary organic matter, secondary organic matter, elemental carbon, crustal material, water). | Empirical parameterization, Ndroplet(cm−3)=375(1−e(−2.5×10⁻³Naerosol)) [77]. | Bulk (using average droplet size), ADOM aqueous-phase mechanism (kinetic mass transfer of SO2, H2O2, ROOH, HNO3, and NH3, Henry's law equilibrium for O3 and CO2, S(IV) to S(VI) oxidation by dissolved O3, H2O2, and ROOH), diagnosed pH by charge balance [74]. | Bulk mass increment due to aqueous-phase production is distributed to bins by using the ratios of the LWC in each activated (or partially activated) size bin to the total (bulk) LWC; the LWC in each bins is obtained by distributing bulk LWC from the met model to all activated aerosol particles evenly; mapping of aerosol after growth to fixed bin structure. |
| CAMx/PMCAMx (Comprehensive Air-quality Model with Extension, ENVIRON, [81,89]) | Sectional, 10 bins (0.04–40 μm) or 2 bins (2.5 and 10 μm, or “fine” and “coarse”); 8 mandatory PM (fine) species (sulphate, nitrate, ammonium, anthropogenic SOA, biogenic SOA, polymerized anthropogenic SOA, polymerized biogenic SOA, aerosol water). | An activation diameter of 0.7 μm is assumed in case of the 10-bin representation [90]; or all aerosol particles are assumed to exist within cloud water in the latest version 5.30 [91]. | VSRM aqueous phase chemistry [92], or bulk RADM aqueous-phase mechanism [78] related to aqueous-phase sulphate and nitrate formation in resolved cloud water [91]. | Bulk mass production is distributed into size bins by a weighting factor [91]. |
| CMAQ (Community Multi-Scale Air Quality, U.S. Environment Protection Agency, [78,79,93]) | Modal, 3 log-normal modes (Aitkin, accumulation, and coarse); 9 components: sulphate, nitrate, ammonium, elemental carbon, primary OC, biogenic and anthropogenic secondary OC, sea salt, and other. | All accumulation mode aerosol particles are activated and incorporated into cloud droplets [80]. | Bulk, RADM2 mechanism [94] + 4 new species if linked to CB4 gas-phase chemistry, i.e., three organic acid products: formic acid, acetic acid, and peroxyacetic acid, and MHP representing methylhydroperoxide [79]. | New mass due to aqueous-phase oxidation is added to the accumulation mode only, maintaining total number and geometric standard deviation of the mode [80]. |
| GATOR (Gas, Aerosol, Transport and Radiation Model, Stanford Univ., [66,67,68,95]) | Sectional, 16 bins (0.014–74 μm in diameter); 18 solid species including various organic salts, organic carbon, elemental carbon, and trace elements ([67,68]). | Explicit representation of water condensational and depositional growth onto size resolved aerosols, equilibrium saturation is based on Köhler theory, taking into considerations of solute and surface tension effect on activation [69]. | Bulk, oxygen-hydrogen, nitrogen, chlorine, carbonyl chemistry, sulphur oxidation by dissolved H2O2 and O3 [67], based on Pandis and Seinfeld [96] and Jacob et al. [97]. | Bulk sulphate mass increment from oxidation is distributed to size bins according to liquid water volume in each bins; cloud (bulk) microphysics is solved first for both sub-grid scale and resolved clouds, the water vapor evaporated/sublimated from the bulk microphysics is re-condensed/re-deposited onto aerosol particles along with other aerosol-hydrometeor and hydrometeor-hydrometeor interactions to produce aerosol/hydrometeor spectrum [69]. |
| STEM (Sulfur Transport and Deposition Model, Univ. of Iowa, [83,84]) | Sectional, 4 bins (0.1–10 μm in diameter); inorganic aerosol ions (sulphate, nitrate, ammonium, sodium, chloride, and other anions), sea salt, and dust ([84]). | No explicit representation of aerosol activation, or consider all sulphate aerosols being incorporated in cloud droplets via nucleation/activati on scavenging [14]. | Bulk, including primary pathways of sulphate and nitrate production in cloud water, equilibrium for mass transfer between gas and aqueous phase [14], based on Chameides and Davis [98], Chameides [99], and Jacob [100]. | Sulphate produced in cloud due to aqueous-phase oxidation is re-injected into gas phase as hydrometeors evaporate [14], which can then be partitioned to aerosol phase, e.g., using SCAPE-II [84]. |
| WRF-CHEM (Weather Research Forecast with Chemistry, National Center for Atmospheric Research, Pacific Northwest National Laboratory, [71,72,101]) | Modal (with MADE/SORGAM): 2 sub-micron log-normal modes; or sectional (with MOSAIC): 8 bins (0.04–10 μm in diameter); 9 components (sulphate, nitrate, ammonium, chloride, sodium, other inorganics, organic carbon, elemental carbon, water). | Mechanistic parameterization: based on Abdul-Razzak and Ghan parameterization for (multiple) modal [59] or sectional [70] representation. | PNNL (Pacific Northwest National Laboratory) version [72]: bulk, using Fahey and Pandis [92] mechanism, which is based on Pandis and Seinfeld [96] with the addition of aqueous-phase Ca2+ and gas phase H2SO4. | Bulk mass production from aqueous-phase is distributed to dry size sections according to liquid water content associated, which is determined by assuming a Gamma distribution of droplets and maximum correlation between droplet size and dry particle size (i.e., assuming largest activated aerosol particles are associated with largest droplets, [65]). |
| CHIMERE (An European Scale Chemical Transport Model, Institut Pierre-Simon Laplace/Laboratoire de Météoroologie Dynamique,Institut National de l'Environnement Industriel et des Risques, and Laboratoire Interuniversitaire des Systèmes Atmosphériques, [102,103]) | Sectional, 6 bins (0.01–40 μm); 6 components (primary particulate matter, sulphate, nitrate, ammonium, SOA, and water). | Only considered as part of wet deposition (in-cloud scavenging), parameterized with scavenging rate as in the unified EMEP model (see below). | Bulk, SO2 oxidation by H2O2, O3, and O2 (metal catalyzed), equilibrium mass transfer, diagnosed pH (from charge balance). | Unclear how the bulk mass addition due to aqueous-phase production is distributed to aerosol size spectrum after cloud evaporation. |
| COSMO-MUSCAT (Consortium for Small Scale Modeling—Multi-Scale Chemistry Aerosol Transport Model, Leibniz Institute for Tropospheric Research, [104-106]) | Modal/bulk: multiple modes (represented by average mode diameter); primary PM (dust, elemental carbon, organic carbon), secondary inorganic aerosol component (sulphate, nitrate, ammonium) [107]. | Same as the unified EMEP model. | Bulk, parameterized aqueous-phase production of SO4 following the same approach as in LOTOS-EUROS [107], see below. | |
| EMEP (European Monitoring and Evaluation Program) Unified Model (Meteorological Synthesis Centre-West, [108,109]) | 4 mono-disperse aerosol modes (nucleation, Aitken, accumulation, and coarse); 7 components (sulphate, nitrate, ammonium, organic carbon, elemental carbon, mineral dust, and sea salt). | As part of in-cloud scavenging, with a first order scavenging rate parameterized by precipitation rate and a scavenging efficiency with prescribed values for Aitken, accumulation, and coarse mode, respectively [87]. | Bulk, SO2 oxidation by H2O2, O3, and O2 (metal catalyzed), assuming equilibrium, prescribed pH (4.5) and cloud liquid water content (0.6 g m−3). | |
| LOTOS-EUROS (LOng Term Ozone Simulations—EURopean Ozone Simulations, Netherlands Organization for Applied Scientific Research, TNO, [88]) | Bulk (or 2 sections/modes): fine (primary and all secondary components) and coarse (primary); secondary inorganic aerosol components (sulphate, nitrate, ammonium), SOA, primary PM2.5 and PM2.5–10, black carbon, sea salt ([110]). | Not represented. | Parameterized by a single pseudo first order reaction for aqueous- phase SO2 oxidation to SO4, with a fixed base reaction rate modulated by cloud cover and RH. [88,111]. | Sulphate produced from the parameterized in-cloud SO2 oxidation pathway is added to the sulphate produced via gas-phase OH reaction and partitioned to aerosol phase via equilibrium (ISORROPIA, [112]). |
*All sizes referred here are dry sizes.
| Species | −ΔH/R (K) | KH(M/atm) | Reference |
|---|---|---|---|
| Formaldehyde\ | 7220 | 3000 | Betterton and Hoffmann, 1988 [151] |
| Acetaldehyde | 6290 | 12 | Betterton and Hoffmann, 1988 [151] |
| Propionaldehyde | 5700 | 13 | Zhou and Mopper, 1990 [152] |
| Butyraldehyde | 6200 | 10 | Zhou and Mopper, 1990 [152] |
| Glyoxal 1 | 303,000 | Betterton and Hoffmann, 1988 [151] | |
| Methylglyoxal 1 | 7540 | 3780 | Betterton and Hoffmann, 1988 [151] |
| Glycolaldehyde | 4630 | 41,400 | Betterton and Hoffmann, 1988 [151] |
| Methacrolein 2,3-Dihydroxmethacrylic acid | 6.5 2000 | Iraci et al., 1998 [153] Meylan and Howard, 1991 [154] | |
| Hydroxyacetone | 20,000 | Klotz et al., 1999 [155] | |
| Pinonaldehyde | 9000 | Meylan and Howard, 1991 [154] | |
| But-2-enedial 2 | 100,000 | Raventos-Duran et al., 2010 [150] | |
| Phenol 3 | 3600 | 2820 | Guo and Brimblecombe, 2007 [156] |
| Cresol 3 | 7700 | 1400 | Yaws and Yang, 1992 [157] |
| Formic Acid | 5700 | 5530 | Khan et al., 1995 [158] |
| Acetic Acid | 6300 | 5500 | Khan et al., 1995 [158] |
| Methanol | 5200 | 220 | Meylan and Howard, 1991 [154] |
| Ethanol | 6600 | 190 | Snider and Dawson, 1985 [159] |
| Ethylene Glycol | 400,000 | Bone et al., 1983 [160] |
1Lumped into MGLY species in AURAMS (see Section 3.2.2) with model KH = (3.0 × 10⁵ + 3780)/2 = 1.53 × 10⁵ M/atm and (−ΔH/R) = 3780.2Lumped into DIAL species in AURAMS (see Section 3.2.2) with model KH = 1 × 10⁵ M/atm and (−ΔH/R) = 0.3Lumped into CRES species in AURAMS (see Section 3.2.2.) with model KH = 2823 M/atm and (−ΔH/R) = 3600.
| Representative Species | kOH (M−1·s−1) | Relative to Ethane |
|---|---|---|
| Ethane | 1.6 × 10⁹ | 1.0 |
| Ethanol | 2.0 × 10⁹ | 1.25 |
| Acetaldehyde Hydrated Form | 3.6 × 10⁹ 1.2 × 10⁹ | 2.25 0.75 |
| Acetone | 1.5 × 10⁸ | 0.094 |
| Methyl Peroxide + OH CH3OOH + HSO4− | 3 × 10⁷ 1.7 × 10⁷ | 0.0188 0.0106 |
| Acetic Acid CH3COO− Ion | 1.6 × 10⁷ 8.5 × 10⁷ | 0.016 0.053 |
| Glyoxal Hydrated Form | 1.1 × 10⁹ | 0.688 |
| Glycolaldehyde | 1.2 × 10⁹ | 0.75 |
| Glyoxalate CHOCOO− Ion | 3.6 × 10⁸ 2.9 × 10⁹ | 0.225 1.81 |
| Oxalic Acid * HC2O4− Ion C2O42− Ion | 1.4 × 10⁶ 1.9 × 10⁸ 1.6 × 10⁸ | 8.8 × 10⁻⁴ 0.119 0.10 |
*Considerable spread in kinetic data [168].
| July–August 2004 (N = 54 sites) | Base case | Sensitivity |
|---|---|---|
| Mean Bias | −1.7 | −0.83 |
| NMB (Normalized Mean Bias) * | −48% | −24% |
| Correlation, R | 0.81 | 0.77 |
| RMSE (Root Mean Square Error) ** | 1.8 | 1.1 |
| Slope | 0.56 ± 0.05 | 0.73 ± 0.08 |
| Model y-intercept | −0.13 ± 0.20 | 0.13 ± 0.31 |
*;**.
| Model | Scavenging schemes | |||
|---|---|---|---|---|
| aerosol by rain | aerosol by snow and ice | gas by rain | gas by snow | |
| AURAMS | E(d) from [203] Mean D = 0.7 P0.25(mm) P in mm·h−1 [58]. | Λ(d) = f(D, E, P) Stellar-snow scavenging (−25 °C < T < 0 °C) and graupel scavenging (T < −25 °C) [58,204]. | Irreversible scavenging for highly soluble species (e.g., HNO3, NH3, H2O2, ROOH): [2,3,193]; and equilibrium/reversible scavenging for less soluble species (e.g., SO2, CO2) [58]. | Only considers HNO3 and NH3 as irreversible scavenging; Λ is calculated as twice the rate of H2SO4 vapor [205]. |
| CMAQ | Accumulation and coarse mode: completely absorbed by cloud and rain water. Aitken mode: treated as interstitial aerosol subject to scavenging by precipitation, [79]. | N/A | Mass transfer for species participating cloud chemistry and equilibrium for other species [79]. | N/A |
| CAMx | E(d)=f(d, D) [203], Mean D = 9.0 × 10⁻⁴ P0.21 (m) P in mm·h−1 [3,89,206]. | Same as for rain but with a lower limit for E, and different formulas for D. | Kc=f(D, Dg, Vt) Vt=3100D (m·s−1) [3,89]. | Same as for rain but with different formulas for D and Vt. |
| GATOR | Explicit aerosol-hydrometeor coagulation process [69]. | Explicit coagulation process [69]. | Gas-droplet equilibrium equation [207]. | N/A |
| STEM | Treated within a quasi-steady-state precipitation-scavenging module [208]. | Through a quasi-steady-state precipitation-scavenging module [208]. | Mass-transfer rates for most species; equilibrium for O3 and CO2. [83]. | Only consider HNO3 [83]. |
| WRF-CHEM | Same as in AURAMS (see above) [73]. | N/A | Mass transfer for SO2, H2O2, H2SO4, and MSA [73,209]. | N/A |
| CHIMERE | c is am empirical constant E(d)=f(d, D) [203]. P in g·cm−2·s−1 Vt in (cm·s−1) [103,203]. | N/A | P in mm·h−1 Vt from [103,210]. | N/A |
| EMEP unified model, COSMO-MUSCAT, LOTOS-EUROS (all share the same representation of gas and particle scavenging by rain) | Empirical constant α = 5.2 m3·kg−1·s−1 P in kg m−2·s−1 Vt = 5 m/s [109]. | N/A | Wsub: predefined constants P in kg·m−2·s−1 [109]. | N/A |
Λ: scavenging coefficient (s−1); d: aerosol diameter; D: droplet diameter; Dg: diffusivity for gaseous species; E: droplet-aerosol collection efficiency; Kc: Mass transfer coefficient; NSh: the Sherwood number; P: precipitation rate; Vt: droplet terminal velocity; τwashout, washout time representing the amount of time required to remove all of the water from the cloud volume at the specified precipitation rate; Re and Sc; respectively, the Reynolds and Schmidt numbers of drops.
Acknowledgments
The authors are grateful to the late Daewon Byun for suggesting this review. It has been a very fruitful exercise. The authors would like to thank Junhua Zhang for his contributions in running AURAMS for some of the sensitivity tests. The authors would also like to acknowledge the sponsors, administrators and technicians of the IMPROVE networks for providing long-term aerosol composition measurements. Two anonymous reviewers provided valuable comments and suggestions which are much appreciated.
References and Notes
- Flossman, A.I.; Hall, W.D.; Pruppacher, H.R. A theoretical study of the wet removal of atmospheric pollutants, I, The redistribution of aerosol particles captured through nucleation and impaction scavenging by growing cloud drops. J. Atmos. Sci. 1985, 42, 582–606. [Google Scholar]
- Pruppacher, H.R.; Klett, J.D. Microphysics of Clouds and Precipitation, 2nd ed.; Kluwer Academic Publishers: Dordrecht, The Nerthlands, 1997; Volume 18, p. 714. [Google Scholar]
- Seinfeld, J.H.; Pandis, S.N. Atmospheric Chemistry and Physics: From Air Pollution to Climate Change; John Wiley & Sons: New York, NY, USA, 1998; p. 1326. [Google Scholar]
- Barth, M.C.; Rasch, P.J.; Kiehl, J.T.; Benkovitz, C.M.; Schwartz, S.E. Sulfur chemistry in the National Center for Atmospheric Research Community Climate Model: Description, evaluation, features, and sensitivity to aqueous chemistry. J. Geophys. Res. 2000, 105, 1387–1415. [Google Scholar]
- Rasch, P.J.; Barth, M.C.; Kiehl, J.T.; Schwartz, S.E.; Benkovitz, C.M. A description of the global sulfur cycle and its controlling processes in the National Center for Atmospheric Research Community Climate Model, Version 3. J. Geophys. Res. 2000, 105, 1367–1385. [Google Scholar]
- Gong, W.; Zhang, J.; Makar, P.A.; Moran, M.D.; Stroud, C.; Gravel, S.; Gong, S.; Pabla, B. Evaluation of a Regional Air-quality Model (AURAMS) for Two Field Campaign Periods over South-eastern Canada and US Northeast: Impact of meteorology on Air Quality. Proceedings of the 12th AMS Conference on Atmospheric Chemistry, Atlanta, GA, USA, 18–21 January 2010.
- Seigneur, C.; Saxena, P. A theoretical investigation of sulphate formation in clouds. Atmos. Environ. 1988, 22, 101–115. [Google Scholar]
- Karamchandani, P.; Venkatram, A. The role of non-precipitating clouds in producing ambient sulphate during summer: Results from simulations with the acid deposition and oxidant model (ADOM). Atmos. Environ. 1992, 26A, 1041–1052. [Google Scholar]
- Barth, M.C.; Stuart, A.L.; Skamarock, W.C. Numerical simulations of the July 10, 1996, Stratospheric-Tropospheric Experiment: Radiation, Aerosols, and Ozone (STERAO)-Deep Convection experiment storm: Redistribution of soluble tracers. J. Geophys. Res. 2001, 106, 12381–12400. [Google Scholar]
- Barth, M.C.; Kim, S.W.; Skamarock, W.C.; Stuart, A.L.; Pickering, K.E.; Ott, L.E. Simulations of the redistribution of formaldehyde, formic acid, and peroxides in the 10 July 1996 Stratospheric-Tropospheric Experiment: Radiation, Aerosols, and Ozone deep convection storm. J. Geophys. Res. 2007, 112, D13310. [Google Scholar]
- Sorooshian, A.; Lu, M.-L.; Brechtel, F.J.; Jonsson, H.; Feingold, G.; Flagan, R.C.; Seinfeld, J.H. On the source of organic acid aerosol layers above clouds. Environ. Sci. Technol. 2007, 41, 4647–4654. [Google Scholar]
- Chang, J.S.; Brost, R.A.; Isaksen, I.S.A.; Madronich, S.; Middleton, P.; Stockwell, W.R.; Walcek, C.J. A three-dimensional Eulerian acid deposition model: Physical concepts and formulation. J. Geophys. Res. 1987, 92, 14681–14700. [Google Scholar]
- Venkatram, A.; Karamchandani, P.K.; Misra, P.K. Testing a comprehensive acid deposition model. Atmos. Environ. 1988, 22, 737–747. [Google Scholar]
- Carmichael, G.R.; Peters, L.K.; Saylor, R.D. The STEM-II regional scale acid deposition and photochemical oxidant model: I. An overview of model development and applications. Atmos. Environ. 1991, 25A, 2077–2090. [Google Scholar]
- Fung, C.S.; Misra, P.K.; Bloxam, R.; Wong, S. A numerical experiment on the relative importance of H2O2 and O3 in aqueous conversion of SO2 to SO42−. Atmos. Environ. 1991, 25, 411–423. [Google Scholar]
- Dennis, R.L.; McHenry, J.N.; Barchet, W.R.; Binkowski, F.S.; Byun, D.W. Correcting RADM's sulphate underprediction: Discovery and correction of model errors and testing the corrections through comparisons against field data. Atmos. Environ. 1993, 27A, 975–997. [Google Scholar]
- McHenry, J.N.; Dennis, R.L. The relative importance of oxidation pathways and clouds to atmospheric ambient sulphate production as predicted by the Regional Acid Deposition Model. J. Appl. Meteorol. 1994, 33, 890–905. [Google Scholar]
- Lelieveld, J.; Crutzen, P.J. The role of clouds in tropospheric photochemistry. J. Atmos. Chem. 1991, 12, 229–267. [Google Scholar]
- Liu, X.; Mauersberger, G.; Möller, D. The effects of cloud processes on the tropospheric photochemistry: An improvement of the eurad model with a coupled gaseous and aqueous chemical mechanism. Atmos. Environ. 1997, 31, 3119–3135. [Google Scholar]
- Barth, M.C.; Sillman, S.; Hudman, R.; Jacobson, M.Z.; Kim, C.-H.; Monod, A.; Liang, J. Summary of the cloud chemistry modeling intercomparison: Photochemical box model simulation. J. Geophys. Res. 2003, 108. [Google Scholar] [CrossRef]
- Benkovitz, C.M.; Schwartz, S.E. Evaluation of modeled sulfate and SO2 over North America and Europe for four seasonal months in 1986–87. J. Geophys. Res. 1997, 102, 25305–25338. [Google Scholar]
- Lohmann, U.; von Salzen, K.; McFarlane, N.; Leighton, H.G.; Feichter, J. Tropospheric sulfur cycle in the Canadian general circulation model. J. Geophys. Res. 1999, 104, 26833–26858. [Google Scholar]
- von Salzen, K.; Leifhton, H.G.; Ariya, P.A.; Barrie, L.A.; Gong, S.L.; Blanchet, J.-P.; Spacek, L.; Lohmann, U.; Kleinman, L.I. The sensitivity of sulphate aerosol size distribution and CCN concentration over North America to SOx emissions and H2O2 concentrations. J. Geophys. Res. 2000, 105, 9741–9766. [Google Scholar]
- Menon, S.; Del Genio, A.D.; Koch, D.; Tselioudis, G. GCM simulations of the aerosol indirect effect: Sensitivity to cloud parameterization and aerosol burden. J. Atmos. Sci. 2002, 59, 692–713. [Google Scholar]
- Penner, J.E.; Quaas, J.; Storelvmo, T.; Takemura, T.; Boucher, O.; Guo, H.; Kirkevåg, A.; Kristjánsson, J.E.; Seland, Ø. Model intercomparison of indirect aerosol effects. Atmos. Chem. Phys. 2006, 6, 3391–3405. [Google Scholar]
- Lohmann, U.; Stier, P.; Hoose, C.; Ferrachat, S.; Kloster, S.; Roeckner, E.; Zhang, J. Cloud microphysics and aerosol indirect effects in the global climate model ECHAM5-HAM. Atmos. Chem. Phys. 2007, 7, 3425–3446. [Google Scholar]
- Zhang, Y.; Wen, X.Y.; Jang, C.J. Simulating chemistry-aerosol-cloud-radiation-climate feedbacks over the continental U.S. using the online-coupled Weather Research Forecasting Model with chemistry (WRF/Chem). Atmos. Environ. 2010, 44, 3568–3582. [Google Scholar]
- Solomos, S.; Kallos, G.; Kushta, J.; Astitha, M.; Tremback, C.; Nenes, A.; Levin, Z. An integrated modeling study on the effects of mineral dust and sea salt particles on clouds and precipitation. Atmos. Chem. Phys. 2011, 11, 873–892. [Google Scholar]
- Zhang, Q.; Jimenez, J.L.; Canagaratna, M.R.; Allan, J.D.; Coe, H.; Ulbrich, I.; Alfarra, M.R.; Takami, A.; Middlebrook, A.M.; Sun, Y.L.; et al. Ubiquity and dominance of oxygenated species in organic aerosols in anthropogenically-influenced Northern Hemisphere midlatitudes. Geophys. Res. Lett. 2007, 34, L13801. [Google Scholar]
- Aiken, A.C.; DeCarlo, P.F.; Kroll, J.H.; Worsnop, D.R.; Huffman, J.A.; Docherty, K.S.; Ulbrich, I.M.; Mohr, C.; Kimmel, J.R.; Sueper, D.; et al. O/C and OM/OC ratios of primary, secondary, and ambient organic aerosols with high-resolution time-of-flight aerosol mass spectrometry. Environ. Sci. Technol. 2008, 42, 4478–4485. [Google Scholar]
- Turpin, B.J.; Lim, H.-J. Species Contributions to PM2.5 Mass Concentrations: Revisiting Common Assumptions for Estimating Organic Mass. Aerosol Sci. Technol. 2001, 35, 602–610. [Google Scholar]
- Polidori, A.; Hu, S.; Biswas, S.; Delfino, R.J.; Sioutas, C. Real-time characterization of particle-bound polycyclic aromatic hydrocarbons in ambient aerosols and from motor-vehicle exhaust. Atmos. Chem. Phys. 2008, 8, 1277–1291. [Google Scholar]
- Wozniak, A.S.; Bauer, J.E.; Sleighter, R.L.; Dickhut, R.M.; Hatcher, P.G. Technical note: Molecular characterization of aerosol-derived water soluble organic carbon using ultrahigh resolution electrospray ionization Fourier transform ion cyclotron resonance mass spectrometry. Atmos. Chem. Phys. 2008, 8, 5099–5111. [Google Scholar]
- Blando, J.D.; Turpin, B.J. Secondary organic aerosol formation in cloud and fog droplets: A literature evaluation of plausibility. Atmos. Environ. 2000, 34, 1623–1632. [Google Scholar]
- Yao, X.; Fang, M.; Chan, C.K. Size distributions and formation of dicarboxylic acids in atmospheric particles. Atmos. Environ. 2002, 36, 2099–2107. [Google Scholar]
- Sorooshian, A.; Varutbangkul, V.; Brechtel, F.J.; Ervens, B.; Feingold, G.; Bahreini, R.; Murphy, S.M.; Holloway, J.S.; Atlas, E.L.; Buzorius, G.; et al. Oxalic acid in clear and cloudy atmospheres: Analysis of data from International Consortium for Atmospheric Research on Transport and Transformation 2004. J. Geophys. Res. 2006, 111. [Google Scholar] [CrossRef]
- Crahan, K.K.; Hegg, D.; Covert, D.S.; Jonsson, H. An exploration of aqueous oxalic acid production in the coastal marine atmosphere. Atmos. Environ. 2004, 38, 3757–3764. [Google Scholar]
- Ervens, B.; Feingold, G.; Clegg, S.L.; Kreidenweis, S.M. Aqueous production of dicarboxylic acids 2: Implications for cloud microphysics. J. Geophys. Res. 2004, 109, D15206, 15210-11029/12003JD004575. [Google Scholar]
- Chen, J.; Griffin, R.J.; Grini, A.; Tulet, P. Modeling secondary organic aerosol formation through cloud processing of organic compounds. Atmos. Chem. Phys. 2007, 7, 5343–5355. [Google Scholar]
- Ervens, B.; George, C.; Williams, J.E.; Buxton, G.V.; Salmon, G.A.; Bydder, M.; Wilkinson, F.; Dentener, F.; Mirabel, P.; Wolke, R.; et al. CAPRAM 2.4 (MODAC mechanism): An extended and condensed tropospheric aqueous phase mechanism and its application. J. Geophys. Res. 2003, 108. [Google Scholar] [CrossRef]
- Carlton, A.G.; Turpin, B.J.; Altieri, K.E.; Seitzinger, S.P.; Mathur, R.; Roselle, S.J.; Weber, R.J. CMAQ Model Performance Enhanced When In-Cloud Secondary Organic Aerosol is Included: Comparisons of Organic Carbon Predictions with Measurements. Environ. Sci. Technol. 2008, 42, 8798–8802. [Google Scholar]
- Carlton, A.G.; Bhave, P.V.; Napelenok, S.L.; Edney, E.O.; Sarwar, G.; Pinder, R.W.; Pouliot, G.A.; Houyoux, M. Model Representation of Secondary Organic Aerosol in CMAQv4.7. Environ. Sci. Technol. 2010, 44, 8553–8560. [Google Scholar]
- Heintzenberg, J. Fine particles in the global troposphere: A review. Tellus 1989, 41, 149–160. [Google Scholar]
- Feingold, G.; Kreidenweis, S. Does cloud processing of aerosol enhance droplet concentrations? J. Geophys. Res. 2000, 105, 24351–24361. [Google Scholar]
- Mason, B.J. The Physics of Clouds, 2nd ed.; Clarendon Press: Oxford, UK, 1971. [Google Scholar]
- Twomey, S. The influence of pollution on the shortwave albedo of clouds. J. Atoms. Sci. 1977, 34, 1149–1152. [Google Scholar]
- Pruppacher, H.; Klett, J. Microphysics of Clouds and Precipitation; Reidel Publishing Company: Dordrecht, The Netherlands, 1978. [Google Scholar]
- Chuang, P.Y.; Charlson, R.J.; Seinfeld, J.H. Kinetic limitations on droplet formation in clouds. Nature 1997, 390, 594–596. [Google Scholar]
- Nenes, A.; Ghan, S.; Abdul-Razzak, H.; Chuang, P.Y.; Seinfeld, J.H. Kinetic limitations on cloud droplet formation and impact on cloud albedo. Tellus B 2001, 53, 133–149. [Google Scholar]
- Petters, M.D.; Kreidenweis, S.M. A single parameter representation of hygroscopic growth and cloud condensation nucleus activity. Atmos. Chem. Phys. 2007, 7, 1961–1971. [Google Scholar]
- Shulman, M.L.; Jacobson, M.C.; Carlson, R.J.; Synovec, R.E.; Young, T.E. Dissolution behavior and surface tension effects of organic compounds in nucleating cloud droplets. Geophys. Res. Lett. 1996, 23, 277–280. [Google Scholar]
- Facchini, M.C.; Mircea, M.; Fuzzi, S.; Charlson, R.J. Cloud albedo enhancement by surface-active organic solutes in growing droplets. Nature 1999, 401, 257–259. [Google Scholar]
- Broekhuizen, K.; Kumar, P.P.; Abbatt, J.P.D. Partially soluble organics as cloud condensation nuclei: Role of trace soluble and surface active species. Geophys. Res. Lett. 2004, 31, 1107. [Google Scholar]
- Feingold, G.; Chuang, P.Y. Analysis of the influence of film-forming compounds on droplet growth: Implications for cloud microphysical processes and climate. J. Atoms. Sci. 2002, 59, 2006–2018. [Google Scholar]
- Stroud, C.A.; Nenes, A.; Jimenez, J.L.; DeCarlo, P.F.; Huffman, J.A.; Bruintjes, R.; Nemitz, E.; Delia, A.E.; Toohey, D.W.; Guenther, A.B.; et al. Cloud activating properties of aerosol observed during CELTIC. J. Atoms. Sci. 2007, 64, 441–459. [Google Scholar]
- McFiggans, G.; Artaxo, P.; Baltensperger, U.; Coe, H.; Facchini, M.C.; Feingold, G.; Fuzzi, S.; Gysel, M.; Laaksonen, A.; Lohmann, U.; et al. The effect of physical and chemical aerosol properties on warm cloud droplet activation. Atmos. Chem. Phys. 2006, 6, 2593–2649. [Google Scholar]
- Boucher, O.; Lohmann, U. The sulfate-CCN-cloud albedo effect: A sensitivity study with two general circulation models. Tellus B 1995, 47, 281–300. [Google Scholar]
- Gong, S.L.; Barrie, L.A.; Blanchet, J.P.; von Salzen, K.; Lohmann, U.; Lesins, G.; Spacek, L.; Zhang, L.M.; Girard, E.; Lin, H.; et al. Canadian Aerosol Module: A size-segregated simulation of atmospheric aerosol processes for climate and air quality models 1. Module development. J. Geophys. Res. 2003, 108. [Google Scholar] [CrossRef]
- Abdul-Razzak, H.; Ghan, S.J. A parameterization of aerosol activation. Part 2: Multiple aerosol types. J. Geophys. Res. 2000, 105, 6837–6844. [Google Scholar]
- Nenes, A.; Seinfeld, J.H. Parameterization of cloud droplet formation in global climate models. J. Geophys. Res. 2003, 108. [Google Scholar] [CrossRef]
- Pringle, K.J.; Carslaw, K.S.; Spracklen, D.V.; Mann, G.M.; Chipperfield, M.P. The relationship between aerosol and cloud drop number concentrations in a global aerosol microphysics model. Atmos. Chem. Phys. 2009, 9, 4131–4144. [Google Scholar]
- Leaitch, W.R.; Lohmann, U.; Russell, L.M.; Garrett, T.; Shantz, N.C.; Toom-Sauntry, D.; Strapp, J.W.; Hayden, K.L.; Marshall, J.; Wolde, M.; et al. Cloud albedo increase from carbonaceous aerosol. Atmos. Chem. Phys. 2010, 10, 7669–7684. [Google Scholar]
- Yuen, P.-F.; Hegg, D.A.; Larson, T.V. The effects of in-cloud sulfate production on light-scattering properties of continental aerosol. J. Appl. Meteorol. 1994, 33, 848–854. [Google Scholar]
- Kreidenweis, S.M.; Walcek, C.J.; Feingold, G.; Gong, W.; Jacobson, M.Z.; Kim, C.-H.; Liu, X.; Penner, J.E.; Nenes, A.; Seinfeld, J.H. Modification of aerosol mass and size distribution due to aqueous-phase SO2 oxidation in clouds: Comparisons of several models. J. Geophys. Res. 2003, 108, AAC4.1–AAC4.12. [Google Scholar]
- Zhang, Y.; Easter, R.C.; Ghan, S.J.; Abdul-Razzak, H. Impact of aerosol size representation on modeling aerosol-cloud interactions. J. Geophys. Res. 2002, 107. [Google Scholar] [CrossRef]
- Jacobson, M.Z.; Lu, R.; Turco, R.P.; Toon, O.B. Development and application of a new air pollution modeling system-Part I: Gas-phase simulations. Atmos. Environ. 1996, 30, 1939–1963. [Google Scholar]
- Jacobson, M.Z. Development and application of a new air pollution modeling system. Part II: Aerosol module structure and design. Atmos. Environ. 1997, 31, 131–144. [Google Scholar]
- Jacobson, M.Z. Development and application of a new air pollution modeling system. Part III: Aerosol-phase simulations. Atmos. Environ. 1997, 31, 587–608. [Google Scholar]
- Jacobson, M.Z. Development of mixed-phase clouds from multiple aerosol size distributions and the effect of the clouds on aerosol removal. J. Geophys. Res. 2003, 108. [Google Scholar] [CrossRef]
- Abdul-Razzak, H.; Ghan, S.J. A parameterization of aerosol activation. Part 3: Sectional representation. J. Geophys. Res. 2002, 107. [Google Scholar] [CrossRef]
- Grell, G.A.; Peckham, S.E.; Schmitz, R.; McKeen, S.A.; Frost, G.; Skamarock, W.C.; Eder, B. Fully coupled “online” chemistry within the WRF model. Atmos. Environ. 2005, 39, 6957–6975. [Google Scholar]
- Fast, J.D.; Gustafson, W.I., Jr.; Easter, R.C.; Zaveri, R.A.; Barnard, J.C.; Chapman, E.G.; Grell, G.A.; Peckham, S.E. Evolution of ozone, particulates, and aerosol direct radiative forcing in the vicinity of Houston using a fully coupled meteorology-chemistry-aerosol model. J. Geophys. Res. 2006, 111. [Google Scholar] [CrossRef]
- Easter, R.C.; Ghan, S.J.; Zhang, Y.; Saylor, R.D.; Chapman, E.G.; Laulainen, N.S.; Abdul-Razzak, H.; Leung, L.R.; Bian, X.; Zaveri, R.A. MIRAGE: Model description and evaluation of aerosols and trace gases. J. Geophys. Res. 2004, 109. [Google Scholar] [CrossRef]
- Gong, W.; Dastoor, A.P.; Bouchet, V.S.; Gong, S.; Makar, P.A.; Moran, M.D.; Pabla, B.; Ménard, S.; Crevier, L.-P.; Cousineau, S.; et al. Cloud processing of gases and aerosols in a regional air quality model (AURAMS). Atmos. Res. 2006, 82, 248–275. [Google Scholar]
- Smyth, S.C.; Jiang, W.; Roth, H.; Moran, M.D.; Makar, P.A.; Yang, F.; Bouchet, V.S.; Landry, H. A comparative performance evaluation of the AURAMS and CMAQ air-quality modelling systems. Atmos. Environ. 2009, 43, 1059–1070. [Google Scholar]
- Makar, P.A.; Moran, M.D.; Zheng, Q.; Cousineau, S.; Sassi, M.; Duhamel, A.; Besner, M.; Davignon, D.; Crevier, L.P.; Bouchet, V.S. Modelling the impacts of ammonia emissions reductions on North American air quality. Atmos. Chem. Phys. 2009, 9, 7183–7212. [Google Scholar]
- Jones, A.; Roberts, D.L.; Slingo, J. A climate model study of indirect radiative forcing by anthropogenic sulphate aerosols. Nature 1994, 370, 450–453. [Google Scholar]
- Byun, D.W.; Ching, J.K.S. Science Algorithms of the EPA Models-3 Community Multiscale Air Quality (CMAQ) Modelling System; Report EPA/600/R-99/030; U.S. Environmental Protection Agency, Office of Research and Development: Washington, DC, USA, 1999. [Google Scholar]
- Byun, D.; Schere, K.L. Review of the governing equations, computational algorithms, and other components of the models-3 Community Multiscale Air Quality (CMAQ) modeling system. Appl. Mech. Rev. 2006, 59, 51–77. [Google Scholar]
- Binkowski, F.S.; Roselle, S.J. Models-3 Community Multiscale Air Quality (CMAQ) model aerosol component 1. Model description. J. Geophys. Res. 2003, 108. [Google Scholar] [CrossRef]
- Environ CAMX Model. Available online: http://www.camx.com/ (accessed on 31 May 2011).
- Morris, R.E.; Yarwood, G.; Emery, C.A.; Koo, B. Development and Application of the CAMx Regional One- Atmospheric Model to Treat Ozone, Particulate Matter, Visibility, Air Toxics and Mercury. Proceedings of the 97th Annual Conference and Exhibition of the A&WMA, Indianapolis, IN, USA; 2004; p. 15. [Google Scholar]
- Carmichael, G.R.; Tang, Y.; Kurata, G.; Uno, I.; Streets, D.; Woo, J.H.; Huang, H.; Yienger, J.; Lefer, B.; Shetter, R.; et al. Regional-scale chemical transport modeling in support of the analysis of observations obtained during the TRACE-P experiment. J. Geophys. Res. 2003, 108, GTE44.1–GTE44.28. [Google Scholar]
- Tang, Y.; Carmichael, G.R.; Seinfeld, J.H.; Dabdub, D.; Weber, R.J.; Huebert, B.; Clarke, A.D.; Guazzotti, S.A.; Sodeman, D.A.; Prather, K.A.; et al. Three-dimensional simulations of inorganic aerosol distributions in east Asia during spring 2001. J. Geophys. Res. 2004, 109. [Google Scholar] [CrossRef]
- Carmichael, G.R.; Peters, L.K.; Saylor, R.D. The STEM-II regional scale acid deposition and photochemical oxidant model—I. An overview of model development and applications. Atmos. Environ. 1991, 25A, 2077–2090. [Google Scholar]
- Tsyro, S.; Erdman, L. Parameterization of Aerosol Deposition Processes in EMEP MSC-E and MSC-W Transport Models; EMEP/MSC-E & MCS-W Note 7/00; Norwegian Meteorological Institute: Oslo, Norway, 2000. [Google Scholar]
- Tsyro, S. First Estimates of the Effects of Aerosol Dynamics in the Calculation of PM10 and PM2.5; EMEP/MSC-W NOTE 4/2002; Norwegian Meteorological Institute: Oslo, Norway, 2002. [Google Scholar]
- Schaap, M.; van Loon, M.; ten Brink, H.M.; Dentener, F.J.; Builtjes, P.J.H. Secondary inorganic aerosol simulations for Europe with special attention to nitrate. Atmos. Chem. Phys. 2004, 4, 857–874. [Google Scholar]
- Yarwood, G.; Morris, R.E.; Emery, C.A. Implementation of State-of-Science PM Modules into the PMCAMx Photochemical Grid Model. Proceedings of the 96th A&WMA Annual Meeting & Exhibition, San Diego, CA, USA; 2003; p. 20. [Google Scholar]
- CRC. Development of an Advanced Photochemical Model for Particulate Matter: PMCAMx; CRC Project A-30; Coordinating Reseach Council: Alpharetta, GA, USA, 2003. [Google Scholar]
- ENVIRON. User's Guide: Comprehensive Air Quality Model with Extension; Version 5.30; ENVIRON International Corporation: Novato, CA, USA, 2010; p. 295. [Google Scholar]
- Fahey, K.M.; Pandis, S.N. Optimizing model performance: Variable size resolution in cloud chemistry modeling. Atmos. Environ. 2001, 35, 4471–4478. [Google Scholar]
- CMAS CMAQ Model. Available online: http://www.cmaq-model.org/ (accessed on 31 May 2011).
- Chang, J.S.; Middleton, P.B.; Stockwell, W.R.; Walcek, C.J.; Pleim, J.E.; Lansford, H.H.; Binkowski, F.S.; Madronich, S.; Sesman, N.L.; Stauffer, D.R.; et al. The Regional Acid Deposition Model and Engineering Model. Acid Deposition: State of Science and Technology; Report 4; US Environmental Protection Agency: Washington, DC, USA, 1990. [Google Scholar]
- Jacobson, M.Z. History of, processes in, and numerical techniques in GATOR-GCMOM. Available online: http://www.stanford.edu/group/efmh/GATOR/index.html (accessed on 31 May 2011).
- Pandis, S.; Seinfeld, J. Sensitivity analysis of a chemical mechanism for aqueous-phase atmospheric chemistry. J. Geophys. Res. 1989, 94, 1105–1126. [Google Scholar]
- Jacob, D.; Gottlieb, E.; Prather, M. Chemistry of a polluted cloudy boundary layer. J. Geophys. Res. 1989, 94, 12975–13002. [Google Scholar]
- Chameides, W.L.; Davis, D.D. The free radical chemistry of cloud droplets and its impact upon the composition of rain. J. Geophys. Res. 1982, 87, 4863–4877. [Google Scholar]
- Chameides, W.L. The photochemistry of a remote marine stratiform cloud. J. Geophys. Res. 1984, 89, 4739–4755. [Google Scholar]
- Jacob, D.J. Chemistry of OH in remote clouds and its role in the production of formic acid and peroxymonosulfate. J. Geophys. Res. 1986, 91, 9807–9826. [Google Scholar]
- NOAA/ESRL WRF-CHEM Home Page. http://ruc.noaa.gov/wrf/WG11/ (accessed on 31 May 2011).
- IPSL-INERIS-LISA CHIMERE Model Home Page. http://www.lmd.polytechnique.fr/chimere/chimere.php (accessed on 31 May 2011).
- Bessagnet, B.; Hodzic, A.; Blanchard, O.; Lattuati, M.; Le Bihan, O.; Marfaing, H.; Rouïl, L. Origin of particulate matter pollution episodes in wintertime over the Paris Basin. Atmos. Environ. 2005, 39, 6159–6174. [Google Scholar]
- IfT Chemistry-Transport Model System COSMO-MUSCAT Home Page. http://projects.tropos.de/cosmo_muscat/ (accessed on 31 May 2011).
- Heinold, B.; Helmert, J.; Hellmuth, O.; Wolke, R.; Ansmann, A.; Marticorena, B.; Laurent, B.; Tegen, I. Regional modeling of Saharan dust events using LM-MUSCAT: Model description and case studies. J. Geophys. Res. 2007, 112, D11204. [Google Scholar]
- Wolke, R.; Heinold, B.; Helmert, J.; Hinneburg, D.; Lieber, M.; Renner, E.; Schröder, W.; Tegen, I. Modelling of Atmospheric Chemistry Transport Processes. Proceedings of NIC Symposium 2006; Münster, G., Wolf, D., Kremer, M., Eds.; John von Neumann Institute for Computing: Jülich, Germany, 2006; pp. 281–288. [Google Scholar]
- Renner, E.; Wolke, R. Modelling the formation and atmospheric transport of secondary inorganic aerosols with special attention to regions with high ammonia emissions. Atmos. Environ. 2010, 44, 1904–1912. [Google Scholar]
- EMEP Open Source Unified EMEP Model Home Page. http://www.emep.int/OpenSource/ (accessed on 31 May 2011).
- Simpson, D.; Fagerli, H.; Jonson, J.E.; Tsyro, S.; Wind, P.; Tuovinen, J.-P. Transboundary Acidification, Eutrophication and Ground Level Ozone in Europe, Part I: Unified EMEP Model Description; EMEP Report 1/2003; Norwegian Meteorological Institute: Oslo, Norway, 2003; p. 104. [Google Scholar]
- Schaap, M.; Timmermans, R.M.A.; Roemer, M.; Boersen, G.A.C.; Builtjes, P.J.H.; Sauter, F.J.; Velders, G.J.M.; Beck, J.P. The LOTOS–EUROS model: Description, validation and latest developments. Int. J. Environ. Pollut. 2008, 32, 270–290. [Google Scholar]
- Barbu, A.L.; Segers, A.J.; Schaap, M.; Heemink, A.W.; Builtjes, P.J.H. A multi-component data assimilation experiment directed to sulphur dioxide and sulphate over Europe. Atmos. Environ. 2009, 43, 1622–1631. [Google Scholar]
- Nenes, A.; Pandis, S.N.; Pilinis, C. ISORROPIA: A new thermodynamic equilibrium model for multiphase multicomponent inorganic aerosols. Aquat. Geochem. 1998, 4, 123–152. [Google Scholar]
- Peng, Y.; Lohmann, U.; Leaitch, R. Importance of vertical velocity variations in the cloud droplet nucleation process of marine stratus clouds. J. Geophys. Res. 2005, 110. [Google Scholar] [CrossRef]
- Fountoukis, C.; Nenes, A.; Meskhidze, N.; Bahreini, R.; Conant, W.C.; Jonsson, H.; Murphy, S.; Sorooshian, A.; Varutbangkul, V.; Brechtel, F.; et al. Aerosol-cloud drop concentration closure for clouds sampled during the International Consortium for Atmospheric Research on Transport and Transformation 2004 campaign. J. Geophys. Res. 2007, 112, D10S30. [Google Scholar]
- Hoose, C.; Kristjansson, J.E.; Arabas, S.; Boers, R.; Pawlowska, H.; Puygrenier, V.; Siebert, H.; Thouron, O. Parameterization of in-cloud Vertical Velocities for Cloud Droplet Activation in Coarse-grid Models: Analysis of Observations and Cloud Resolving Model Results. Proceedings of the 13th AMS Conference on Atmospheric Radiation, Portland, OR, USA, 28 June–2 July 2010.
- Fehsenfeld, F.C.; Ancellet, G.; Bates, T.S.; Goldstein, A.H.; Hardesty, R.M.; Honrath, R.; Law, K.S.; Lewis, A.C.; Leaitch, R.; McKeen, S.; et al. International Consortium for Atmospheric Research on Transport and Transformation (ICARTT): North America to Europe—Overview of the 2004 summer field study. J. Geophys. Res. 2006, 111. [Google Scholar] [CrossRef]
- Gong, W.; Zhang, J.; Makar, P.A.; Moran, M.D.; Stroud, C.; Gravel, S.; Gong, S.; Pabla, B. Comparative Evaluation of Model Simulations of Regional Ozone and Particulate Matters for Two Distinct Summers over Eastern North America. Proceedings of the NATO/SPS ITM on Air Pollution Modelling and its Application, Torino, Italy, 27 Spetember–1 October 2010; Steyn, D., Trini Castelli, S., Eds.; Springer: Berlin, Germany.
- Leaitch, W.R.; Isaac, G.A.; Strapp, J.W.; Banic, C.M.; Wiebe, H.A. The relationship between cloud droplet number concentrations and anthropogenic pollution: Observations and climatic implications. J. Geophys. Res. 1992, 97, 2463–2474. [Google Scholar]
- Lowenthal, D.H.; Borys, R.D.; Choularton, T.W.; Bower, K.N.; Flynn, M.J.; Gallagher, M.W. Parameterization of the cloud droplet-sulfate relationship. Atmos. Environ. 2004, 38, 287–292. [Google Scholar]
- Zhang, Y. Online-coupled meteorology and chemistry models: History, current status, and outlook. Atmos. Chem. Phys. 2008, 8, 2895–2932. [Google Scholar]
- Liu, P.S.K.; Deng, R.; Smith, K.A.; Williams, L.R.; Jayne, J.T.; Canagaratna, M.R.; Moore, K.; Onasch, T.B.; Worsnop, D.R.; Deshler, T. Transmission efficiency of an aerodynamic focusing lens system: Comparison of model calculations and laboratory measurements for the aerodyne aerosol mass spectrometer. Aerosol Sci. Technol. 2007, 41, 721–733. [Google Scholar]
- Abdul-Razzak, H.; Ghan, S.J. Parameterization of the influence of organic surfactants on aerosol activation. J. Geophys. Res. 2004, 109. [Google Scholar] [CrossRef]
- Rissman, T.A.; Nenes, A.; Seinfeld, J.H. Chemical amplification (or dampening) of the twomey effect: Conditions derived from droplet activation theory. J. Atoms. Sci 2004, 61, 919–930. [Google Scholar]
- Barahona, D.; Nenes, A. Parameterization of cloud droplet formation in large-scale models: Including effects of entrainment. J. Geophys. Res 2007, 112. [Google Scholar] [CrossRef]
- Lim, Y.B.; Tan, Y.; Perri, M.J.; Seitzinger, S.P.; Turpin, B.J. Aqueous chemistry and its role in secondary organic aerosol (SOA) formation. Atmos. Chem. Phys. 2010, 10, 10521–10539. [Google Scholar]
- Graedel, T.E.; Wechsler, C.J. Chemistry in aqueous atmospheric aerosols and raindrops. Rev. Geophys. Space Phys. 1981, 19, 505–539. [Google Scholar]
- Graedel, T.E.; Goldberg, K.I. Kinetic studies of raindrop chemistry. I: Inorganic and organic processes. J. Geophys. Res. 1983, 88, 10865–10882. [Google Scholar]
- Jacob, D.J.; Hoffmann, M.R. A dynamic model for the production of H+, NO3−, and SO42− in urban fog. J. Geophys. Res. 1983, 88, 6611–6621. [Google Scholar]
- Young, J.R.; Lurmann, F.W. ADOM/TADAP Model Development Program, Volume 7: Aqueous Phase Chemistry; ERT Document No. P-B980-535; Environmental Research and Technology: Newbury Park, CA, USA, 1984; p. 133. [Google Scholar]
- Hoffmann, M.R.; Jacob, D.J. Kinetics and Mechanisms of the Catalytic Oxidation of Dissolved Sulphur Dioxide in Aqueous Solution: An Application to Nighttime Fog Water Chemistry. In SO2, NO and NO2 Oxidation Mechanisms: Atmospheric Considerations; Calvert, J.G., Ed.; Butterworth Publishers: Boston, MA, USA, 1984; pp. 101–172. [Google Scholar]
- Hallquist, M.; Wenger, J.C.; Baltensperger, U.; Rudich, Y.; Simpson, D.; Claeys, M.; Dommen, J.; Donahue, N.M.; George, C.; Goldstein, A.H.; et al. The formation, properties and impact of secondary organic aerosol: Current and emerging issues. Atmos. Chem. Phys. 2009, 9, 5155–5236. [Google Scholar]
- Heald, C.L.; Jacob, D.J.; Park, R.J.; Russell, L.M.; Huebert, B.J.; Seinfeld, J.H.; Liao, H.; Weber, R.J. A large organic aerosol source in the free troposphere missing from current models. Geophys. Res. Lett. 2005, 32. [Google Scholar] [CrossRef]
- Volkamer, R.; Jimenez, J.L.; San Martini, F.; Dzepina, K.; Zhang, Q.; Salcedo, D.; Molina, L.T.; Worsnop, D.R.; Molina, M.J. Secondary organic aerosol formation from anthropogenic air pollution: Rapid and higher than expected. Geophys. Res. Lett. 2006, 33. [Google Scholar] [CrossRef]
- Morris, R.E.; Koo, B.; Guenther, A.; Yarwood, G.; McNally, D.; Tesche, T.W.; Tonnesen, G.; Boylan, J.; Brewer, P. Model sensitivity evaluation for organic carbon using two multi-pollutant air quality models that simulate regional haze in the southeastern United States. Atmos. Environ. 2006, 40, 4960–4972. [Google Scholar]
- Goldstein, A.H.; Galbally, I.E. Known and unexplored organic constituents in the earth's atmosphere. Environ. Sci. Technol. 2007, 41, 1514–1521. [Google Scholar]
- Yu, S.; Mathur, R.; Schere, K.; Kang, D.; Pleim, J.; Young, J.; Tong, D.; Pouliot, G.; McKeen, S.A.; Rao, S.T. Evaluation of real-time PM2.5 forecasts and process analysis for PM2.5 formation over the eastern United States using the Eta-CMAQ forecast model during the 2004 ICARTT study. J. Geophys. Res. 2008, 113. [Google Scholar] [CrossRef]
- Hegg, D.A.; Larson, T.V. The effects of microphysical parameterization on model predictions of sulfate production in clouds. Tellus B 1990, 42, 272–284. [Google Scholar]
- Roelofs, G.J.H. A cloud chemistry sensitivity study and comparison of explicit and bulk cloud model performance. Atmos. Environ. 1993, 27A, 2255–2264. [Google Scholar]
- Gurciullo, C.S.; Pandis, S.N. Effect of composition variations in cloud droplet populations on aqueous-phase chemistry. J. Geophys. Res. 1997, 102, 9375–9385. [Google Scholar]
- Barth, M.C. The importance of cloud drop representation on cloud photochemistry. Atmos. Res. 2006, 82, 294–309. [Google Scholar]
- Fuchs, N.A.; Sutugin, A.G. Highly Dispersed Aerosols; Pergamon Press: New York, NY, USA, 1971; Volume 2, pp. 1–60. [Google Scholar]
- Kim, Y.P.; Seinfeld, J.H.; Saxena, P. Atmospheric gas aerosol equilibrium I—Thermodynamic model. Aerosol Sci. Technol. 1993, 19, 157–181. [Google Scholar]
- Kim, Y.P.; Seinfeld, J.H.; Saxena, P. Atmospheric Gas-Aerosol Equilibrium II. Analysis of common approximations and activity coefficient calculation methods. Aerosol Sci. Technol. 1993, 19, 182–198. [Google Scholar]
- Kim, Y.P.; Seinfeld, J.H. Atmospheric Gas—Aerosol Equilibrium: III. Thermodynamics of Crustal Elements Ca2+, K+, and Mg2+. Aerosol Sci. Technol. 1995, 22, 93–110. [Google Scholar]
- Zhang, J.; Gong, W.; Leaitch, W.R.; Strapp, J.W. Evaluation of modeled cloud properties against aircraft observations for air quality applications. J. Geophys. Res. 2007, 112. [Google Scholar] [CrossRef]
- Schwartz, S.E. Mass-transport Considerations Pertinent to Aqueous-phase Reactions of Gases in Liquid Water Clouds. In Chemistry of Multiphase Atmospheric Systems; Jaeschke, W., Ed.; Springer-Verlag: New York, NY, USA, 1986; Volume G6, pp. 415–471. [Google Scholar]
- Ravishankara, A.R. Heterogeneous and multiphase chemistry in the troposphere. Science 1997, 276, 1058–1065. [Google Scholar]
- Müller, B.; Heal, M.R. The mass accommodation coefficient of ozone on an aqueous surface. Phys. Chem. Chem. Phys. 2002, 4, 3365–3369. [Google Scholar]
- Gelencsér, A.; Varga, Z. Evaluation of the atmospheric significance of multiphase reactions in atmospheric secondary organic aerosol formation. Atmos. Chem. Phys. 2005, 5, 2823–2831. [Google Scholar]
- Raventos-Duran, T.; Camredon, M.; Valorso, R.; Mouchel-Vallon, C.; Aumont, B. Structure-activity relationships to estimate the effective Henry's law constants of organics of atmospheric interest. Atmos. Chem. Phys. 2010, 10, 7643–7654. [Google Scholar]
- Betterton, E.A.; Hoffmann, M.R. Henry's law constants of some environmentally important aldehydes. Environ. Sci. Technol. 1988, 22, 1415–1418. [Google Scholar]
- Zhou, X.; Mopper, K. Apparent partition coefficients of 15 carbonyl compounds between air and seawater and between air and freshwater; implications for air-sea exchange. Environ. Sci. Technol. 1990, 24, 1864–1869. [Google Scholar]
- Iraci, L.T.; Baker, B.M.; Tyndall, G.S.; Orlando, J.J. Measurements of the Henry's law coefficients of 2-methyl-3-buten-2-ol, methacrolein, and methylvinyl ketone. J. Atmos. Chem. 1999, 33, 321–330. [Google Scholar]
- Meylan, W.M.; Howard, P.H. Bond contribution method for estimating Henry's law constants. Environ. Toxicol. Chem. 1991, 10, 1283–1293. [Google Scholar]
- Klotz, B.; Barnes, I.; Becker, K.-H. Kinetic study of the gas-phase photolysis and OH radical reaction of E,Z- and E,E-2,4-Hexadienedial. Int. J. Chem. Kinet. 1999, 31, 689–697. [Google Scholar]
- Guo, X.X.; Brimblecombe, P. Henry's law constants of phenol and mononitrophenols in water and aqueous sulfuric acid. Chemosphere 2007, 68, 436–444. [Google Scholar]
- Yaws, C.L.; Yang, H.-C. Henry's Law Constant for Compound in Water. In Thermodynamic and Physical Property Data; Yaws, C.L., Ed.; Gulf Publishing Company: Houston, TX, USA, 1992; pp. 181–206. [Google Scholar]
- Khan, I.; Brimblecombe, P.; Clegg, S.L. Solubilities of pyruvic acid and the lower (C1–C6) carboxylic acids. Experimental determination of equilibrium vapour pressures above pure aqueous and salt solutions. J. Atmos. Chem. 1995, 22, 285–302. [Google Scholar]
- Snider, J.R.; Dawson, G.A. Tropospheric light alcohols, carbonyls, and acetonitrile: Concentrations in the southwestern United States and Henry's law data. J. Geophys. Res. 1985, 90, 3797–3805. [Google Scholar]
- Bone, R.; Cullis, P.; Wolfenden, R. Solvent effects on equilibria of addition of nucleophiles to acetaldehyde and the hydrophilic character of diols. J. Am. Chem. Soc. 1983, 105, 1339–1343. [Google Scholar]
- Deguillaume, L.; Tilgner, A.; Schrödner, R.; Wolke, R.; Chaumerliac, N.; Herrmann, H. Towards an operational aqueous phase chemistry mechanism for regional chemistry-transport models: CAPRAM-RED and its application to the COSMO-MUSCAT model. J. Atmos. Chem. 2009, 64, 1–35. [Google Scholar]
- Dutot, A.-L.; Rude, J.; Aumont, B. Neural network method to estimate the aqueous rate constants for the OH reactions with organic compounds. Atmos. Environ. 2003, 37, 269–276. [Google Scholar]
- Buxton, G.V.; Greenstock, C.L.; Helman, W.P.; Ross, A.B. Critical review of rate constants for reactions of hydrated electrons, hydrogen atom and hydroxyl radicals (OH/O-) in aqueous solution. J. Phys. Chem. Ref. Data 1988, 17, 513–883. [Google Scholar]
- Monod, A.; Poulain, L.; Grubert, S.; Voisin, D.; Wortham, H. Kinetics of OH-initiated oxidation of oxygenated organic compounds in the aqueous phase: New rate constants, structure-activity relationships and atmospheric implications. Atmos. Environ. 2005, 39, 7667–7688. [Google Scholar]
- Monod, A.; Doussin, J.F. Structure-activity relationship for the estimation of OH-oxidation rate constants of aliphatic organic compounds in the aqueous phase: Alkanes, alcohols, organic acids and bases. Atmos. Environ. 2008, 42, 7611–7622. [Google Scholar]
- Atkinson, R. Gas-phase tropospheric chemistry of organic compounds: A review. Atmos. Environ. 1990, 24, 1–41. [Google Scholar]
- Herrmann, H. Kinetics of aqueous phase reactions relevant for atmospheric chemistry. Chem. Rev. 2003, 103, 4691–4716. [Google Scholar]
- Herrmann, H.; Hoffmann, D.; Schaefer, T.; Bräuer, P.; Tilgner, A. Tropospheric aqueous-phase free-radical chemistry: Radical sources, spectra, reaction kinetics and prediction tools. ChemPhysChem 2010, 11, 3796–3822. [Google Scholar]
- Carlton, A.G.; Turpin, B.J.; Altieri, K.E.; Seitzinger, S.; Reff, A.; Lim, H.-J.; Ervens, B. Atmospheric oxalic acid and SOA production from glyoxal: Results of aqueous photooxidation experiments. Atmos. Environ. 2007, 41, 7588–7602. [Google Scholar]
- Tan, Y.; Carlton, A.G.; Seitzinger, S.P.; Turpin, B.J. SOA from methylglyoxal in clouds and wet aerosols: Measurement and prediction of key products. Atmos. Environ. 2010, 44, 5218–5226. [Google Scholar]
- Poulain, L.; Katrib, Y.; Isikli, E.; Liu, Y.; Wortham, H.; Mirabel, P.; Calvé, S.L.; Monod, A. In-cloud multiphase behaviour of acetone in the troposphere: Gas uptake, Henry's law equilibrium and aqueous phase photooxidation. Chemosphere 2010, 81, 312–320. [Google Scholar]
- Liu, Y.; El Haddad, I.; Scarfogliero, M.; Nieto-Gligorovski, L.; Temime-Roussel, B.; Quivet, E.; Marchand, N.; Picquet-Varrault, B.; Monod, A. In-cloud processes of methacrolein under simulated conditions—Part 1: Aqueous phase photooxidation. Atmos. Chem. Phys. 2009, 9, 5093–5105. [Google Scholar]
- Zhang, X.; Chen, Z.M.; Zhao, Y. Laboratory simulation for the aqueous OH-oxidation of methyl vinyl ketone and methacrolein: Significance to the in-cloud SOA production. Atmos. Chem. Phys. 2010, 10, 9551–9561. [Google Scholar]
- El Haddad, I.; Liu, Y.; Nieto-Gligorovski, L.; Michaud, V.; Temime-Roussel, B.; Quivet, E.; Marchand, N.; Sellegri, K.; Monod, A. In-cloud processes of methacrolein under simulated conditions—Part 2: Formation of secondary organic aerosol. Atmos. Chem. Phys. 2009, 9, 5107–5117. [Google Scholar]
- Kroll, J.H.; Ng, N.L.; Murphy, S.M.; Flagan, R.C.; Seinfeld, J.H. Secondary organic aerosol formation from isoprene photooxidation. Environ. Sci. Technol. 2006, 40, 1869–1877. [Google Scholar]
- Brüggemann, E.; Gnauk, T.; Mertes, S.; Acker, K.; Auel, R.; Wieprecht, W.; Möller, D.; Collett, J.L., Jr.; Chang, H.; Galgon, D.; et al. Schmücke hill cap cloud and valley stations aerosol characterisation during FEBUKO (I): Particle size distribution, mass, and main components. Atmos. Environ. 2005, 39, 4291–4303. [Google Scholar]
- Perri, M.J.; Seitzinger, S.; Turpin, B.J. Secondary organic aerosol production from aqueous photooxidation of glycolaldehyde: Laboratory experiments. Atmos. Environ. 2009, 43, 1487–1497. [Google Scholar]
- Bertschi, I.; Yokelson, R.J.; Ward, D.E.; Babbitt, R.E.; Susott, R.A.; Goode, J.G.; Hao, W.M. Trace gas and particle emissions from fires in large diameter and belowground biomass fuels. J. Geophys. Res. 2003, 108. [Google Scholar] [CrossRef]
- Sun, Y.L.; Zhang, Q.; Anastasio, C.; Sun, J. Insights into secondary organic aerosol formed via aqueous-phase reactions of phenolic compounds based on high resolution mass spectrometry. Atmos. Chem. Phys. 2010, 10, 4809–4822. [Google Scholar]
- Ervens, B.; Turpin, B.J.; Weber, R.J. Secondary organic aerosol formation in cloud droplets and aqueous particles (aqSOA): A review of laboratory, field and model studies. Atmos. Chem. Phys. Discuss. 2011, 11, 22301–22383. [Google Scholar]
- Herrmann, H.; Tilgner, A.; Barzaghi, P.; Majdik, Z.; Gligorovski, S.; Poulain, L.; Monod, A. Towards a more detailed description of tropospheric aqueous phase organic chemistry: CAPRAM 3.0. Atmos. Environ. 2005, 39, 4351–4363. [Google Scholar]
- Myriokefalitakis, S.; Tsigaridis, K.; Mihalopoulos, N.; Sciare, J.; Nenes, A.; Kawamura, K.; Segers, A.; Kanakidou, M. In-cloud oxalate formation in the global troposphere: A 3-D modeling study. Atmos. Chem. Phys. 2011, 11, 5761–5782. [Google Scholar]
- Ervens, B.; Volkamer, R. Glyoxal processing by aerosol multiphase chemistry: Towards a kinetic modeling framework of secondary organic aerosol formation in aqueous particles. Atmos. Chem. Phys. 2010, 10, 8219–8244. [Google Scholar]
- Nozière, B.; Dziedzic, P.; Córdova, A. Products and kinetics of the liquid-phase reaction of glyoxal catalyzed by ammonium ions (NH4+). J. Phys. Chem. A 2009, 113, 231–237. [Google Scholar]
- Stockwell, W.R.; Lurmann, F.W. Intercomparison of the ADOM and RADM Gas-phase Chemistry Mechanisms; Electric Power Research Institute: Palo Alto, CA, USA; June; 1989; p. 260. [Google Scholar]
- Stroud, C.A.; Morneau, G.; Makar, P.A.; Moran, M.D.; Gong, W.; Pabla, B.; Zhang, J.; Bouchet, V.S.; Fox, D.; Venkatesh, S.; et al. OH-reactivity of volatile organic compounds at urban and rural sites across Canada: Evaluation of air quality model predictions using speciated VOC measurements. Atmos. Environ. 2008, 42, 7746–7756. [Google Scholar]
- Houyoux, M.R.; Vukovich, J.M.; Coats, C.J., Jr.; Wheeler, N.J.; Kasibhatla, P.S. Emission inventory development and processing for the Seasonal Model for Regional Air Quality (SMRAQ) project. J. Geophys. Res. 2000, 105, 9079–9090. [Google Scholar]
- Hennigan, C.J.; Bergin, M.H.; Dibb, J.E.; Weber, R.J. Enhanced secondary organic aerosol formation due to water uptake by fine particles. Geophys. Res. Lett. 2008, 35. [Google Scholar] [CrossRef]
- Volkamer, R.; Ziemann, P.J.; Molina, M.J. Secondary Organic Aerosol Formation from Acetylene (C2H2): Seed effect on SOA yields due to organic photochemistry in the aerosol aqueous phase. Atmos. Chem. Phys. 2009, 9, 1907–1928. [Google Scholar]
- Guzmán, M.I.; Colussi, A.J.; Hoffmann, M.R. Photoinduced oligomerization of aqueous pyruvic acid. J. Phys. Chem. A 2006, 110, 3619–3626. [Google Scholar]
- Kroll, J.H.; Ng, N.L.; Murphy, S.M.; Varutbangkul, V.; Flagan, R.C.; Seinfeld, J.H. Chamber studies of secondary organic aerosol growth by reactive uptake of simple carbonyl compounds. J. Geophys. Res. 2005, 110. [Google Scholar] [CrossRef]
- Loeffler, K.W.; Koehler, C.A.; Paul, N.M.; de Haan, D.O. Oligomer formation in evaporating aqueous glyoxal and methyl glyoxal solutions. Environ. Sci. Technol. 2006, 40, 6318–6323. [Google Scholar]
- Nozière, B.; Córdova, A. A kinetic and mechanistic study of the amino acid catalyzed aldol condensation of acetaldehyde in aqueous and salt solutions. J. Phys. Chem. A 2008, 112, 2827–2837. [Google Scholar]
- De Haan, D.O.; Hawkins, L.N.; Kononenko, J.A.; Turley, J.J.; Corrigan, A.L.; Tolbert, M.A.; Jimenez, J.L. Formation of nitrogen-containing oligomers by methylglyoxal and amines in simulated evaporating cloud droplets. Environ. Sci. Technol. 2011, 45, 984–991. [Google Scholar]
- Galloway, M.M.; Chhabra, P.S.; Chan, A.W.H.; Surratt, J.D.; Flagan, R.C.; Seinfeld, J.H.; Keutsch, F.N. Glyoxal uptake on ammonium sulphate seed aerosol: Reaction products and reversibility of uptake under dark and irradiated conditions. Atmos. Chem. Phys. 2009, 9, 3331–3345. [Google Scholar]
- Nozière, B.; Ekström, S.; Alsberg, T.; Holmström, S. Radical-initiated formation of organosulfates and surfactants in atmospheric aerosols. Geophys. Res. Lett. 2010, 37. [Google Scholar] [CrossRef]
- De Haan, D.O.; Corrigan, A.L.; Smith, K.W.; Stroik, D.R.; Turley, J.J.; Lee, F.E.; Tolbert, M.A.; Jimenez, J.L.; Cordova, K.E.; Ferrell, G.R. Secondary organic aerosol-forming reactions of glyoxal with amino acids. Environ. Sci. Technol. 2009, 43, 2818–2824. [Google Scholar]
- Perri, M.J.; Lim, Y.B.; Seitzinger, S.P.; Turpin, B.J. Organosulfates from glycolaldehyde in aqueous aerosols and clouds: Laboratory studies. Atmos. Environ. 2010, 44, 2658–2664. [Google Scholar]
- Hastings, W.P.; Koehler, C.A.; Bailey, E.L.; de Haan, D.O. Secondary organic aerosol formation by glyoxal hydration and oligomer formation: Humidity effects and equilibrium shifts during analysis. Environ. Sci. Technol. 2005, 39, 8728–8735. [Google Scholar]
- Schwier, A.N.; Sareen, N.; Mitroo, D.; Shapiro, E.L.; McNeill, V.F. Glyoxal-methylglyoxal cross-reactions in secondary organic aerosol formation. Environ. Sci. Technol. 2010, 44, 6174–6182. [Google Scholar]
- Tervahattu, H.; Juhanoja, J.; Vaida, V.; Tuck, A.F.; Niemi, J.V.; Kupiainen, K.; Kulmala, M.; Vehkamäki, H. Fatty acids on continental sulfate aerosol particles. J. Geophys. Res. 2005, 110. [Google Scholar] [CrossRef]
- Donaldson, D.J.; Vaida, V. The influence of organic films at the air-aqueous boundary on atmospheric processes. Chem. Rev. 2006, 106, 1445–1461. [Google Scholar]
- Slinn, W.G.N. Precipitation Scavenging. In Atmospheric Science and Power Production; Randerson, D., Ed.; Document DOE/TIC-27601; US Department of Energy: Washington, DC, USA, 1984; pp. 466–532. [Google Scholar]
- Slinn, W.G.N. Some approximations for the wet and dry removal of particles and gases from the atmosphere. Water Air Soil Pollut. 1977, 7, 513–543. [Google Scholar]
- Karamchandani, P.; Lurmann, F.; Venkatram, A. ADOM/TADAP Model Development Program, Volume 8: Central Operator; Document No. P-B866-450; ENSR Consulting and Engineering: Camarillo, CA, USA, 1985. [Google Scholar]
- Baker, K.; Scheff, P. Photochemical model performance for PM2.5 sulfate, nitrate, ammonium, and precursor species SO2, HNO3, and NH3 at background monitor locations in the central and eastern United States. Atmos. Environ. 2007, 41, 6185–6195. [Google Scholar]
- Jacobson, M.Z. Fundamentals of Atmospheric Modeling; Cambridge University Press: New York, NY, USA, 1999. [Google Scholar]
- Berkowitz, C.M.; Easter, R.C.; Scott, B.C. Theory and results from a quasi-steady-state precipitation scavenging model. Atmos. Environ. 1989, 23, 1555–1571. [Google Scholar]
- Levine, S.Z.; Schwartz, S.E. In-cloud and below-cloud scavengingof nitric acid vapor. Atmos. Environ. 1982, 16, 1725–1234. [Google Scholar]
- Mircea, M.; Stefan, S. A theoretical study of the microphysical parameterization of the scavenging coefficient as a function of precipitation type and rate. Atmos. Environ. 1998, 32, 2931–2938. [Google Scholar]
- Wang, X.; Zhang, L.; Moran, M.D. Uncertainty assessment of current size-resolved parameterizations for below-cloud particle scavenging by rain. Atmos. Chem. Phys. 2010, 10, 5685–5705. [Google Scholar]
- Wang, X.; Zhang, L.; Moran, M.D. On the discrepancies between theoretical and measured below-cloud particle scavenging coefficients for rain—A numerical study. Atmos. Chem. Phys. Discuss. 2011, 11, 20375–20387. [Google Scholar]
- Mitra, S.K.; Barth, U.; Pruppacher, H.R. A laboratory study of the efficiency with which aerosol particles are scavenged by snow flakes. Atmos. Environ. 1990, 24, 1247–1254. [Google Scholar]
- Miller, N.L.; Wang, P.K. A theoretical determination of the collection rates of aerosol particles by falling ice crystal plates and columns. Atmos. Environ. 1991, 25, 2593–2606. [Google Scholar]
- Feng, J. A size-resolved model for below-cloud scavenging of aerosols by snowfall. J. Geophys. Res. 2009, 114. [Google Scholar] [CrossRef]
- Andronache, C.; Grönholm, T.; Laakso, L.; Phillips, V.; Venalainen, A. Scavenging of ultrafine particles by rainfall at a boreal sites: Observations and model estimations. Atmos. Chem. Phys. 2006, 6, 4739–4754. [Google Scholar]
- Mircea, M.; Stefan, S.; Fuzzi, S. Precipitation scavenging coefficient: Influence of measured aerosol and raindrop size distributions. Atmos. Environ. 2000, 34, 5169–5174. [Google Scholar]
- Zhang, L.; Vet, R.; Michelangeli, D.V. Numerical investigation of gas scavenging by weak precipitation. J. Atmos. Chem. 2006, 54, 203–231. [Google Scholar]
- Herrmann, H.; Ervens, B.; Jacobi, H.W.; Wolke, R.; Nowacki, P.; Zellner, R. CAPRAM2.3: A chemical aqueous phase radical mechanism for tropospheric chemistry. J. Atmos. Chem. 2000, 36, 231–284. [Google Scholar]
- Chaumerliac, N.; Leriche, M.; Audiffren, N. Modeling of scavenging processes in clouds: Some remaining questions about the partitioning of gases among gas and liquid phases. Atmos. Res. 2000, 53, 29–43. [Google Scholar]
© 2011 by the authors; licensee MDPI, Basel, Switzerland. This article is an open access article distributed under the terms and conditions of the Creative Commons Attribution license (http://creativecommons.org/licenses/by/3.0/).
Share and Cite
Gong, W.; Stroud, C.; Zhang, L. Cloud Processing of Gases and Aerosols in Air Quality Modeling. Atmosphere 2011, 2, 567-616. https://doi.org/10.3390/atmos2040567
Gong W, Stroud C, Zhang L. Cloud Processing of Gases and Aerosols in Air Quality Modeling. Atmosphere. 2011; 2(4):567-616. https://doi.org/10.3390/atmos2040567
Chicago/Turabian StyleGong, Wanmin, Craig Stroud, and Leiming Zhang. 2011. "Cloud Processing of Gases and Aerosols in Air Quality Modeling" Atmosphere 2, no. 4: 567-616. https://doi.org/10.3390/atmos2040567