1. Introduction
Biomass burning is the principal source of anthropogenic greenhouse gases and aerosols to the atmosphere in South America [
1,
2,
3,
4]. In Brazil, activities related to agriculture and extensive livestock grazing contribute significantly to trace gas and particle emissions to the atmosphere, resulting from the use of fire as a land management practice and changes in natural emissions patterns due to changes in land use and land cover. Manual harvesting of sugarcane is an example of a current agricultural practice that uses fire. The burning practice for sugarcane residues varies worldwide. In many countries, such as Brazil, Guatemala, Mexico, and Costa Rica, pre-harvest burning is a common practice. In the United States and the Philippines, sugarcane fields are burned either before or after harvest, but in India, most of the sugarcane residues are usually burned in the field only after harvest due to lack of proper composting techniques [
5,
6,
7,
8,
9]. The problems related to the pre-harvest burning practice are particularly serious in Brazil as it is the world’s largest producer of sugarcane. This type of burning has been a practice there for hundreds of years to make the manual harvest easier, but has only recently been recognized as an environmental damage and a public health issue.
Sugarcane is an important crop for the Brazilian economy and roughly 50% of its production is used to produce ethanol [
10]. In this country, sugarcane production is located in some states of the South-Central and Northeast regions [
11]. The South-Central region comprises the producer states of São Paulo, Goiás, Minas Gerais, Mato Grosso, Mato Grosso do Sul, and Paraná, as well as Rio de Janeiro and Espírito Santo, and is currently responsible for 88% of the sugarcane production. São Paulo state is the largest producer of sugarcane in Brazil and is responsible for almost 60% of its production, with a cultivated area of 5.4 Mha in 2011 [
12]. Sugarcane stalks are the raw material for producing sugar or ethanol. The harvest of the stalks can be performed with either green harvest or pre-harvest burning. When stalks are green harvested, the machine cuts the entire aboveground plant and stalks are automatically separated from leaves. When stalks are manually harvested, the leaves need to first be eliminated by burning to make the harvest easier. During the last five years, close to 2 Mha were harvested annually with the pre-harvest burning practice. This practice emits particulate material, greenhouse gases, and tropospheric ozone precursors to the atmosphere, and these pollutants can be transported by moving air masses and affect more remote areas [
3,
13,
14,
15,
16].
In São Paulo State, a “Green Ethanol” Protocol is underway since 2007 to eliminate the pre-harvest burning practice by 2014 in most of the land cultivated with sugarcane. In this state, mechanical harvest (green harvest) has significantly increased and, in spite of the rapid sugarcane expansion observed over the last five years, the pre-harvested burned area has not increased and should even be eliminated by 2016 [
17]. Efforts to reduce the burning practice have also been recently adopted by other states in the South-Central region of Brazil, such as Rio de Janeiro and Minas Gerais.
However, even with policies to eliminate the burning practice in the near future, there is still significant environmental damage due to the pre-harvest sugarcane burning practice. In addition, this practice can damage the health of the resident population in the vicinity, making them more susceptible to diseases, above all respiratory ones [
18,
19]. A larger number of people can be subject to its effects in the event that the dominant winds are directed towards more densely populated areas [
20] since many urban areas are typically located next to sugarcane cultivated areas as well as ethanol and bioelectricity plants.
Therefore, although sugarcane cultivation has assumed great importance for the national economy, especially because of the growing demand for ethanol production in the current decade, it presents a high potential for environmental impact. It is likely that São Paulo State will no longer experience major sugarcane expansion in the near future due to a reduced amount of available land; however, expansion of sugarcane cultivation may be observed in the next decade in the other states of the South-Central region of Brazil. The new investments in sugarcane cultivation for ethanol production should take mechanical harvest into account. However, the pre-harvest burning practice is likely to remain an important issue until effective measures are taken to eliminate this practice. Thus, it is necessary to improve scientific knowledge regarding the impacts of the growth of sugarcane ethanol production in Brazil and generate inventories of greenhouse gas and aerosol emissions associated with this activity. Biomass burning emissions inventories can be derived from the quantity of burned biomass and an emission factor. An estimate of the quantity of burned biomass can be obtained if the aboveground biomass density, combustion factor (fraction of biomass that was actually burned) and burned area are known [
4]. The emission factor (EF) represents the quantity of a compound emitted per quantity of dry fuel consumed (g kg
−1) [
21].
Since the trace gas and particulate matter emission factors depend on the types of biomass and combustion, it is important that specific emission factors are determined and used for each plant species. Andreae and Merlet [
21] presented a literature review of the available information about emissions from fires for various biomass types. This knowledge has been updated in more recent studies, such as Christian
et al. [
22] which is concerned with savanna fires, Yokelson
et al. [
23,
24] and Soares Neto
et al. [
25,
26] which assemble information about fire emissions in tropical vegetation associated with pasture maintenance and deforestation, based on laboratory experiments and field campaigns, and Akagi
et al. [
27] which present emission factors, among other information, for fourteen types of vegetation. Although some studies have treated different aspects of sugarcane straw burning [
28,
29,
30,
31,
32], specific information about emission factors for species emitted during pre-harvest burning is still scarce, especially specific to Brazil. It is common modeling practice to use the generic emission factors for savanna, pasture or agricultural wastes, such as those provided by Andreae and Merlet [
21] and IPCC [
33] for the estimation of emissions associated with sugarcane straw burning. Only a few studies about sugarcane emission factors estimation have been published, for example: Le Canut
et al. [
34] (flight measurements in Africa); Yokelson
et al. [
24] (lab measurements in the United States); and Lopes and Carvalho [
35] (lab measurements in Brazil). Some limitations of the available measurements are mentioned as follows. Flight measurements such as the Le Canut
et al. [
34] study in Africa tend to sample emissions that are associated with more intense and flaming combustion [
23,
24]. On the other hand, laboratory measurements could provide higher emission factors (EF) in relation to the previous method and be influenced by some factors as well as the types of instruments and calibrations. This fact could result in distinct values for the same EF. For this reason, it is necessary to compare different measurements, and only a few studies about sugarcane emission factors (EF) currently exist. Furthermore, there are few or no estimates of combustion factors for sugarcane pre-harvest burning available for comparison. Thus, modeling air quality in regions affected by sugarcane emissions is a challenge due to the lack of emission data.
In this context, the objective of this work is to determine emission factors for the trace gases CO
2, CO, NO
X, and UHC (unburned hydrocarbons) emitted during sugarcane straw burning, based on continuous measurements taken under controlled laboratory conditions, with the aim of contributing to the generation of inventories that include emissions of this nature. Similar measurements were also made in this study in order to estimate the emission factor for particulate matter with an aerodynamic diameter equal to or less than 2.5 μm (PM
2.5)—fine particulates—emitted by sugarcane straw burning, by virtue of its important role as a risk factor for respiratory diseases [
36]. This study also aims to improve knowledge about the combustion phases (flaming and smoldering) and their respective durations and emissions of chemical species, since this understanding is important for the improvement of emissions estimations made by means of numerical modeling and, consequently, the prediction of their environmental impacts [
4,
25].
2. Methodology
This work is comprised of two stages. In the first stage, conducted in November 2009, emission factors for the species CO2, CO, NOX, and UHC (unburned hydrocarbons) emitted by sugarcane straw burning were estimated from continuous measurements of the respective concentrations made in controlled laboratory conditions. In the second stage, conducted in December 2010, similar experiments were conducted for the sampling of particulate matter with diameters equal to or less than 2.5 μm (PM2.5)—fine particulates—and their emission factor was estimated.
In the first stage of this work, thirteen experiments were conducted. For these, nine sugarcane samples were obtained at the Sugarcane Technology Center (CTC), located in the municipality of Piracicaba, São Paulo, in the southeast region of Brazil. These samples, which included two sugarcane varieties, were collected during a dry weather episode and in different plots, so that the biomass was in an ideal condition for burning and a good representation of its diversity was reached. All the sugarcane cultivars used in this work corresponded to
Saccharum spp. This species is broadly cultivated in Brazil [
37].
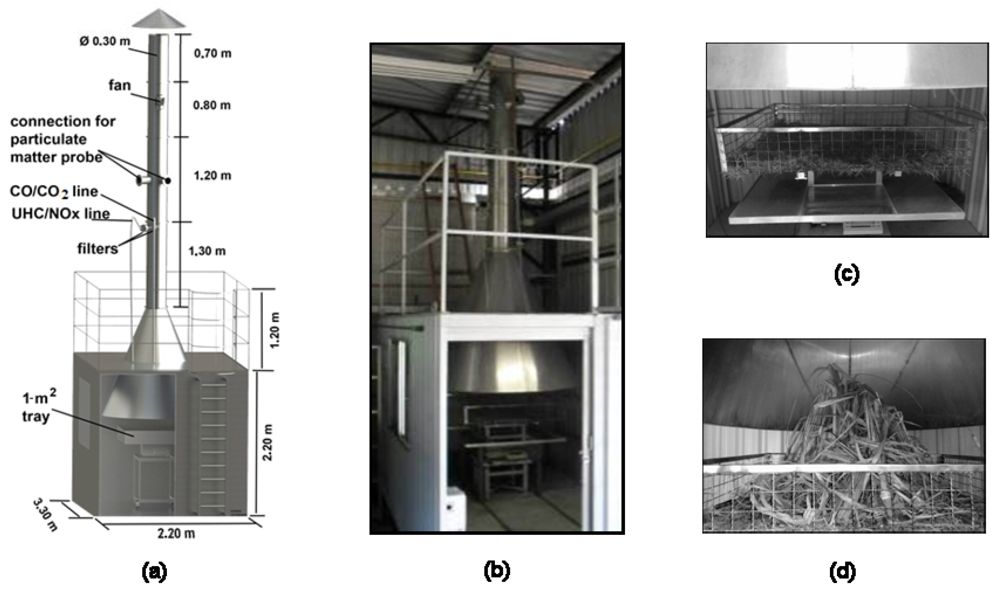
The experimental device in which the samples were burned was built in a container, as shown in
Figure 1. This device is the same as the burning apparatus employed by Soares Neto
et al. [
26]. Approximately 2.5 to 7.2 kg of biomass sample, loosely packed on a 1 m
2 burning table assembled in the center of the container, was used for the experiments. This device was placed on a balance that registered the mass loss, below an inverted funnel-like stainless steel hood, which had a 1.6 m diameter base placed 0.3 m above the table to capture all the effluent gases. The burning table was adjusted to a horizontal position and covered by a soil layer. Although the biomass samples representative of sugarcane burned in each experiment were principally constituted of straw, they also contained stems covered with straw, which were placed in a vertical position in the burning tray in an attempt to bring the experimental conditions closer to the real burning conditions in the field (
Figure 1).
Figure 1.
(
a) Illustrative drawing of the combustion chamber and (
b) interior of the combustion chamber, emphasizing the hood coupled to the chimney and the burning tray positioned on top of the balance [
26]; (
c) soil placed in the burning tray; (
d) biomass placed in the burning tray.
Figure 1.
(
a) Illustrative drawing of the combustion chamber and (
b) interior of the combustion chamber, emphasizing the hood coupled to the chimney and the burning tray positioned on top of the balance [
26]; (
c) soil placed in the burning tray; (
d) biomass placed in the burning tray.
Quantitative measurements of fuel moisture were available. For each experiment, representative samples were separated and put in a stove at 85 °C to dry until they reached constant weight. This procedure allowed us to obtain the fuel moisture by means of the following equation:
in which: W = sample water percentage; Ma = water mass; Ma = Pi – Pf; Pi = initial weight; Pf = final weight.
An axial fan was located in the stack and was controlled by a motor installed outside the stack, in order to force the exhaustion of trace gases, principally in the smoldering stage. A temperature sensor, a Pitot tube, absolute and differential pressure transducers, which were connected to the Pitot tube, and probes for trace gas sampling were also provided. The absolute pressure transducer determined the absolute pressure and the differential pressure transducer determined the dynamic pressure. These two measurements, as well as the temperature measurement, were transmitted to a mass flow controller that calculated the trace gas volume flow rate through the stack during the experiments. The flow rate was corrected to Standard Temperature and Pressure (STP). Two trace gas samples were collected simultaneously by two probes during the burning by a sampling tube where particulates (>1 nm) were retained on glass fiber filters, and water and tar were removed by traps. The first sample, for CO and CO2 concentration measurements, passed through a trap immersed in isopropyl alcohol, cooled to −35 °C, to remove water and tar. The second sample was used to determine NOX and UHC (unburned hydrocarbons) concentrations and passed through a trap with water at 3 °C for water removal. In this case, the tube was made of PFA (Per Fluor Alkoxy), while the CO and CO2 sample tube was stainless steel. Different sample treatments were necessary due to the working principle of each analyzer. After the treatment, samples passed through specific analyzers (Rosemount Analytical) in which CO2, CO, NOX, and UHC excess mixing ratios were determined: model 880 A (non dispersive infrared), range 0–5%, calibrated with a 4.6% standard to CO2; model 880 A (non dispersive infrared), range 0–10,000 ppm (1%), calibrated with a 9,000 ppm standard to CO; model 951A (chemiluminescent), range 0–250 ppm, calibrated with a 225 ppm standard to NO/NOX; and model 880 A (FID), range 0–1,000 ppm, calibrated with a 900 ppm methane standard to UHC. The term unburned hydrocarbons (UHC) is an operational definition of any species detected by the analyzer model 880 A (FID), which determines methane and other non-methane hydrocarbons such as ethene, ethyne, ethane, propene, propyne, propane, and butanes excess mixing ratios, because it does not provide separated measurements by species.
Concentrations of trace gases and the other process variables were transmitted to a data acquisition system that continuously recorded the measurements during the test with an interval of approximately 1 s. The data saved for each experiment were: time [s], mass [g], CO2, CO, UHC and NOX concentrations, gas temperature in the chimney [°C], and the volume flow rate of gas in the chimney [m3 h−1]. Each experiment lasted 2 to 7 min from ignition until the end of smoldering phase, depending on the moisture content of the sample. The ignition was carried out with an LPG (liquefied petroleum gas) blowpipe. The ignition period was not taken into account to avoid blowpipe influence on the CO2 concentration.
The emission factor (EFx) for these chemical species, in g kg−1 (grams of species X per kg of burned dried biomass), was calculated according to Equation (2), where: VTotal chimney = total volume of gas flow through the chimney during the experiment (m3); [X] = species X average concentration (molar fraction); MX = species X molecular weight (g mol−1); m(fuel(dry basis)) = amount of dry fuel consumed (kg); and VX = molar volume of gas at Standard Temperature and Pressure (m3) (STP) (=0.0224 m3).
In the second stage of this work, particulate matter with diameters equal to or less than 2.5 μm (PM2.5) was sampled by means of the particulate matter monitor denominated DataRAM 4 (DR-4000 model). This equipment was installed above the ceiling of the container, so that a probe could be attached to the chimney and collect samples of the smoke emitted during burning for the measurement of concentration (μg/m3) and particulate matter diameter (μm), as well as the air temperature and relative humidity.
With the aim of collecting mass concentration measurements, the DataRAM 4 PM monitor is factory calibrated against a gravimetric standard traceable to the National Institute of Standards and Testing (NIST) with a SAE Particles Fine Test (ISO Fine) carried out with the following physical characteristics: mass median aerodynamic particle diameter from 2 to 3 μm; geometric standard deviation of lognormal size distribution equivalent to 2.5; density from 2.60 to 2.65 g/cm
3; and refractive index corresponding to 1.54. Moreover, the DataRAM 4 is capable of registering the average diameter and fine particles concentration in a continuous way (as much from dust as from smoke or fog, for example). This is made through aerodynamic size selection (PM
2.5, in this study) and two-wavelength nephelometry. This two-wavelength detection system measures the average volume of particles up to 0.05 μm within a range of 400 mg/m
3 of concentration [
38]. The flow heater was used to remove moisture from the sample, eliminating the effects of coagulation and condensation of water vapor on particles and, consequently, avoiding its influence on particle size. Furthermore, a diluter was used in this study. This sample dilution accessory improves the measurements because it can prevent some saturation, leaving more disperse particles and avoiding overestimated results.
The samples were obtained from around 3 min 10 s to 4 min 30 s. An estimate of the emission factor for PM2.5, in g kg−1 (grams of species X per kg of dry burned biomass), was calculated by means of Equation (3):
in which: [X] = total concentration of species X (mg/m3), based on measurements of every 10 s; VTotal = total volume of the gas sample which flowed through the chimney during the experiment (m3), based on measurements of every 10 s; m = mass of consumed fuel on a dry basis (kg).
3. Results
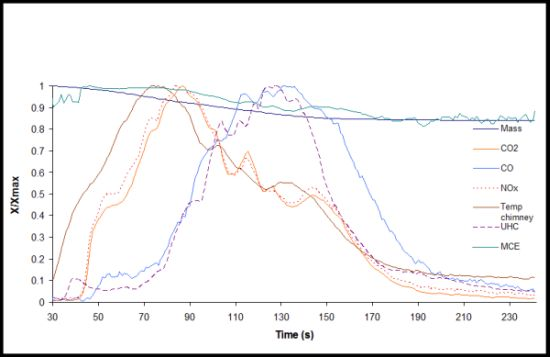
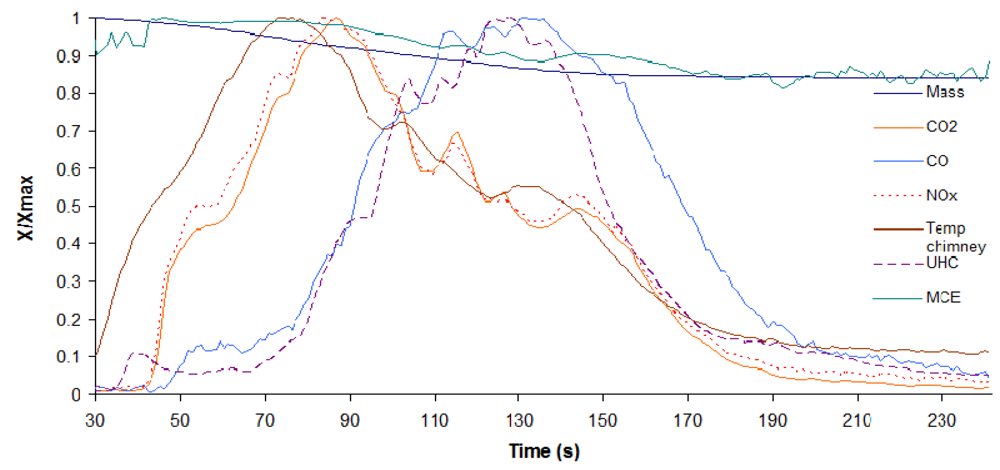
In each experiment, the phases of the combustion process were recorded. In general, the typical pattern of the combustion process was comprised of the flaming phase followed by the smoldering phase, and smoke was produced with the chemical composition inherent to each of them. In this pattern the emissions originated initially from the flaming phase, during which the largest biomass consumption occurred and a larger quantity of compounds such as CO
2 and NO
X were generated. On the other hand, the incompletely oxidized compounds, such as CO and UHC, were generated in greatest concentration in the smoldering phase, in accordance with the example shown in
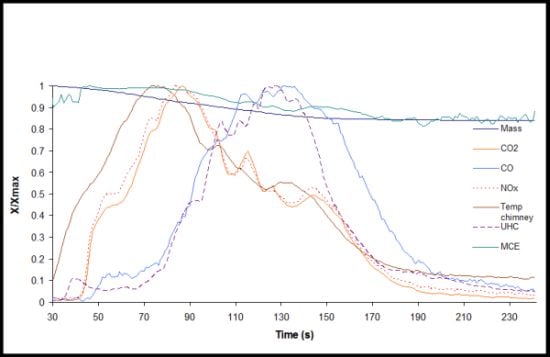
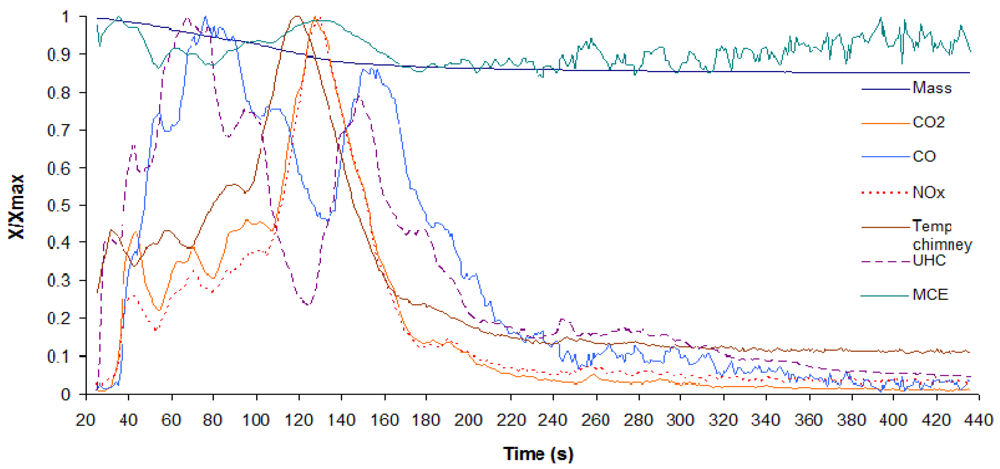
Figure 2. However, in some cases, an alteration in this pattern was observed due to the higher humidity content of the sample utilized in this experiment. In this case, the smoldering phase preceded the flaming phase, which had a shorter duration, and occurred again at the end of the combustion process, which generally had the longest duration of the entire combustion process, as exemplified in
Figure 3.
In the experiment presented in
Figure 2, which exemplified the typical pattern of the combustion process, the percentage of biomass consumed in the flaming stage corresponded to about 60% of the total. On the other hand, the experiment presented in
Figure 3, which showed the combustion process of the sample with the greatest registered humidity content, the percentage of biomass consumed in the flaming stage corresponded to about 22% of the total.
In the test shown in
Figure 2, with well separated combustion stages (flaming and smoldering), average estimated values of emission factors for the flaming stage were 1,011.8 and 14.8 for CO
2 and CO, respectively. On the other hand, average EF values for the smoldering combustion stage corresponded to 1,471.1 and 110.8 for CO
2 and CO, respectively. The increase in the CO EF in a higher proportion during the smoldering phase also occurred for the other tests.
Figure 3 shows a higher and regular modified combustion efficiency (MCE) flaming stage during the combustion process. Normalized mixing ratios were used because these allow comparing mixing ratios from CO
2, CO, NO
X, and UHC in the same plot, since their orders of magnitude are different. For example, in the test exposed in
Figure 3, the NO
X mixing ratio peak was approximately 38 ppm while the CO mixing ratio peak was about 1,700 ppm.
Figure 2.
Example of the typical pattern of the combustion process observed in one of the experiments conducted in the laboratory. Normalized data, as a function of time: gas emissions and their relation with the combustion phases.
Figure 2.
Example of the typical pattern of the combustion process observed in one of the experiments conducted in the laboratory. Normalized data, as a function of time: gas emissions and their relation with the combustion phases.
Figure 3.
Observed pattern of the combustion process of the sample with the greatest registered humidity content. Normalized data, as a function of time: gas emissions and their relation with the combustion phases.
Figure 3.
Observed pattern of the combustion process of the sample with the greatest registered humidity content. Normalized data, as a function of time: gas emissions and their relation with the combustion phases.
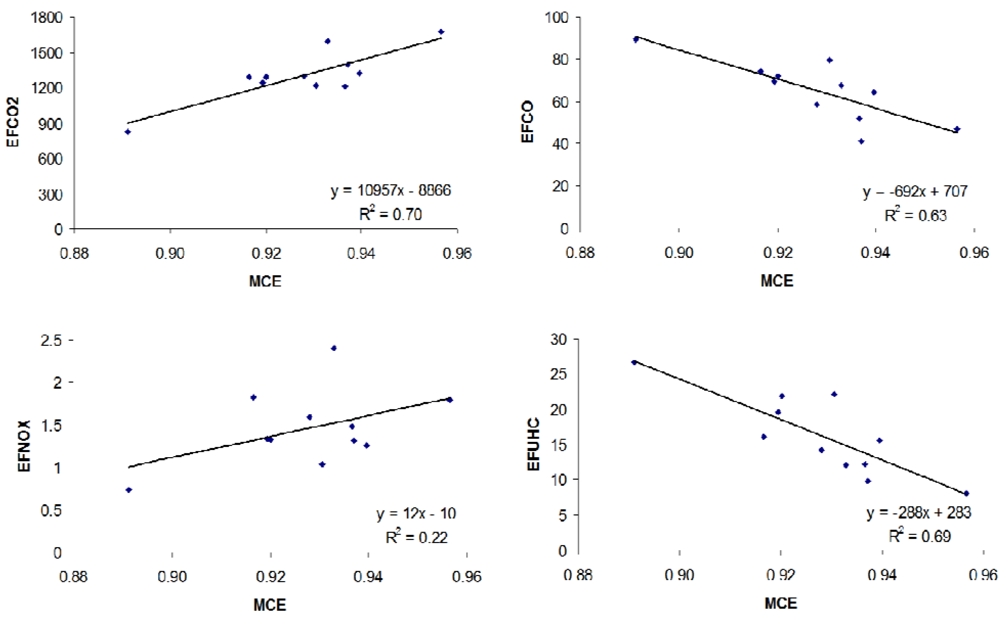
The MCE, which corresponds to the ratio between the carbon emitted as CO
2 and the carbon emitted as CO
2 + CO (MCE = ΔCO
2/ΔCO
2 + ΔCO), was also estimated for sugarcane straw burning. The average estimated MCE value (0.928) indicates the predominance of the flaming phase during the combustion process. In
Figure 4, the relations between the compound emission factors
versus their respective MCE are shown, which indicate the relative contribution of the flaming and smoldering phases of the combustion process. A typical pattern was observed, with a positive correlation for the compounds produced in the flaming phase of the combustion process (there was an increase in EF values for CO
2 and NO
X with increased MCE) and a negative correlation for those released in the smoldering phase (there was a decrease in EF values for CO and UHC with increased MCE).
Figure 4.
Graphical representation of the emission factors (EF) for CO2, CO, NOX, and UHC versus the modified combustion efficiency (MCE).
Figure 4.
Graphical representation of the emission factors (EF) for CO2, CO, NOX, and UHC versus the modified combustion efficiency (MCE).
The average values of the estimated emission factors (g kg
−1 of dry burned biomass) for CO
2, CO, NO
X, UHC, and PM
2.5 were 1,303 (±218), 65 (±14), 1.5 (±0.4), 16 (±6), and 2.6 (±1.6), respectively.
Table 1 presents a comparison of the results of this study with other data available in the literature. The information provided by Lopes and Carvalho [
35] and Yokelson
et al. [
24] was also obtained in laboratory experiments that involved measuring the emissions from burning sugarcane. On the other hand, data provided by Le Canut
et al. [
34] were recorded during a flight through smoke plumes over sugarcane fields.
As shown in
Table 1, the MCE value estimated in this study (0.928) is lower than the values of 0.976 and 0.965 obtained by Yokelson
et al. [
24] and Le Canut
et al. [
34], respectively, which could be related to the higher CO emission factor estimated here in relation to the other studies. As previously mentioned, the significant occurrence of the smoldering phase in some experiments, especially due to the higher humidity content of the utilized sample, could explain the lower value of MCE. This could also explain the more elevated estimated average EF value for CO, since generally fuel with a higher humidity decreases the combustion efficiency, reduces the flaming phase, and causes a smoldering phase before ignition. In addition, it results in an increase of the emission factors for species resulting from incomplete oxidation, such as CO [
39].
Table 1.
Emission factors (g kg−1 of dry burned biomass) and MCE.
Table 1.
Emission factors (g kg−1 of dry burned biomass) and MCE.
| Types of Biomass Burning | CO2 | CO | NOX | UHC | PM2.5 | MCE | Reference |
|---|
| Sugarcane | 1,303 ± 218 | 65 ± 14 | 1.5 ± 0.4 | 16 ± 6 | - | 0.928 | This work a,b |
| Sugarcane | - | - | - | - | 2.6 ± 1.6 | - | This work b,c |
| Sugarcane | 1,288 ± 167 | 28 ± 3 | - | - | - | - | Lopes and Carvalho [35] b |
| Sugarcane | 1,838 | 28.3 | - | - | 2.17 | 0.976 | Yokelson et al. [24] b |
| Sugarcane | - | - | - | - | 2.8 | 0.965 | Le Canut et al. [34] d |
| Agricultural Residues | 1,515 ± 177 | 92 ± 84 | 2.5 ± 1.0 | - | 3.9 | 0.943 e | Andreae and Merlet [21] |
| Agricultural Residues | 1,585 ± 100 | 102 ± 33 | 3.11 ± 1.57 | - | 6.26 ± 2.36 | 0.940 e | Akagi et al. [27] |
Yokelson
et al. [
24] explained that a high MCE was obtained from a laboratory fire that burned at a MCE that was higher than that normally obtained in the field for biomass burning and, in this way, the MCE of a typical sugarcane fire is likely lower and would imply a larger emission factor for PM
2.5. In that study, the plant material used in the fuel bed corresponded to leaves, twigs, and branches with a diameter of less than 30 mm and did not include the large diameter logs, which would contribute to the emissions measured in the field campaign. Perhaps the use of a burning table covered by a soil layer in our study, as well as biomass samples representative of sugarcane constituted of straw and stems covered with straw in each experiment, resulted in experimental conditions closer to the real burning conditions in the field.
Moreover, the fuel moistures in our study were higher than that found by Yokelson
et al. [
24], which corresponded to 8.58%. This could result in a lower combustion efficiency and, consequently, in different emission factors and MCE values compared to their study. On the other hand, the MCE observed by Le Canut
et al. [
34] may have been higher because aircraft measurements tend to sample emissions that are associated with more intense/flaming combustion [
24]. Some studies have shown that emission factors (EF) for ground-based measurements of smoldering compounds were higher than the EF measured for the same compounds from an aircraft above the same fires. This could be due to weakly lofted smoldering emissions collected by flight measurements, as occurred in the Babbitt
et al. [
40] study, for example [
23]. This fact could result in higher values for smoldering compounds from laboratory and field measurements. In this way, the chemistry composition of the smoke measured in the laboratory might be different from flight measurements.
All studies concerning to sugarcane showed in
Table 1 examined pre-harvest burning practices. Le Canut
et al. [
34] study examined pre-harvest burning practices [
41] and Yokelson
et al. [
24] and Lopes and Carvalho [
35] made reference to the sugarcane pre-harvest burning practice as a broadly used method to separate dried leaves and weeds from the sugarcane and to eliminate pests that could hinder manual harvesting.
From the consumed mass (dry base, in kg) in each experiment, the combustion factor (fraction of biomass that was actually burned) was also estimated for sugarcane. The estimated value was close to 0.09 for biomass samples comprised of straw and also containing stems covered with straw, in an attempt to bring the experimental conditions closer to the real burning conditions in the field, where the stalks are not affected by the burning, i.e., only dry leaves get burned during an intense but fast fire. It was well represented in the laboratory conditions.
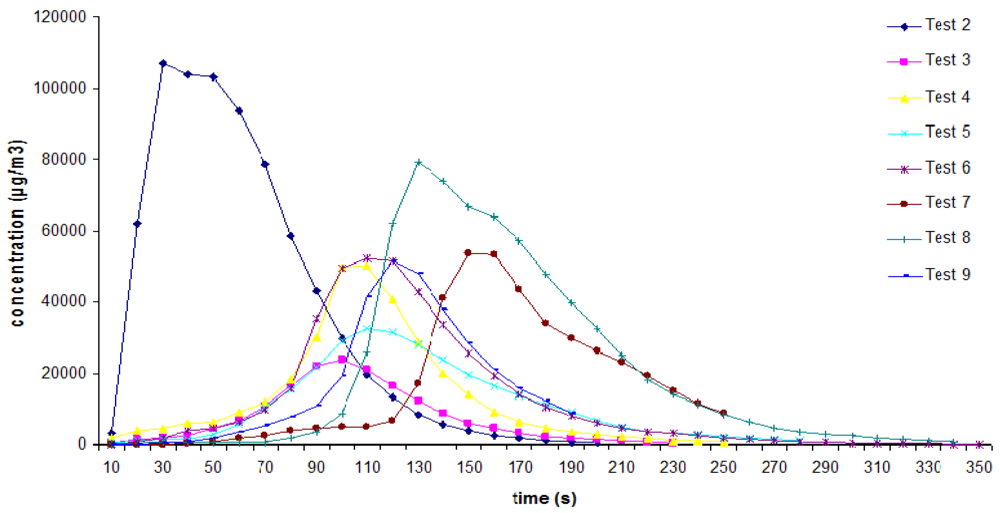
The particulate matter sampling showed that it was generated in both the flaming and smoldering phases of the combustion process. The variation in concentration (μg/m
3) and diameter (μm) of the PM
2.5 emitted during the burning of sugarcane straw, recorded in the experiments conducted in 2010, can be observed in
Figure 5 and
Figure 6.
Figure 5.
Variation in the average concentration (μg/m3) of PM2.5 emitted during the burning period in the experiments conducted in 2010.
Figure 5.
Variation in the average concentration (μg/m3) of PM2.5 emitted during the burning period in the experiments conducted in 2010.
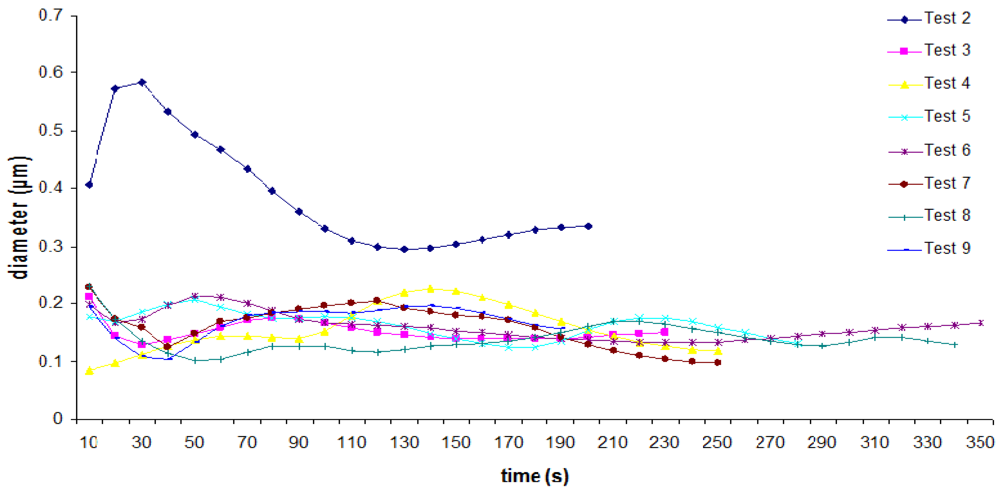
Figure 6.
Variation in the average diameter (μm) of the PM2.5 emitted during the burning period in the experiments conducted in 2010.
Figure 6.
Variation in the average diameter (μm) of the PM2.5 emitted during the burning period in the experiments conducted in 2010.
Figure 5 shows the average PM
2.5 concentration, whose highest level was approximately 110,000 μg/m
3 during one of the experiments conducted in 2010. There was a significant increase in the concentration of fine particulates, since background values of around 0.1 μg/m
3 to 2.4 μg/m
3 were recorded before the initiation of the burning. The delay in the increase of emitted particulate matter in Tests 7 and 8 is due to the higher humidity content of their respective samples, which caused a delay in the initiation of the flaming phase in both experiments. This is unlike what occurred with the dry fuels, which burn more easily, as observed in the shape of the curve for Test 2, whose sample contained the lowest humidity content of all the samples (about 17% while the other burn samples’ fuel moistures were higher than 26%, most of them ranged between 30% and 40%) according to
Table 2. Much higher concentrations of particles occurred during Test 2 because more fuel was being consumed in this particular burn during the early stages of the fire compared to all the other studies. The results of this experiment were also used to determine the emission factor for PM
2.5 and that was the reason for the rather large standard deviation observed in
Table 1.
Table 2.
Fuel moisture content.
Table 2.
Fuel moisture content.
| Samples | Fuel Moisture (%) |
|---|
| Test 2 | 16.60 |
| Test 3 | 33.84 |
| Test 4 | 37.04 |
| Test 5 | 34.59 |
| Test 6 | 37.37 |
| Test 7 | 49.37 |
| Test 8 | 43.32 |
| Test 9 | 26.23 |
Figure 6, on the other hand, shows the variation of the average diameter (μm) of the PM
2.5 emitted during the sugarcane straw burning in the experiments conducted in 2010. On average, diameters of 0.08 to 0.23 μm were recorded. A significant difference is noted in the values of the mean particulate matter diameter recorded during Test 2 compared to the other tests. The larger particle size, whose peak occurred in the flaming phase, must be related to the fact that the humidity content of the sample used in this test was much lower than the humidity content of the other samples.
The occurrence of the largest PM
2.5 average diameter and concentration in Test 2, especially in the flaming phase, could be related to the fact that in this test the burning was very intense, due to the low humidity content of the utilized sample. Although in many cases higher particulate concentrations and larger particles are associated with low combustion efficiency, in the occurrence of very intense fire, larger particles can be emitted in the flaming phase [
42,
43]. In this case, due to the higher temperature and combustion rates, a large oxygen loss occurs in the flaming phase due to fuel oxidation, resulting in the emission of more irregular and larger particles [
43].
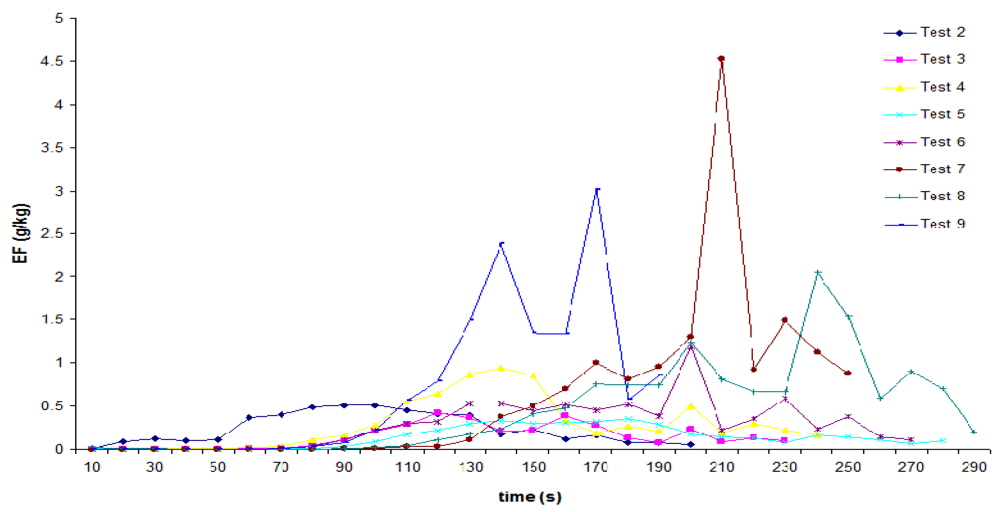
A significant difference is also noted in the values of the emission factors for PM
2.5 recorded during Test 2 compared to the other tests (
Figure 7). For all tests, except Test 2, the EF values increased from the start of smoldering stage. However, significant correlations between emission factors for either PM
2.5 or gases and fuel moisture were not observed, despite an influence of fuel moisture on the combustion process behavior has occurred, determining the duration and intensity of the flaming and smoldering phases. Probably, the range of variability of fuel moisture was not broad enough to allow any signal in these correlations, mainly because all samples were collected when the sugarcane was ready to be burned.
Figure 7.
Real-time emission factors for PM2.5.
Figure 7.
Real-time emission factors for PM2.5.


