Article

Spatio-Temporal Variability of Western Central African Convection from Infrared Observations

by
Derbetini A. Vondou
Laboratory of Environmental Modeling and Atmospheric Physics, Department of Physics, Faculty of Science, University of Yaounde 1, Yaounde, 812 Yaounde, Cameroon
Atmosphere 2012, 3(3), 377-399; https://doi.org/10.3390/atmos3030377
Submission received: 17 June 2012 / Revised: 16 July 2012 / Accepted: 1 August 2012 / Published: 8 August 2012

Abstract

:
The present study has used Meteosat infrared brightness temperature images to investigate the regional and interannual variability of Central African cloudiness. Spatial and temporal variability were investigated using half–hourly data from the Meteosat-7 during June–July–August (JJA) of 1998–2002. The full domain of study (1.5°E–17°E, 1°N–15°N) was divided into six regions and statistics in each region were derived. Analysis of the dependence of cloud fraction to the brightness temperature threshold is explored both over land and ocean. Three diurnal cycle regimes (continental, oceanic, and coastal) are depicted according to the amplitude and peak time. Over regions of relatively flat terrain, results indicate enhancement of deep convection in the afternoon followed by a gradual decrease in the night. The diurnal cycle of convection is characterised by afternoon and early evening (around 15:00–18:00 LST) maxima located mainly downwind of the major mountain chains, and a more rapid nighttime decay. In terms of the harmonic amplitude, the diurnal signal shows significant regional contrast with the strongest manifestation over the Adamaoua Plateau and the weakest near the South Cameroon Plateau. This remarkable spatial dependence is clear evidence of orographic and heterogeneous land-surface impacts on convective development. Oceanic region exhibits weak activity of convective cloudiness with a maximum at noon. It is suggested that daytime heating of the land surface and moist environment may play a role in determining the spatial distribution of cloud fraction. This study further demonstrates the importance of the Cameroon coastline concavity and coastal mountains in regulating regional frequencies of convection and their initialization. The strength of the diurnal cycle of convective activity depends on mountain height, mean flow, coastal geometry.

1. Introduction

It has long been realized that deep convection plays a key role in affecting the heat budget and moisture distribution of the tropics. A characteristic feature of the atmospheric circulation in the tropics is the formation of large-scale convergence zones associated with a strong convective activity. Intertropical convergence zones (ITCZ), which form a zonal belt a few degrees to the north and south of the equator, are the best examples of atmospheric convergence that drives the tropospheric circulation. The position of these zones changes seasonally. In the case of the West African ITCZ, a south–north and back migration between June and September modulated monsoon rainfall in the region [1]. The associated cloud processes play an essential role in energy exchanges that influence the physical and chemical processes occurring in the atmosphere [2]. Convection embedded in the ITCZ presents a large spectrum of space and time scales.
The diurnal cycle of convection and cloud cover is a significant mode of the climate system variability, linked to the daily cycle of solar heating. The representation of the diurnal cycle of convection by models need an accurate behaviour of different parameterizations such as convection and cloud parameterization [3,4,5]. Prediction of weather has a direct impact on society, particularly in Africa where agriculture, water resources, and health (e.g., prevalence of malaria, meningetis) depend highly on rainfall, particularly in Sahel where during dry season there is scarce water resources and humans compete with livestock for water. The realistic representation of convection is very interesting for flood assessment. It is important that model captures the diurnal cycle of convection, which affects rainfall through evapotranspiration and the simulation of surface temperature.
Our understanding of the diurnal cycle of convective activities is currently limited by the capacity to observe or to simulate it in numerical climate models and in numerical weather prediction models [6]. The regional variability of convection, if correctly represented, can improve the forecasting of African monsoon circulation through meteorological numerical models. Focus on the analysis on convective and deep convective activities is more interesting in view of a better modeling of such events potentially dangerous for agriculture, health and flash floods. Past studies have clearly indicated a land–sea contrast in the diurnal cycle of tropical convection, with high amplitudes over land and relatively weak amplitudes over oceans [7]. Dissimilarities also appear in their phases, the cycle reaching its maximum earlier over land masses than over the ocean [8]. The diurnal cycle of convection also exhibits a wide range of regional behaviours as a consequence of differences in local surface characteristics and conditions. Thermal conditions on ocean surface, land–sea breeze circulation, mountain valley wind and coastal curvatures are additional factors modulating it [9].
Since infrared radiometers are sensitive to cloud cover specially to cold top of deep convective clouds, they are well adapted to study diurnal cycles of convection. Instrument carrying satellites provide global observations with the high spatial and temporal resolutions needed for the improved characterization of convective cells and their development. Many past investigations of convective activities used the International Satellite Cloud Climatology Project (ISCCP) reduced radiance datasets with spatial resolution ranging from 30 km to 280 km and repeat times of 3 hours. Both daily and seasonal cycles of the frequency of cold top clouds for various brightness temperature thresholds were analysed [7,10,11,12], using ISCCP images rescaled to 2.5° × 2.5° boxes which undermine local details.
Because convection has a large spatial variance, quite dissimilar values may coexist within a grid point, making the average an unrepresentative statistic. Consequently, these crude datasets are not representative of the Africa, in particular over the Western part of the Central Africa. Over Tropical Africa, deep convective clouds have a spatial and temporal scales ranging from the individual cumulus to the mesoscale [1,10,13,14]. Although the largest and most easily recognizable clouds on satellite images are the Mesoscale Convective Systems (MCS), which are responsible for most tropical precipitation, significant rainfall occurs from systems not having MCS size or intensity [12]. Therefore studies of smaller scale cloud structures are also important [15]. Given the existing tendency for drought and desertification in vulnerable regions such as the Central Africa, the study of features governing convection is essential in order to have a better understanding of the rainfall variability.
Past studies have considerably improved our understanding of the convective activities over tropical areas [3,9,16,17], but few of them have dealt with the diurnal cycle of convection and its variability over the Central Africa region. In comparison to other regions, the local space-time patterns of the convection are less documented in the Central African. Fortunately, the studies described above have provided a wealth of information, which aids our effort to give a detailed picture of diurnally varying phenomena over Central Africa. A detailed study is needed to better understand the spatial, annual and interannual variations of the diurnal cycle of cloudiness in view of the complex topography and coastline configuration and the diverse climatic zones ranging from wet equatorial to dry Sudano–Sahelian found there. This insight will lead to better understanding of the physical processes and mechanisms that determine the precipitation of the region. By finding these features for each regions, it is expected to be able to calculate statistically how much rain is due to different types of convection. The variation of these statistics can be examined in relation to topographic, latitude and synoptic factors. The present work will analyse different cloud types extracted from infrared radiances measured by the instruments on board Meteosat satellite. The objective of this paper is to quantify and refine the hypotheses regarding the roles that the terrain and the land cover play in modulating the convection in the Central Africa region. To determine physically how the topography and land surface conditions together affect the moist flow and control the formation of convection, regional study is conducted hoping that a comprehensive analysis of a type will promote a better understanding of precipitation patterns.
The physical background of the study area, through the analysis of the tropospheric dynamics and thermodynamics, the data and its sampling are described in Section 2. Following the data and methodology section, results of our exploration on the spatial patterns of cloud fraction and then on their regional variations are presented in Section 3. A summary of the main findings and directions for future work are given in the last section.

2. Description of the Study Area and the Data Used
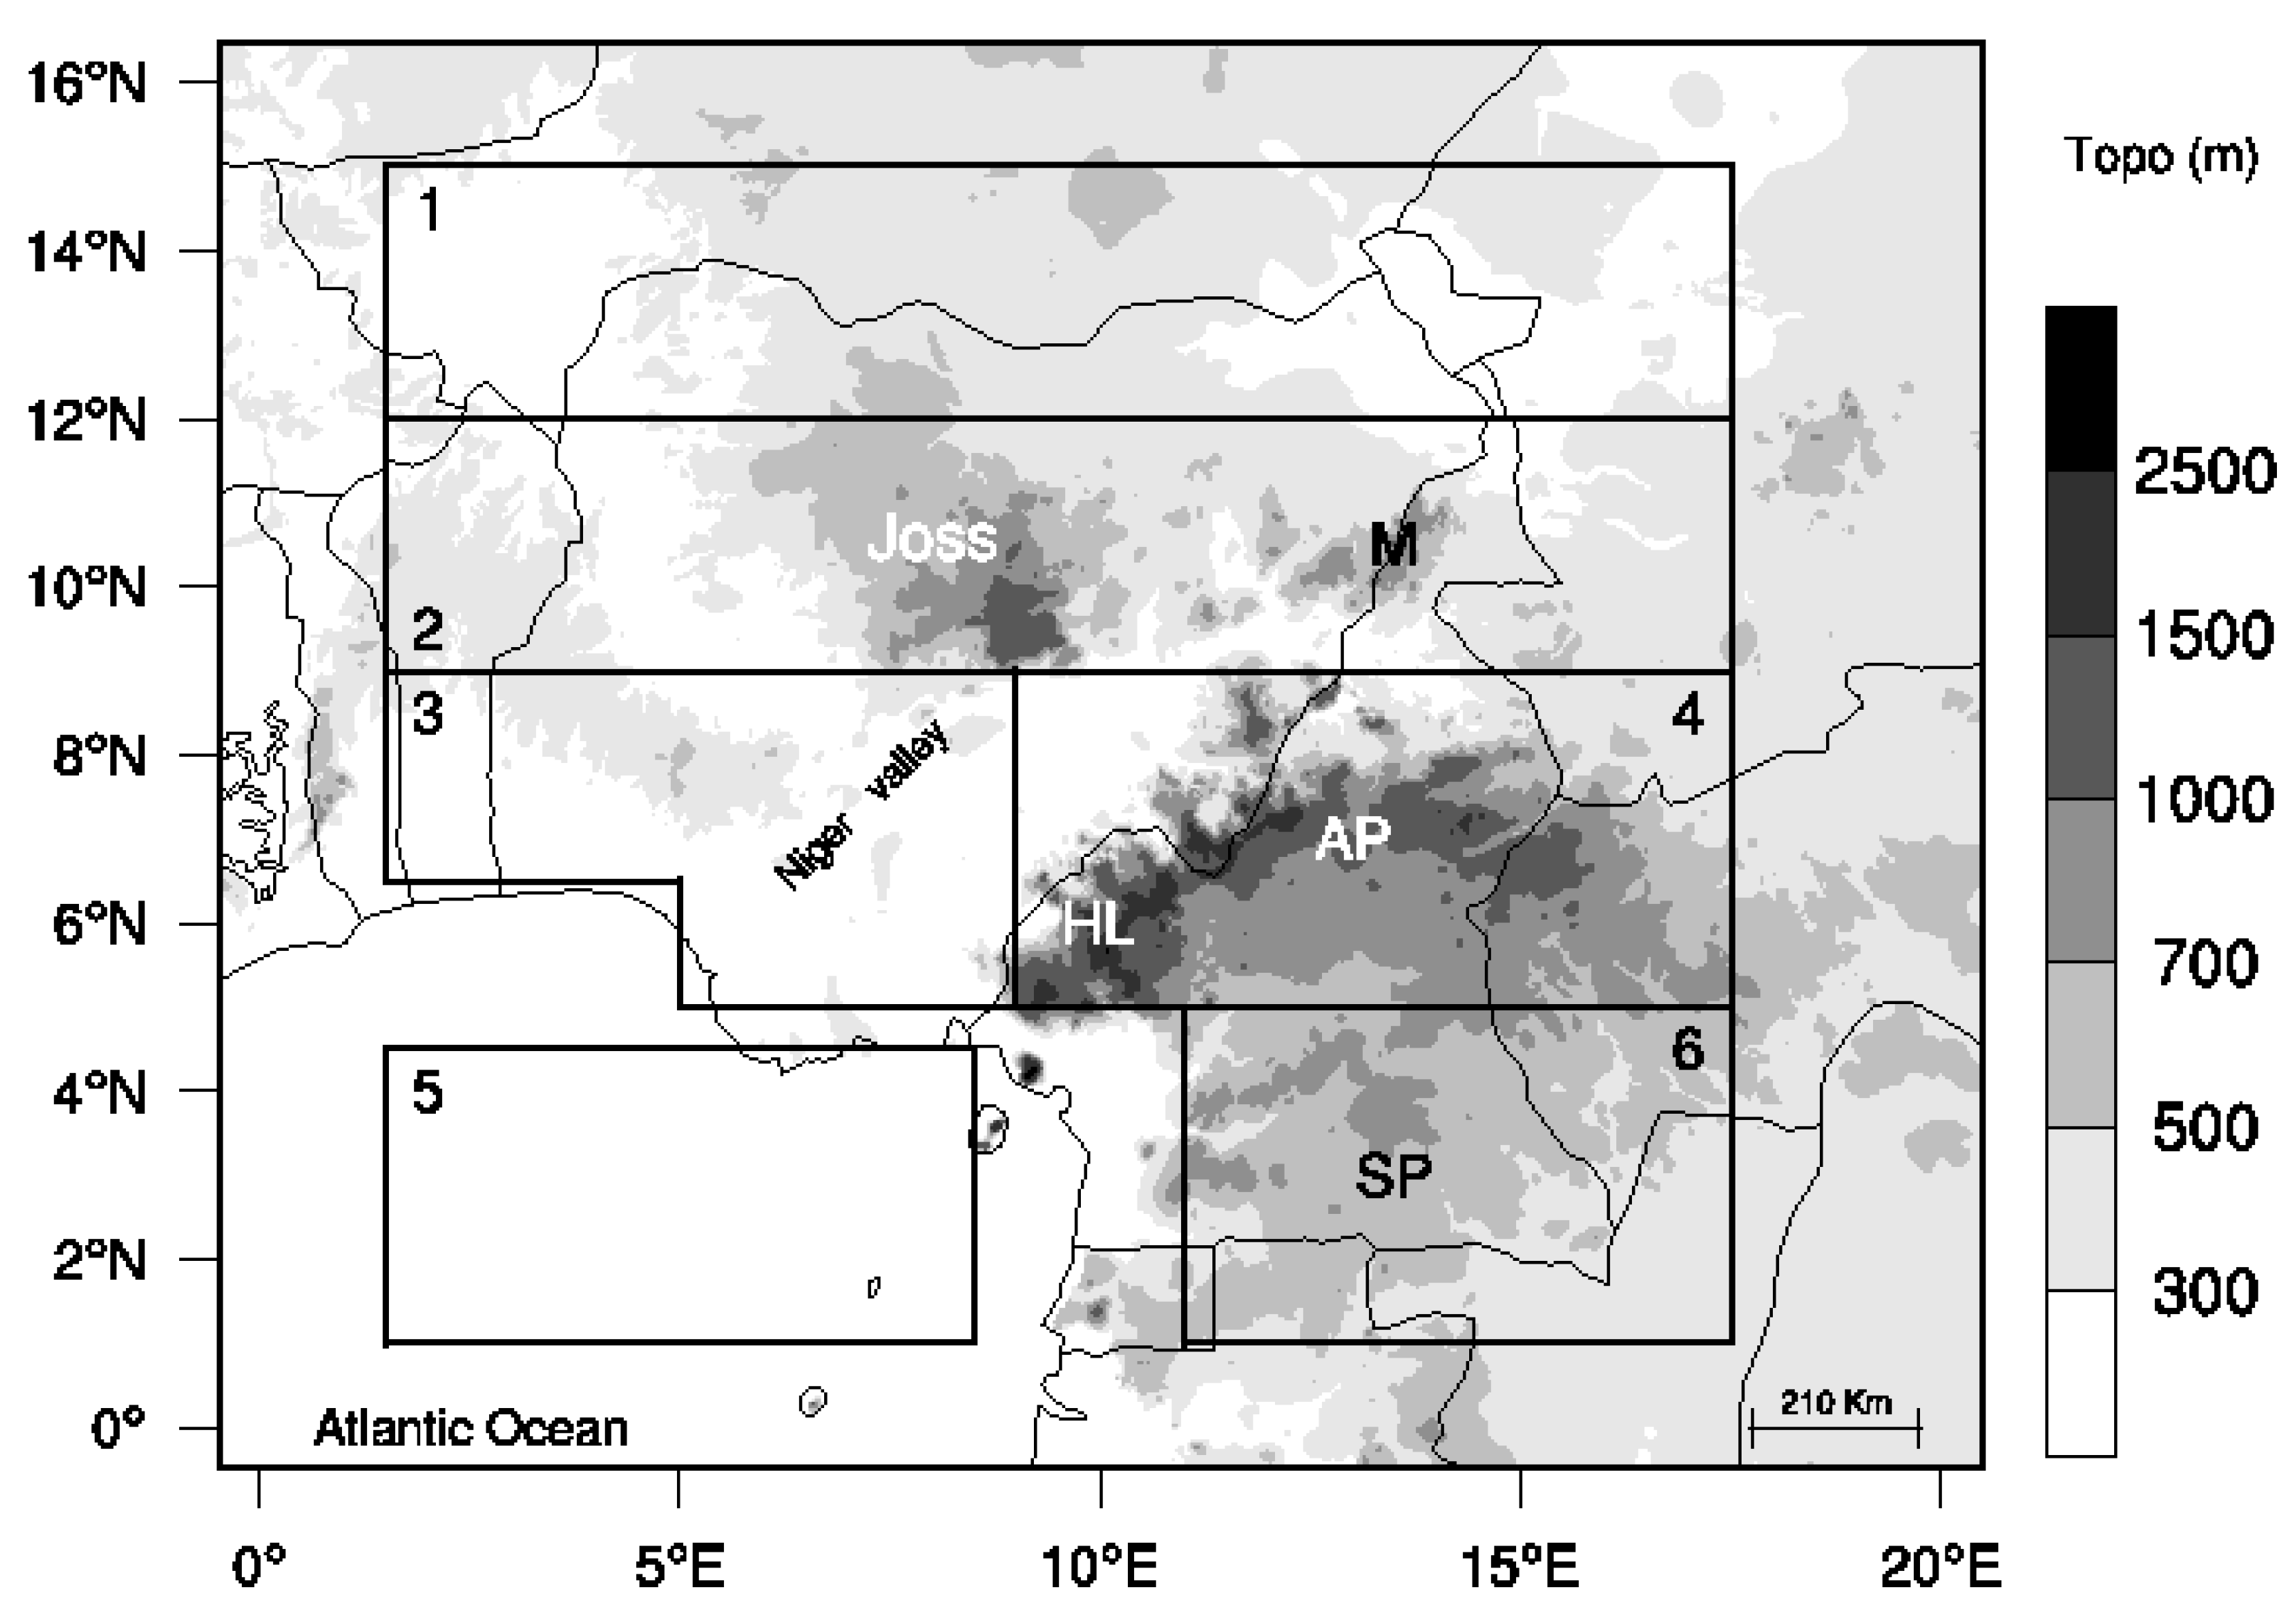
2.1. Study Area

This study covers the area of Equatorial Central Africa comprising Atlantic sector of the Gulf of Guinea and surrounding continent (Figure 1). There are three factors that may strongly influence convective activities in the study area: topography, large scale atmospheric circulation and vegetation type. The study area exhibits a wide range of vegetation zones occurring in narrow latitudinal belts with various types of savannas in north and bounded by forest to the south. The very dry area is found in the Region 1. Region 2 is the semi-arid zone; its canopy is lower and the tree density is less. The region 3 corresponds to the contacts between two vegetation types, here forest and savanna. The savanna composed of medium to tall plants characterizes the Region 4 and is also the vegetation type that replaces the forest after human activities. The south part of the area of study (Region 6) is located in a region typical of continental dense rainforest.
Figure 1. The general surface elevation of the Central Africa based on GTOPO30 2 min topographic data (m). Solid lines delineate the geographical regions used for assessing the diurnal cycle of convective activity. Letters indicate most elevated areas, AP: Adamaoua Plateau, HL: West Cameroon Highlands, M: Mandara, SP: South Cameroon Plateau.
Atmosphere 03 00377 g001
The topography is quite varied with low lying plains, stepped plateaus and high mountains. The low lying areas are the Atlantic coastal plains in the south of Cameroon and Nigeria, with the Niger and Benue valleys linking them to the Lake Chad basin in the north. The high plateaus are Joss (700–2,500 m above sea level, a.s.l.) in Nigeria, the Cameroon Highlands made up of the Adamaoua (700–1,500 m a.s.l.) and the western Highlands (1,000–2,500 m a.s.l.) and the forest covered Southern Cameroon Plateau (400–1,000 m a.s.l.). The Cameroon Highlands have been shown to be the area of genesis of organized convective systems known as squall lines that cross West Africa from East to West in the summer generating most rainfall received there [1,18].
The mountainous parts of the topography is made up of isolated peaks along the Cameroon fault line, the highest being the Cameroon Mountain (4,100 m a.s.l.). These high reliefs, oriented SW to NE, represent an important barrier to tropospheric circulation [19] and may act as a climatic barrier between the sharply contrasting conditions over the wet tropical region in the south and the dry region in the north [19]. Figure 2 presents the gauge-based annual cumulative rainfall compiled and interpolated over a period of 50 years (1953–2002) over the study region. It emphasizes the strong climatic meridional rainfall gradient. Rainfall also diminish from coast to the continent. In summer, the low-level southwesterly monsoon winds bring warm and moist air from the Atlantic Ocean to Central Africa and generate heavy rainfall there. Mkankam et al. [20] show that rainfall height varies strongly in space and time during single rainy season and from one year to another.
Figure 2. Spatial pattern of Climate Research Unit (CRU) TS 3.1 mean annual cumulative rainfall for a period of 50 year (1953–2002). Isohyetal lines are labeled in millimeters per year.
Atmosphere 03 00377 g002
The main feature of large scale circulation are the monsoon, the ITCZ, the African Easterly Jet (AEJ) and the Tropical Easterly Jet (TEJ). The seasonal cycle of rainfall is determined by the annual migration of the ITCZ, which is the region of convergence of South Westerly monsoon circulation transporting humid air from the Atlantic Ocean, and the North Easterly trade winds known as the Harmattan flowing from the Sahara. This circulation provides water vapor for the growth of convective systems. Consequently, strong updrafts are observed as shown in Figure 3a where the seasonally June–July–August (JJA) averaged vertical velocity at 400 hPa is displayed based on 24 years of European Centre for Medium-Range Weather Forecasts (ECMWF) reanalysis data. An ascending zone exists over the study area during the summer monsoon season. The situation in JJA can also be seen in Figure 3b where the mean-wind vectors in the low levels and relative humidity are represented. From a location in the Southern Hemisphere in December–January, the ITCZ migrates northwards at an irregular space to reach its northernmost position at latitude 15°N in July–August. In the western part of the domain, the ITCZ stays on the continent and its southern most position is at 5°N. The monsoon flow is favored by southerly wind crossing the Equator and turning southwesterly by Coriolis acceleration and also by the existence of a strong pressure gradient between the Gulf of Guinea (St. Helena High) and the northern summer Sahara heat low. When the ITCZ is at its highest position (15°N), the southern tip of the study area is actually under the subsiding branch of the southern Hadley circulation cell with little or no rain. This gives rise to the little dry season and explains the bimodal cycle of annual rainfall there, as compared to the mono modal cycle on the Atlantic coast and further north. The African Easterly Jet in the mid-troposphere (700–600 hPa) and the Tropical Easterly Jet at 200 hPa are other large scale wind components that influence convective activity.
Figure 3. Climatological (1979–2002) JJA maps obtained from ECMWF 40 Years Re-Analysis (ERA–40) data. (a) Mean vertical velocity at 400 hPa (×102Pas−1); (b) Mean relative humidity (shaded) and wind field (vectors) at 925 hPa, isolines are in percent.
Atmosphere 03 00377 g003
In view of these contrasted features of topography, atmospheric circulation and vegetation cover, attempts have been made in the past to define homogeneous climatic zones at least in part of the domain. Mkankam et al. [20] used principal components analysis to regionalize precipitation and came up with the usual first components representing the annual cycle (i.e., annual migration of ITCZ) and a second bipolar component contrasting the wet south with the dry Sudano–Sahelian zone. Penlap et al. [21] used Canonical Analysis, Empirical Orthogonal Functions, Empirical Orthogonal Teleconnections and Self-Organising Featuring Maps (SOFM). None of the method gave well limited homogeneous regions for the June–September season. Better results were obtained using SOFM on the March to June period [21]. This shows that the daily cycle of convection is not expected to be homogeneous. Therefore regional study will be conducted to analyse this diurnal cycle in more details.

2.2. Data Used

The brightness temperatures used are from Meteosat-7 (M7) satellite owned by the European Organisation for the Exploitation of Meteorological Satellites (EUMETSAT). This satellite provides half-hourly images from two channels in the infrared domain of the spectrum and one in channel the visible. Data used here are derived from the infrared window channel (10.5–12.5 µm), preprocessed by EUMETSAT into digital counts in the range 0–255 at roughly a spatial resolution of 5 km × 5 km that is ideal for documenting the diurnal cycle of convection. The Meteosat Visible and Infrared Imager (MVIRI) counts were converted to radiances using the operational calibration coefficients available from EUMETSAT’s Web site. Radiance to brightness temperature conversions were performed using lookup tables provided by EUMETSAT. Details on EUMETSAT image processing are available in [22]. All available images for the months of June, July and August 1998–2002 were extracted from the dataset. The missing images (less than 1.12%) were randomly distributed throughout the diurnal cycle and were linearly interpolated.
Although convective phenomena are the main source of precipitation in the tropical region, the relationships between the characteristics of these atmospheric processes and their generated precipitation remain unclear. Current infrared-based methods to measure precipitation from satellites have the advantage of providing high temporal sampling, fine spatial resolution and wide coverage. Nevertheless, the connection between the brightness temperature and surface rainfall is not linear and sometime the position of the coldest clouds is not collocated with the heaviest surface rainfall. The difficulty is even complicated by multilayer cloud structures that may restrict the view of the cloud layer that is actually precipitating. However, a thorough understanding of this relation is essential to work towards improving quantitative precipitation estimates [23] in which cloud parameters are used as proxy variables for the total or maximum intense rainfall from a system. The problems which can arise are the contamination by non-precipitating cirrus clouds [24] and the variation in surface temperature.

3. Identification of Convective Activity

3.1. Determination of the Convection Index

Over clear skies, satellite infrared sensors measure the radiant energy emitted by underlying land and water surfaces, while in the presence of clouds, radiation emitted by cloud tops is measured. The measured energy is converted into brightness temperature Tb using radiation laws of physics. The brightness temperatures are then used to discriminate between different types of clouds. Lowest temperatures are associated with highest (coldest) clouds, but can be contaminated by cirrus, while highest temperatures are linked with low level clouds or boundary layer air or land and water surfaces for clear skies. A detailed description of altitudes associated with different cloud types is given by [11].
The use of infrared image brightness temperature to identify regions of convection usually requires a choice of temperature threshold. There is general agreement that Tb values below a threshold of 235 K, which in the Subtropics corresponds to a pressure level of about 250 hPa [11], give satisfactory results [7,12,25]. In addition, a buoyant parcel in the Tropics reaching this level is likely to have originated below the 700 hPa [13]. However a wide range of infrared brightness temperature thresholds have been used in the literature. Good reviews can be found in [23,26]. Choice of temperature thresholds depends on the wanted inferences from the results. Berges et al. [14] showed that cloud-top temperature is more closely correlated with rainfall occurrence. Precipitation can also be produced by clouds with tops warmer than a chosen threshold, and on the reverse, very cold top clouds may simply be advected out or transformed into cirrus. For this reason, fractional cloud coverage is calculated using two different temperature thresholds (233 K and 213 K) in order to describe typical mean diurnal variations of the different cloud types.
In the Tropics, temperatures of 233 K and 213 K correspond roughly to cloud top altitudes of 10.8 and 13.6 km [11]. These choices are meant to emphasize the behaviours of high level clouds (hereafter HLC) and deep convective clouds (hereafter DCC). The analysis focused on these thresholds in view of a better modeling of events potentially dangerous for agriculture, health and flash floods. The threshold temperature 233 K has been widely used for identifying convection associated likely to precipitating systems [12,27,28]. The convection index used in this work is cloud fraction (CF), also known as the cloud frequency index. For a given observation period and at each pixel, the number Nc of occurrences of brightness temperatures less than or equal to the predefined threshold is determined. Following [12], the cloud fraction for a given period is then calculated as
CF = 100Nc/N     (1)
Atmosphere 03 00377 i001
where N is the total number of images for the period.

3.2. Evolution of Cloud Coverage

Although this study is on the diurnal cycle of convection, it is useful to briefly examine the main spatial feature of cloud cover in the region of study. All times are given in local standard time (LST) corresponding to UTC + 1. To detect cloud cover including total clouds, an histogram of infrared brightness temperature for two nighttime hours (04:00 LST and 22:00 LST) and two daytime hours (10:00 LST and 16:00 LST) is constructed. The temperature interval between 190 and 300 K was subdivided into 5 degree bins and all observations for the time of day of interest were assigned accordingly. The histogram represents the percentage of total counts falling into each bin. As expected, the percentage is lowest for deep convective clouds (lowest IR temperature) and increases with temperature (lower level clouds) as shown in Figure 4. A noticeable secondary maximum is observed at 220 K at 16:00 LST, corresponding to the level of the most frequent deep convective clouds. The next maximum at 265 K, visible on nighttime histograms, corresponds to mid-level clouds [11], and the following decrease marks the transition to clear sky. All the histograms peak in the range 285– 290 K, corresponding to the average temperature of the water vapour rich boundary layer air. From these observations, we can say that a threshold of 275 K is appropriate to detect cloudy pixels in the study area. Our results are similar to those of [29] over South America (in the Brazilian state of Rondônia), where the twin maximum for cloud cover and clear sky were apparent on both daytime and nighttime observations. The next section will focus on the characterisation of the mean spatial fields of DCC and HLC (Figure 5).
Figure 4. The evolution histogram of the percentage for which brightness temperature occurred within each 5 K interval, between 190 and 300 K during the daytime and the nighttime, over the whole region of the study for June–August 1998–2002.
Atmosphere 03 00377 g004

3.3. Mean Spatial Field of Cloud Fraction

The mean spatial distribution of DCC is shown in Figure 5a. Minima of convection are observed high up of the Atlantic Ocean, over the Benue and Niger valleys in Nigeria and the Lac Chad basin. The minimum in the Southern Cameroon is prominent at this temperature threshold. The appreciable zonal band extent of intense activity between 11°N and 13°N latitude is probably related to the African Easterly waves, being just south of their track as depicted by [30]. This is due to the fact that the large amount of high cloud cover found over Sahelian Africa comes from horizontal spreading of vertically growing deep convective clouds by the upper tropospheric tropical easterly jet stream [31]. It may be assumed hare that there is on average less cloud cover and therefore increased incident shortwave radiation at the surface. South of 6°N, the orientation of the gradient of DCC, perpendicular to the coastline, is an indication of the influence of land–sea contrast, a sign of the limited moisture availability further inland and also the effects of the diurnally varying friction layer. Discussing the effect of coastline curvature on diurnally modulated frequency of convection over the Bay of Biafra, Vondou et al. [32] have noted enhancements in coastal concavities in satellite datasets, with geometric land-breeze convergence speculated to be the cause. Further north, this gradient of convective activity is decreasing northward due to the reduction of moisture.
Figure 5. Mean annual spatial distribution of cloud fraction computed for a cloud-top brightness temperature threshold lower than 213 K (a) and than 233 K (b) for the entire period of June–August 1998–2002. Thin lines mark terrain elevation of 700, 1,000 and 1,500 m.
Atmosphere 03 00377 g005
The spatial distribution of HLC is essentially zonal with perceptible values between latitude 3°N and 12°N. Highest values of cloud fractions are found over the Joss Plateau, the Mandara Mountains and the high plateaus of the Cameroon. Those areas have already been identified in earlier work as focal points for initiation of convection [30]. This remarkable spatial dependence of cloud fraction to orography is a clear evidence of heterogeneous land-surface impacts on convective development. Thus topography plays an important role in cloud formation through forced air lifting on its slopes since the region is affected by the southwest monsoon flow (Figure 3b). The orography increases the moisture convergence at low levels by blocking and deflecting the mean flow. The upslope winds help the initiation of the convection at the mountaintop. The low cloudiness south of 3°N in Cameroon is an indication that the ascending branch of the Hadley cell is centered further north. This weakening of convective activity here is apparently reinforced by the blocking effect of the moisture flux by the stepped South Cameroon plateau which starts to rise around 10°E. This study clarifies in a more detailed way the effects of the orographic forcing on the convection during the rainy season than the previously published papers (e.g., [11]). Representation based on 5 km data given here shows how the convection hold close the coastline and mountain contours. A good spatial match between distributions of DCC and HLC, which is more obvious through its strength, is observed. The largest difference is found in the intensity of convection. Cloud fraction is more uniform at 233 K.
The limit of using cloud fraction as estimator of rainfall appears clearly on the differences between spatial pattern of rainfall displayed in Figure 2 and cloud fractions shown in Figure 5. The spatial distribution of accumulated rainfall (Figure 2) is characterised by a highest value along the coast. A strong west–east and south–north decrease of rainfall is also perceptible in this figure, while close inspection of Figure 5 shows that cloud fraction maxima are aloft high terrains. The distribution of accumulated rainfall over the study area presumably reflects the substantial contribution of stratiform rain and shallow precipitating convection to the total volume of rain. Nesbitt et al. [33] indicate that for the tropics as a whole, 48% of the precipitation over land is stratiform and 50% of the precipitation associated with mesoscale convective systems over land is stratiform. The stratiform rain is dominant during the night, when the systems expand and reach their maximum areal extent. Furthermore, not all convective cases necessarily represent cloud systems with rainfall reaching the ground throughout their duration, while still others may precipitate after an evolution to warmer cloud structures. Moreover, cloud fractions are susceptible to cirrus contamination, which introduces uncertainty in estimating precipitation [24]. Over land, higher stratiform rain fractions often occur during the season of maximum insolation and with the occurrence of very large, organized precipitation systems. Such a study on convection variability cannot resolve the apparent discrepancies between rainfall regimes, although it might provide support for rainfall occurrence [14]. The pattern in Figure 5 might indicate a significant role of the convectively active regions in generating the conditions in which thin cirrus can be prevalent away from the convection itself. Thick cirrus clouds with high cloud top are difficult to screen out using IR methods, which results in an overestimation of deep convective cloud fractions. Schumacher and Houze [34] show that over sub-Saharan Africa when the upper-level Tropical Easterly Jet strengthens during the monsoon season, upper-level shear is reduced dramatically and stratiform rain areas form in preference to non-raining anvil. Moreover, over the region of this study, acting processes were observed to change at a very high spatio-temporal scale, which would not be captured with 3-h observation and only marginally with 1-h or crude spatial dataset. In such a way, it would be suitable to carry out studies at smaller time scales (e.g., fluctuations of thermodynamics and surface radiation) related to moist convective events.
The standard deviation maps of the 30 min intervals cloud fraction for the whole season, presented in Figure 6, provide a rough estimate of the amplitude of the mean diurnal cycle of the convective cloudiness. The seasonal standard deviation of CF, calculated at each grid point (pixel), is the square root of the mean squared anomalies at each half-hour relative to their seasonal daily mean using
Atmosphere 03 00377 i002
where CFt, Atmosphere 03 00377 i003, N are respectively cloud fraction at time t, mean daily cloud fraction and number of image per day. The standard deviation calculated in each grid point is averaged for three months JJA 1998-2002 and portrayed in Figure 6.
Figure 6. Mean seasonal spatial distribution of the standard deviation of the half-hour cloud fraction over the whole region of the study for June–August 1998–2002 computed for a threshold of 213 K (a) and 233 K (b). Thin lines mark terrain elevation of 700, 1,000 and 1,500 m.
Atmosphere 03 00377 g006
The standard deviation at 213 K threshold is presented in Figure 6a. It shows larger amplitudes compared to the 233 K threshold. It is interesting to note that even at 213 K the Atlantic shoreline is clearly delineated. Higher values in the north of the study area is the manifestation of the strong diurnal heating of the surface over Sahel. Because of low humidity, diurnal variation in the convective activity is highly due to diurnal variation in surface temperature, which in turn is due to diurnal cycle of solar insolation. Soil water, which is a primary control on resistance to evaporation over land, impacts the diurnal cycle of lifting condensation level (and relative humidity). Several important surface processes are strongly influenced by soil moisture: boundary-layer development, formation of low clouds, infrared emission from the surface. Large normalized amplitude changes occur even in the region not prominent on the mean diurnal map (Figure 5a). e.g., elongated area depicted over South Cameroon at 11°E. The physical mechanisms responsible for the strong diurnal amplitude is well understood if it is accepted that diurnal variation of convective activity here is mainly due to the forcing of sea breeze fronts by the orography uplift over the western side of Southern Cameroon Plateau. The stronger values of diurnal amplitude show that high cloud activity gives a high fluctuation of the signal. The features of the diurnal cycle of convection is discussed next.

4. Diurnal Cycle of Convective Activity
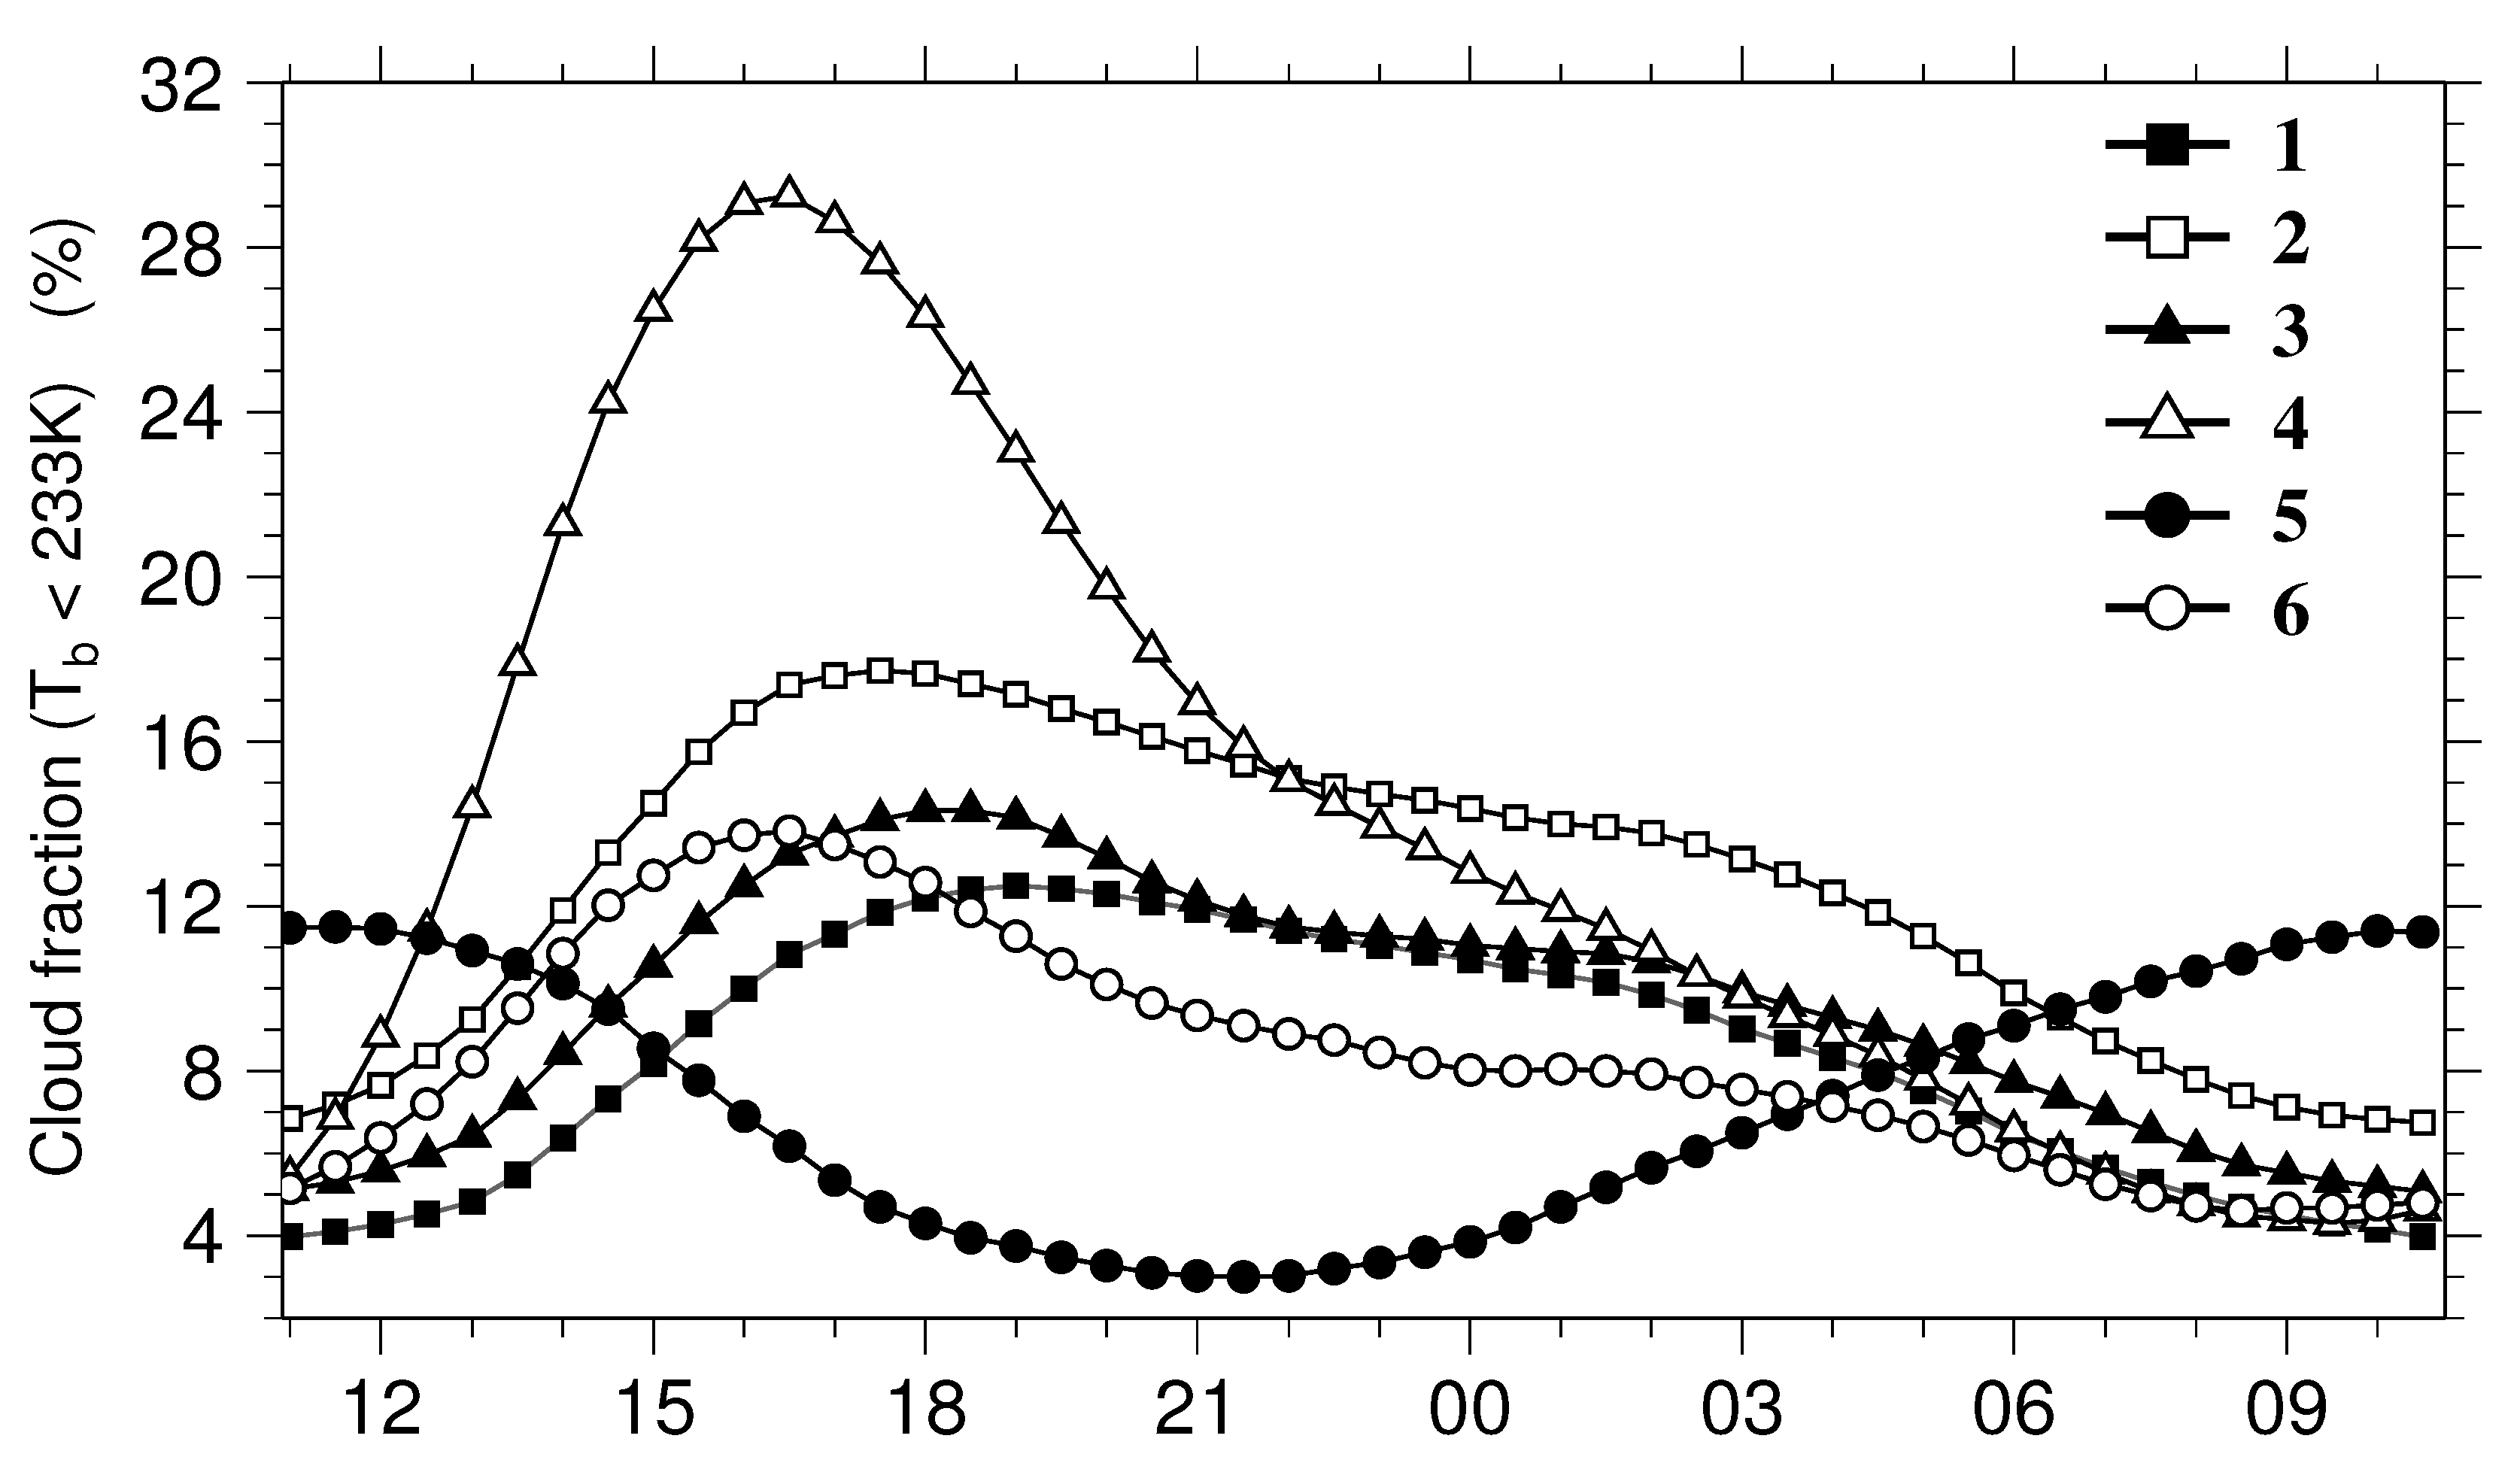
In order to analyse the diurnal march of convection, the limit of brightness temperature below 233 K was chosen in the objective to keep only cold tops of convective clouds and some thick cirrus, which are generally associated with convective systems [24]. For subsequent investigations, this value is used as threshold despite that it does not help sufficiently to screen out the high thick cirrus cloud. The selection of this particular threshold is justified by the well agreement between satellite estimates of rainfall and surface measurements [35].
Table 1. Time of maximum cloud fraction as a function of the cloud-top temperature for different regions shown in Figure 1. The time of maximum of cloud fractions with brightness temperature in the range 230-235 K is given in local time and is used as reference time. Minus (plus) hours indicate peak of other categories before (after) the reference time (LST).
RegionTemperature range (K)
230–235210–220250–260263–283
1 (Sahel)20:30–3:30+05:00+06:00
2 (Savanna)20:00–3:30+04:00+06:30
3 (Niger Valley)18:30–01:00+08:00+11:30
4 (Highlands)18:00–02:30+08:30+12:30
5 (Ocean)12:30–03:00+10:30+13:30
6 (Forest)17:30–1:30+07:30+12:00

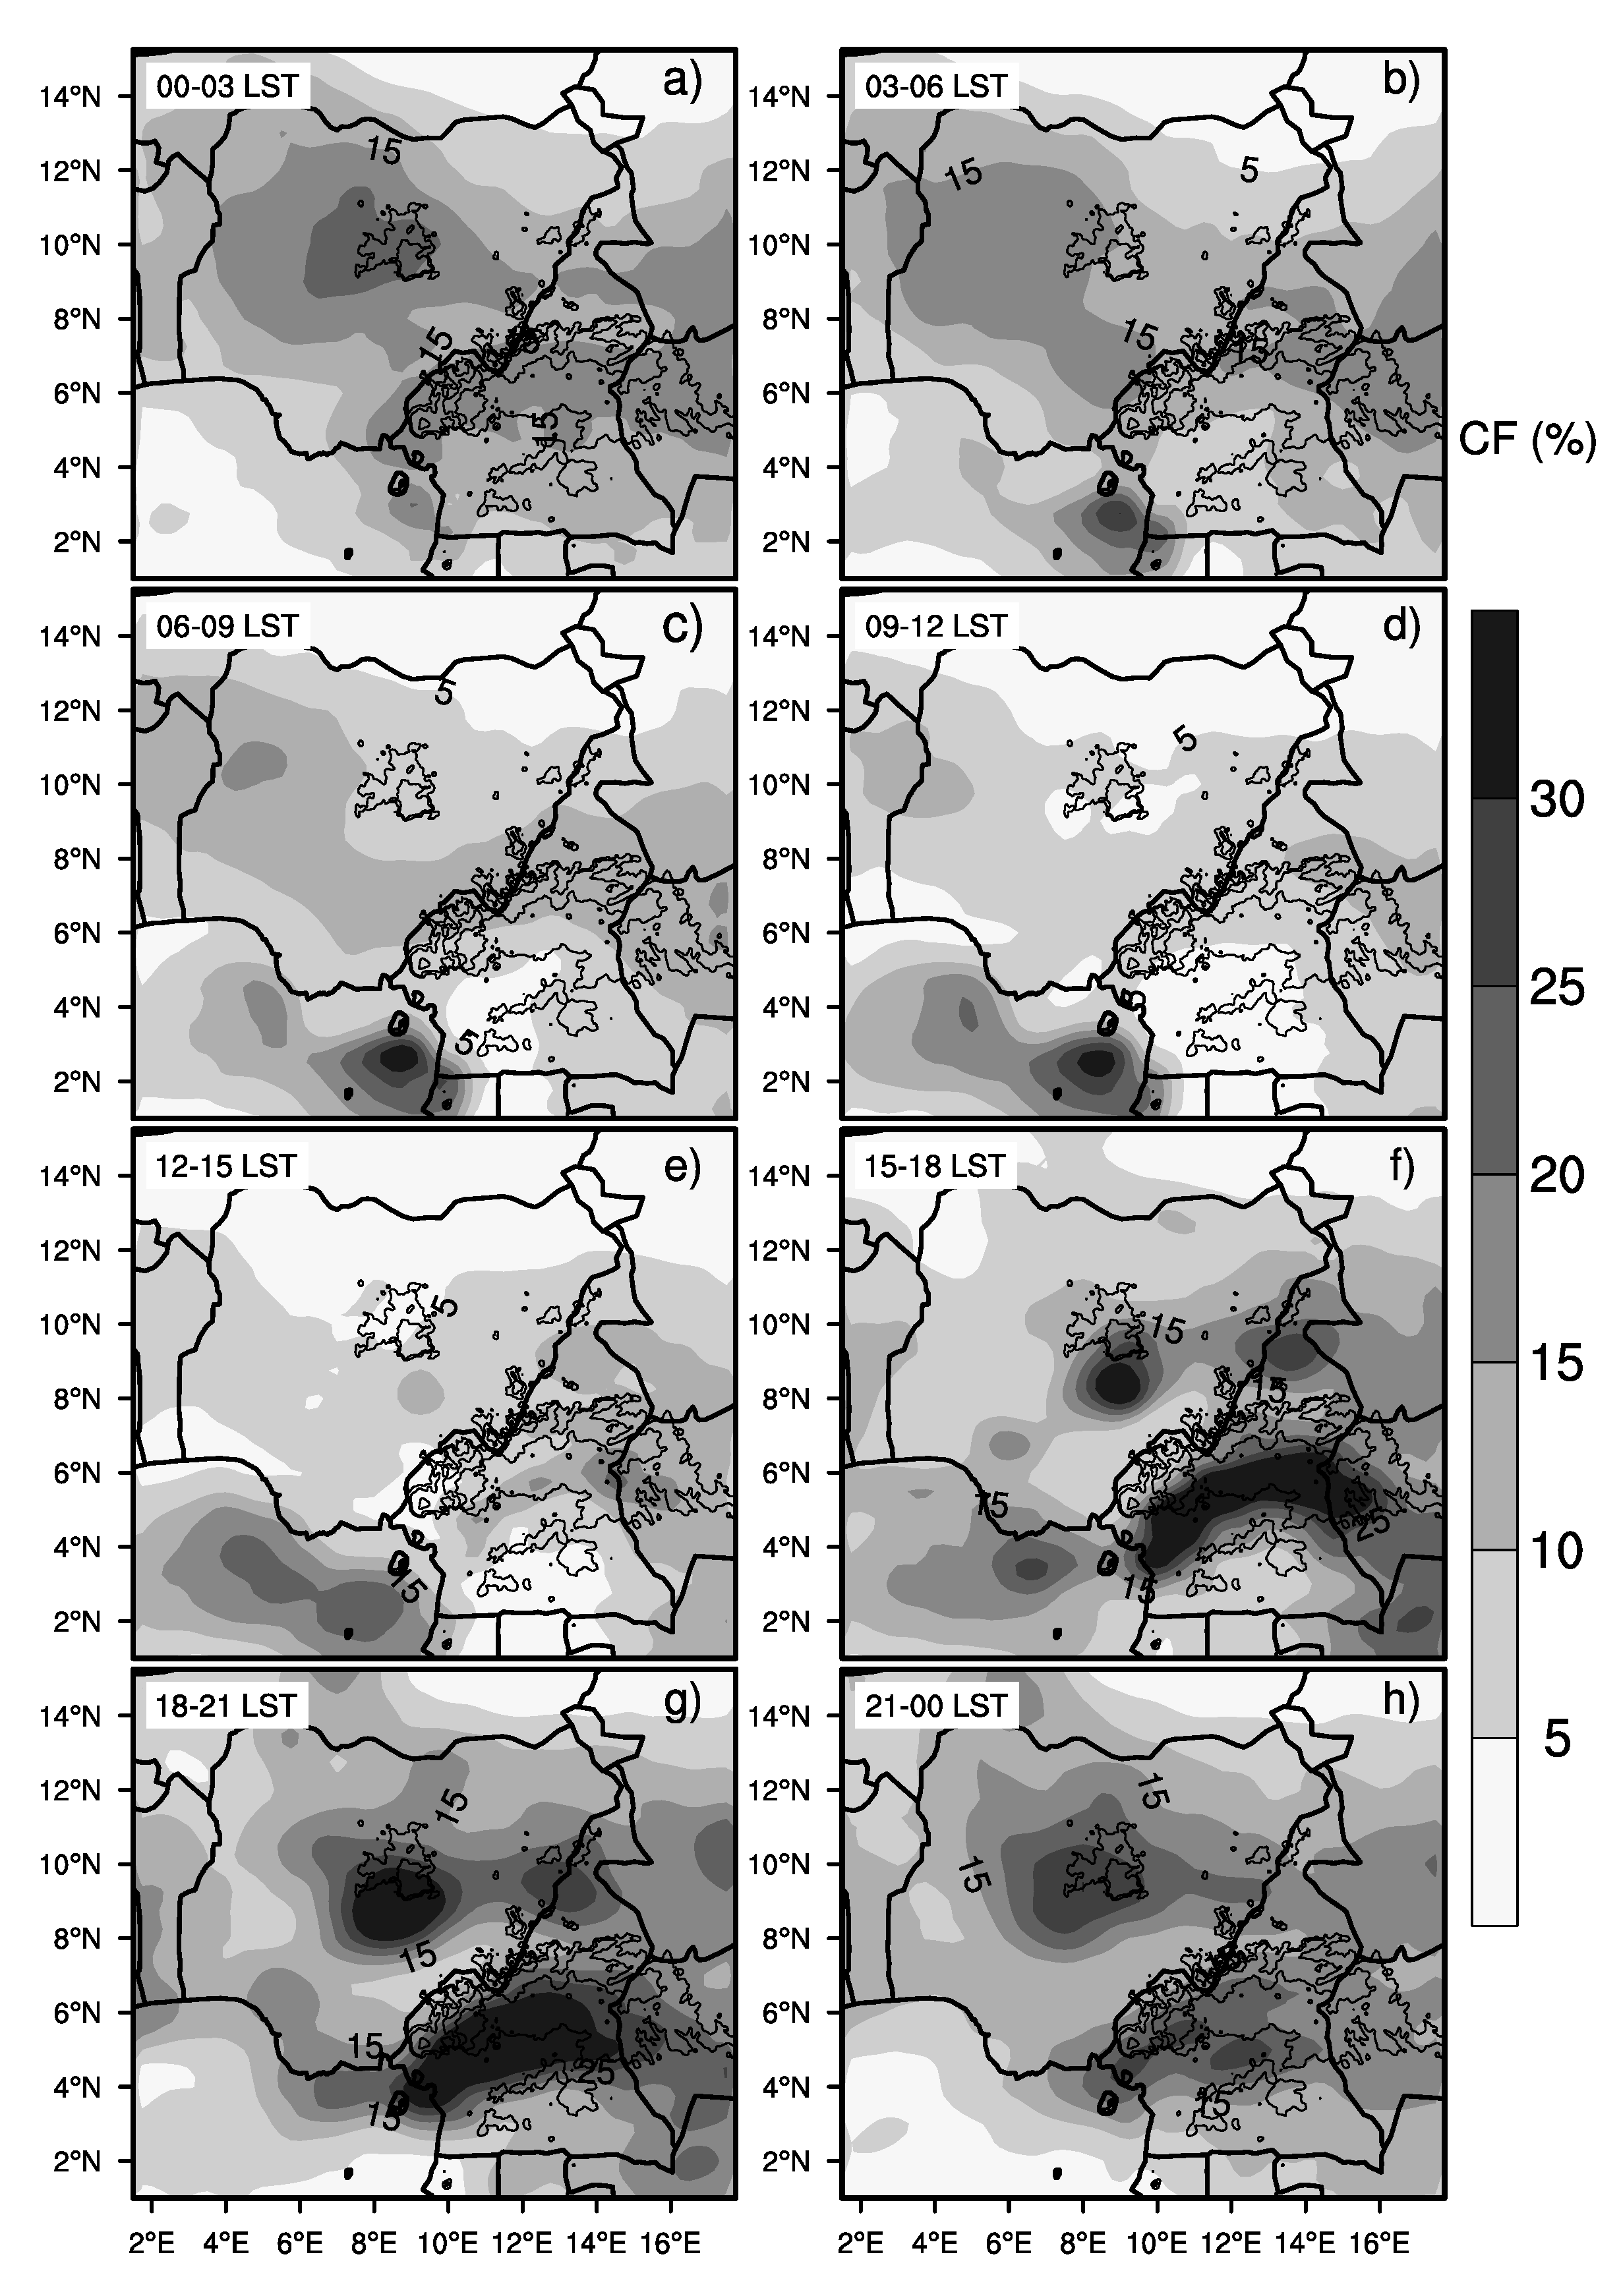
4.1. Spatial Patterns of Diurnal Cycle

An important aspect of the spatial variability of convective activity is its peak time. To access these contrasts, maps of mean cloud fraction were constructed for successive periods of 3 hours starting at midnight. Table 1 summarizes the dependence of the timing of maximum cloud fraction as a function of cloud-top temperature. This table shows that the time of the maximum of convection depends on the threshold chosen; warmer clouds peak later in the day.
Figure 7. Mean spatial distribution of the diurnal cycle of convective activity computed at Tb < 233 K during June, July, and August shown at 3 hour intervals (a) 00–03 LST; (b) 03–06 LST; (c) 06–09 LST; (d) 09–12 LST; (e) 12–15 LST; (f) 15–18 LST; (g) 18–21 LST; and (h) 21–00 LST. Thin lines mark terrain elevation of 700, 1,000 and 1,500 m.
Atmosphere 03 00377 g007
Figure 7(a–h) sketches a distinct phase difference in the time evolution of cloud fraction between ocean and continent. Over the Atlantic, convection begins to develop during the night (00:00–03:00 LST) and dawn (03:00–06:00 LST) periods, reaches its maximum in the early morning (06:00–09:00 LST) and stays high through late morning (09:00–12:00 LST) and early afternoon (12:00–15:00 LST). Dissipation starts in the mid-afternoon from around 15:00 LST and minimum cover is observed in the evening (18:00–00:00 LST). Randall et al. [36] argued that this behaviour of convection over ocean is due to the fact that solar absorption, and hence, heating in the upper cloud layers stabilizes the lapse rate of temperature, therefore tends to suppress convection during the afternoon. Other physical mechanisms considered as potentially responsible for causing diurnal variations of convection over oceans include the day–night differences in radiative heating between the convective and cloud-free regions [37]. During the rainy season afternoons and evenings, air can rise over the land and subsidence can occur over the ocean as a result of the warmer air over the land than the nearby ocean. From midnight to early morning, the land–ocean circulation reverses because the air over the ocean becomes warmer than the air over the land. Besides, the radiative cooling at cloud tops in the night destabilizes the boundary layer and promotes convection over the ocean. Thus, morning convection maxima exist over the ocean areas.
The rates of build-up and dissipation of convective activities are similar. The position of maximum cloudiness over the coastal region coincides with the location of Debundscha, one of the rainiest place on earth with 10,000 mm mean annual accumulation. This can be attributed to the combined effects of sea–breeze and orography with the Cameroon Mountain (4,100 m a.s.l.) serving as a barrier to air flow and triggering local convection. The high south-west gradient of convection in the area is due to rapid depletion of advected moist air from Atlantic Ocean as it moves inland. Following works of [38], we can speculate that vertically propagating gravity-wave occurs on the lee side and over the crest, sloping upward against the cross-barrier airflow, where it may produce cloud aloft. Here convection forms as a delayed remote response at a distance from the mountain range when daytime heating and latent heat release over the high terrain either generate gravity-waves propagating away from the range or potential vorticity anomalies, which are advected downstream of the mountains [39]. The diurnal variation differs regionally, probably because of the modulation of low-level convergence by land–sea and mountain–valley breezes in addition to mesoscale features. The heating in the Niger valley produces a pressure falling in the valley relative to the surroundings, which in turn produces an up-valley wind beginning in late mornings. The divergence-driven subsidence at the foot of the Joss restrains the development of cloud in the valley during the daytime. The radiative cooling of the hill slope cools the surface air after sunset. Understanding the orographically modified flow as it occurs here is difficult since it depends on the static stability of the flow at low levels [40], which is heavily influenced by synoptic conditions, the complex effects of latent heating, and the mountain shape. High resolution satellite dataset used in this study provides concise information that generally agree and go beyond those established by previous researchers with crude resolution [7]. This is particularly noticeable for spatial variability, which is not easy to obtain with low resolution.
Over the continent, convection begins to develop around noon, continues through early afternoon at a faster rate than over ocean to reach its maximum in late afternoon to early evening (with cloud fraction greater than 25%), maintains a large area, then dissipates slowly from late evening (21:00–00:00 LST) to the night and dawn periods and more rapidly after. Thus the morning sun heats the surface, dissipates night time temperature inversion and provides enough turbulence and buoyancy to initiate convection. With increasing solar heat flux, convective activity is initiated and the moisture which was carried northward in the evening is transported to higher levels. As soon as the atmospheric boundary layer stabilizes after sunset, the humid air begins moving northward due to the high pressure gradient, since the southerly nocturnal winds are primarily responsible for the northward transport of moisture. During the night this gradient weakens and the southerly winds weaken down towards sunrise. Garcia et al. [41] show that in the rainy season, the nocturnal flow transports humidity over the land, and this is mixed by day time convection caused by increases in wind speed and turbulence. Duvel [11] has reported that, over Central Africa, this behaviour of convection is influenced by the release of conditional instability forced by ascent of low-level winds. In fact, deep convection is triggered when the potentially unstable low-level flow is subjected to orographic lifting over the foothills. The gentle and widespread upward motions (Figure 3) of the synoptic system provide a moist environment favourable to the development of convection. Figure 3 and Figure 5 highlight the fact that the distribution of convection over land near a terrain feature of a given height and topographic shape is determined by the dynamical behaviour of a mass air flow encountering a hill barrier and the thermodynamics of moist air. Diurnal variations of cloud fraction are similar to those obtained by [11,42] with a maximum of convective activity in the early evening and a minimum at noon.

4.2. Regional Distributions

To gain some insight into regional characteristics of the diurnal cycle and to investigate detailed local response of cloudiness to diurnal forcings, convection is considered over nearly homogeneous areas that are representing different local climatic regions or topography. To this effect, the study area was divided into 6 main regions: semidesert (Region 1), savanna (Region 2), low lands (Region 3), highlands (Region 4), sea (Region 5) and forest (Region 6) represented by boxes in Figure 1.
Figure 8(a–f) displays the diurnal cycle of area-averaged cloud fraction ⟨CF⟩ over the 6 considered regions for the 233 K temperature threshold. There is a separate curve for each of the five years of the study. This is meant to emphasize similarities between annual distributions. For convenience time origin is set at 11:00 LST when the diurnal cycle generally starts over land with increase in cloudiness. As expected, apart from the land–sea contrast, there are differences between regions on land. Within each region, the shape and phase of the diurnal cycle are remarkably stable from year to year for the period of the study. Values for 1998, 2000 and 2002 form an even higher cluster in all regions. Highest ⟨CF⟩ values were observed in 1999, while 2001 had the lowest, except for the north part of the domain in semidesert (Figure 8a) and savanna (Figure 8b). Similar behaviours of convection, characterized by high cloudiness in the Sahelian part and low cloud cover in the coastal region during one year and the reverse situation during another year, was also obtained by [11] over West Africa. Over the land this tendency of the high cloud was attributed to vertical shear differences between 700 and 850 hPa. The shear is highest during dry years due to greater latitudinal temperature differences between ocean and land. This marked interannual difference of deep convection (high ⟨CF⟩ in 1999 and low ⟨CF⟩ in 2001) was also previously noted by [42] during June–August. This implies that 1999 was a strong monsoon year and 2001 was a slightly weak monsoon year. They also show that propagating deep convection occurs within the zone of maximum low-middle tropospheric shear. Maxima of deep convection are associated with local maxima in shear, which is found near elevated topography. Low level advection of warm moist air linked with an unstable vertical thermodynamic profile favours the build-up of convective available potential energy. The vertical wind shear associated to the African easterly jet favours the organisation of convective systems into long-lived propagating systems such as squall lines. Duvel [11] argued that this is due to the greater latitudinal gradient of temperature between Atlantic and land regions during dry years. Weaker subsidence contributes to the cooling of air aloft ocean and warmer air over land surface modifies vertical shear anomaly. The larger value of ⟨CF⟩ is depicted over highlands region (Figure 8d) with more than 30% and the smallest over sea and semidesert. On the continent, the time of maximum of ⟨CF⟩ is within an interval of 2 hours for all years in the study. The period of study (5 years) is however too short to reach definitive conclusions on the interannual variability of the diurnal cycle in our study area.
Figure 8. Year-to-year regional variation of the averaged cloud fraction at 233 K. Curve for each year is defined by corresponding symbol. The horizontal axis correspond to the local solar time.
Atmosphere 03 00377 g008
To compare variations of the diurnal cycle of convective activity among the different regions, merged sample were constructed by averaging the yearly ⟨CF⟩. Figure 9 displays the corresponding variations. The diurnal cycle of the merged sample over regions 1, 2, 3, 4 and 6 tends to have quite similar shapes and tendencies, which are characterized by a rapid increase during afternoon starting at mid-day (15:00 LST) to a well-defined peak between 15:00 and 19:00 LST depending on the region, followed by a fast decrease during approximately 4 hours to midnight (00:00 LST) and finally a gradual decay during late night and morning hours. The first decreasing phase (18:00–21:00 LST) is faster over highlands than elsewhere. This can be explained by the fact that over land while the convective cloud is important, the surface is modified to the nearly saturated state and the boundary layer becomes very stable [43]. Therefore, the development of nocturnal thermal inversion rapidly stabilise the subcloud layer by cooling and drying the atmosphere. In the vicinity of the deep convective region, air in most cases shows moderate subsidence created by radiative cooling of the atmosphere, so the upper troposphere of the non-convective regions does not feel much of an influence from the surface immediately below. The significant diurnal variations in vertical circulation (stronger in the daytime and weaker at night) could be the most important contributor to the nocturnal maxima. Differences appear also in the diurnal amplitude. Highland regions show large diurnal amplitude compared to the other regions. The maximum is observed firstly over highlands and over forest in the late afternoon followed by semidesert, savanna and lowlands in the early evening. This means that convection starts earlier in the day over highlands compared to the adjacent lowlands. The interaction between cloudiness and solar heating depends on the thermodynamic characteristics of the atmosphere. At the surface the temperature warms rapidly, as the surface sensible heat flux is trapped in the surface layer. A higher surface net radiation is associated with larger soil moisture contents and evaporative fractions [44]. The difference between net radiation and ground heat flux is the surface condition driving the diurnal cycle over land. However, connection of convective triggering to soil moisture is not the only function of surface processes. The stability and height of the layer into which the boundary layer is growing act on the return mechanism [41]. A higher net radiation helps to break convective inhibition and further increase the occurrence of convective rainfall, leading to higher soil moisture contents where the amount of water retained in the surface layers depends on the soil composition. As the monsoonal flow moves inland, it passes over the forested zone of the study area, where it further increases its moisture content. The composition of the plant canopy in woodlands leads to the decrease of albedo values, due to light absorption by stems. In areas with high canopy, spatial variability tends to be weaker and circulations are less likely. The upward ground heat flux is much less when the soil is dry.
According to [23], difference in phase can be partially attributed to the westward propagative convective systems generated earlier over elevated terrains. Propagating systems create secondary maxima of convection and the local minimum is intercepted by higher-frequency bands of convection. In contrast, the maximum is depicted in the noon over ocean. Our analysis suggests intense rains in continental regions in the afternoon, knowing the very tight correlation between HLC and precipitation [1,12,16,28,45]. Figure 8 and Figure 9 show that diurnal phase displays a distinct local shifting within each region. The local behaviour of diurnal cycle within individual regions can be more complex than attributed to a general shift. Melani et al. [45] and Laing et al. [23] have demonstrated a recurrent pattern of phase propagation of rainfall maxima in the northern tropical Africa downstream of the mountains, related to the maintenance of deep convection and mesoscale systems moving in the general direction of synoptic disturbances of the maximum wind shear between 925 and 600 hPa. The phase propagation is most evident in Figure 8(c,d) and Figure 9 over regions 3 and 4. They display a general shift of the diurnal phase between these two regions. The general phase shift explains the difference of convection peak time. The diurnal phase in Region 4 may have resulted from the locally preferred systems or from the long-lived migrating systems from Region 3. The results on the distribution of the diurnal cycle of convective activity suggest that the conditions underlying the forcing and development of convection show some regional differences but are mostly homogeneous within each area. The remarkable homogeneity and reproducibility of the maximum and minimum values of ⟨CF⟩ at relatively the same time is observed. The similarity of the fitted curves for the 5 years shows that the growth conditions remain also very similar from one year to the next. This study have presented variations of the diurnal cycle in complex terrain (e.g., the differences between the adjacent Guinea coast and Cameroon Highlands) and have the advantage of using data with high temporal resolution for a multi-year period, which also facilitates some discussion of interannual variability than previously papers. Analysis of the diurnal cycle of the convection presented here adds to and clarifies limits of the previous studies over tropical Africa by combining information on the duration of the diurnal variation with fine scale geographic variations, particularly those related to coastal geometry and mountain ridges.
Figure 9. Regional variability of the diurnal cycle of average half-hourly cloud fraction computed for a threshold of 233 K over the six regions indicated in Figure 1. The symbols correspond to the domain on which statistics are computed. The X axis denotes the LST.
Atmosphere 03 00377 g009

5. Summary and Conclusions

In an attempt to better understand cloud variability, the 5-year time series of half-hourly brightness temperature obtained from Meteosat 7 were used to analyse diurnal cycle of convection over the West of Central Africa. Cloud fraction information was inferred for two infrared brightness temperature thresholds to emphasize behaviours of different cloud layers. Analysis of the diurnal cycle of convection yields substantial leading characteristics. The year-to-year distribution of the diurnal cycle is investigated over six nearly homogeneous regions. The strong diurnal signal is characterized by a distinct land–sea contrast between daytime and nighttime. The cloud cycle is not homogeneous over all lands, however, because of complex local circulations related to the orography. Peak elevations exceed 1,000 m, and orographic forcing influences the patterns of diurnal convection.
Over most land, deep convection peaks in the late afternoon and early evening, showing that the diurnal cycle of convection here can be in part attributed to the thermodynamic response of the strong diurnal cycle of land surface temperature. Nevertheless, regional variations exist in both diurnal phase and amplitude, implying that surface elevation, land–sea contrast and the shape of coastline play an important role in the physical mechanisms of the generation of convective activity. It appears that the size and shape of a mountain has a profound effect on the ultimate distribution of convection.
In general, the diurnal cycle of convection in the region over the Atlantic Ocean is not very significant. Over the coast of Cameroon and Nigeria diurnal cycle is strong with peaks in the morning (09:00–12:00 LST). The results agree reasonably with those of previous studies. It is speculated that the strong diurnal cycle over the shore is the conjugate effect of sea breeze fronts and the low-level convergence caused by sea breezes entering the continent from coasts. This highlight the need of long term high-resolution runs of numerical model analysis to further verify, more rigorously, the dynamical processes observed here. Near noon maxima of convection is found over sea with smooth transitions in the diurnal phase from late morning to early afternoon. Diurnal variation is small over oceanic region compared to land. Intuitively one can understand this because oceans have large heat capacity and hence sea surface temperature does not change on daily basis.
This study emphasizes the need to represent in a more detailed way the effects of mountain-valley winds, land-sea breezes, land-sea contrast, and coastline curvature over regions of irregular topography, in order to improve the diurnal cycle which can ameliorate the forecasting of African monsoon circulation through meteorological numerical models. The second phase of the International Science Plan for the African Monsoon Multidisciplinary Analyses field campaign, which will be extended further south, should provide more detailed insight on convective development suitable for the Central African monsoon environment [46]. The low-level dynamic and thermodynamic on a regional scale must clarify the obtained regional features revealed in the present study. This issue might be addressed in the future using high-resolution data derived by numerical simulations.

Acknowledgments

ERA40 data were provided by the ECMWF Meteorological Archival and Retrieval System (MARS). Satellite data are copyrighted by EUMETSAT and provided by the EUMETSAT Archives (http://www.eumetsat.int/). The author is indebted to three anonymous reviewers for their constructive comments, which substantially enhanced the quality of the manuscript.

References

  1. Mathon, V.; Laurent, H.; Lebel, T. Mesoscale convective system rainfall in the sahel. J. Appl. Meteorol. 2002, 41, 1081–1092. [Google Scholar] [CrossRef]
  2. Gettelman, A.; Salby, M.L.; Sassi, F. The distribution and influence of convection in the tropical tropopause region. J. Geophys. Res. 2002, 107. [Google Scholar]
  3. Betts, A.K.; Jakob, C. Study of diurnal cycle of convective precipitation over Amazonia using a single column model. J. Geophys. Res. 2002, 107. [Google Scholar]
  4. Dai, A.; Trenberth, K.E. The diurnal cycle and its depiction in the community climate system model. J. Clim. 2004, 17, 930–951. [Google Scholar] [CrossRef]
  5. Tchotchou, L.A.D.; Mkankam, K.F. Sensitivity of the simulated African monsoon of summers 1993 and 1999 to convective parameterization schemes in RegCM3. Theor. Appl. Climatol. 2010, 100, 207–220. [Google Scholar] [CrossRef]
  6. Lee, M.I.; Schubert, S.D.; Suarez, M.J.; Bell, T.L.; Kim, K.M. Diurnal cycle of precipitation in the NASA seasonal to interannual prediction project atmospheric general circulation model. J. Geophys. Res. 2007, 112. [Google Scholar]
  7. Yang, G.Y.; Slingo, J. The diurnal cycle in the tropics. Mon. Weather Rev. 2001, 129, 784–801. [Google Scholar] [CrossRef]
  8. Zhou, L.; Wang, Y. Tropical rainfall measuring mission observation and regional model study of precipitation diurnal cycle in the New Guinean region. J. Geophys. Res. 2006, 111. [Google Scholar]
  9. Garreaud, R.D.; Wallace, J.M. The diurnal march of convective cloudiness over the Americas. Mon. Weather Rev. 1997, 125, 3157–3371. [Google Scholar] [CrossRef]
  10. Desbois, M.; Kayiranga, T.; Gnamien, B.; Guessous, S.; Picon, L. Characterization of some elements of the sahelian climate and their interannual variations for July 1983, 1984 and 1985 from the analysis of METEOSAT ISCCP data. J. Clim. 1988, 1, 867–904. [Google Scholar] [CrossRef]
  11. Duvel, J.P. Convection over tropical Africa and the atlantic ocean during northern summer. Part I: Interannual and diurnal variations. Mon. Weather Rev. 1989, 117, 2782–2799. [Google Scholar] [CrossRef]
  12. Ba, M.B.; Nicholson, S.E. Analysis of convective activity and its relationship to the rainfall over the rift valley lakes of east Africa during 1983–90 using the meteosat infrared channel. J. Appl. Meteorol. 1998, 37, 1250–1264. [Google Scholar] [CrossRef]
  13. Machado, L.A.T.; Duvel, J.P. Structural characteristics of deep convective systems over Tropcal Africa and Atlantic Ocean. Mon. Weather Rev. 1991, 120, 392–406. [Google Scholar]
  14. Berges, J.; Jobard, I.; Chopin, F.; Roca, R. EPSAT-SG: A satellite method for precipitation estimation; Its concepts and implementation for the AMMA experiment. Ann. Geophys. 2010, 28, 289–308. [Google Scholar] [CrossRef] [Green Version]
  15. Chadwick, R.S.; Grimes, D.I.F.; Saunders, R.W.; Francis, P.N.; Blackmore, T.A. The TAMORA algorithm: Satellite rainfall estimates over West Africa using multi-spectral SEVIRI data. Adv. Geosci. 2010, 25, 3–9. [Google Scholar] [CrossRef]
  16. Reed, R.J.; Jaffe, K.D. Diurnal variation of summer convection over west Africa and the tropical Eastern Atlantic during 1974 and 1978. Mon. Weather Rev. 1981, 109, 2527–2534. [Google Scholar] [CrossRef]
  17. Parker, D.J.; Burton, R.R.; Diongue-Niang, A.; Ellis, R.J.; Felton, M.; Taylor, C.M.; Thorncroft, C.D.; Bessemoulin, P.; Tompkins, A.M. The diurnal cycle of the west African monsoon circulation. Q. J. R. Meteorol. Soc. 2005, 131, 2839–2860. [Google Scholar] [CrossRef]
  18. Sall, S.M.; Viltard, A.; Sauvageot, H. Rainfall distribution over the Fouta Djallon–Guinea. Atmos. Res. 2007. [Google Scholar]
  19. Suchel, J.B.
  20. Mkankam, K.F.; Tsalefac, M.; Mbane, C.B. Variabilit´e pluviometrique sur le territoire Camerounais: Essai de regionalisation a partir des cumuls mensuels et du cycle annuel. Publ. Assoc. Int. Climatol. 1994, 7, 439–446. [Google Scholar]
  21. Penlap, K.E.; Matulla, C.; von Storch, H.; Mkankam, K.F. Downscaling of GCM scenarios to assess precipitation changes in the little rainy season (March–June) in Cameroon. Clim. Res. 2004, 26, 85–96. [Google Scholar] [CrossRef]
  22. Bennartz, R.; Schroeder, M. Convective activity over Africa and the tropical Atlantic inferred from 20 years of geostationary meteosat infrared observations. J. Clim. 2012, 25, 156–169. [Google Scholar] [CrossRef]
  23. Laing, A.G.; Carbone, R.E.; Levizzani, V. Cycles and propagation of deep convection over equatorial Africa. Mon. Weather Rev. 2011, 139, 2832–2853. [Google Scholar] [CrossRef]
  24. Hong, G.; Heygster, G.; Rodriguez, C.A.M. Effect of cirrus clouds on the diurnal cycle of tropical deep convective clouds. J. Geophys. Res. 2006, 111. [Google Scholar]
  25. Tian, B.; Soden, J., Brian; Wu, X. Diurnal cycle of convection, clouds, and water vapor in the tropical upper troposphere: Satellites versus a general circulation model. J. Geophys. Res. 2004, 109. [Google Scholar]
  26. Zuidema, P. Convective clouds over the bay of Bengal. Mon. Weather Rev. 2003, 131, 780–798. [Google Scholar] [CrossRef]
  27. Levizzani, V.; Bauer, P.; Turk, F.J. Measuring Precipitation from Space—EURAINSAT and the Future; Springer: Dordrecht, The Netherlands, 2007; Volume 28, p. 722. [Google Scholar]
  28. Goyens, C.; Lauwaet, D.; Schr¨oder, M.; Demuzere, M.; van Lipziga, N.P.M. Tracking mesoscale convective systems in the Sahel: Relation between cloud parameters and precipitation. Int. J. Climatol. 2011. [Google Scholar]
  29. Machado, L.A.T.; Laurent, H. The convective system area expansion over amazonia and its relationships with convective system life and high-level wind divergence. Mon. Weather Rev. 2002, 132, 714–724. [Google Scholar]
  30. Mohr, K.I.; Thorncroft, C.D. Intense convective systems in west Africa and their relationship to the African easterly jet. Q. J. R. Meteorol. Soc. 2006, 132, 163–176. [Google Scholar] [CrossRef]
  31. Shinoda, M.; Okatani, T.; Saloum, M. Diurnal variations of rainfall over Niger in the west African Sahel: A comparison between wet and drought years. Int. J. Climatol. 1999, 19, 81–94. [Google Scholar]
  32. Vondou, D.A.; Nzeukou, A.; Lenouo, A.; Mkankam Kamga, F. Seasonal variations in the diurnal patterns of convection in Cameroon–Nigeria and their neighboring areas. Atmos. Sci. Lett. 2010, 11, 290–300. [Google Scholar] [CrossRef]
  33. Nesbitt, S.W.; Cipelli, R.; Rutledge, S.A. Storm morphology and rainfall characteristics of TRMM precipitation features. Mon. Weather Rev. 2006, 134, 2702–2721. [Google Scholar]
  34. Schumacher, C.; Houze, R.A., Jr. Stratiform precipitation production over sub-Saharan Africa and the tropical East Atlantic as observed by TRMM. Q. J. R. Meteorol. Soc. 2006, 132, 2235–2255. [Google Scholar]
  35. Ba, M.B.; Frouin, R.; Nicholson, S.E. Satellite–derived interannual variability of west African rainfall during 1983-88. J. Appl. Meteorol. 1995, 34, 411–431. [Google Scholar] [CrossRef]
  36. Randall, D.; Harshvardhan, A.; Dazlich, D.A. Diurnal variability of the hydrologic cycle in a general circulation model. J. Atmos. Sci. 1991, 48, 40–62. [Google Scholar] [CrossRef]
  37. Gray, W.M.; Jacobson, R.W., Jr. Diurnal variation of deep cumulus convection. Mon. Weather Rev. 1977, 105, 1171–1188. [Google Scholar] [CrossRef]
  38. Mapes, B.E.; Warner, T.T.; Xu, M. Diurnal patterns of rainfall in Northwestern South America. Part III: Diurnal gravity waves and nocturnal convection offshore. Mon. Weather Rev. 2002, 131, 830–844. [Google Scholar]
  39. Houze, A.R., Jr. Mesoscale convective systems. Rev. Geophys. 2004, 42. [Google Scholar]
  40. Lenouo, A.; Monkam, D.; Mkankam Kamga, F. Variability of static stability over west Africa during northern summer 1979–2005. Atmos. Res. 2010, 98, 353–362. [Google Scholar] [CrossRef]
  41. Garcia-Carreras, L.; Parker, D.J.; Taylor, C.M.; Reeves, C.E.; Murphy, J.G. Impact of mesoscale vegetation heterogeneities on the dynamical and thermodynamic properties of the planetary boundary layer. J. Geophys. Res. 2010, 115. [Google Scholar]
  42. Laing, A.G.; Carbone, R.; Levizzani, V.; Tuttle, J. The propagation and diurnal cycles of deep convection in northern tropical Africa. Q. J. R. Meteorol. Soc. 2008, 134, 93–109. [Google Scholar] [CrossRef]
  43. Holton, J.R. An Introduction to Dynamic Meteorology, 3rd ed; Academic Press Inc.: Waltham, MA, USA, 1992; p. 591. [Google Scholar]
  44. Timouk, F.; Kergoat, L.; Mougin, E.; lloyd, C.R.; Ceschia, E.; Cohard, J.M.; de Rosnay, P.; Hiernaux, P.; Demarez, V.; Taylor, C.M. Response of surface energy balance to water regime and vegetation development in a Sahelian landscape. J. Hydrol. 2009, 375, 178–189. [Google Scholar] [CrossRef] [Green Version]
  45. Melani, S.; Pasqui, V.; Guarnieri, F.; Antonini, V.; Ortolani, V.; Levizzani, V. Rainfall variability associated with the summer African monsoon: A satellite study. Atmos. Res. 2010, 97, 601–618. [Google Scholar] [CrossRef]
  46. Redelsperger, J.L.; Diedhiou, A.; Janicot, S.; Sonneville, A.; Thorncroft, C. The International Science Plan for AMMA 2010–2020; Technical Report V2; AMMA: Toulouse, France, 2009. [Google Scholar]

