Article

Characterizing a New Surface-Based Shortwave Cloud Retrieval Technique, Based on Transmitted Radiance for Soil and Vegetated Surface Types

by
Odele Coddington
1,*,
Peter Pilewskie
1,2,
K. Sebastian Schmidt
1,
Patrick J. McBride
3 and
Tomislava Vukicevic
4
1
Laboratory for Atmospheric and Space Physics, University of Colorado Boulder, 3665 Discovery Drive, Boulder, CO 80305, USA
2
Department of Atmospheric and Oceanic Science, University of Colorado Boulder, 311 UCB, Boulder, CO 80309, USA
3
NASA Goddard Space Flight Center, Mail Code 613, Greenbelt, MD 20771, USA
4
Atlantic Oceanographic and Meteorological Laboratory, NOAA, 4301 Rickenbacker Causeway, Miami, FL 33149, USA
*
Author to whom correspondence should be addressed.
Atmosphere 2013, 4(1), 48-71; https://doi.org/10.3390/atmos4010048
Submission received: 19 December 2012 / Revised: 7 March 2013 / Accepted: 13 March 2013 / Published: 19 March 2013

Abstract

:
This paper presents an approach using the GEneralized Nonlinear Retrieval Analysis (GENRA) tool and general inverse theory diagnostics including the maximum likelihood solution and the Shannon information content to investigate the performance of a new spectral technique for the retrieval of cloud optical properties from surface based transmittance measurements. The cumulative retrieval information over broad ranges in cloud optical thickness (τ), droplet effective radius (re), and overhead sun angles is quantified under two conditions known to impact transmitted radiation; the variability in land surface albedo and atmospheric water vapor content. Our conclusions are: (1) the retrieved cloud properties are more sensitive to the natural variability in land surface albedo than to water vapor content; (2) the new spectral technique is more accurate (but still imprecise) than a standard approach, in particular for τ between 5 and 60 and re less than approximately 20 μm; and (3) the retrieved cloud properties are dependent on sun angle for clouds of τ from 5 to 10 and re < 10 μm, with maximum sensitivity obtained for an overhead sun.

Graphical Abstract

1. Introduction

The radiative energy incident at the Earth’s surface comes from two sources, the Sun and the atmosphere. Clouds are the predominant atmospheric constituent impacting the flow of this radiant energy by absorption and by scattering some of the incoming shortwave (300–4,000 nm) radiation to space, and by emitting infrared radiation. Clouds may either cool or warm the surface depending on their altitude (temperature), thickness and composition. While much has been learned about global cloud coverage, cloud top heights, optical thickness and droplet size from passive remote sensing, a determination on whether clouds will enhance or counteract warming temperatures in a changing climate has not yet been achieved [1].
Shortwave cloud reflectance results from scattering and absorption near cloud top. In contrast, transmitted cloud radiation, which can only be measured from below the cloud, interacts with all layers of a cloud [2], providing a unique perspective not available from space. McBride et al. [3] highlight advantages to ground-based retrievals of cloud properties from optical transmittance compared to satellite retrievals based on reflected cloud radiance: more direct retrievals of cloud properties for deriving the surface radiative forcing, and the improved capability for studying cloud and aerosol interactions that comes with the increased temporal resolution of ground-based transmittance measurements.
Regardless of the perspective from which the remote measurements are made, the radiative impacts of the clouds depend upon their optical thickness and droplet effective radius, the ratio of the third to second moment of the particle size distribution (e.g., [4]). Cloud properties can be derived from either reflectance or transmittance, but unlike reflected radiation, transmitted radiance is not a unique function of optical thickness. An additional disadvantage is the complete attenuation of transmitted radiance at large cloud optical thickness.
To improve the sensitivity of the retrieval to droplet effective radius, McBride et al. [3] developed a new algorithm for the retrieval of cloud optical properties based on the magnitude and shape of transmitted spectral radiance. Using error propagation methods, they investigated the impacts of measurement uncertainty on the retrieved cloud properties from the new spectral slope algorithm compared to the standard technique applied to cloud reflectance. They showed that the spectral slope method had smaller uncertainties over a broader range in cloud optical thickness values. However, McBride et al. [3] emphasized the need for a more formal error analysis treatment to investigate the impact of errors in the forward model inputs such as prescribed vertical cloud profile, thermodynamic phase, and underlying surface albedo on the retrieved cloud properties.
We employ the GEneralized Nonlinear Retrieval Analysis (GENRA) [5,6] to quantify the accuracy and precision of the cloud optical properties derived from measurements of transmittance. GENRA can be applied to retrieval methodologies based on least squares minimization techniques to derive the maximum likelihood solution and the Shannon information content [7]. These diagnostics typically result from statistical inverse theory approaches, such as Bayes’ Theorem [8]. Guided by these quantitative metrics of information content, we evaluate the slope and standard method under assumptions of realistic measurement errors and forward modeling input uncertainty in water vapor and surface albedo variability (from bare soil to purely vegetated surfaces) over a broad range in solar zenith angle.
Shannon information content (SIC) analysis of shortwave cloud retrievals has been applied in other recent studies. L’Écuyer et al. [9] and Cooper et al. [10] applied it across the visible through the infrared for the purposes of channel selection for retrieving water and ice cloud properties. Vukicevic et al. [5] used it to investigate the cumulative information gain in water cloud retrievals by adding spectral channels. Coddington et al. [6] expanded on this work and quantified the information content in hyperspectral cloud albedo measurements at nearly 400 wavelengths between 300 and 2,500 nm and also analyzed the retrieval wavelengths and weightings, and the cumulative retrieval information of a 5-wavelength cloud retrieval statistic. King and Vaughan [11] investigated the information content in the retrieval of the vertical profile of cloud droplet effective radius, determining that hyperspectral cloud reflectance measurements offer improved details of cloud vertical structure over discrete-band instruments.
In this study we define the transmittance retrieval methods and wavelengths (Section 2). We then introduce the modeling and analysis tools used in the study: the forward modeling calculations of transmittance (Section 3.1) and the GENRA tool (Section 3.2) used for investigating the random and systematic sources of measurement and forward modeling errors on the retrieved cloud properties (Section 4). In our results (Section 5), we demonstrate the expected cloud retrieval performance to these measurement and modeling errors (Section 5.1, Section 5.2), compute retrieval biases and Shannon information content over a broad range in cloud optical thickness and droplet effective radius (Section 5.2.1), investigate non-Gaussian behavior in the retrieved distributions (Section 5.2.2), and investigate the impacts of sun angle on the error characteristics and retrieved cloud products (Section 5.2.3). A summary of the work is provided in Section 6.

2. Surface-Based Cloud Retrieval Methods Based on Transmitted Radiation

In the visible and very near-infrared (approximately 350–1,000 nm) where liquid water does not absorb, cloud reflectance and transmittance depend primarily upon the cloud optical thickness through scattering. In the near-infrared, liquid water absorption increases and scales with the product of the bulk absorption coefficient and cloud droplet or ice crystal size. This forms the basis of the standard retrieval used in many operational satellite cloud retrievals to date ([4,12], and many others). Cloud optical thickness and particle size are not entirely separable in the inverse solution because there is a dependency on cloud optical thickness even at wavelengths where water absorbs. However, as clouds become increasingly optically thick, reflectance at non-absorbing wavelengths depends almost entirely on optical thickness while that at absorbing wavelengths almost entirely on droplet radius (see McBride et al., Figure 3(a) of [3]).
With surface measurements of zenith cloud radiance, a one-to-one mapping of cloud optical thickness to transmittance does not exist [3]. Downward diffuse radiance increases with optical thickness up to an optical thickness of about 5, beyond which it decreases. Droplet size has opposing impacts on cloud transmittance; a larger particle increases forward scattering but also absorbs more [3]. The attenuation of the signal with increasing optical thickness and the ambiguity in the retrieved cloud properties due to the opposing impacts of scattering and absorption makes the retrieval of droplet effective radii more difficult with measurements of transmittance versus reflectance.
We use a measurement-based definition of transmittance, T, defined as the ratio of transmitted zenith radiance (Itrans; units W·m−2·nm−1·sr−1) and normal incident solar radiance, μ0F0, at the top of the atmosphere (Equation (1)), where μ0 is the cosine of the solar zenith angle. The surface and the atmosphere below and above the cloud will contribute to the downwelling radiation through multiple reflections of the incoming radiation. Therefore, transmittance as defined here and used throughout the paper, is not solely determined by the cloud layer.
Atmosphere 04 00048 i001
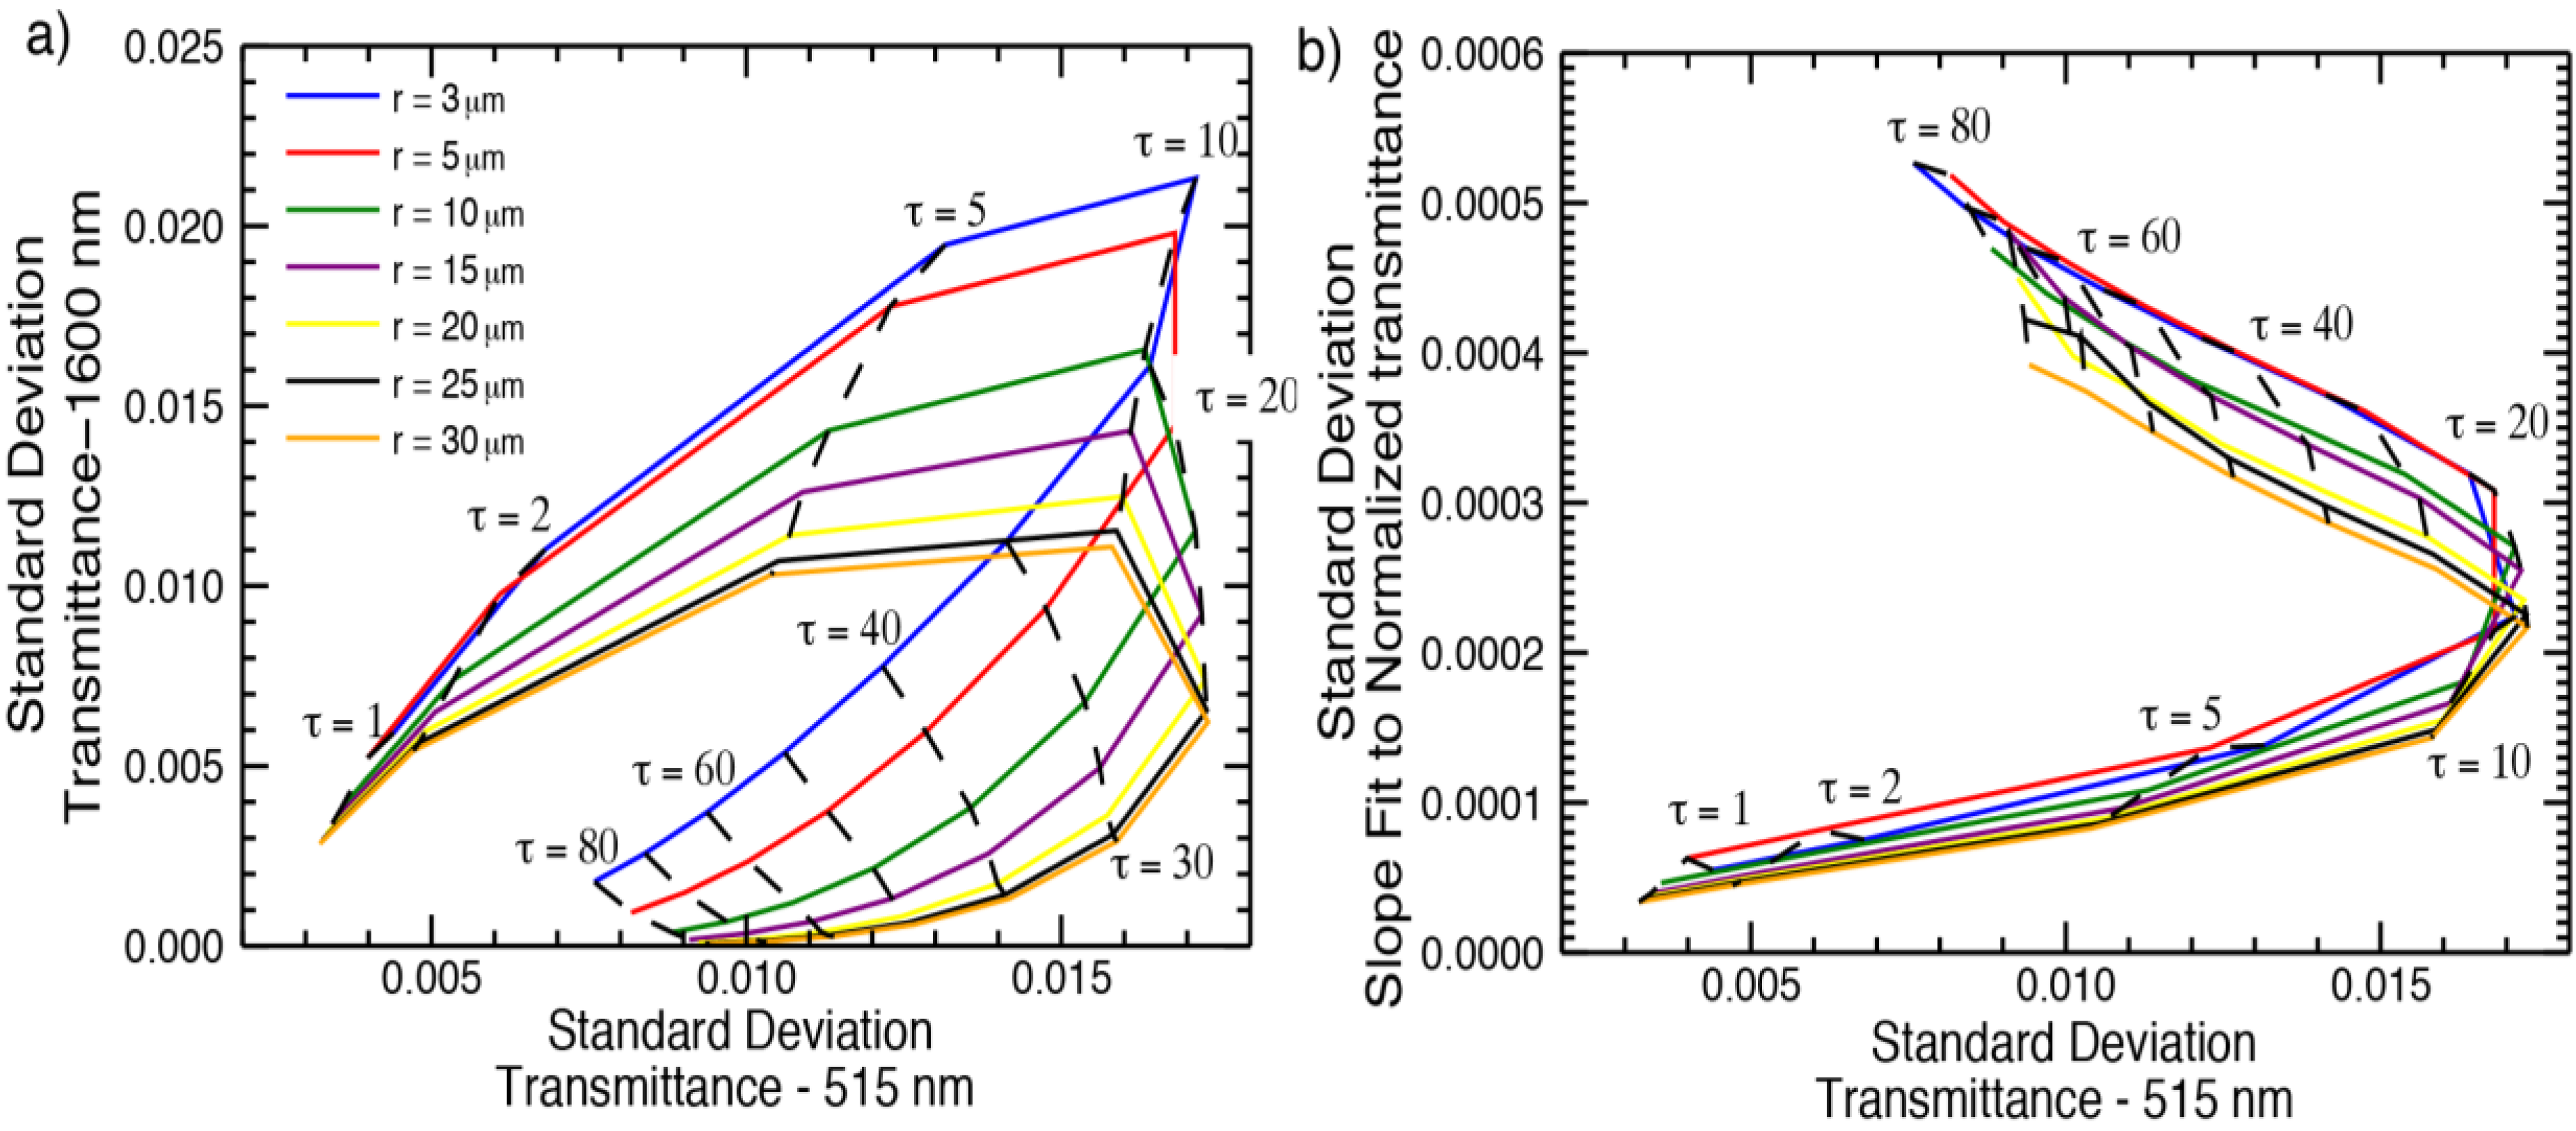
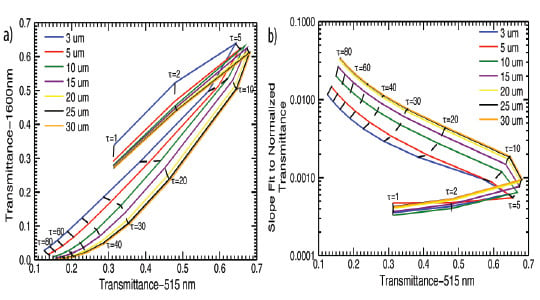
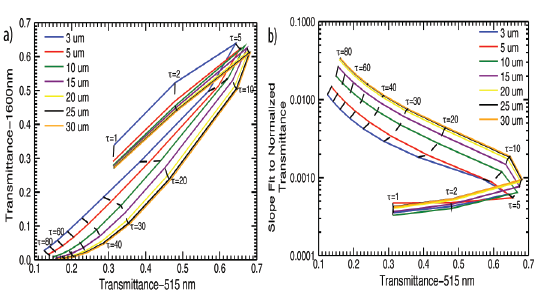
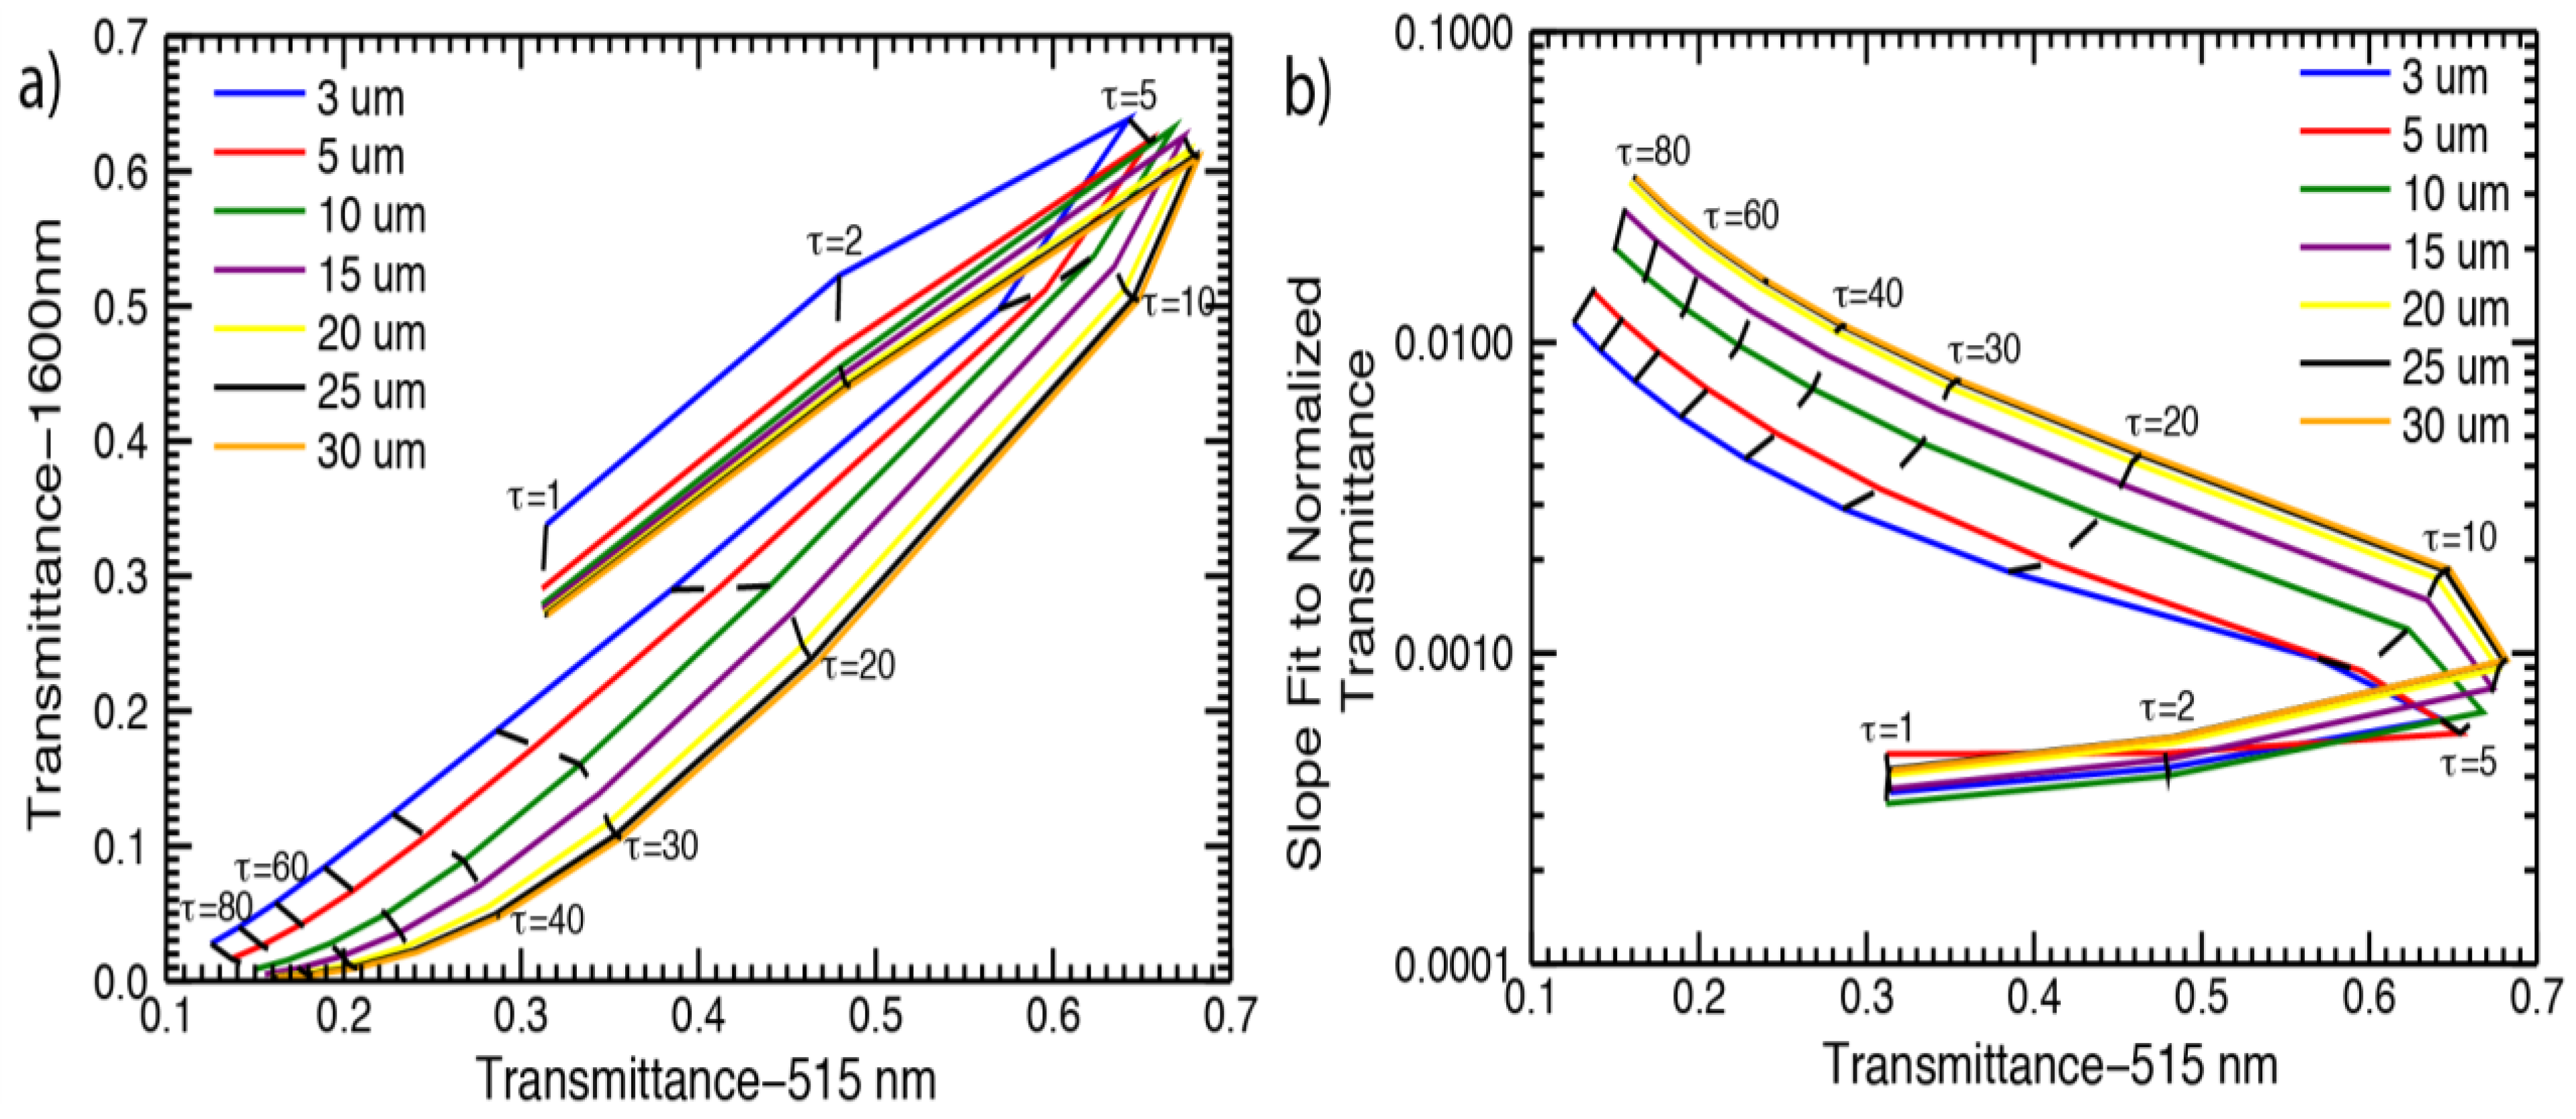
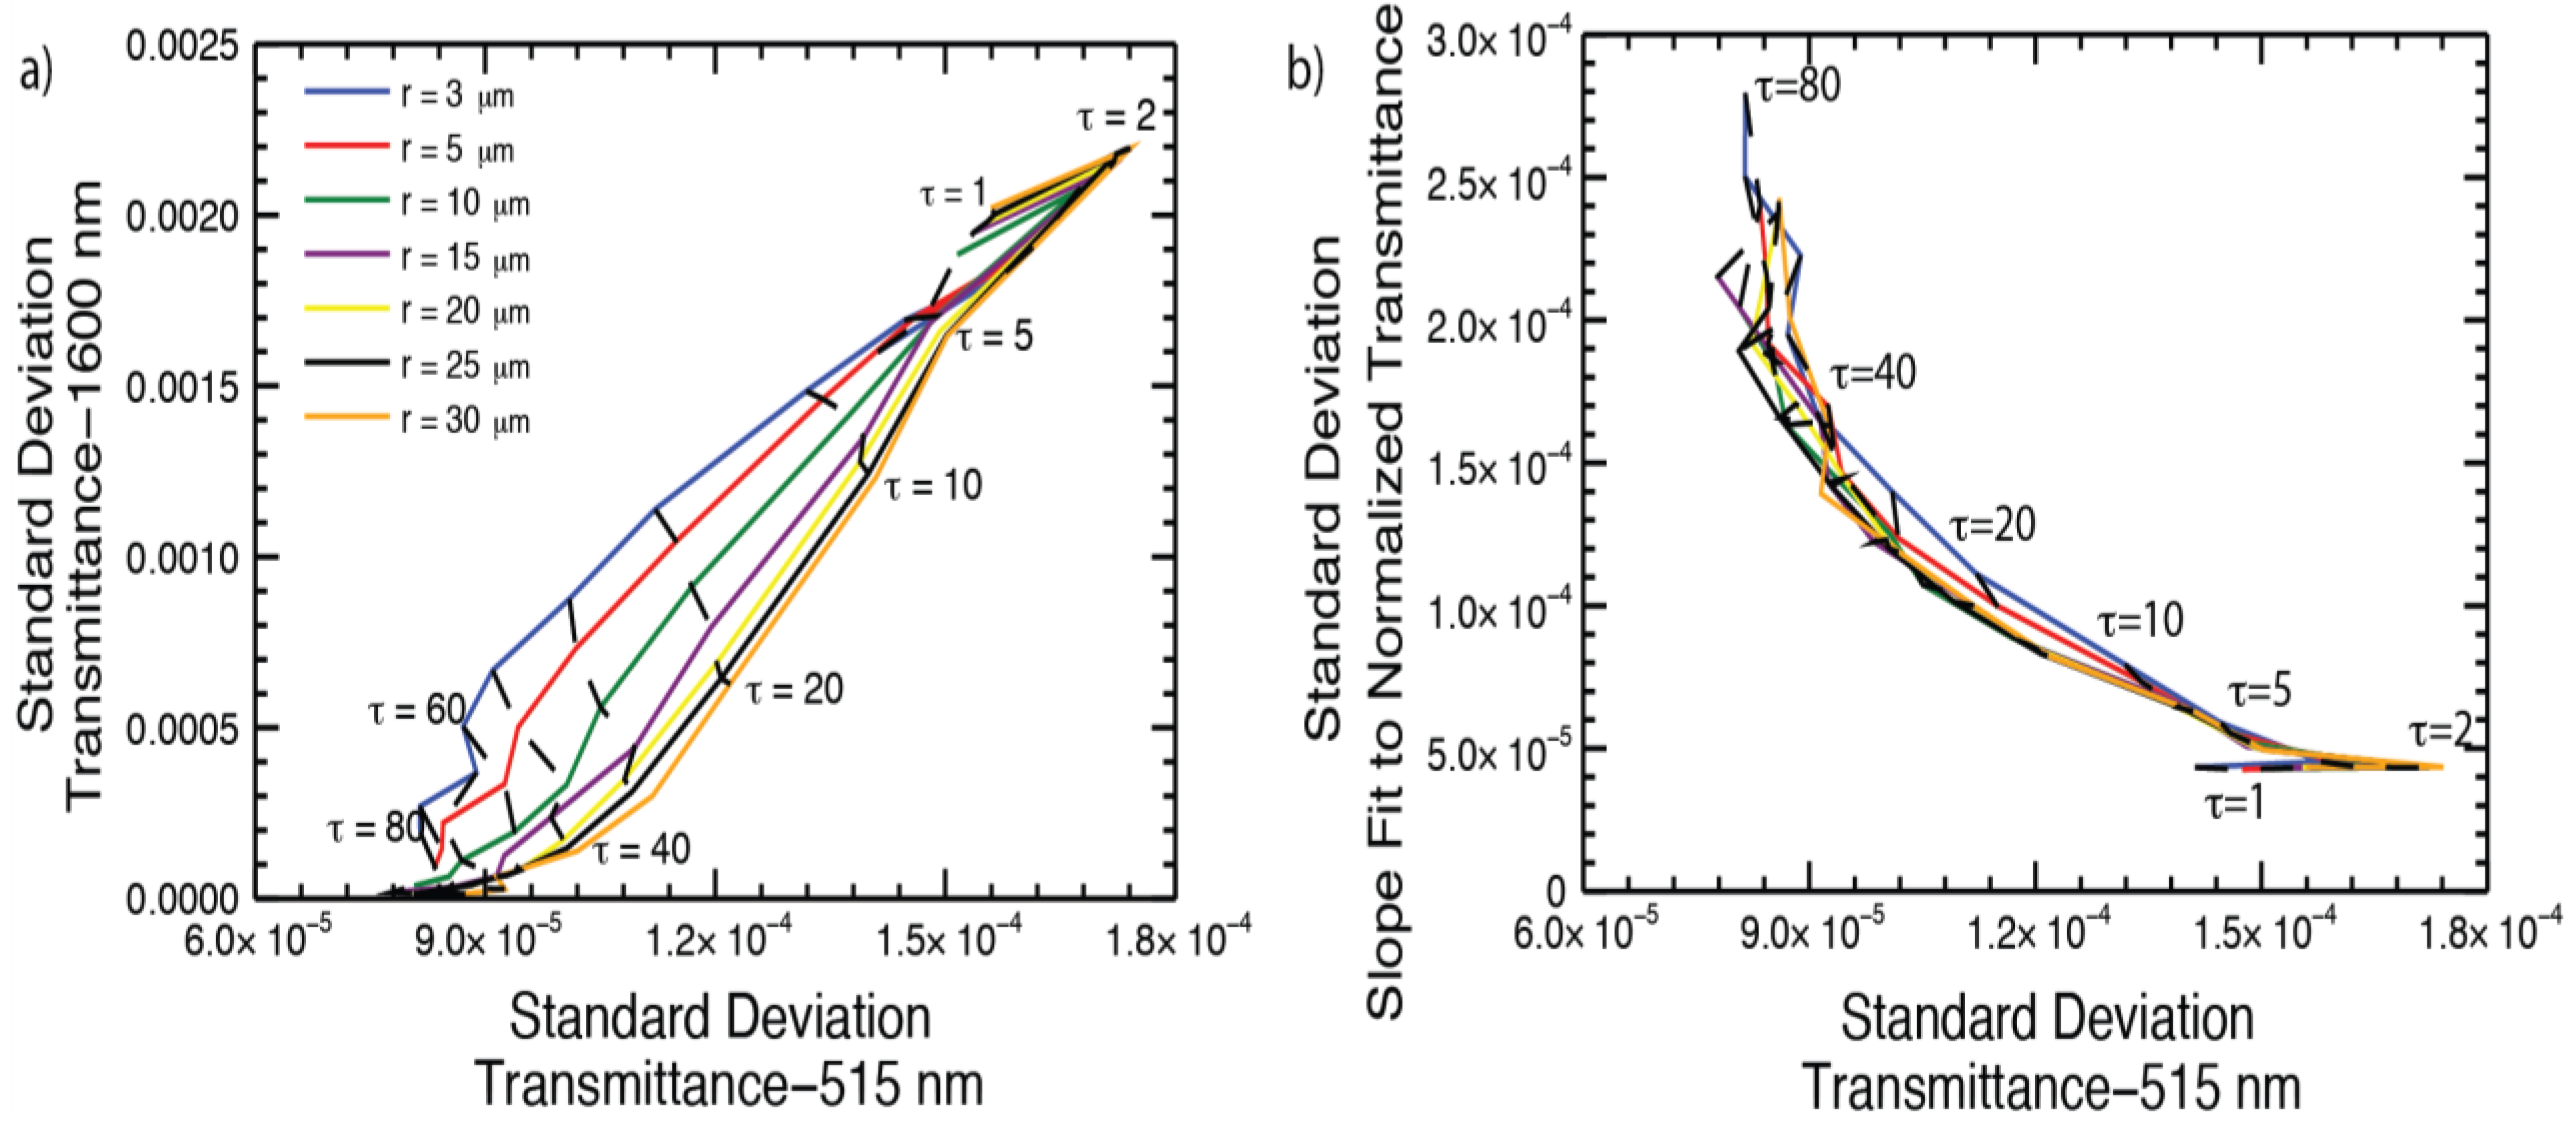
Figure 1(a) illustrates the non-monotonic behavior of transmittance measurements at a visible (515 nm) and a near-infrared wavelength (1,600 nm) as a function of cloud optical thickness (τ) and droplet effective radii (re). This forms the basis of the standard cloud retrieval method applied to spectral transmittances. One value of transmittance at 515 nm can arise from a cloud of two different optical thicknesses. In addition, for cloud optical thickness less than about five and effective radii greater than 3 μm, the lines of constant effective radius are clustered indicating relative insensitivity to droplet size. The calculations are performed for μ0 = 0.75 and for a vegetated surface.
Figure 1. (a) Look-up table of transmittance for standard method and (b) for slope method. Solid, colored lines are constant effective radius lines. Dashed, black lines are constant optical thickness lines. Calculations are for μ0 = 0.75 and a vegetated surface albedo.
Atmosphere 04 00048 g001
The impacts of surface albedo on transmittance are demonstrated through a direct comparison to McBride et al., Figure 3(b) of [3], which shows a look-up table of transmittance (at 515 nm and 1,628 nm) at the same solar angle, but for an ocean surface.
Note that the cloud optical thickness defined in the forward calculations used to generate the look-up tables plotted in Figure 1 is treated as wavelength independent. Cloud optical thickness varies only weakly over the spectral range considered in this study, generating a retrieval uncertainty less than that due to measurement error, and thus is ignored. Further refinements of these methods and improvement in measurement accuracies may require the wavelength dependency in optical thickness to be taken into account in future studies.
To improve the sensitivity to droplet effective radius, McBride et al. [3] developed a cloud retrieval based on the transmittance at 515 nm and the slope of transmittance between 1,565 nm and 1,634 nm, normalized by the transmittance at 1,565 nm. Over this near-infrared range, because the bulk absorption coefficient of water is greatest at 1,565 nm, transmittance increases from 1,565 nm to 1,634 nm. The normalization of transmittance at one wavelength reduces the retrieval non-uniqueness to optical thickness and reduces systematic calibration errors. This forms the basis of the spectral slope cloud retrieval method applied to transmitted spectral radiance.
The retrieval wavelengths were carefully chosen (a) to be outside the strong gas absorption bands (predominantly water vapor) so differences between modeled and measured gas absorption do not impact the cloud retrieval, and (b) to exhibit linear behavior in transmittance over a broad range in cloud optical thickness and effective radius. Figure 5 of [3] by McBride et al. illustrates modeled transmittance at four different cloud optical thicknesses and two effective radii per optical thickness. The spectral dependencies in the transmittance are a factor of scattering and absorption by the cloud and by atmospheric molecular gases (discussed further in Section 3.1 and references therein) and by the surface albedo. Cloud scattering and absorption are driven by the cloud optical properties; for example, Figure 4 of [3] by McBride et al. illustrates the wavelength dependence of two cloud optical properties: co-albedo, or one minus the single scattering albedo (indicative of absorption) and asymmetry parameter (indicative of the directional scattering).
Figure 1(b) illustrates the behavior of transmittance measurements at 515 nm and the slope fit to the normalized transmittance at 1,600 nm as a function of cloud optical thickness and droplet effective radius. The results shown in Figure 1(b) were performed for a vegetated surface and μ0 = 0.75. They can be directly compared to similar results (Figure 7 of [3]) for an ocean surface to investigate the impact of surface albedo on transmittance.
Throughout the remainder of this work, we apply the definitions of McBride et al. [3] where the standard retrieval refers to transmittance (defined per Equation (1)) at 515 nm and 1,600 nm. The slope method refers to transmittance at 515 nm and the fit of the slope of normalized transmittance at 13 wavelengths between 1,565 nm and 1,634 nm (normalized by transmittance at 1,565 nm).

3. Modeling and Analysis Tools

3.1. Radiative Transfer Calculations

For cloud optical thickness from 1 to 100 and droplet effective radius from 1 to 30 μm, we simulated vertically resolved measurements of the upwelling and downwelling spectral irradiance (W·m−2·nm−1) and nadir and zenith radiance (W·m−2·nm−1·sr−1) in a cloudy atmosphere using a plane-parallel radiative transfer model. The calculations were performed with a variable step size in optical thickness from 0.5 to 100 and 1 μm in effective radius followed by interpolation from the initial coarse optical thickness step size to unit resolution [6]. These simulations formed the basis of the look-up table, which were used to retrieve, or indirectly map a measurement of cloud reflectance or transmittance to the cloud optical thickness and effective radius by some measure of best fit between the calculated and measured values. This approach has a long history (for example [4,12], and many others) and was the procedure also followed by McBride et al. [3] using the same radiative transfer model as described in this work. In the statistical inverse model, GENRA, the look-up table is the transfer function that maps the variables in measurement space to the variables in parameter space. GENRA is described in further detail in Section 3.2.
The plane-parallel radiative transfer model [13,14] uses the Discrete Ordinates Radiative Transfer (DISORT) solver [15] and covers a wavelength range from 300 to 2,500 nm, with 1 nm sampling resolution and 8 to 12 nm spectral resolution [14,16]. Atmospheric molecular absorption of oxygen, ozone, carbon dioxide, water, and methane is computed with the correlated-k distribution method [17]. Top-of-atmosphere solar irradiance spectrum is from Kurucz [18]; the surface spectral albedo is for a vegetated surface [19]. Vertical profiles of atmospheric state (temperature, pressure, density) are from a standard mid-latitude summer profile [20].
The cloud droplet extinction, single-scattering albedo, and the first 16 moments of the Legendre series coefficients of the scattering phase function were computed using a Mie scattering code [21]. The probability density function of the cloud droplet size was a gamma distribution [22] with an effective variance of 0.1. The cloud top height is 2 km.
For μ0 at 1.0, 0.866, and 0.5, we computed transmittance (Equation (1)) for the 3,030 pairs of cloud optical thickness and effective radius. The calculations included corrections for the Sun-Earth distance on 1 June 2012. However, the transmittances presented in this work are entirely modeling based as described in this section.

3.2. GEneralized Nonlinear Retrieval Analysis (GENRA)

In the look-up table approach to cloud retrievals described above, the cloud optical properties are determined by a best-fit solution between the measured and calculated values of cloud reflectance or transmittance. Retrieval errors are typically evaluated through error propagation methods. An alternative approach is to apply error estimation theory [8], where errors in the input statistics (e.g., radiance, irradiance) are transformed into uncertainties in the output statistics (e.g., cloud optical thickness and effective radius), by taking into account the errors attached to each non-retrieved parameter used in the forward model (i.e., the radiative transfer code). Error estimation requires either Gaussian assumptions in the distribution shape of the output statistics in order to analytically solve for the distribution parameters (i.e., the optimal estimation method [8]) or use of a Monte Carlo solver if the output distribution shape is not known or is not Gaussian.
The GEneralized Nonlinear Retrieval Analysis (GENRA) [5,6] provides an alternate approach to characterizing retrievals without assuming the Gaussian error statistics while avoiding the computational expense of a Monte Carlo solution. GENRA is based on the inverse problem theory [23] and is similar to Bayesian statistical estimation theory [24]. It combines unique probability density functions (pdfs) representing each of the (1) modeled states, (2) observed state and, (3) prior knowledge about the parameters of interest. When these pdfs are combined, the solution, or joint posterior pdf, represents the most complete knowledge of the parameters. Here we provide an overview of the GENRA approach and explain how the properties of the joint posterior pdf explicitly determine the accuracy and precision of the retrieved cloud properties through application of routine retrieval diagnostics available to all statistical inverse methods: the maximum likelihood solution, the statistical mean of the marginal pdfs (to be defined) and the Shannon information content. The joint posterior pdf is dependent upon the prescribed error characteristics of the modeled and observed pdfs.
GENRA requires a look-up table as the discretized transfer function [23] between every model solution, f(x), in the measurement space, D, to every value of the parameter, x, in the parameter space. Given a measurement, y, solving for the parameters of interest requires an inverse solution to the relation y = f(x; b) + ε. Here b denotes the non-retrieved parameters that are inputs to the forward model and ε is the measurement noise. Therefore, realistic distributions of simulated observations (i.e., the model pdfs), p1(f(τ, re)|(τ, re)), are a function of a joint space of measurements and parameters where each discrete grid point of the look-up table represents the true values. Hence, a 1-dimensional pdf for each τ, re pair in the look-up table will represent the uncertainties in simulated transmittance that originate from the uncertainties in the model inputs other than τ and re. In general, these could include, for example, profiles of atmospheric state, surface albedo, and assumptions of plane-parallel behavior.
Realistic distributions of measurements (i.e., the 1-dimensional measurement pdf), p2(y), are formulated by including systematic and random measurement error characteristics and are interpreted as probabilities of the measurement taking possible values within the measurement uncertainty range. Similarly, 1-dimensional distributions of prior knowledge (i.e., the a priori pdf), p2(τ, re) represent probabilities of the parameters taking values from a range of physically plausible values. A uniform distribution indicates no a priori information about the parameters, other than that they exist.
The joint posterior solution to the generalized inverse problem is represented by the integration over the measurement space, D, of the combination of the measurement, model, and a priori pdfs as shown in Equation (2). 1/γ is a normalization constant.
Atmosphere 04 00048 i002
The GENRA algorithm introduces measurements at each retrieval wavelength sequentially. At each incremental step, the pdfs on the right hand side of Equation (2) are computed. The spectral ordering in which the measurements are introduced is irrelevant to the joint posterior pdf. The combination of the model pdfs (i.e., one pdf for every grid point of the τ, re look-up table) and the measurement pdf results in the discrete representation of the likelihood function [8,24]. The likelihood function is the 2-dimensional representation of overlap between the measurement pdf and the grid of model pdfs in the τ and re space; the grid point with the greatest intersection or overlap between its model pdf and the measurement pdf will have the highest likelihood. In regions with no overlap, the likelihood function will be zero. In a final step, the multiplication of this likelihood function with the a priori knowledge pdf on the grid of τ and re forms the joint posterior pdf, p(τ, re).
There are two approaches to the treatment of the a priori pdf, and the choice determines whether the impact of each measurement, sequentially introduced into the algorithm, is assessed cumulatively or individually. In the first approach, the a priori knowledge is always assigned a uniform distribution. This is a non-informative a priori pdf and the resulting posterior pdf at each sequential solution to Equation (2) would characterize the retrieval from that measurement alone. The second approach, the one applied in this analysis, is to begin with a uniform a priori distribution and then update the a priori knowledge at each step with the posterior pdf from the previous step. The resulting posterior pdf, after all measurements have been introduced into the algorithm, would characterize the retrieval from the combined effect of all measurements. The different treatments of the a priori pdf [5,6] illustrate how unique insight for the characterization of retrieval methods is gained and demonstrate the information contained in the different spectral bands.
The joint posterior pdf contains the information about the probability of the discrete values of τ and re, given the knowledge of measured and possible modeled states and their associated error characteristics, and prior knowledge of the parameters. The most likely value, or greatest probability of the retrieved τ, re pairs, is equivalent to the maximum likelihood solution. Shifts in the maximum likelihood solution from the ‘truth’ are one way to represent the expected retrieval bias. Alternatively, the statistical mean (or mode) and error variance of the unconditional probability densities known as the marginal pdfs (defined in Equations (3) and (4) in cloud optical thickness and effective radius could be chosen instead to represent the retrieved cloud properties. When the posterior pdf is Gaussian distributed, the maximum likelihood solution will be equal to the mean.
Atmosphere 04 00048 i003
Atmosphere 04 00048 i004
The Shannon information content [7] quantifies the error variance of the posterior (or marginal) pdfs, thereby providing a measure of the information gained in the posterior state relative to some prior state; it is the reduction in uncertainty in each parameter relative to the prior knowledge. The maximum theoretical Shannon information content for GENRA analysis, is dependent upon the number of elements in the look-up table [6], allowing results to be normalized and presented on a scale from 0 to 1. Shannon information content is inversely related to error variance. In our analysis and for the specific case of droplet effective radius, Shannon information content of 0 would indicate the retrieval provided no ability to identify a solution out of the 30 possible choices (for a re range from 1–30 μm in 1 μm increments). Conversely, Shannon information content of unity indicates the re solution is completely resolved at one element. The theoretical maximum of the Shannon information content of the joint posterior pdf is equal to the sum of the theoretical maximums in Shannon information content of the marginal distributions [6]. Prescribed model conditions, as in this work, or independent measurements are required to identify whether the probability is centered on the correct solution. Knowledge of the statistical mean, mode, or maximum likelihood solution along with the Shannon information content provides quantitative measures of retrieval accuracy and precision.

4. Representation of Error Sources

Uncertainty in the retrieved parameters can come from measurement errors and from errors in the input parameters to the radiative transfer model that is used to simulate the measurements. An additional source of errors is the approximations inherent to the radiative transfer model itself, such as plane-parallel assumptions. In this work, we investigate the error contributions of the first two sources.
In assigning the measurement pdf, we assume the simulated SSFR measurements are subject to a 3% systematic radiometric error offset [3,16] from the true value represented by the radiative transfer model result of the look-up table. We also assume the measurements are Gaussian distributed with a spectrally dependent variance of 0.03%–0.2% due to dark current noise. This approach is similar to Coddington et al. [6]. GENRA does not require assumptions of Gaussian distributed errors, but this is typically assumed with measurement errors.
We also investigate the impact of uncertainty due to natural variability in forward model inputs on the simulated transmittance. In this study, we derive the sensitivity of the transmitted cloud radiation to water vapor amount and to the magnitude and spectral shape of the underlying surface albedo only. The sensitivity in the transmittance to these variables will have spectral, cloud property, and solar angle dependencies. We report the sensitivities as standard deviations in the transmittance and the spectral slope of the transmittance relative to the baseline calculations discussed in Section 3.1. The sensitivities are used in defining Gaussian distributions of the model pdfs.
Coddington et al. [6] (Figure 1) computed the relative standard deviation (standard deviation divided by the mean) of cloud albedo due to a ±30% change in water vapor, ocean surface albedo, and profiles of state (pressure, temperature, and density). We utilize this same set of vertically resolved calculations to determine the impacts of total column water vapor variability on the simulated transmittance, as a function of cloud τ and re and wavelength. Figure 2 shows the look-up table of the standard deviation in transmittance due to ±30% water vapor variability and +3% systematic measurement error for (a) the standard method, and (b) the slope method.
Figure 2. Standard deviation in transmittance as a function of τ and re for (a) the standard method and (b) spectral slope method due to a +3% systematic measurement error and ±30% change in water vapor. Calculations shown are for μ0 = 0.92 and an ocean surface albedo. Plot details are as described in Figure 1.
Atmosphere 04 00048 g002
The sensitivities provided in Figure 2 are to be interpreted with respect to the transmittance values provided in Figure 1. For example, transmittance values of 0.45 and 0.28 at 515 nm and 1,600 nm, respectively correspond to a cloud with optical thickness of approximately 20 and an effective radius of approximately 10 μm (Figure 1(a)). The standard deviation in the transmittance for this τ, re pair due to ±30% variability in water vapor is approximately 0.0001 at 515 nm and an order of magnitude greater at 1,600 nm (Figure 2(a)).
Transmitted radiation is dependent on the albedo of the surface surrounding the instrument and preliminary calculations by McBride et al. [3] suggested the retrieval of cloud droplet effective radius can vary by up to 11% depending on the magnitude and spectral shape of the surface albedo used as input for the radiative transfer calculations. 
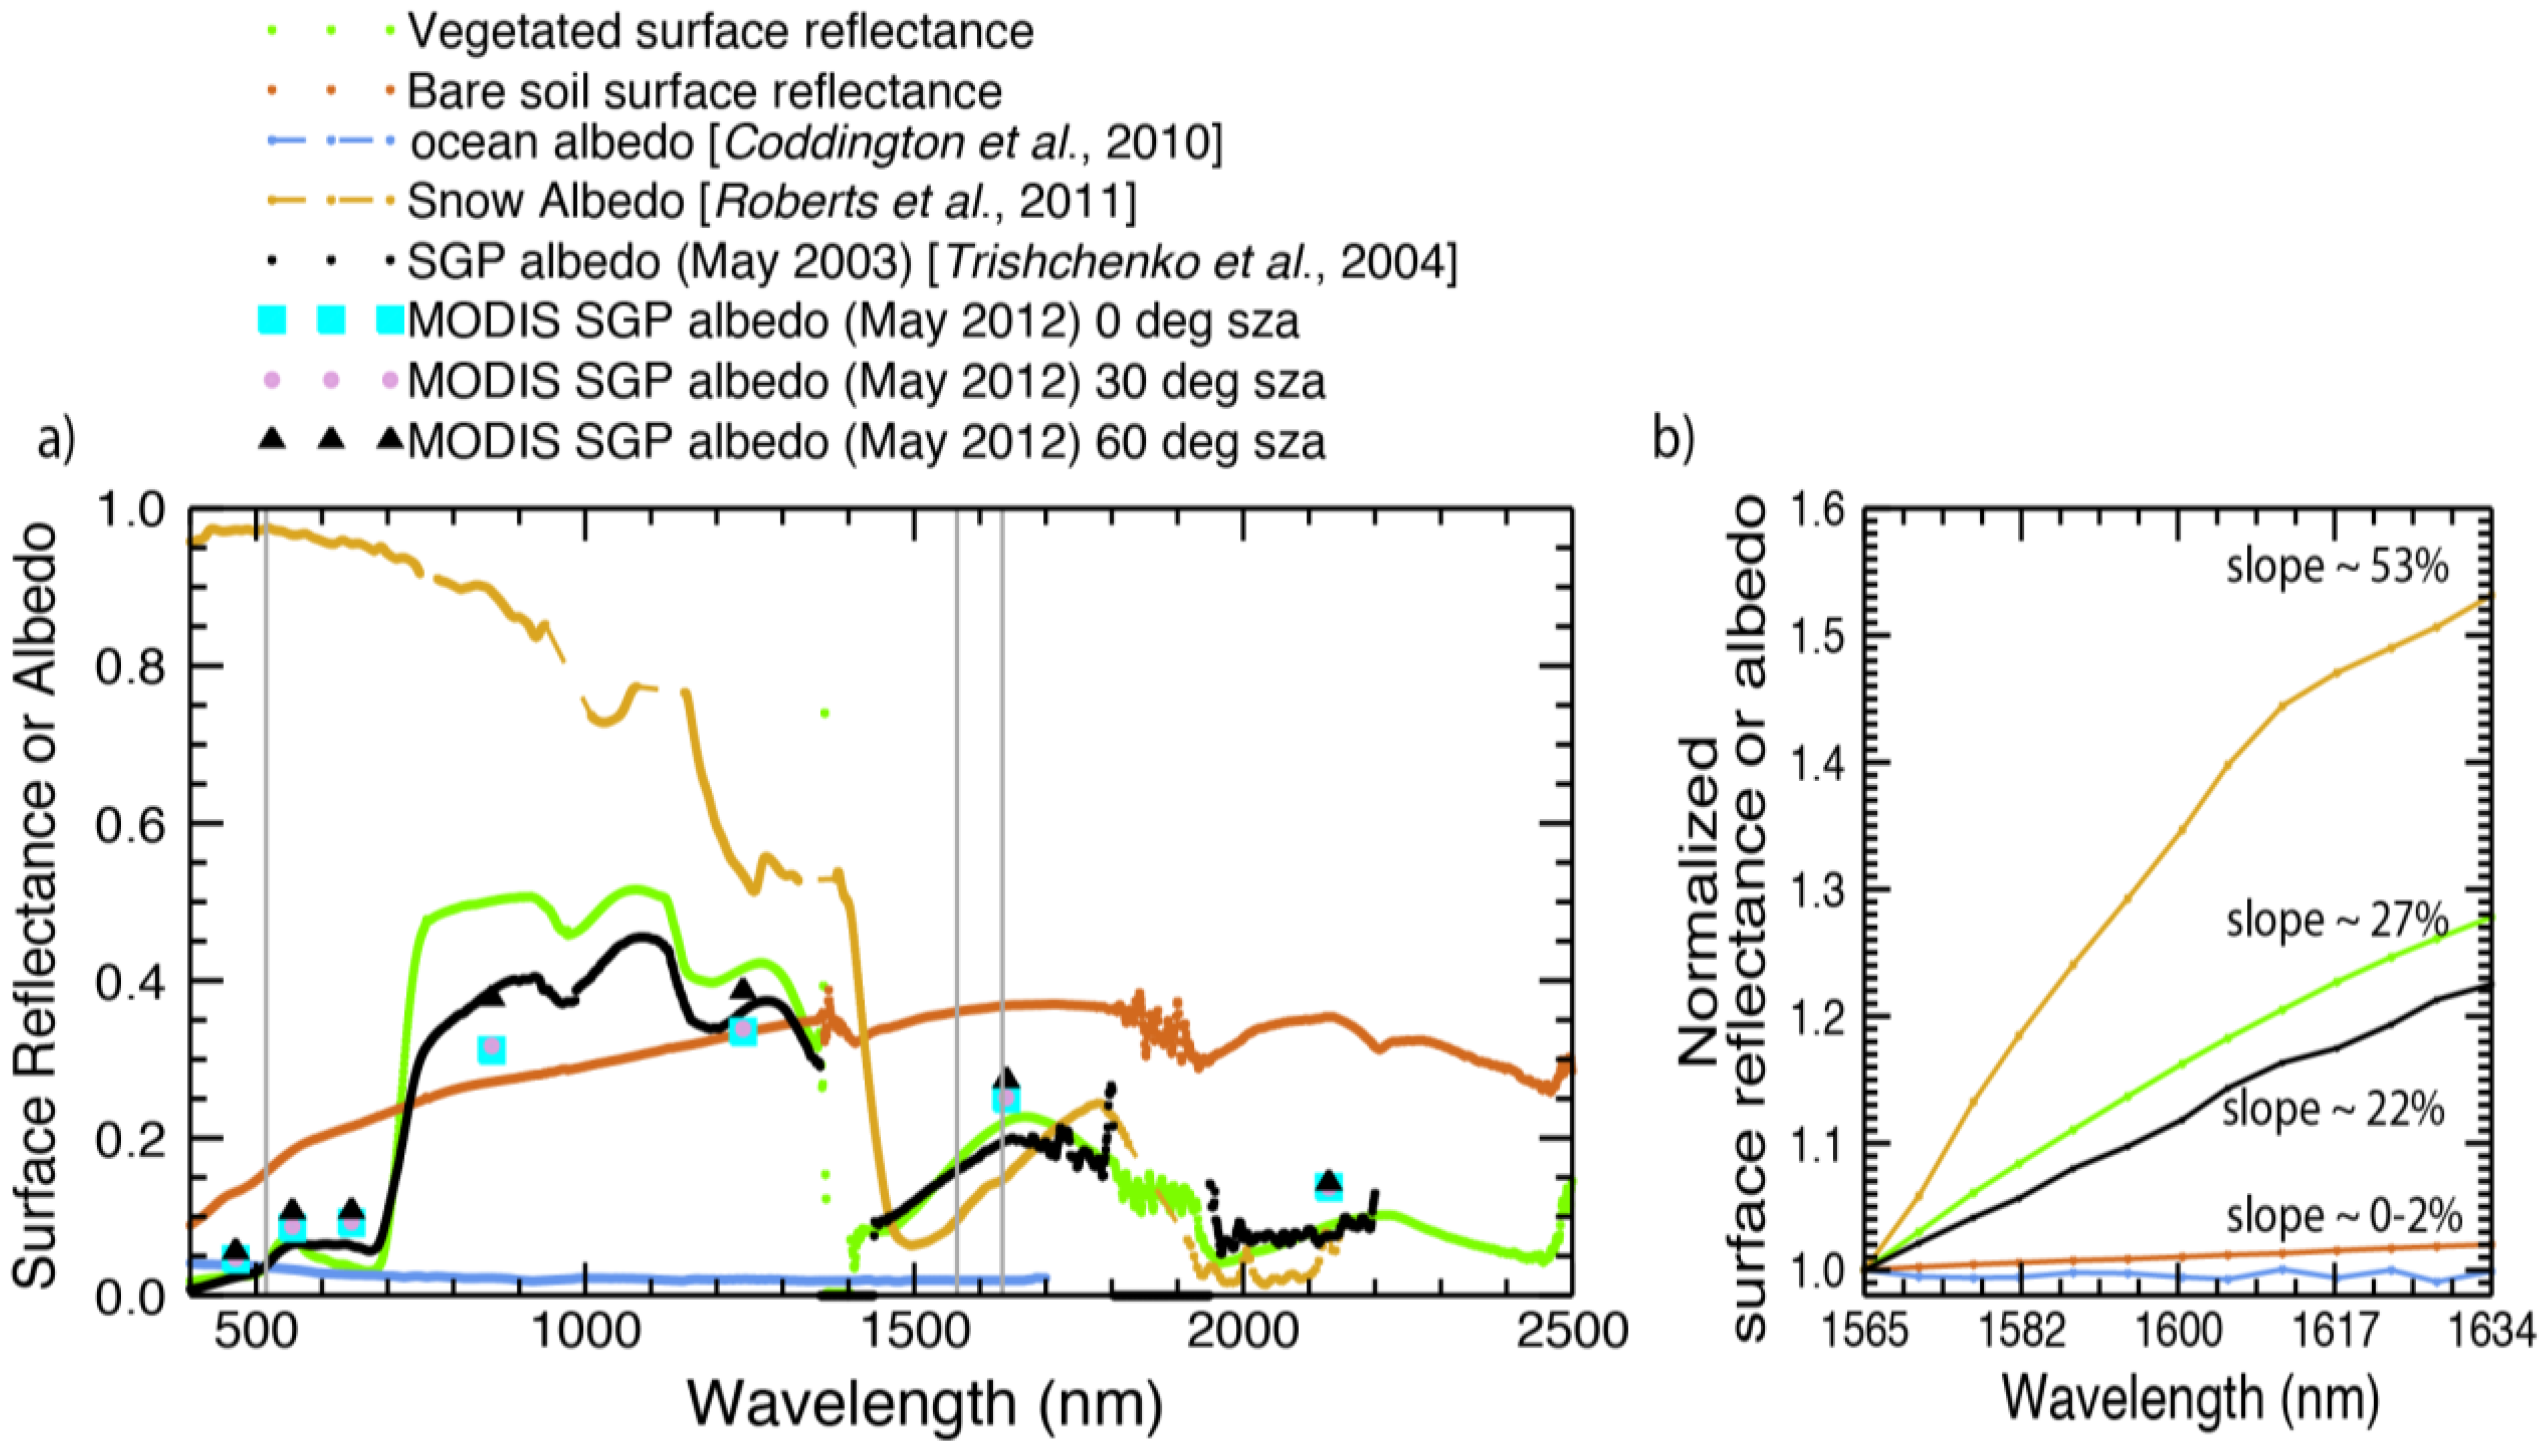
Figure 3(a) shows the large variability in magnitude and spectral shape of surface albedo and nadir surface reflectance between 400 nm and 2,500 nm (1,700 nm for ocean albedo example) for a variety of typical surface types. For a Lambertian surface, the spectral surface reflectance and albedo are essentially equivalent [25,26] and validation studies comparing the surface reflectance retrieved from satellite measurements using a Lambertian assumption to ground-based measurements show good agreement with residual standard errors of approximately 0.02 [27].
Figure 3. (a) Measured and retrieved spectral albedo and reflectance of common surface types from different geographic regions at different times. The data are from ground-based (vegetated and bare soil reflectances), airborne (ocean, snow, and vegetated Southern Great Plains (SGP) site in Oklahoma), and satellite measurements (vegetated SGP site; shown at three solar zenith angles—see text). Vertical grey lines denote the location of the 515 nm and 1,565 nm–1,634 nm retrieval wavelengths. (b) Spectral slopes of the albedo and reflectance between 1,565 nm and 1,634 nm, normalized by the respective albedo or reflectance at 1,565 nm.
Atmosphere 04 00048 g003
The measured and retrieved surface albedo spectra shown in Figure 3(a) were obtained over different times and geographical regions of the continental United States and from different ground, aircraft, and satellite platforms. The Southern Great Plains (SGP) May 2003 surface albedo spectrum (black curve) was retrieved from airborne SSFR measurements during the ARM Aerosol Intensive Observational Period [19] and is the baseline surface albedo used in the forward modeling calculations of this work. The region around SGP is largely agricultural wheat fields that undergo intensive greening in the spring [19]. The green vegetation signature near 550 nm and the near-infrared edge distinctive of vegetated surfaces are clearly seen. The ocean surface albedo (blue curve) was retrieved from airborne SSFR measurements above the northwestern Atlantic Ocean during the International Consortium for Atmospheric Research on Transport and Transformation (ICARTT) field campaign in 2004 [28]. It has a uniformly low albedo, less than 0.04 between 350 and 1,700 nm. The snow albedo spectrum (yellow curve), also from airborne SSFR measurements, was acquired during the Arctic Research of the Composition of the Troposphere from Aircraft and Satellites (ARCTAS) field campaign in Alaska [29,30]. It exhibits near unity albedo values at visible wavelengths before changing to the magnitudes and spectral shape similar to those of vegetated surfaces at 1,600 nm. The bare soil (brown curve) and vegetated (green curve) reflectance spectra are from nadir measurements made with an Analytical Spectral Devices (ASD) spectrometer [31]. Gaps in the spectra indicate regions of low detector sensitivity or low signal in gas absorption bands. The bare soil spectrum is relatively flat, in comparison to snow or vegetated surfaces and at near-infrared wavelengths greater than approximately 1,400 nm, soil has the greatest magnitude of albedo and reflectances for the surface types shown. Finally, discrete symbols (blue squares, pink dots, and black triangles) show the solar zenith angle dependency (0°, 30°, and 60° respectively) of surface albedo at the SGP site derived from bidirectional reflectance distribution function (BRDF) measurements made by the Moderate Resolution Spectroradiometer (MODIS) instrument [32]. These discrete band surface albedos were computed from a 16-day climate model gridded BRDF product (MOD43C) obtained from 8 May to 1 June 2012. The MOD43C product provides the weighting parameters associated with the RossThick-LiSparse-Reciprocal BRDF model best describing the anisotropic reflection from the surface per each 500 m MODIS pixel [32,33,34]. For a region encompassing the SGP site (36.64°N and 97.5°W), we obtained averaged values of these weighting parameters that describe the spectrally dependent anisotropic contributions to surface scattered light from components such as leaves and soil, as well as features (e.g., rocks and trees) that may shadow or obscure light [34]. Albedo, the ratio of upwelling to total downwelling irradiance, is dependent on the direct and diffuse components of the downwelling irradiance. Black-sky albedo, the direct beam directional hemispherical albedo, is the albedo in the absence of the downwelling diffuse component and thereby has a solar zenith angle dependency [34]. White-sky albedo, the diffuse bihemispherical albedo, is the albedo in the presence of downwelling diffuse, isotropic light and in the absence of a downwelling, direct component. It is thereby a constant [34]. The blue-sky albedos (shown) are an interpolation between the black-sky albedo and the white-sky albedo and are dependent on the amount of diffuse skylight (i.e., the isotropic diffuse fraction of the total illumination), which is itself dependent upon aerosol optical thickness [34]. The fraction of diffuse skylight, which we prescribed to be 0.2, is a value that corresponds roughly to aerosol optical thickness at 550 nm of 0.2 to 0.3 for solar zenith angles between 0° and 60° [34]. The results show that surface albedo increases with solar zenith angle [35]. Despite the roughly 9 year period between the aircraft measurements [19] and the MODIS results shown, the results show similar magnitudes and spectral shape in surface albedo for the SGP site. Because the MODIS albedo is a discrete-band product, it cannot provide information about the spectral shape in the 1,565 nm to 1,634 nm band. However, the MODIS albedo product can be used to independently constrain the surface type.
Figure 3(b) shows the slope fit of the surface albedo (or reflectance) in the 1,565 nm to 1,634 nm band normalized with respect to surface albedo (or reflectance) at 1,565 nm. The values range from 0%–2% (for ocean and bare soil, respectively) up to greater than 50% for snow. The bare soil albedo has the greatest magnitude at these wavelengths, but its spectral slope at these wavelengths is flat, similar to that of an ocean albedo. The normalized spectral slope of the baseline calculations (black curve) falls within the range of slopes for bare soil and pure vegetated surface, to be expected for an agricultural region.
If we assume no prior knowledge about surface type, the resulting standard deviations in transmittance to the broad range in surface albedo boundary conditions shown in Figure 3(a) is so large that all retrieval solutions are equally likely (not shown). Hence, some independent prior knowledge of the surface type is required for the retrieval to converge. This knowledge could be satellite based. For example, one good candidate is the MODIS BRDF/albedo product, which has been shown to agree at six discrete bands (between 469 and 1,640 nm) to within 0.05 (typically 0.025) of airborne SSFR retrievals for a mixture of soil and vegetated surfaces, a range of solar zenith angles spanning 20° to 40°, and aerosol optical thickness from 0.24 to 0.32 [14]. Therefore, in this work, we constrain our sensitivity study of surface impacts on transmittance to span bare soil to purely vegetated surface types.
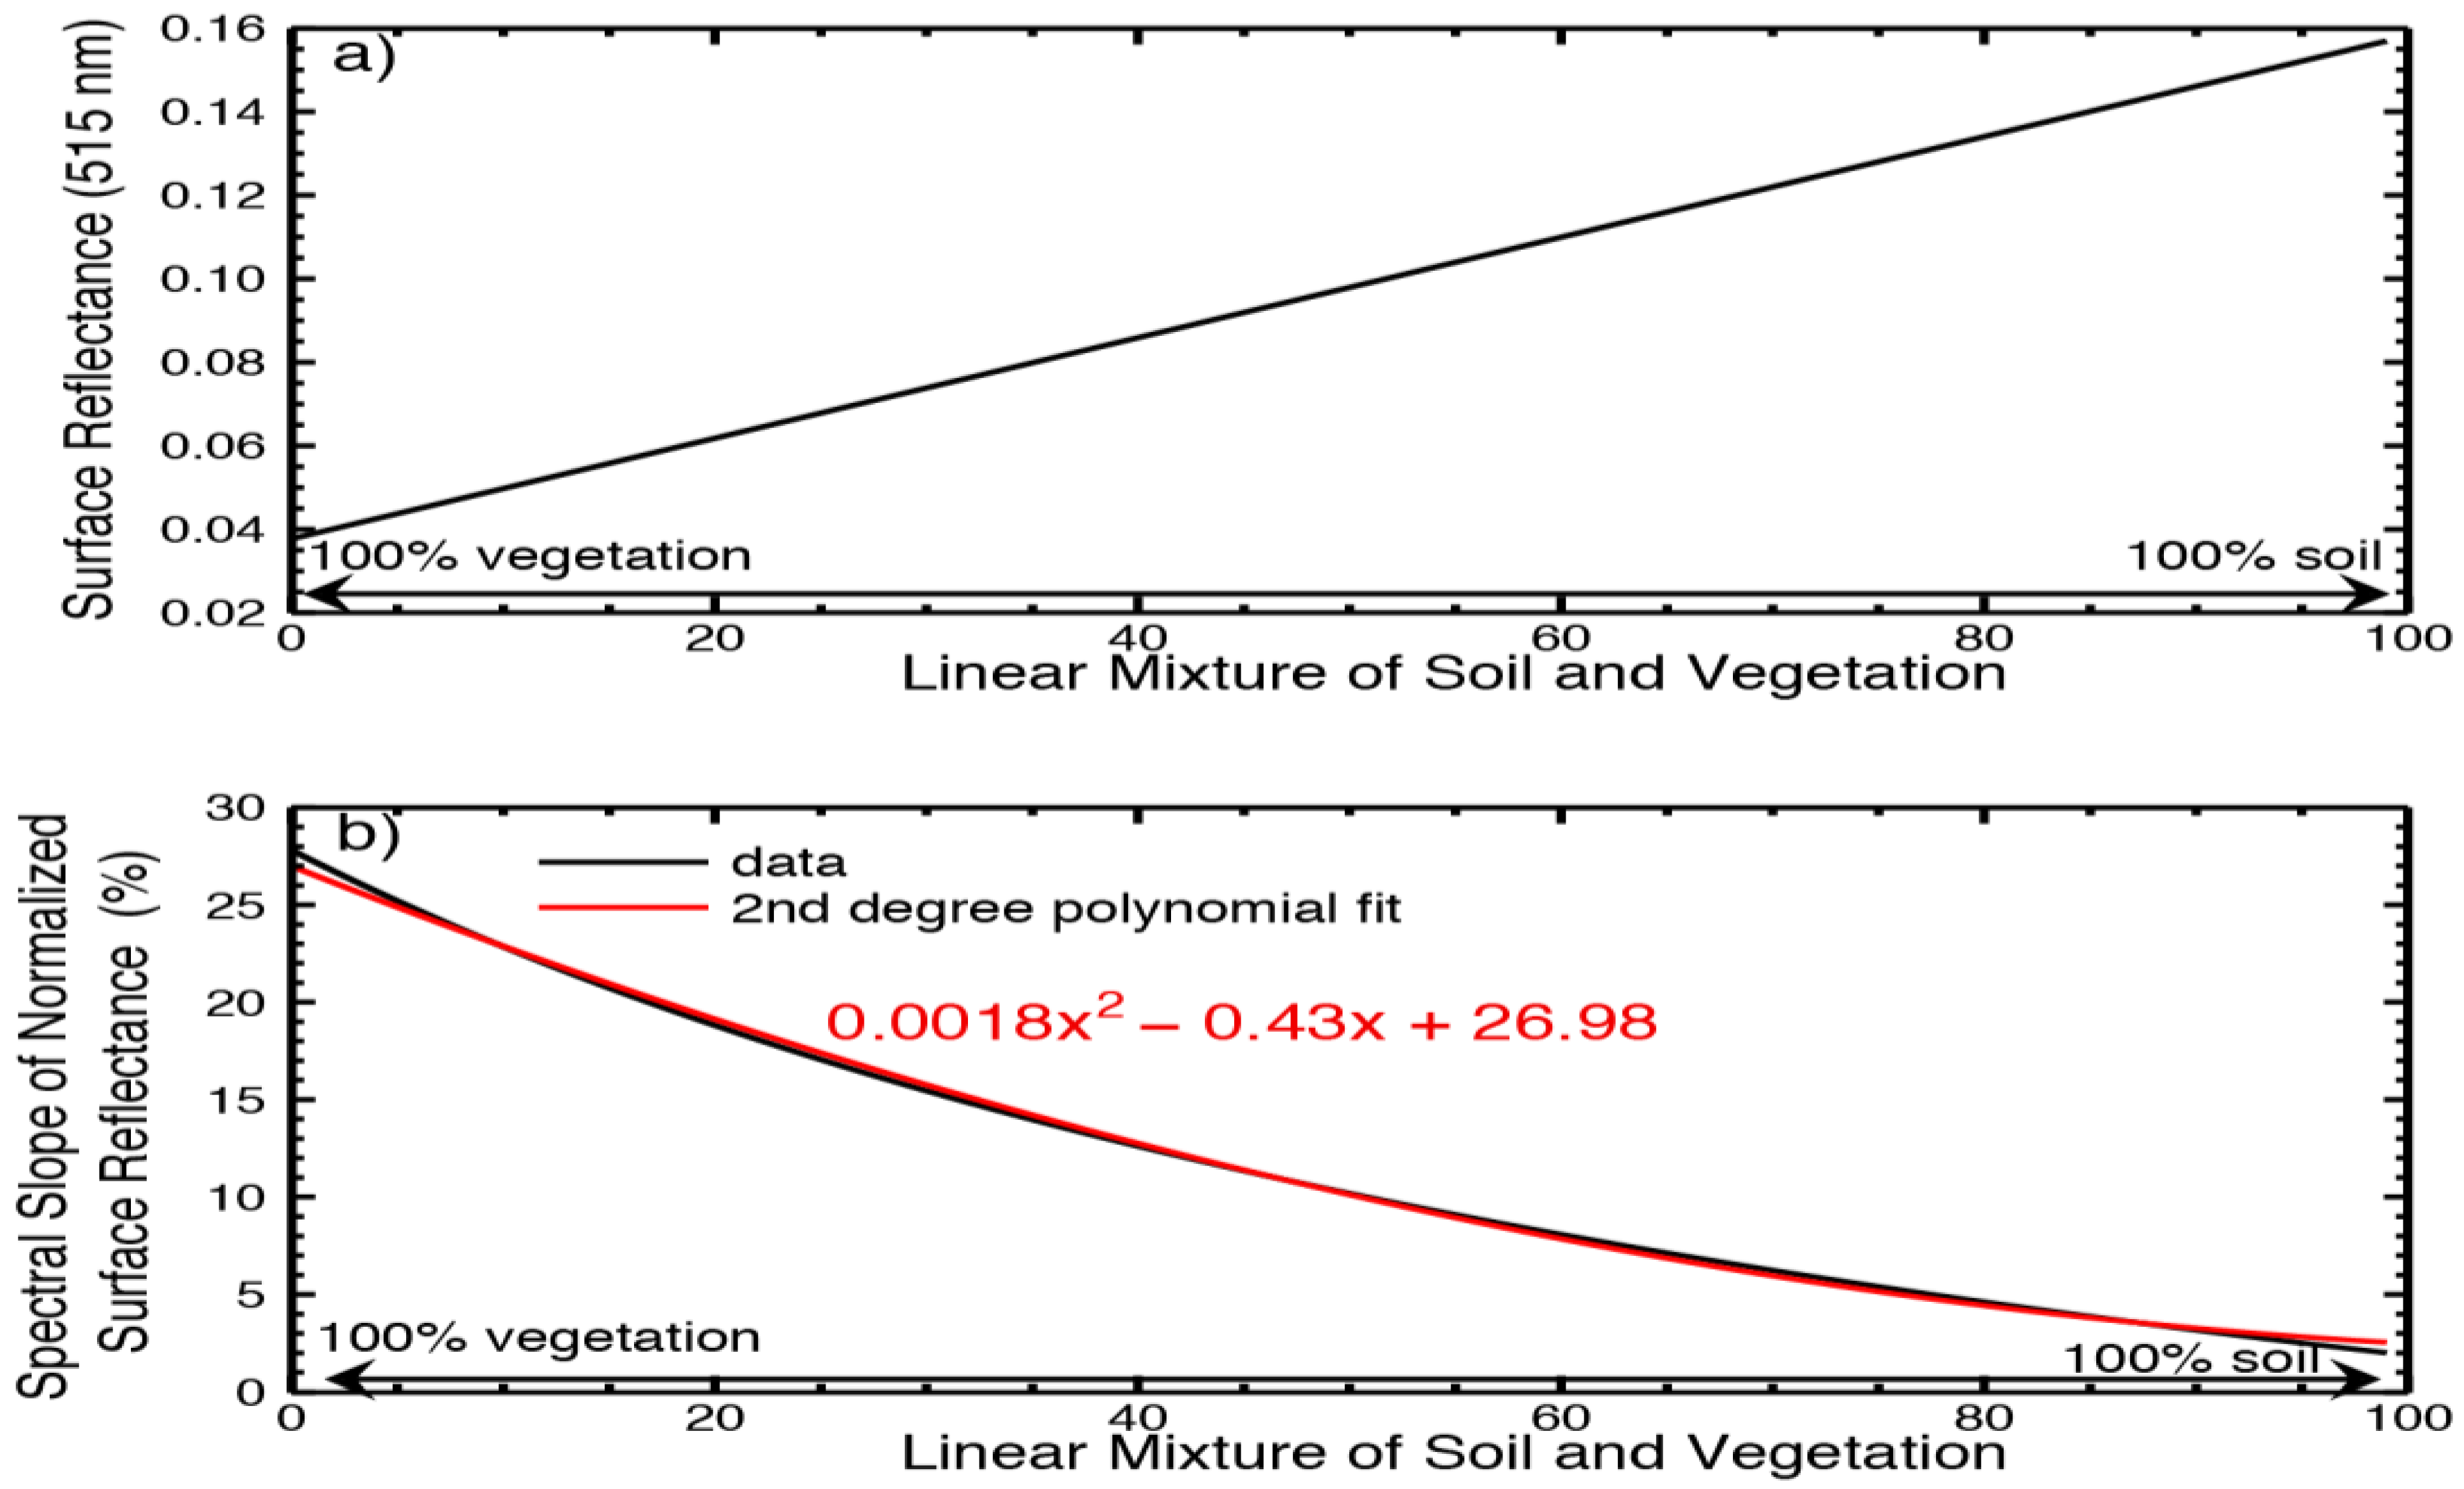
In Figure 4(a) we plot the surface albedo at 515 nm for linear mixtures of the bare soil and vegetated reflectance spectra shown in Figure 3(a). Figure 4(b) shows the fit of the spectral slope of the surface reflectance between 1,565 nm and 1,634 nm, normalized by surface reflectance at 1,565 nm for the same linear mixtures. In a linear mixture, the measured spectral variability in a region is assumed to be some combination of the spectral signatures of the distinct materials (or endmembers) in that region driven by the fractional abundances of the endmembers [36]. Hence, the endmembers used in Figure 4 are the bare soil and pure vegetated surface reflectances; the 100 data points along the x-axis are linear mixtures of these endmembers weighted by their fractional abundances in 1% increments (data courtesy of Bruce Kindel). There is a positive linear relationship in surface reflectance at 515 nm and the fractional abundances of the endmembers (Figure 4(a)) with lowest reflectance values (0.04) for the pure vegetated surface and higher reflectance values (0.16) for the pure soil surface. Near 1,600 nm, the fit of the spectral slope (in %) in the reflectance decreases with increasing fractional abundance of bare soil from approximately 28% to 2% as a second order polynomial (Figure 4(b)).
Using the results of Figure 4 and a 0.05 magnitude error in the surface albedo, we determine a range in the magnitude and spectral slope of surface albedo that will encompass surface types spanning bare soil to vegetated surfaces. First, the maximum and minimum values of surface albedo at 1,565 nm were obtained with a ±0.05 magnitude offset from the baseline value at 1,565 nm. Secondly, the minimum and maximum values of surface albedo at 1,634 nm were 2% and 28% greater, respectively, than the minimum and maximum values at 1,565 nm. Finally, the representative values of surface albedo at 1,600 nm were obtained by linear interpolation of the values at 1,565 nm and 1,634 nm. Table 1 lists the minimum, maximum, and baseline surface albedo values at four wavelengths (515, 1,565, 1,600, and 1,634 nm) used in deriving the characterization of transmittance to surface type.
Figure 4. (a) The change in surface reflectance at 515 nm for 100 linear mixtures of bare soil and vegetated surface reflectances (from Figure 3). (b) The change in spectral slope (in %) of the surface reflectance between 1,565 and 1,634 nm, normalized by reflectance at 1,565 nm for the same linear mixtures. A 2nd degree polynomial fit (red) of the relationship is also shown.
Atmosphere 04 00048 g004
Table 1. The minimum, maximum and baseline of the surface albedo at 515, 1,565, 1,600, and 1,634 nm used in forward modeling calculations to derive the standard deviation in transmittance at these wavelengths due to changing surface conditions. Baseline values are from measurements over a vegetated surface [19] and are a subset of the full spectrum shown in Figure 3 (black curve). The minimum and maximum values represent 0.05 magnitude errors and 2% to 28% change in spectral slope across the 1,565 nm to 1,634 nm wavelength range relative to the baseline (see text). These values are typical of errors in satellite retrievals of surface albedo and of the variability in bare soil and vegetated surface types shown in Figure 3.
Wavelength (nm)Minimum Maximum Baseline
5150.03770.13770.0379
1,5650.10850.20850.1585
1,6000.10960.23110.1773
1,6340.11060.26690.1942
Figure 5 shows the look-up table of the standard deviation in transmittance due to this variability in surface albedo and +3% systematic measurement error for (a) the standard method, and (b) the slope method relative to the baseline calculations. The calculations were performed for μ0 = 0.5, 0.866, and 0.999. When compared to the standard deviation in transmittance due to water vapor variability (Figure 2), we find that variability in surface albedo increases uncertainty in transmittance by two orders of magnitude at 515 nm, one order of magnitude at 1,600 nm for the standard method (comparing Figure 2(a), Figure 5(a) and about twice at 1,600 nm for the slope method (comparing Figure 2(b), Figure 5(b)).
Figure 5. Standard deviation in transmittance as a function of τ and re for (a) the standard method and (b) spectral slope method due to +3% systematic measurement error and variability in surface albedo spanning bare soil to vegetated surface types. Calculations shown are for μ0 = 0.866. Plot details are as described in Figure 1.
Atmosphere 04 00048 g005

5. Results

In this section, we investigate the various sources of measurement and modeling errors (Section 4) on the expected retrieval performance of the standard and slope methods (Section 2) using the GENRA algorithm (Section 3.2). The posterior pdf solutions are dependent upon the assigned measurement and forward modeling error characteristics. The two types of model uncertainty investigated, water vapor and surface albedo variability, have very different impacts on the posterior pdf solutions.

5.1. The Impacts of Water Vapor Variability on the Retrieved Cloud Properties

Firstly, we investigate variability in water vapor as the sole source of model error. This allows us to verify the GENRA output while also testing the relative impacts of systematic and random measurement error. In Figure 6, we compare the marginal pdfs and joint posterior pdfs in droplet effective radius and cloud optical thickness for the standard and slope methods for two cloud optical thickness values: τ =5 where neither retrieval method is expected to perform well due to overlapping behavior in the respective look-up tables (Figure 1) from the opposing effects of cloud absorption and scattering and τ =20, where both retrieval methods are expected to perform well; the different effective radius values of re = 5 and 10 μm, respectively, have little impact on the results shown. We investigate positive and negative 3% systematic offsets in the measurement for both retrieval wavelengths in the standard method; the 1,600 nm retrieval wavelength in the slope method is assumed to be unaffected by systematic error because it is normalized by transmittance at 1,565 nm (Section 2).
Figure 6. Marginal pdfs in effective radius (reff, in μm) and optical thickness and the joint posterior pdf for (a–c) true τ, re = 5, 5 μm and for (d–f) true τ, re = 20, 10 μm. Marginal pdf results are shown for standard (shaded histograms) and slope (non-shaded histograms) methods; the spread in the histograms results from ±3% systematic measurement errors (‘+’ in blue; ‘−’ in green) and ±30% uncertainty in water vapor. True values in τ and re are indicated with vertical dashed lines. The joint posterior pdf (for the slope method) is shown with colored contours and the highest contour level is centered on the maximum likelihood solution. Shifts in the maximum likelihood solution from the true values represent retrieval biases. The normalized Shannon Information Content (SIC) in the joint posterior pdf for standard and slope methods is indicated on (c) and (f). Calculations shown are for μ0 = 0.866.
Atmosphere 04 00048 g006
In the results shown in Figure 6(a–b) for the τ and re pair of 5 and 5 μm, neither the standard nor slope method retrieves the correct droplet size within a limit of 2 μm. There is a large spread (from 8–30 μm) in retrieved droplet sizes, despite retrieving cloud optical thickness to within 3. Figure 6(c) shows the joint posterior pdf for the slope method and the case of positive systematic measurement error. The solution is well resolved, unique, and centered on a τ, re solution of 5 and 8 μm reflecting an accurate retrieval in optical thickness and a + 3 μm bias in droplet effective radius. In Figure 6(d–e), for the τ and re pair of 20 and 10 μm, the standard method retrieves the droplet size to within 2 μm and the slope method retrieves the droplet size to within 3 μm; both methods retrieve the correct optical thickness to within 1. The joint posterior pdf in Figure 6(f) for the positive systematic measurement error case in the slope method also shows a well resolved, unimodal distribution that reflects accuracy in optical thickness and effective droplet size to 1 and 2 μm, respectively.
The measurement systematic error is the dominant factor in the differences in the maximum likelihood solutions of the marginal and joint pdf solutions. The grid points in the transmittance look up tables (Figure 1) denote the ‘true’ transmittance values of the τ, re pairs. In the case of negligible forward modeling errors, such as shown here for this case of water vapor variability, the maximum likelihood solution for a measurement impacted by systematic and random error will be shifted from the ‘true’ value according to these error sources. If these offsets were uncorrected for, the best-fit solution between measured and modeled solutions would occur at a τ, re pair that differs from the ‘truth’. It is this retrieval bias that is being shown with the marginal and joint pdfs in Figure 6. The retrieval bias (inaccuracy) is independent of the retrieval precision. In all the results shown, the Shannon information content (SIC) is near unity, corresponding with high precision and narrow histograms. Independent information from another instrument, or from prescribed inputs as in this analysis, is required to identify the retrieval accuracy.

5.2. The Impacts of Surface Albedo Variability on Retrieved Cloud Properties

The forward modeling errors resulting from uncertainty in surface albedo (Section 4 and Figure 2, Figure 3, Figure 4, Figure 5) overwhelms the measurement error. In this situation, we find the marginal and joint pdfs are not impacted, in the mean or spread of the distribution, by positive or negative 3% systematic measurement errors over a broad range in cloud optical thickness and droplet effective radius (not shown). The contributions to transmitted radiation due to surface conditions spanning bare soil to purely vegetated surfaces is the largest driver of retrieval precision and accuracy. The remainder of this work will focus entirely on this error source and the expected impacts on retrieving cloud optical properties from ground-based measurements.

5.2.1. Cloud Retrieval Accuracy and Precision for the Standard and Slope Methods

We define a retrieval bias as the difference between the maximum likelihood solution of the joint posterior pdf and the ‘true’ value. Since the Shannon information content is inversely related to error variance, a low value indicates a broad, imprecise, distribution of τ and re. In Figure 7, we show surface plots of the retrieval bias in effective radius and optical thickness, and the Shannon information content of the joint posterior pdf for the entire τ, re parameter space for the standard and slope methods.
Despite the larger errors due to surface variability compared to that of water vapor, the slope retrieval method is able to retrieve cloud optical thickness within ±2 for clouds of τ greater than 5 and less than 60, and within ±5 for thicker clouds. The standard method has biases exceeding 5, and approaching 50, for clouds of τ > 40. Although the slope method is more accurate than the standard method for retrieving effective radius, in agreement with the results of McBride et al. [3], uncertainty in surface albedo may limit its applicability. For optically thin clouds (τ < 5) and for large droplet sizes (re > around 20 μm) the retrieval biases can exceed ±5 μm. Such a result can be anticipated from the behavior of the transmittance look up tables in Figure 1; the lines of constant effective radius are clustered together for droplet sizes larger than approximately 20 μm, regardless of cloud optical thickness and there is very little delineation of the constant effective radius lines (for all values of droplet size) for optically thin clouds (τ < 5). In the standard approach, retrieval uncertainty within ±5 μm is not achievable given these error characteristics. Finally, the retrieval results are not precise. The Shannon information content is in the 0–0.3 range across the parameter space, indicating broad distributions in τ and re.
Figure 7. Surface plots of retrieval biases in effective radius and optical thickness (biases are defined as the difference between the maximum likelihood solution of the joint posterior pdf in τ and re and the true values) and the normalized Shannon information content of the joint posterior pdf for the standard method (left column) and the slope method (right column,). Results (z-axis) are shown for a broad range in droplet effective radius (1–30 μm, x-axis) and cloud optical thickness (1–100, y-axis). Calculations shown are for μ0 = 0.866, +3% systematic measurement error, and variable surface albedo from bare soil to purely vegetated surface types. Colored contours are used to ease interpretation of retrieval biases (a–d) within ±5 in optical thickness and ±5 μm in effective radius, where black denotes retrieval biases in excess of −5 and white denotes retrieval biases in excess of +5. Green denotes near zero biases. In (e,f), the color scale of the normalized Shannon information content ranges from 0 to 1.
Atmosphere 04 00048 g007

5.2.2. Non-Gaussian Behavior in the Retrieved Cloud Property Distributions

In Figure 8, we examine in more detail the slope method for four τ, re pairs spanning a broad range in cloud optical thickness (10–60) and droplet size (5–25 μm).
Figure 8. 1-dimension marginal pdfs in optical thickness and effective radius and the joint posterior pdfs for true (a–c)τ, re = 10, 5 μm, (d–f) τ, re = 10, 25 μm, (g–i) τ, re = 40, 5 μm, and (j–l) τ, re = 60, 25 μm. True values in τ, re are indicated by vertical dashed lines. Calculations shown are for μ0 = 0.866, +3% systematic measurement error, and variable surface albedo from bare soil to purely vegetated surface types. In joint posterior pdf plots, red circles denote the maximum likelihood solution and the black plus symbol the true τ and re. Results shown are a subset of those in Figure 7 (for slope method; right column) and demonstrate that the mean statistics in the marginal pdfs are not equivalent to the maximum likelihood solution in the joint posterior pdf when the distributions are non-Gaussian.
Atmosphere 04 00048 g008
Recall that the maximum likelihood solution of the joint posterior pdf in τ and re will be equal to the mean of the marginal pdfs only when the joint posterior pdf is Gaussian distributed. Figure 8 demonstrates, for all cases shown, the deviation from Gaussian behavior in the retrieved distributions where a positive skewness is seen (i.e., longer distribution tail on the right hand side of the pdf). Despite the assumption of linear (i.e., Gaussian) behavior in the input statistics of the measurement and forward model errors, the joint posterior pdf can demonstrate non-linear behavior because the GENRA analysis tool does not require assumptions of well-behaved, normal distributions in the output statistics. The results also show that the marginal distributions in τ and re may have different maximum likelihood values than the joint posterior pdf due to the integration over the other parameter (Equations (3) and (4)). The discrepancy would depend on the shape of the joint posterior pdf implying that the knowledge of the nonlinear coupling between τ and re is necessary for greater retrieval accuracy.

5.2.3. Solar Angle Dependency of the Retrieved Cloud Property Distributions

There is a solar angle dependency in the retrieved cloud properties using the slope method. This dependency is greatest for clouds with τ between 5 and 10 with a droplet size less than approximately 10 μm. Figure 9 illustrates the improvement in retrieval accuracy and precision for τ and re for higher sun angles. Improvements in retrieval accuracy are indicated where the histogram is centered on the ‘truth’ (vertical dashed line), the distribution is narrow, and Shannon information content is correspondingly greater.
Figure 9. The dependency in the marginal pdfs in cloud optical thickness and droplet effective radius on solar zenith angle for true (a,b) τ, re = 5, 5 μm, (c,d) τ, re = 5, 10 μm, (e,f) τ, re = 20, 5 μm, and (g,h) τ, re = 20, 10 μm. True values in τ and re are indicated with vertical dashed lines. Calculations were performed using the slope method for μ0 = 0.500 (light grey), μ0 = 0.866 (dark grey), and μ0 = 0.999 (black). The normalized Shannon information content in the marginal pdfs with changing μ0 is indicated on each plot using matching font colors.
Atmosphere 04 00048 g009
Figure 9(a,b) shows sun angle dependencies for μ0 = 0.5, 0.866, and 0.999. Histograms are more precise and centered around the ‘truth’ (accurate) for the highest sun angle, and the effect is more pronounced for the thinnest cloud with the smallest particle size (Figure 9(a)). Bimodal solutions in droplet size develop for the thinnest clouds at the highest sun angles; the secondary peaks in droplet size are centered on 3 μm. Figure 9(c,d) investigates the sun angle dependency for clouds with optical thickness of 20 and effective radius or 5 and 10 μm, respectively. For these thicker clouds, there is negligible impact on the accuracy or precision of the retrieved droplet size. However, overhead sun angles improve the accuracy of the retrieved cloud thickness by around three for the cases shown, with some improvement in the precision. Nonetheless, for the thicker clouds, the precision of the retrieved cloud properties is relatively poor with wide distributions in retrieved cloud properties and correspondingly low Shannon information content.

6. Summary

In this study, we quantify the variance in transmittance resulting from ±30% variability in atmospheric water vapor content and spectral surface albedo spanning soil to vegetated surface types for a broad range of cloud optical thickness and droplet effective radius. The variance is quantified at a visible and near infrared wavelength and in the slope of the normalized transmittance over a near infrared wavelength channel (1,565 nm to 1,634 nm). Using an application based on general inverse theory called the GEneralized Nonlinear Retrieval Analysis (GENRA), the retrieved cloud optical properties using a new spectral slope method developed by McBride et al. [3] were compared to a standard method applied to reflectance, and the separate contributions from measurement and forward modeling sources were evaluated. The variability in surface albedo had the largest impact (greater than the variability in water vapor content or systematic and random measurement errors) on the accuracy and precision of cloud optical thickness and droplet effective radius based on measurements of ground-based transmittance.
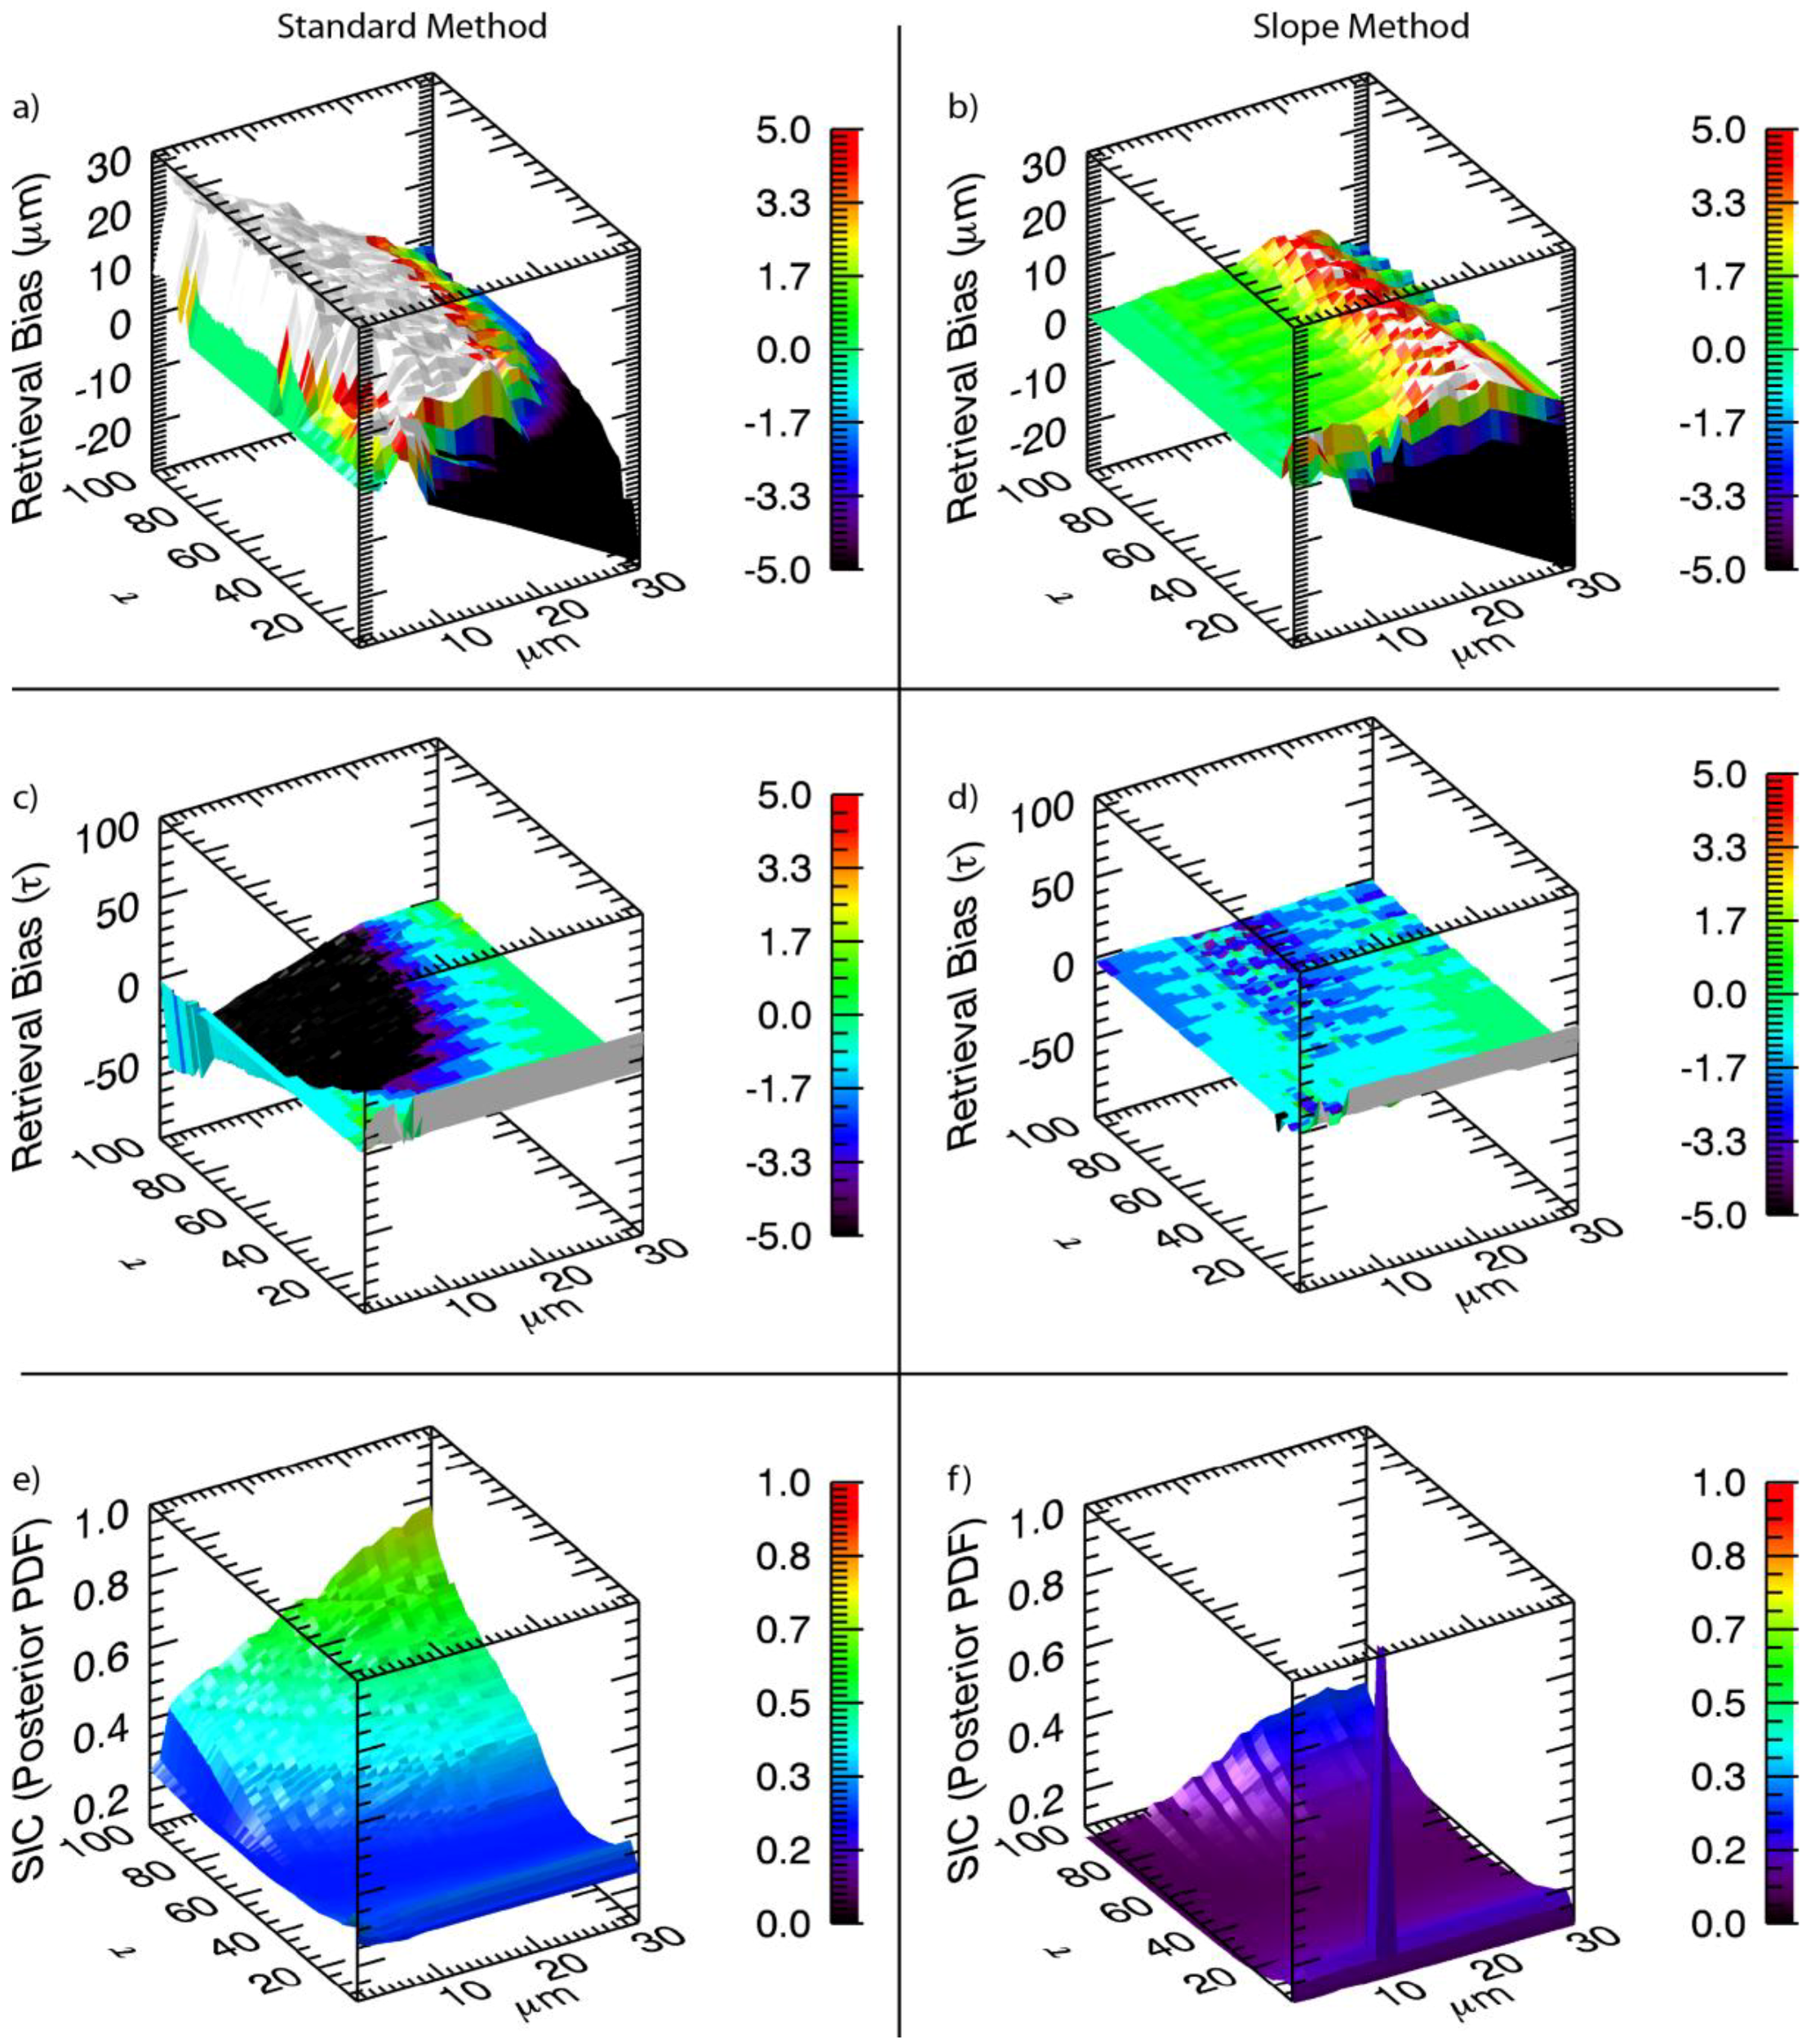
The new spectral algorithm, which exploits the spectral shape of transmittance in the near infrared, is more accurate than the standard method for retrieving effective radius. For clouds with an optical thickness between 5 and 60 and droplet size less than approximately 20 μm, retrieval biases are within 2 μm and 5 for cloud droplet size and optical thickness, respectively. However, the retrieved distributions are, in most cases, imprecise due to the uncertainty in surface albedo, which may limit the applicability of the method. An exception is clouds with optical thickness greater than 5 but less than 10, effective droplet radii less than 10 μm, and overhead sun conditions. In the results shown, the coupling between cloud optical thickness and droplet effective radius distributions may be nonlinear resulting in differences in retrieval accuracy and precision compared to Gaussian distributions or assumptions of Gaussian behavior. The GENRA utility, or a similar analysis based on Monte Carlo ensemble which does not require Gaussian assumptions in the output statistics, is needed to accurately quantify these differences.
The results suggest ground-based measurements of transmittance, though more difficult because there is no one-to-one mapping between transmittance and optical thickness as occurs with measurements of cloud reflectance, can be utilized for cloud retrievals when the variability in surface albedo is constrained. A ground-based viewpoint allows for studies of clouds at higher temporal resolution than available from satellite. The MODIS BRDF/albedo product would be one good candidate to provide independent prior knowledge of surface albedo, potentially providing a constraint on surface type and thereby improving retrieval convergence. Future retrieval algorithms may consider a joint retrieval of cloud and surface properties because there is a clear influence of the surface properties on the downward radiation field below cloud. A new Shannon information content study may evaluate the feasibility of such a method.
This work did not investigate the impacts of snow-covered surfaces on the variability in transmittance. Snow covered surfaces have larger and more variable albedos at visible wavelengths [37] than that investigated in this work for bare soil and purely vegetated surfaces. Nonetheless, this work provides a potential approach for investigating whether ground-based measurements of transmittance and the spectral slope retrieval method of McBride et al. [3] can provide valuable insight into high-latitude clouds over snow covered surfaces where satellite retrievals based on reflected radiation perform poorly.

Acknowledgments

We gratefully acknowledge Shi Song for assistance in compiling the forward modeling results and Bruce Kindel for computing the linear mixtures of soil and vegetated surface reflectance spectra. This work was accomplished under NASA grant numbers NNX08AI83G and NNX11AK67G. We would like to thank three anonymous reviewers for their helpful comments, which improved this manuscript.

References

  1. Stephens, G. Cloud feedbacks in the climate system: A critical review. J. Climate 2005, 18, 237–273. [Google Scholar] [CrossRef]
  2. Platnick, S. Vertical photon transport in cloud remote sensing problems. J. Geophys. Res. 2000, 105, 22919–22935. [Google Scholar] [CrossRef]
  3. McBride, P.J.; Schmidt, K.S.; Pilewskie, P.; Kittelman, A.S.; Wolfe, D.E. A spectral method for retrieving cloud optical thickness and effective radius from surface-based transmittance measurements. Atmos. Chem. Phys. 2011, 11, 7235–7252. [Google Scholar]
  4. Twomey, S.; Cocks, T. Remote sensing of cloud parameters from spectral reflectance in the near-infrared. Beitr. Phys. Atmos. 1989, 62, 172–179. [Google Scholar]
  5. Vukicevic, T.; Coddington, O.; Pilewskie, P. Characterizing the retrieval of cloud properties from optical remote sensing. J. Geophys. Res. 2010, 115, D20211. [Google Scholar] [CrossRef]
  6. Coddington, O.; Pilewskie, P.; Vukicevic, T. The Shannon information content of hyperspectral shortwave cloud albedo measurements: Quantification and practical applications. J. Geophys. Res. 2012, 117, D04205. [Google Scholar] [CrossRef]
  7. Shannon, C.; Weaver, W. The Mathematical Theory of Communication; University of Illinois: Urbana, IL, USA, 1949. [Google Scholar]
  8. Rodgers, C.D. Inverse Methods for Atmospheric Sounding: Theory and Practice; World Scientific Publishing Co., Inc.: Hackensack, NJ, USA, 2000. [Google Scholar]
  9. L’Écuyer, T.S.; Gabriel, P.; Leesman, K.; Cooper, S.J.; Stephens, G.L. Objective assessment of the information content of visible and infrared radiance measurements for cloud microphysical property retrievals over the global oceans—Part I: Liquid clouds. J. Appl. Meteor. Climatol. 2006, 45, 20–41. [Google Scholar] [CrossRef]
  10. Cooper, S.J.; L’Écuyer, T.S.; Gabriel, P.; Baran, A.J.; Stephens, G.L. Objective assessment of the information content of visible and infrared radiance measurements for cloud microphysical property retrievals over the global oceans—Part II: Ice clouds. J. Appl. Meteor. Climatol. 2006, 45, 42–62. [Google Scholar] [CrossRef]
  11. King, N.J.; Vaughan, G. Using passive remote sensing to retrieve the vertical variation of cloud droplet size in marine stratocumulus: An assessment of information content and the potential for improved retrievals from hyperspectral measurements. J. Geophys. Res. 2012, 117, D15206. [Google Scholar] [CrossRef]
  12. Nakajima, T.; King, M.D. Determination of the optical thickness and effective, particle radius of clouds from reflected solar radiation measurements: I. Theory. J. Atmos. Sci. 1990, 47, 1878–1893. [Google Scholar] [CrossRef]
  13. Bergstrom, R.W.; Pilewskie, P.; Schmid, B.; Russell, P.B. Estimates of the spectral aerosol single scattering albedo and aerosol radiative effects during SAFARI 2000. J. Geophys. Res. 2003, 108, 8474. [Google Scholar]
  14. Coddington, O.M.; Schmidt, K.S.; Pilewskie, P.; Gore, W.J.; Bergstrom, R.W.; Román, M.; Redemann, J.; Russell, P.B.; Liu, J.; Schaaf, C.C. Aircraft measurements of spectral surface albedo and its consistency with ground-based and space-borne observations. J. Geophys. Res. 2008, 113, D17209. [Google Scholar] [CrossRef]
  15. Stamnes, K.; Tsay, S.-C.; Wiscombe, W.; Jayaweera, K. Numerically stable algorithm for discrete-ordinate-method radiative transfer in multiple scattering and emitting layered media. Appl. Opt. 1988, 27, 2502–2509. [Google Scholar] [CrossRef]
  16. Pilewskie, P.; Pommier, J.; Bergstrom, R.; Gore, W.; Howard, S.; Rabbette, M.; Schmid, B.; Hobbs, P.V.; Tsay, S.-C. Solar spectral radiative forcing during the Southern African Regional Science Initiative. J. Geophys. Res. 2003, 108, 8486. [Google Scholar] [CrossRef]
  17. Mlawer, E.J.; Taubman, S.J.; Brown, P.D.; Iacono, M.J.; Clough, S.A. Radiative transfer for inhomogeneous atmospheres: RRTM, a validated correlated-k model for the longwave. J. Geophys. Res. 1997, 102, 16663–16682. [Google Scholar] [CrossRef]
  18. Kurucz, R.L. Synthetic Infrared Spectra. In Infrared Solar Physics—International Astronomical Union Symposia 154; Rabin, D.M., Jeffries, J.T., Eds.; Kluwer Acad.: Norwell, MA, USA, 1992. [Google Scholar]
  19. Trishchenko, A.P.; Luo, Y.; Khlopenkov, K. Dynamics of the Surface Albedo over the ARM SGP Area during Spring 2003 Aerosol IOP. In Proceedings of the Fourteenth Atmospheric Radiation Measurement (ARM) Science Team Meeting (ARM-CONF-2004), Albuquerque, NM, USA, 22–26 March 2004.
  20. Anderson, G.P.; Clough, S.A.; Kneizys, F.X.; Chetwynd, J.H.; Shettel, E.P. AFGL Atmospheric Constituent Profiles (0–120 km); Tech. Rep. AFGL-TR-86-0110; AFGL (OPI); Hanscom AFB: Bedford, MS, USA, 1986. [Google Scholar]
  21. Evans, F.K. The spherical harmonic discrete ordinate method for three-dimensional atmospheric radiative transfer. J. Atmos. Sci. 1998, 55, 429–446. [Google Scholar] [CrossRef]
  22. Chýlek, P.; Ramaswamy, V. Simple approximation for infrared emissivity of water clouds. J. Atmos. Sci. 1982, 39, 171–177. [Google Scholar] [CrossRef]
  23. Tarantola, A. Inverse Problem Theory and Methods for Model Parameter Estimation; Society for Industrial and Applied Mathematics (SIAM): Philadelphia, PA, USA, 2005; p. 342. [Google Scholar]
  24. Jazwinski, A.H. Stochastic Processes and Filtering Theory; Academic Publishing: San Diego, CA, USA, 1970; Volume 64, p. 376. [Google Scholar]
  25. Twomey, S.A.; Bohren, C.F.; Mergenthaler, J.L. Reflectance and albedo differences between wet and dry surfaces. App. Opt. 1986, 3, 431–437. [Google Scholar]
  26. Bohren, C.F.; Clothiaux, E.E. Fundamentals of Atmospheric Radiation: An Introduction with 400 Problems; Wiley-VCH Verlag GmbH & Co. KGaA: Weinheim, Germany, 2006; p. 472. [Google Scholar]
  27. Liang, S.; Shuey, C.J.; Russ, A.L.; Fang, H.; Chen, M.; Walthall, C.L.; Daughtry, C.; Hunt, R., Jr. Narrowband to broadband conversions of land surface albedo: II. Validation. Remote Sens. Environ. 2002, 84, 25–41. [Google Scholar]
  28. Coddington, O.M.; Pilewskie, P.; Redemann, J.; Platnick, S.; Russell, P.B.; Schmidt, K.S.; Gore, W.J.; Livingston, J.; Wind, G.; Vukicevic, T. Examining the impact of overlying aerosols on the retrieval of cloud optical properties from passive remote sensing. J. Geophys. Res. 2010, 115, D10211. [Google Scholar] [CrossRef]
  29. Schmidt, S.; Bierwirth, E.; Pilewskie, P.; Redemann, J.; Brandt, R.J.; Lyapustin, A.; Gatebe, C.K.; Schaaf, C.; Kahn, R.A. Airborne Measurements of Surface Albedo in Alaska. In Proceedings of EOS Transactions—American Geophysical Union Fall Meeting 2009, Houston, TX, USA, 25–20 October 2009; Volume 90, pp. A43A–0159.
  30. Roberts, Y.L.; Pilewskie, P.; Kindel, B.C. Evaluating the observed variability in hyperspectral earth-reflected solar radiance. J. Geophys. Res. 2011, 116, D24119. [Google Scholar] [CrossRef]
  31. Kindel, B.C.; Qu, Z.; Goetz, A.F.H. Direct solar spectral irradiance and transmittance measurements from 350 to 2500 nm. Appl. Opt. 2001, 40, 3483–3494. [Google Scholar] [CrossRef]
  32. Schaaf, C.B.; Gao, F.; Strahler, A.H.; Lucht, W.; Li, X.; Tsang, T.; Strugnell, N.C.; Zhang, X.; Jin, Y.; Muller, J.-P.; et al. First operational BRDF, albedo nadir reflectance products from MODIS. Remote Sens. Environ. 2002, 83, 135–148. [Google Scholar] [CrossRef]
  33. Wanner, W.; Li, X.; Strahler, A.H. On the derivation of kernels for kernel driven models of bidirectional reflectance. J. Geophys. Res. 1995, 100, 21077–21089. [Google Scholar] [CrossRef]
  34. Lucht, W.; Schaaf, C.B.; Strahler, A.H. An algorithm for the retrieval of albedo from space using semiempirical BRDF models. IEEE Trans. Geosci. Remote Sens. 2000, 38, 977–998. [Google Scholar] [CrossRef]
  35. Román, M.G.; Schaaf, C.B.; Lewis, P.; Gao, F.; Anderson, G.P.; Privette, J.L.; Strahler, A.H.; Woodcock, C.E.; Barnsley, M. Assessing the coupling between surface albedo derived from MODIS and the fraction of diffuse skylight over spatially-characterized landscapes. Remote Sens. Environ. 2010, 114, 738–760. [Google Scholar] [CrossRef]
  36. Keshava, N.; Mustard, J.F. Spectral unmixing. IEEE Trans. Signal Process. 2002, 19, 44–57. [Google Scholar] [CrossRef]
  37. Moody, E.G.; King, M.D.; Schaaf, C.B.; Hall, D.K.; Platnick, S. Northern Hemisphere five-year average (2000–2004) spectral albedos of surfaces in the presence of snow: Statistics computed from Terra MODIS land products. Remote Sens. Environ. 2007, 111, 337–345. [Google Scholar] [CrossRef]

