1. Introduction
Aerosols play a crucial role in global and regional climate change [
1], the atmosphere [
2], and human health [
3]. They have a strong impact on the formation of clouds [
4], dust, and fog [
5], as well as the global radiation balance [
6]. The aerosol size distributions (ASDs), aerosol optical depths (AODs) and Ångström exponents are all vitally important optical properties. ASD determines AOD and is an indication of environmental quality, and the effects of atmospheric aerosols on human health fundamentally depend on aerosol size [
7]. Despite many studies of aerosol, aerosol optical properties have been the focus of research and a large source of uncertainties in assessment and predictions of climate change [
8]. Therefore, without a good understanding of ASD, AOD, and Ångström exponent, aerosol optical properties and magnitudes effect on climate change would remain highly uncertain.
To better understand anthropogenic activities and meteorology influence on aerosol properties, several global ground-based aerosol observation networks have been established such as AERONET (Aerosol Robotic Network), PHOTONS and so on [
9,
10]. At present there are more than 20 AERONET sites located in China. To improve understanding of aerosol optical properties in China, the China Aerosol Remote Sensing Network (CARSNET) and the Chinese Sun Hazemeter Network (CSHNET) was established in 2002 and 2004 respectively. In recent years, many aerosol-related investigations and scientific studies have been conducted using ground–based data. Aerosol optical properties over the Loess Plateau in Semi-Arid Climate were reviewed by observations of Environment Observatory of Lanzhou University (SACOL) [
11]; dust aerosol direct radiative forcing using MFRSR and AERONET data in northwestern China was also investigated [
12]. Che H.Z.
et al. analyzed aerosol optical properties and optical properties validation in several sites of CARSNET [
13]; Xin J.Y.
et al. also made a detailed analysis of AOD and Ångström exponent observed by CSHNET [
14] and also discussed optical properties and ASDs of dust aerosol in Northern China [
15]; aerosol optical properties in Chinese Yangtze Delta Region were analyzed and compared using Cimel Sun Photometer data at five sites including Pudong, Dongtan, Lin’an, ZFU and Taihu [
16]. Investigations of ASDs have been performed in many cities in China, including Beijing, China [
17,
18], and Guangzhou, China [
19] and so on, however, ASD here was measured by Aerodynamic Particle Sizer which measured ASD in the boundary layer not the total atmospheric column.
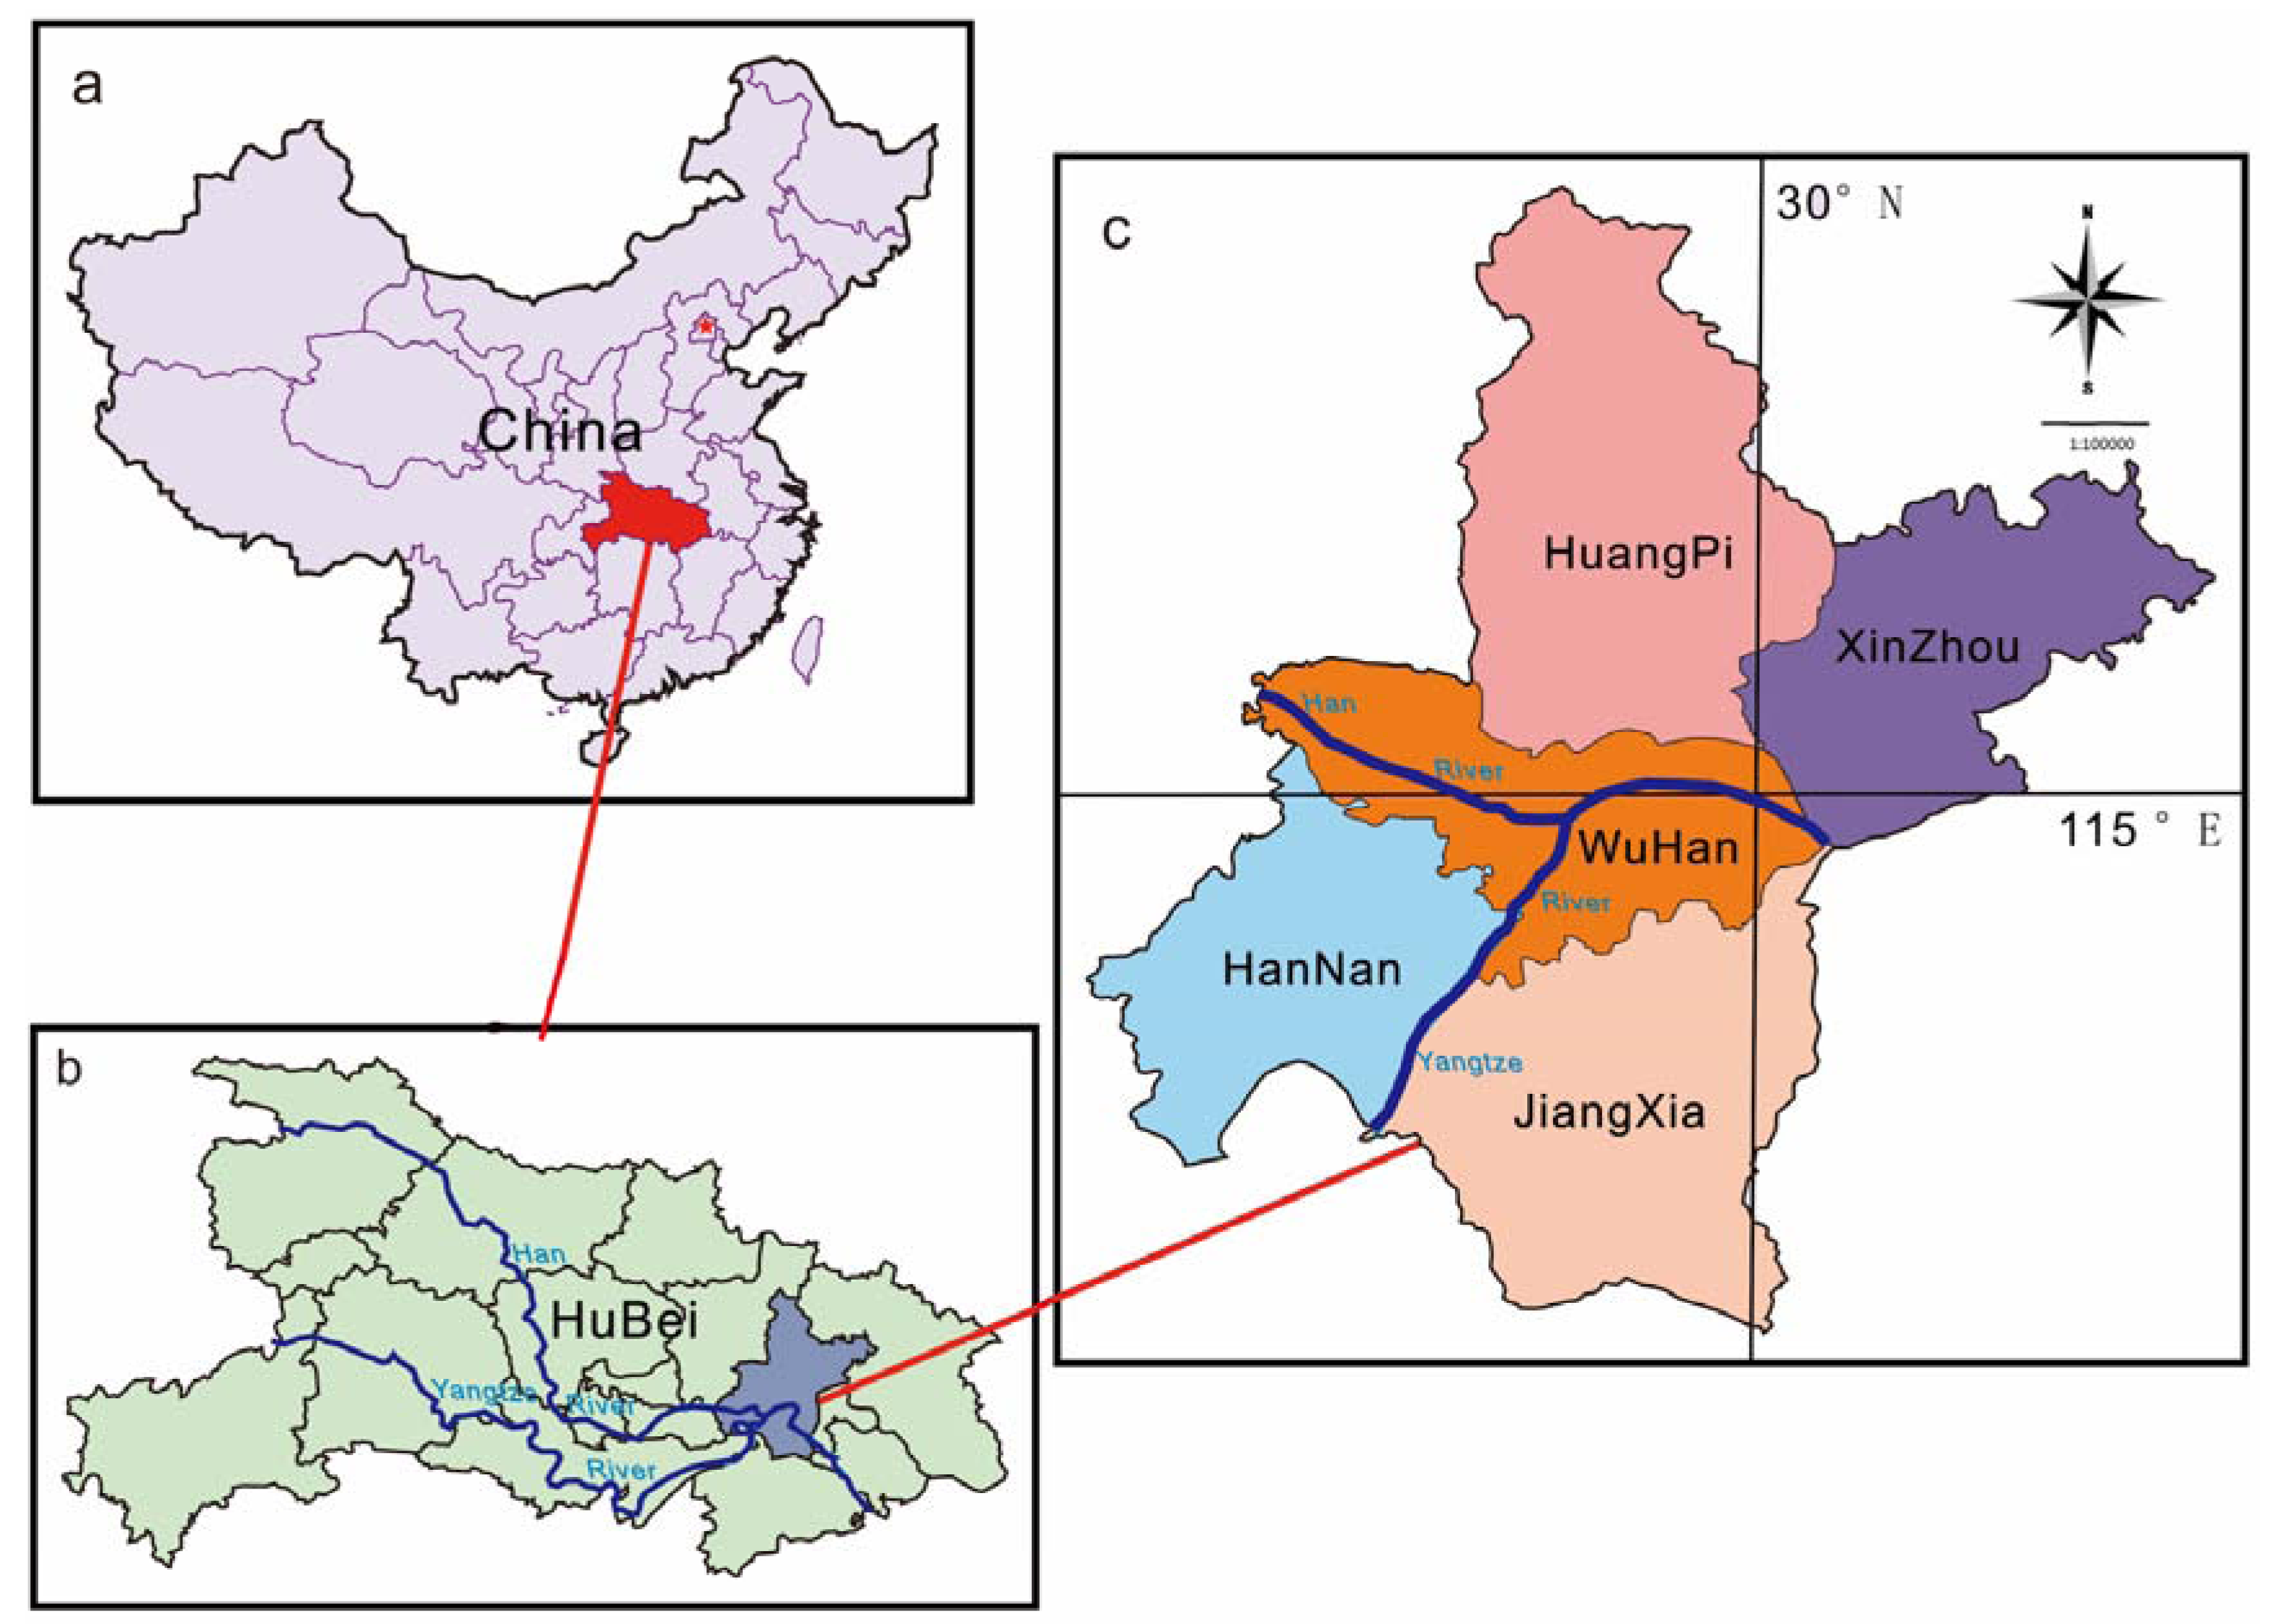
Due to spatiotemporal variety of aerosol and many aerosol-related studies focused on Jing-Jin-Tang Region, Pearl River Delta (PRD), Yangtze River Delta and Northwestern China, combined with few works dealing with optical properties and ASDs using sun photometers in Central China, it is vitally important to analyze optical properties and ASDs in Central China. Wuhan is a well-known urban area in central China, and a center of industry, transport and the regional economy. As far as I am aware, AERONET, CARSNET and CSHNET do not have sites in Wuhan. Therefore, our works in Wuhan could improve our knowledge of aerosol effects on climate change in Central China.
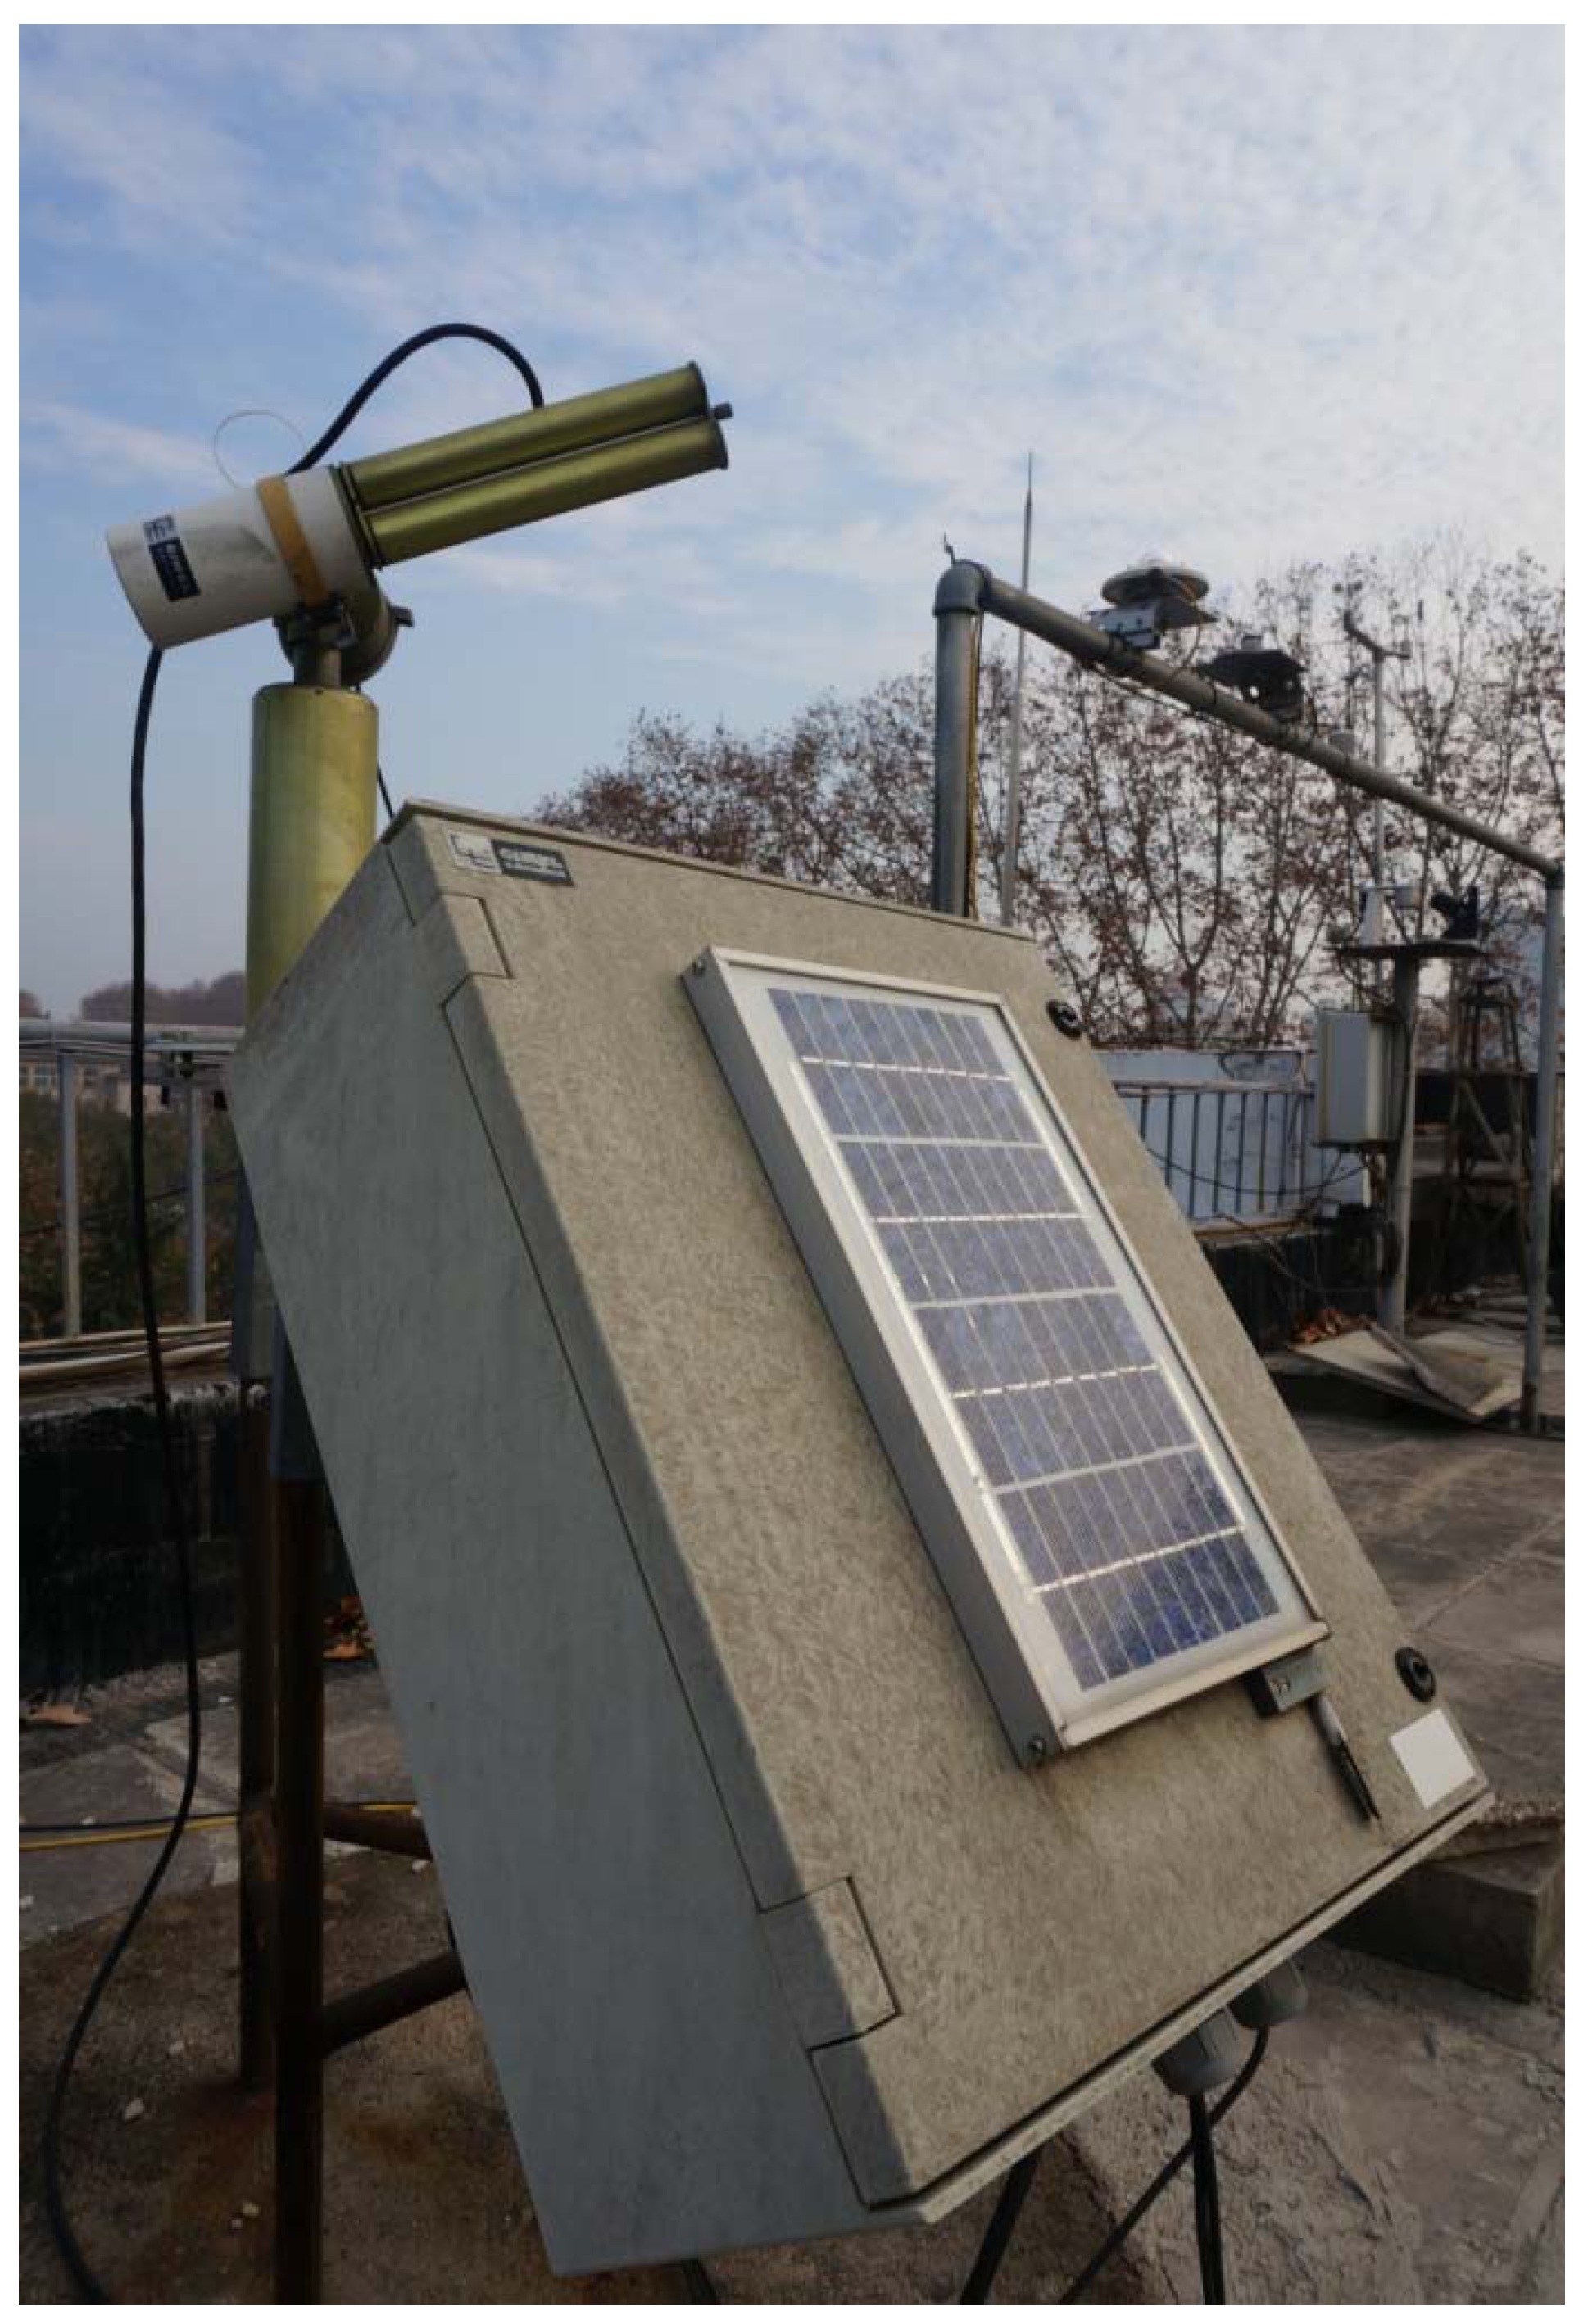
In this study, columnar aerosol volume size distributions were obtained by the relationship between AOD and ASD using an inversion calculation based on the traditional light extinction method. Therefore, long-term observations were carried out using a sun photometer located in Wuhan to obtain AOD, and from that, ASD. We analyzed the monthly and seasonal variations in AOD and Ångström exponents, as well as the seasonal variations in ASD and studied the relationship between optical properties and ASD.
3. Results and Analysis
In this paper, March, April, and May are considered “spring”; June, July, and August are “summer”; September, October, and November are “autumn”; and December, January, and February are “winter.” Some data from 11 June to 15 June were removed owing to the brownish-yellow smog from straw burning in northern China reported in China Daily, thus these data were unrepresentative; Seasonally averaged AOD of each channel and Ångström exponent are showed in
Table 1. These values below were all calculated from the daily average observed values. The AOD of each channel was highest in spring, while in summer, the AOD was smaller than that in spring. The AOD was the lowest in autumn, and less than 1.0 in each channel. During winter, the AOD was similar to but less than that in spring. It also can be seen in
Table 1 that AOD became smaller with increasing wavelength. The Ångström exponent value peaked in summer and declined in spring. Additionally, the Ångström exponent values were above 1.1 during summer and winter, and close to 1.0 during spring and autumn.
Table 1.
Seasonally averaged aerosol optical depths (AOD) of each channel (nm) and Ångström exponent values.
Table 1.
Seasonally averaged aerosol optical depths (AOD) of each channel (nm) and Ångström exponent values.
| Season | AOD (Channel in nm) | Ångström Exponent | Day |
|---|
| 380 | 440 | 500 | 670 | 870 | 1020 | 1640 |
|---|
| Spring | 1.05 | 0.94 | 0.83 | 0.60 | 0.47 | 0.40 | 0.27 | 0.99 | 16 |
| Summer | 0.98 | 0.87 | 0.76 | 0.51 | 0.36 | 0.29 | 0.17 | 1.22 | 22 |
| Autumn | 0.75 | 0.64 | 0.55 | 0.37 | 0.27 | 0.24 | 0.16 | 1.06 | 28 |
| Winter | 1.04 | 0.95 | 0.84 | 0.59 | 0.44 | 0.37 | 0.21 | 1.14 | 28 |
Figure 3 shows the seasonal statistics of AOD at 500 nm. The averaged value in summer (~0.84) was larger than that in autumn (~0.55), which was partially attributed to the higher temperature and the stagnation from low even no winds during summer and relatively clear, dry weather, and dispersion and deposition of air pollutants during autumn. The mean AOD in spring (~0.83) was close to that in winter (~0.84), which might be due to residence time of particles and particle loading from surrounding regions. The maximum seasonal value peaked in summer and decreased in the other three seasons, which could due to great water vapor content in the atmosphere in Wuhan. The maximum values for the other three seasons ranged from 1 to 2. The minimum value in each season was less than 0.5, which may have been influenced by clear weather and in the case of summer, the plentiful rainfall.
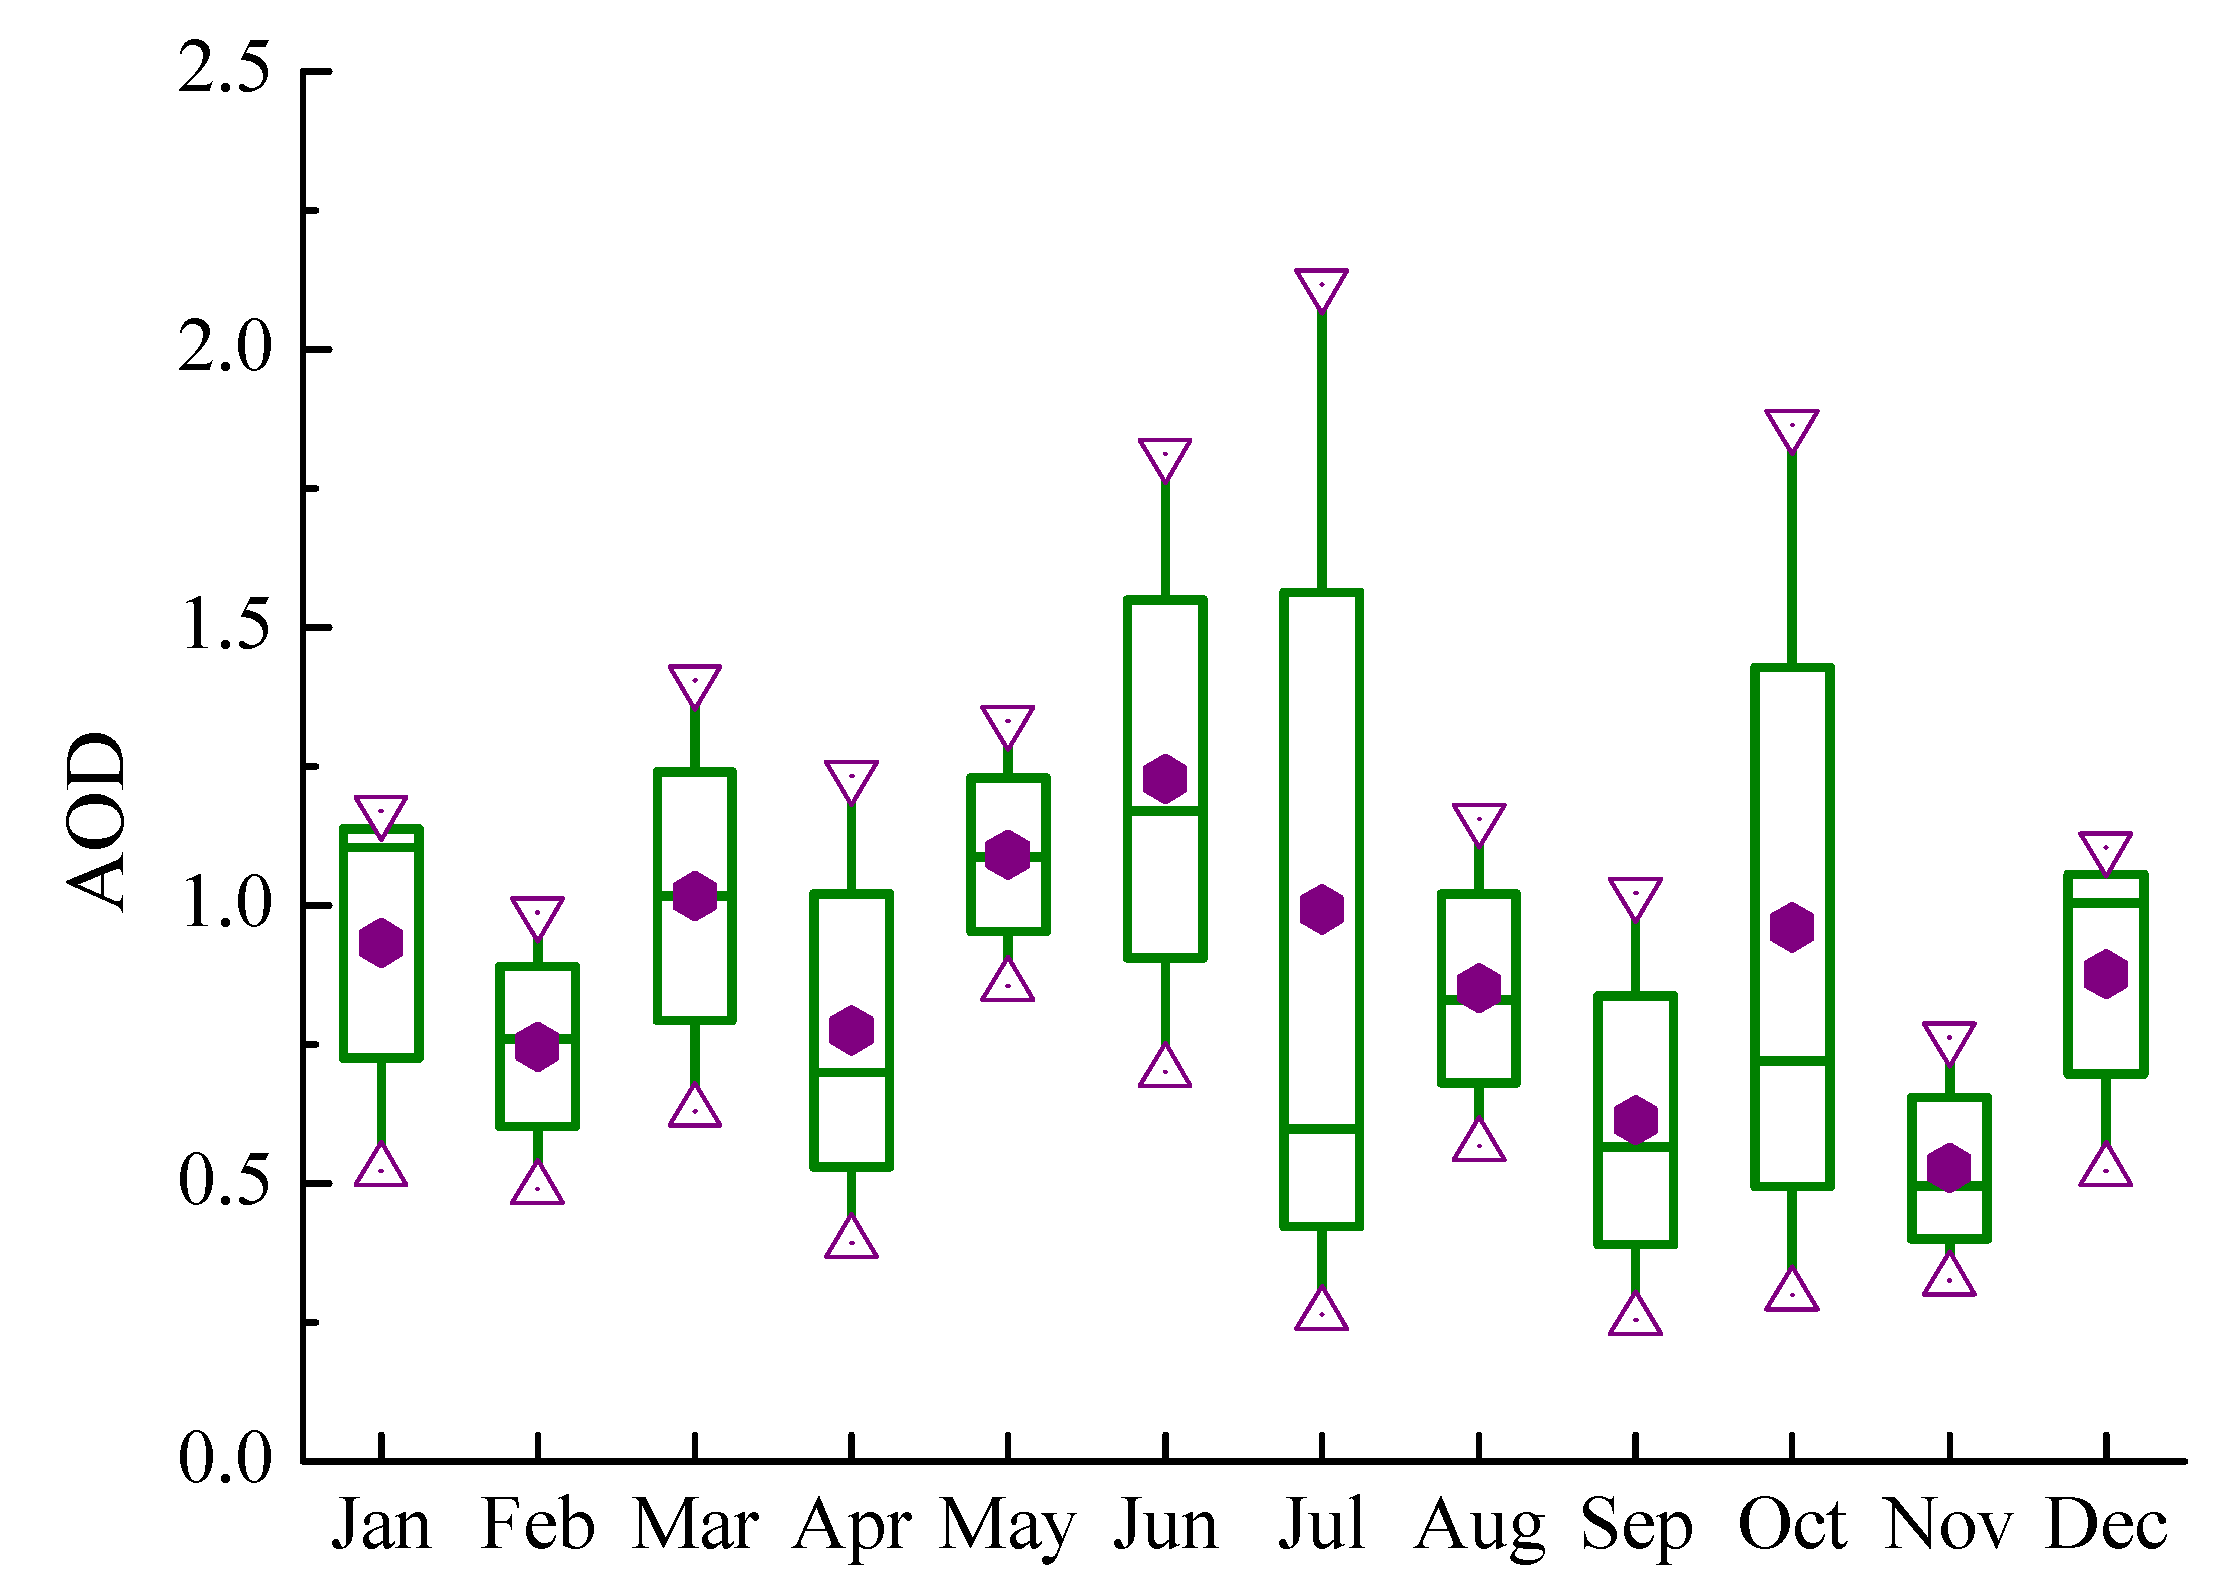
Figure 4 shows the monthly statistics of AOD at 500 nm that explains which month plays a key role in the corresponding season. The monthly average values varied with air quality and water vapor content. The minimum value ~0.25 appeared in July and September, which may have been due to abundant rainfall. The monthly maximum value ~2.2 also occurred in July and was lower in the other months, which could be possibly due to the great water vapor content in the atmosphere on certain days. As we can see, the maximum value was ~2.2 and the minimum value was ~0.25 but the minimum mean value was ~0.6 in July, which demonstrated clear days accounted for the vast majority; this could explain why the maximum value in summer (
Figure 3) occurred in July.
Figure 3.
Seasonal statistics of AOD at 500 nm. The purple dot represents the AOD mean of the maximum and minimum in each season; the box is 25 and 75 percentiles; the triangles represent the maximum and the minimum, respectively, and the short horizontal line represents the seasonal averaged AOD value.
Figure 4.
Monthly statistics of AOD at 500 nm. The purple dot represents the AOD mean of the maximum and minimum in each month; the triangles represent the maximum and the minimum of monthly AOD, respectively; the short horizontal line represents the monthly averaged AOD value.
Figure 4.
Monthly statistics of AOD at 500 nm. The purple dot represents the AOD mean of the maximum and minimum in each month; the triangles represent the maximum and the minimum of monthly AOD, respectively; the short horizontal line represents the monthly averaged AOD value.
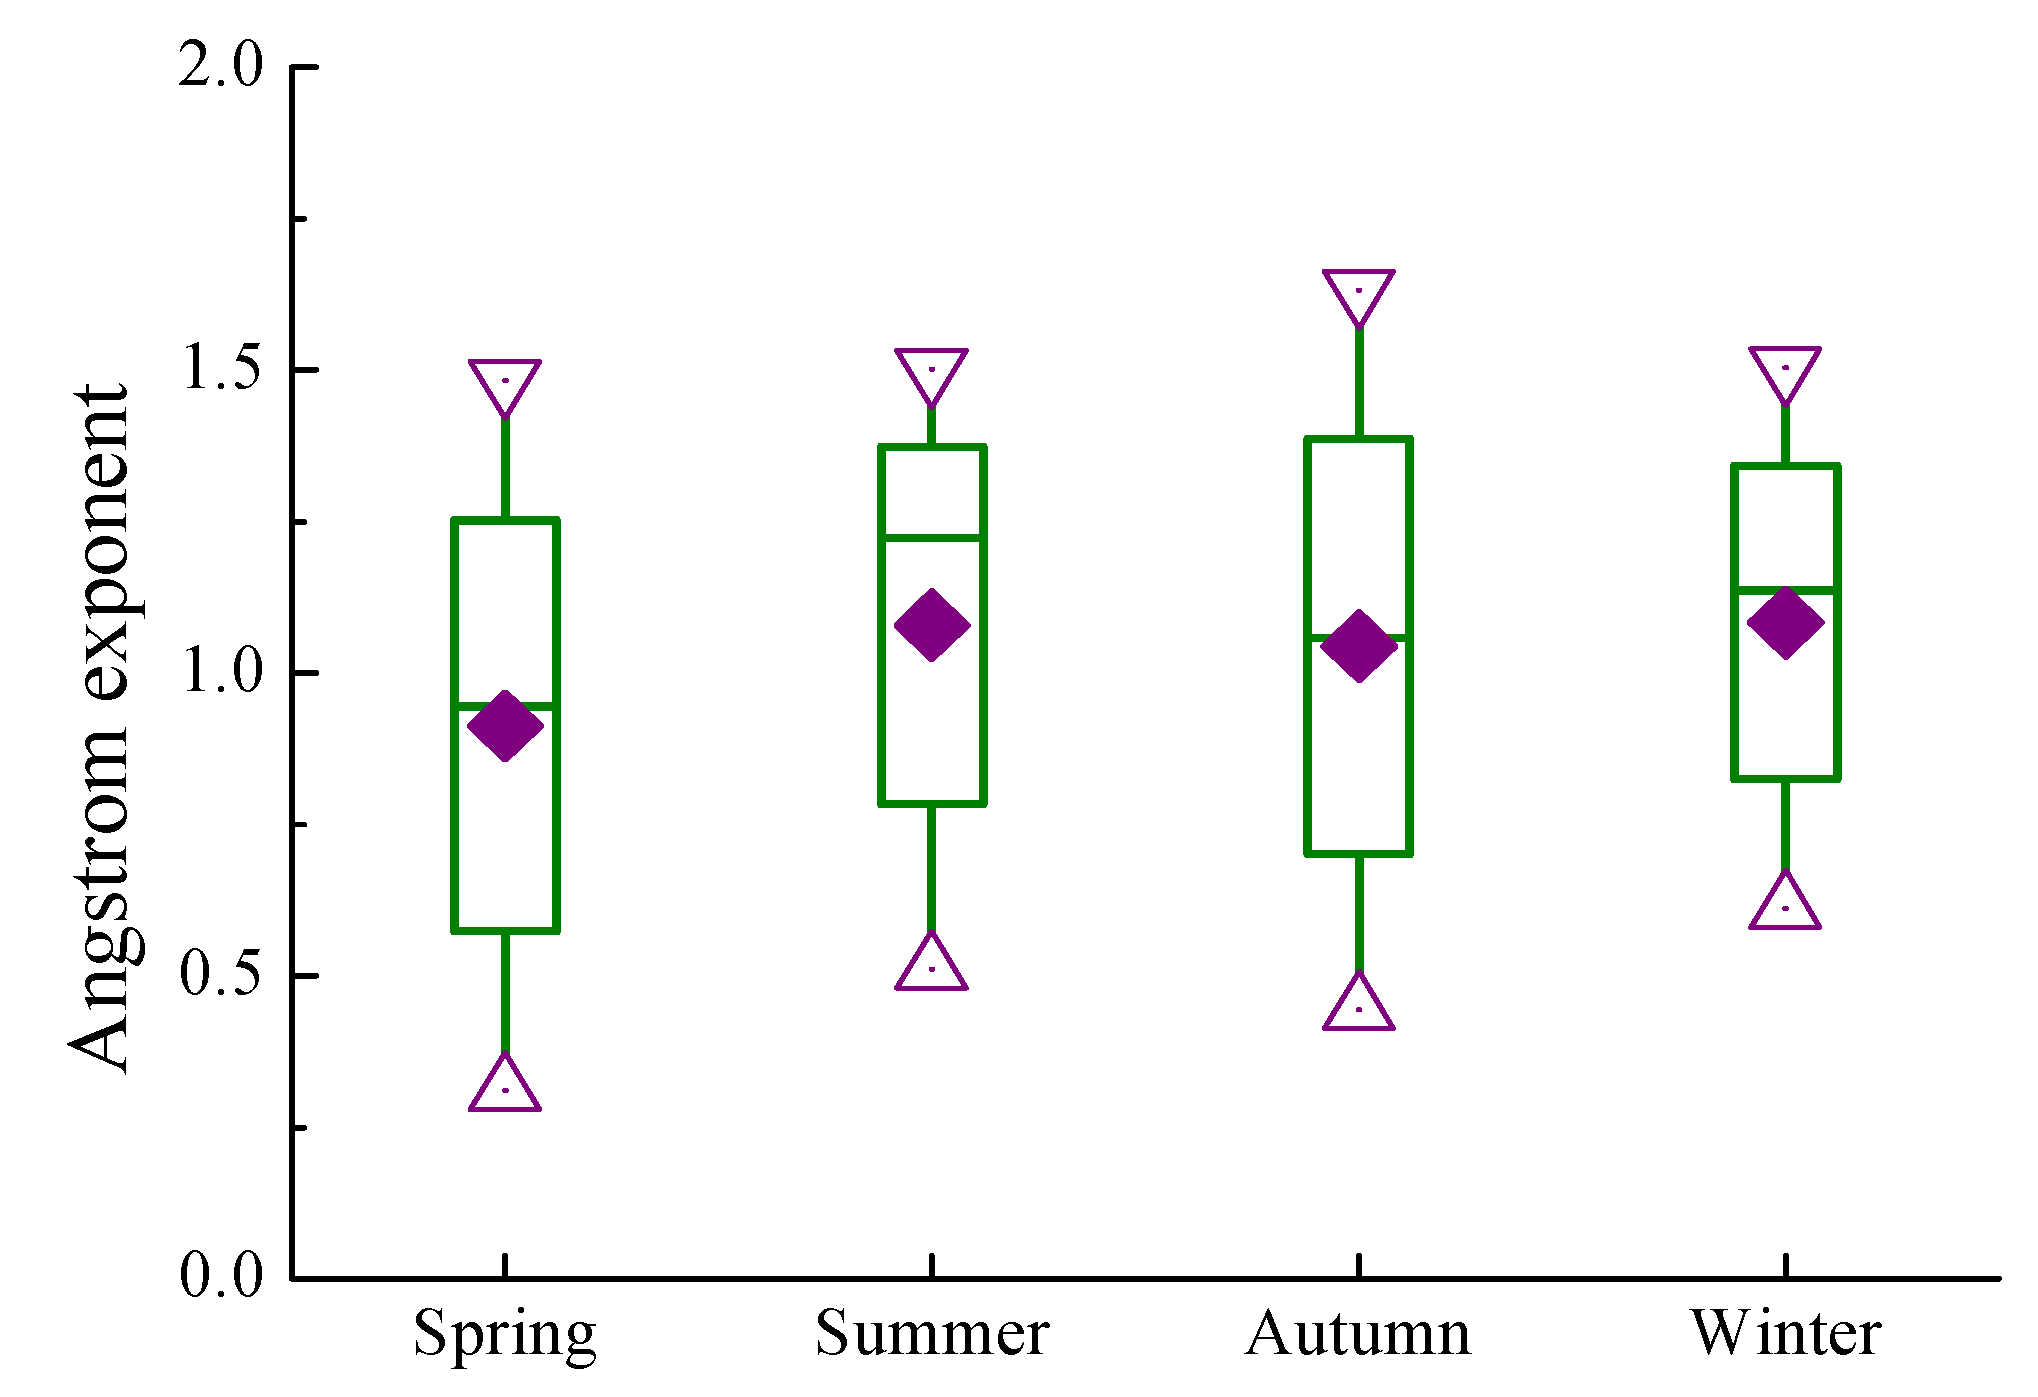
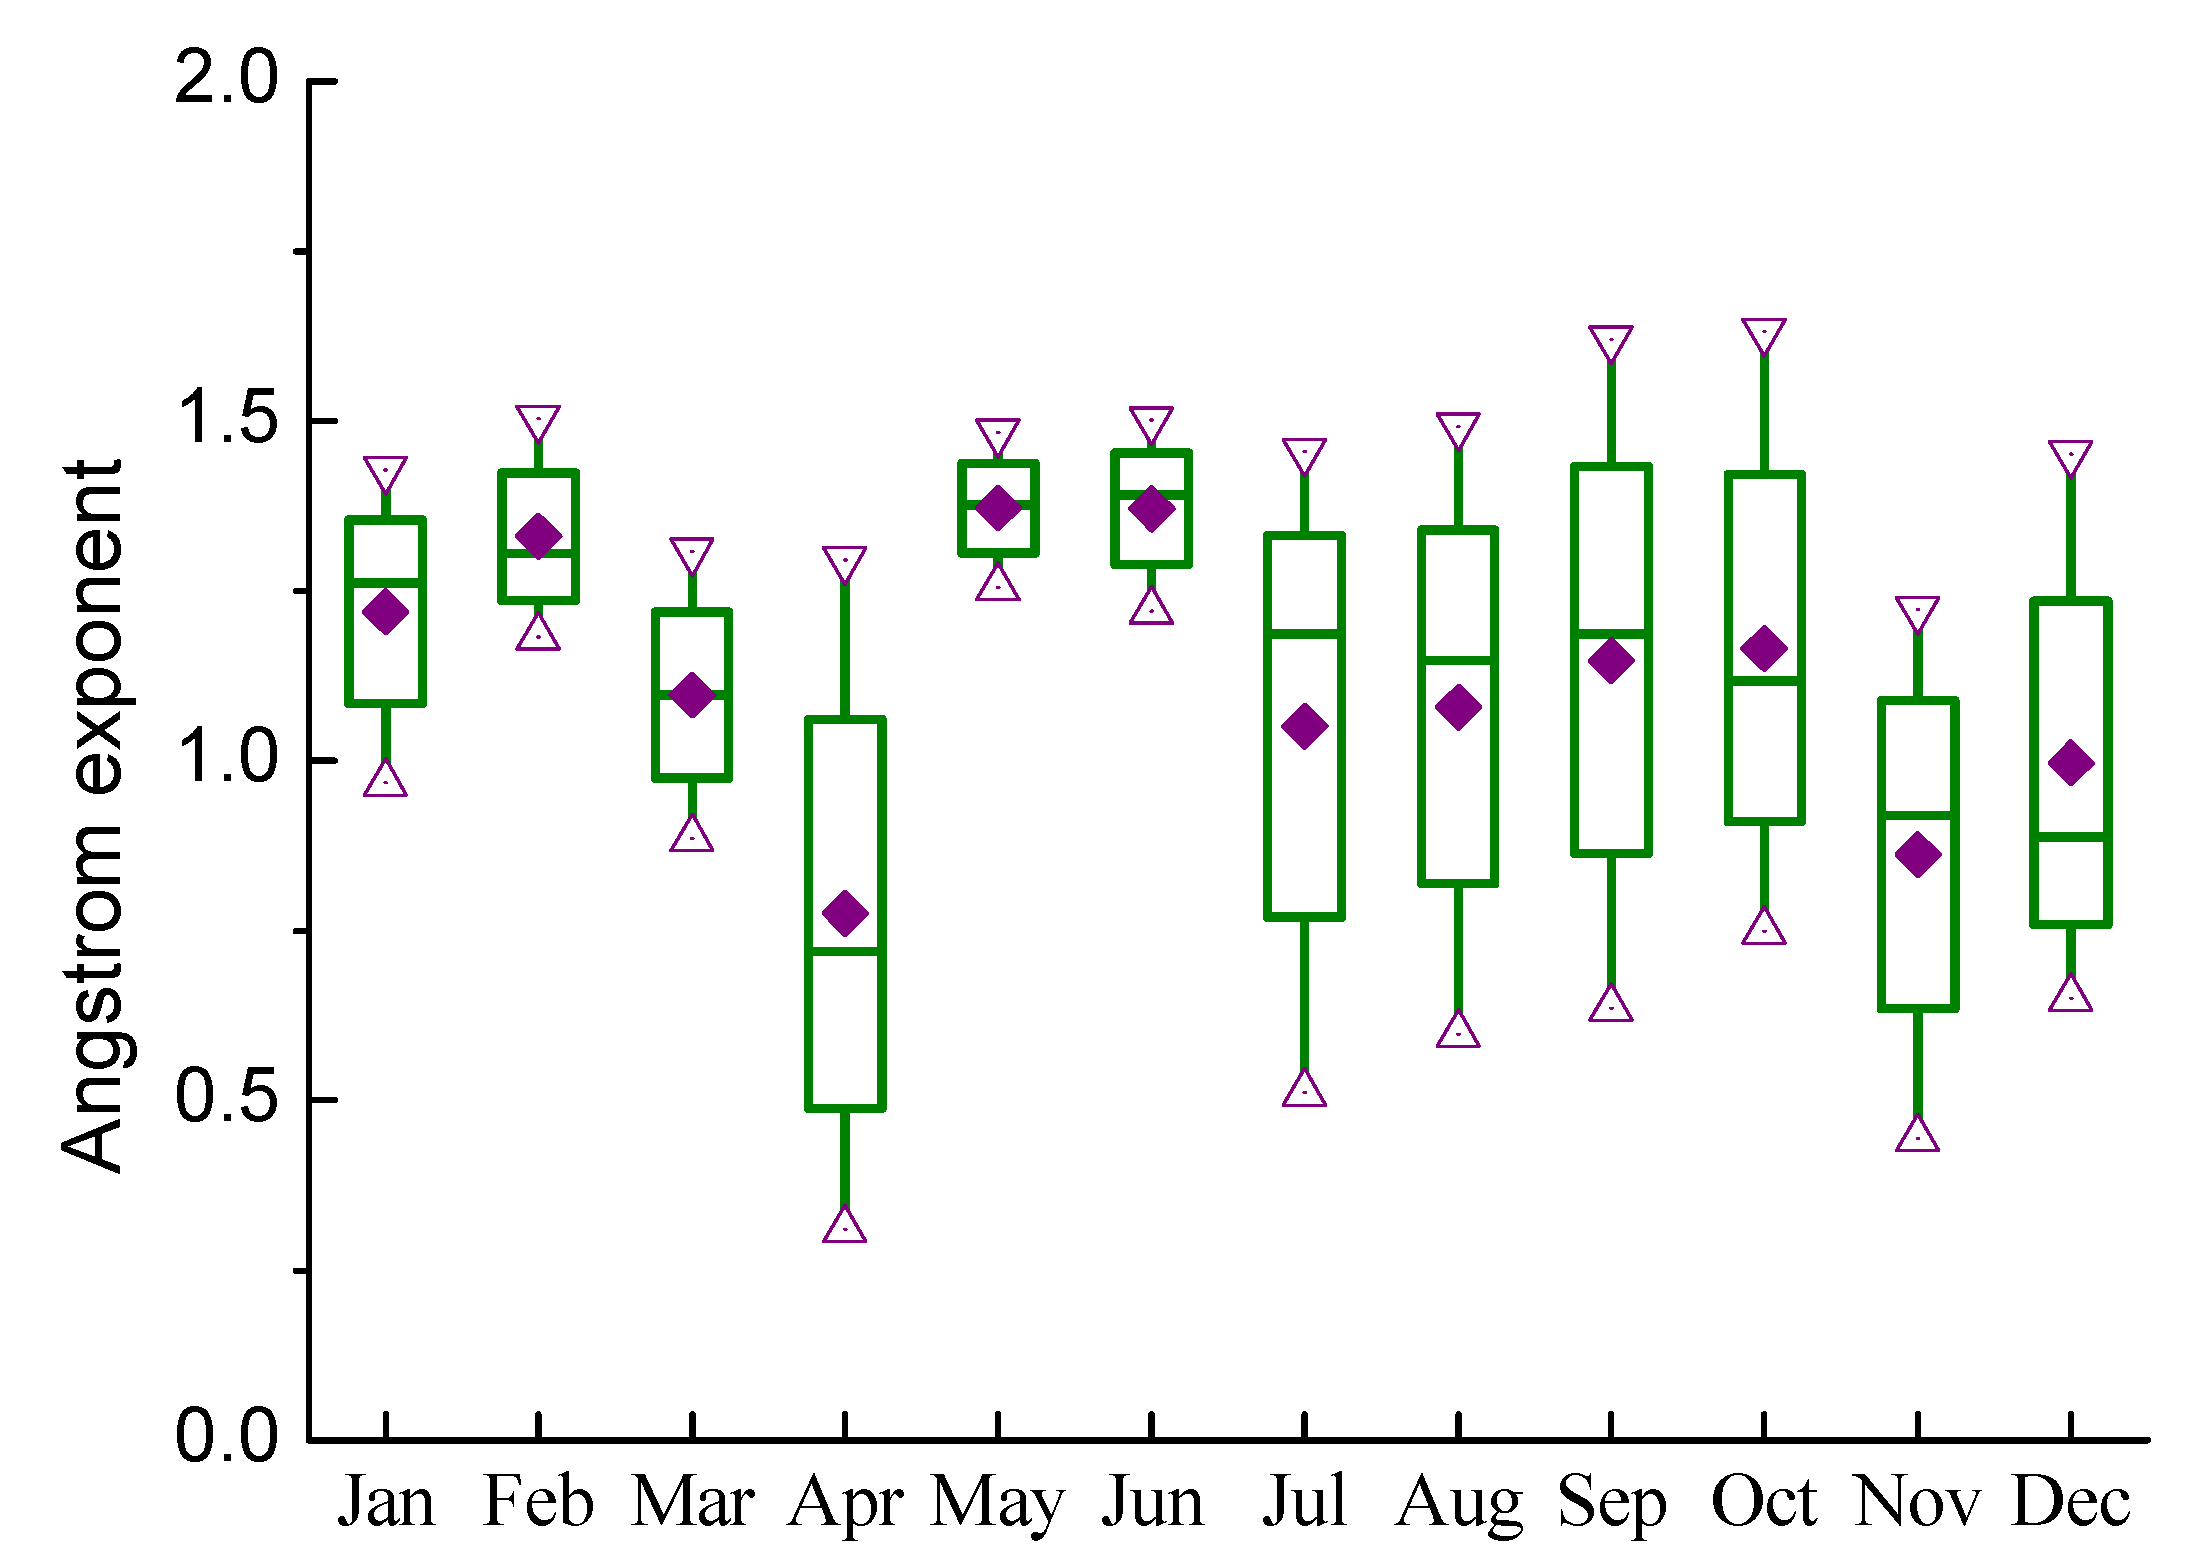
Figure 5 shows the seasonal statistics of Ångström exponents in Wuhan. The Ångström exponent decreased with increasing aerosol particle size. The annual averaged Ångström exponent was 1.11. The mean Ångström exponent reached a maximum value in summer (~1.22) and minimum value in spring (~0.99), which suggested that the fine particles contributed a much larger aerosol fraction during summer and the coarse particles were main parts during spring. However, the mean Ångström exponent was 1.06 and 1.14, respectively, which might imply an indication of mixed aerosol types. During summer, the highest value was ~1.5, the lowest ~0.4,but the mean ~1.22, it might indicate that the clear weather was dominant.
Figure 5.
Seasonal statistics of Ångström exponents. The purple diamond represents the mean of the maximum and minimum; the box is 25 and 75 percentiles; the triangles represent the maximum and the minimum, respectively; the short horizontal line represents the seasonal averaged Ångström exponent value.
Figure 6 shows the monthly statistics of Ångström exponents in Wuhan which indicates every month contributes to the corresponding season. This primarily shows the monthly differences in particle size. The monthly averaged Ångström exponent decreased from ~1.25 in January to ~0.7 in April, and fluctuated around 1.0 from July to October. The monthly averaged Ångström exponent value was highest in May and June (~1.4) and lowest in April (~0.7). In other words, the fine particles were more prevalent in May and June, while coarse particles were more prevalent in April. During summer, the seasonal averaged value was ~1.22 (
Figure 5), and the monthly mean values were about 1.4, 1.2, and 1.15 for June, July, and August, respectively. It suggested that June made a largest contribution to summer. Similarly, in July, the monthly mean was about 1.15 and the maximum was about 1.5, the minimum was about 0.5, which implied that the clear days were in the majority.
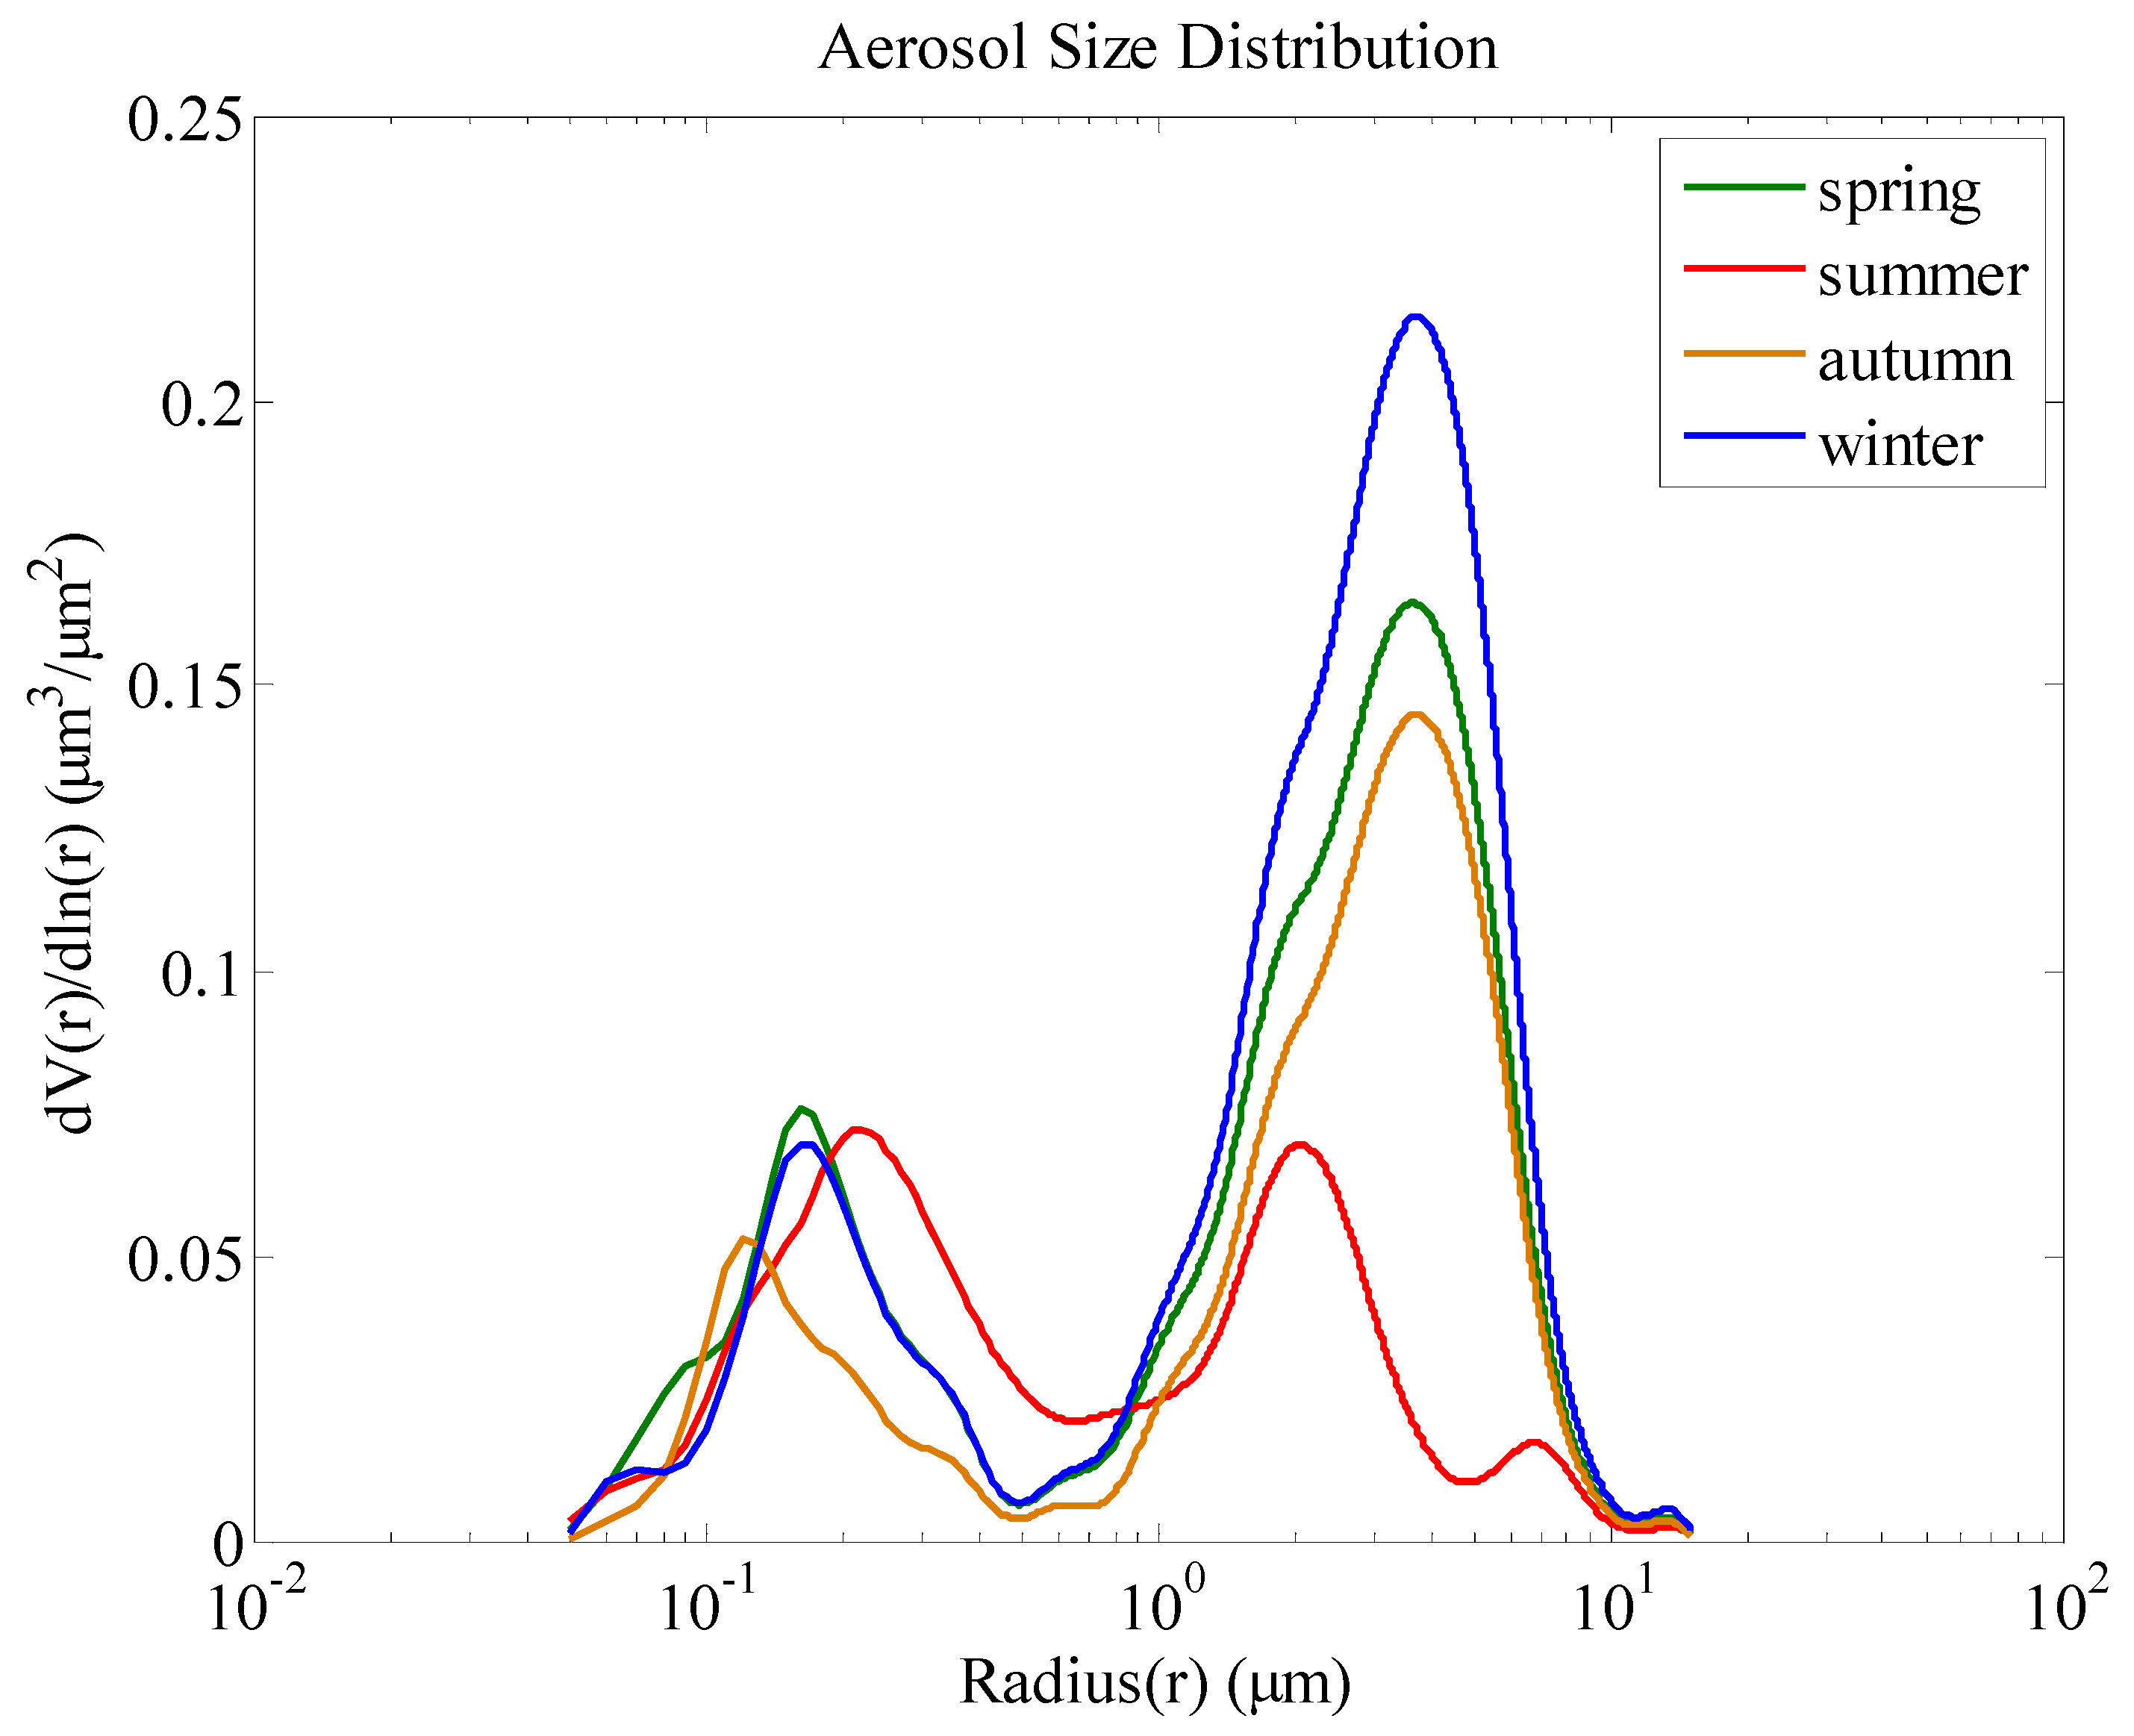
Figure 7 shows the seasonal variations in ASD, with a bimodal distribution in spring, autumn, and winter, and a trimodal distribution in summer. In the bimodal distributions, the fine mode ranged from 0.1 µm to 1 µm, with the peak centered on approximately 0.2 µm; the coarse mode ranged from 1 µm to 10 µm with a peak centered on approximately 4 µm. And the bimodal aerosol size distributions were dominated by coarse particles. During winter, the ASD value was larger than that of the other three seasons in the coarse mode range due to its highest AOD (~0.84) and the larger Ångström exponent (~1.14), which might be attributed to cold and wet air, amount of building construction, huge population and aerosol accumulation resulting from wind or precipitation, although, it is unlike other coal-fired heating cities in northern China. However, there were little difference among four seasons in the fine mode range and all values were less than 0.1, which implied that the fine particles were from local natural sources and its content was relatively stable. Summer showed a distinct pattern due to a slightly higher AOD (~0.76) and the highest Ångström exponent (~1.22), which was possibly due to plentiful precipitation leading to the removal of coarse particles and reduction in the number of fine particles. Another peak of about 0.02 appeared at a radius of about 7 µm, and this might be owing to the hygroscopic growth of the existing local particles and the production of aerosol precursor resulting from the extreme-high temperature and high humidity.
Figure 6.
Monthly statistics of Ångström exponents. The purple diamond represents the mean of the monthly maximum and monthly minimum; the triangles represent the maximum and the minimum of each month, respectively; the short horizontal line represents the monthly averaged Ångström exponent value.
Figure 6.
Monthly statistics of Ångström exponents. The purple diamond represents the mean of the monthly maximum and monthly minimum; the triangles represent the maximum and the minimum of each month, respectively; the short horizontal line represents the monthly averaged Ångström exponent value.
Figure 7.
Seasonal variations of aerosol size distributions (ASD) in Wuhan from March 2012 to February 2013.
Figure 7.
Seasonal variations of aerosol size distributions (ASD) in Wuhan from March 2012 to February 2013.
4. Conclusions
Sun photometer measurements were used to calculate seasonal ASD over one year in Wuhan, China. We used 500 nm as the optimal wavelength for our analysis. Wuhan is the most developed area in Central China with many factories and a large population, so the seasonally averaged AOD values were relatively large. The minimum monthly AOD mean value appeared in July, possibly due to the large amount of precipitation and extreme-high temperature, while the maximum monthly AOD mean value occurred in January and was possibly due to cold and wet air, heavy anthropogenic aerosol derived from building construction and manufacturing industry, and stagnant weather. The monthly averaged Ångström exponent peaked in May and June and was lowest in December and April. Based on this, fine particles appeared to be more prevalent in the summer while coarse particles dominated during spring and winter. Seasonal ASD differences were obtained based on the inversion calculation from corresponding seasonal AOD, and we found that ASD could partially be explained using AOD and Ångström exponent, with AOD reflecting the air quality and Ångström exponent corresponding to particle size. The ASD spectrum showed a bimodal distribution during all seasons except for summer. During summer, the spectrum showed a distinct trimodal pattern, Ångström exponents indicated that fine particles were most prevalent, and the AOD values indicated poor air quality. Potential reasons for this result included the hygroscopic growth of local particles and the production of aerosol precursor during summer.
This study investigated the monthly and seasonal variations in AOD and Ångström exponents as well seasonal variations in ASD in Wuhan, China. The relationships we observed among AODs, Ångström exponents, and ASD showed that further study of aerosol properties and atmospheric environmental protection is still needed. However, the characterization of aerosol type in Wuhan is also quite difficult and long-term observed data are required in order to improve our understanding of aerosol effects on the climate and atmospheric environment.


