Article

Temporal-Spatial Variation of Drought Indicated by SPI and SPEI in Ningxia Hui Autonomous Region, China

1
State Key Laboratory of Cryospheric Sciences, Cold and Arid Regions Environmental and Engineering Research Institute, Chinese Academy of Sciences, Lanzhou 73000, Gansu, China
2
University of Chinese Academy of Sciences, Beijing 100049, China
3
College of Geographical Science, Shanxi Normal University, Linfen 041000, Shanxi, China
*
Author to whom correspondence should be addressed.
Atmosphere 2015, 6(10), 1399-1421; https://doi.org/10.3390/atmos6101399
Submission received: 18 June 2015 / Revised: 17 September 2015 / Accepted: 22 September 2015 / Published: 30 September 2015

Abstract

:
The Ningxia Hui Autonomous Region of China (Ningxia) is an important food production area in northwest China severely affected by drought. The Standardized Precipitation Index (SPI) and Standardized Precipitation Evapotranspiration Index (SPEI) were calculated based on monthly meteorological data to explore climate change and variation in drought intensity, duration, frequency, and spatial extent in Ningxia during 1972–2011. Results show that the SPEI is more applicable than the SPI for exploring climate change and drought variation in Ningxia. The Ningxia climate experienced a significant drying tendency. Annual SPEI decreased about 0.37 decade−1 during 1972–2011. Drought was exacerbated by this drying tendency. Regional average duration, maximum duration, intensity, and frequency of drought identified by the SPEI increased by one month, three months, 0.15%, and 36.1%, respectively, during 1992–2011 compared to the period of 1972–1991. The spatial extent of drought identified by the SPEI increased about 14.4% decade−1 in the spring during 1972–2011. Spatially, drought frequency increased from north to south. Average intensity (maximum duration) of drought calculated by the SPEI increased (decreased) northward and southward from the central arid area.

Graphical Abstract

1. Introduction

Drought is the most complex and damaging natural disaster. It has severe impacts on natural ecosystems [1], water resources [2], agriculture production [3], and society [4]. Drought differs from other extreme events in many ways, especially because it is very difficult to identify when it starts and predict when it will end [5,6,7].
Many drought indices have been developed to monitor, predict, and assess the severity of drought, such as the Palmer Drought Severity Index (PDSI) [8], Standardized Precipitation Index (SPI) [5], Standardized Precipitation Evapotranspiration Index (SPEI) [9], Vegetation Condition Index (VCI) [10], Effective Drought Index (EDI) [11], Reconnaissance Drought Index (RDI) [12], Soil Moisture Index (SMI) [13], Integrated Surface Drought Index (ISDI) [14], and Multivariate Standardized Drought Index (MSDI) [15], and so on. Among these, the SPI and PDSI are the most widely used. The SPI is based solely on precipitation, is easy to calculate, and has multi-scale features that identify different types of drought [1,5,6,7,8,9,10,11,12,13,14,15,16,17]. The PDSI is based on soil water balance and its data requirements are relatively high. It also lacks flexibility to adapt to the intrinsic multi-scalar nature of drought [7,9]. The SPEI was recently developed by Vicente-Serrano et al. [9] and is based on a monthly (or weekly) climatic water balance (the difference between precipitation [P] and evapotranspiration [PET]) [18]. The SPEI combines the multi-scalar features and simple calculation of the SPI with the PDSI’s sensitivity to changes in evaporation demand caused by temperature fluctuations and trends [7]; the main advantage of the SPEI is its ability to identify different drought types. This is applicable for monitoring and exploring drought characteristics in a global warming context [17,19].
China is one of the countries most seriously affected by drought. The total farmland area affected by drought in China is about 21.56 million ha, which is about 60% of the total amount affected by all types of meteorological disasters [20]. Drought occurs frequently in Northern China, especially in Northwest China [21]. Moreover, most parts of Northern China experienced increased drought frequency during the years 1980–2000 and 2004–present [22]. Previous studies have suggested that the entire area of Northwest China experienced a drying tendency during years 1960–2007 [23]. However, there were significant spatial differences in drought variation in Northwest China. Some studies indicated a wetting tendency occurred in the western part of Northwest China [24]. Meanwhile, no significant trends were detected in drought area [25] and a decreasing trend in drought severity was identified [26]. Most studies observed a significant warming and drying trend in eastern Northwest China [27] and an increasing drought tendency [26]. Drought frequency also had an increasing trend in eastern Northwest China, especially after the mid-1990s [28].
China is located in East Asia and is affected greatly by the monsoon climate from the Pacific Ocean, and monsoon instability results in frequent droughts [20]. Precipitation has decreased from the southeast coast to the northwest region of China’s mainland and causes more severe droughts in Northern and Northwest China [20]. Precipitation variation is a major factor in drought occurrence, so atmospheric circulation effects on precipitation may have similar effects on drought [29]. Previous studies indicated that weaker East Asian Summer Monsoon (EASM) was the main cause responsible for decreasing northward propagation of water vapor flux, causing different wet (dry) tendency in South (North) China [30]. Guo et al. [31] found a positive correlation between the EASM and precipitation in North China. Ding et al. [32] pointed out that the EASM greatly weakened, thus leading to much deficient moisture supply for precipitation in North China. In addition, the climate is also affected by the North Atlantic Oscillation (NAO). Some studies discovered that the summer precipitation over the Eastern Tibetan Plateau (TP) is closely related to the NAO [33,34]. Lee and Zhang [35] also indicated that drought disaster in Northwest China is correlated negatively with the NAO.
The Ningxia Hui Autonomous Region (Ningxia) is located in the eastern part of Northwest China. Ningxia is a very important food production area in Northwest China that has been severely affected by persistent drought. A crop area of about 26.69 × 10⁴ hm2 was impacted by drought each year in Ningxia during the years 1978–2010 [36]. The evolutionary characteristics of droughts should be comprehensively analyzed to identify the potential drought risk. Previous studies identified a tendency for drought intensification in Ningxia in recent decades [37,38,39,40,41,42], especially in the 21st century [40]. In Ningxia, droughts mainly occurred in the spring [37,43]. Spatially, the trend magnitude of drought intensification decreased northward and southward from the central arid area [39]. Although the drought evolutions have been explored in Ningxia, most previous researches have only used precipitation data [37,38,39,40] and mainly concentrated on variation in the SPI, Z-index, and percentage of precipitation anomalies (Pa). Wang et al. [41] and Li et al. [42] investigated drought variation in Ningxia with the Compound Index of Meteorological Drought (CI), which is based on both precipitation and evapotranspiration. However, they did not explore the primary causes of drought variation.
The objective of this study is to examine the applicability of the SPEI, the temporal-spatial variation of drought, and potential causal factors of drought in Ningxia. Monthly precipitation and mean air temperature were used to explore drought intensity, duration, frequency, and spatial extent in Ningxia during the years 1972–2011 by calculating the Standardized Precipitation Index (SPI) and the Standardized Precipitation Evapotranspiration Index (SPEI). Trends in the SPI/SPEI and drought station proportion series were detected by the nonparametric Mann–Kendall (M–K) test. Correlation between atmospheric circulation and drought indicators was tested to identify potential causal factors of drought variation in Ningxia.

2. Study Area, Data and Methods
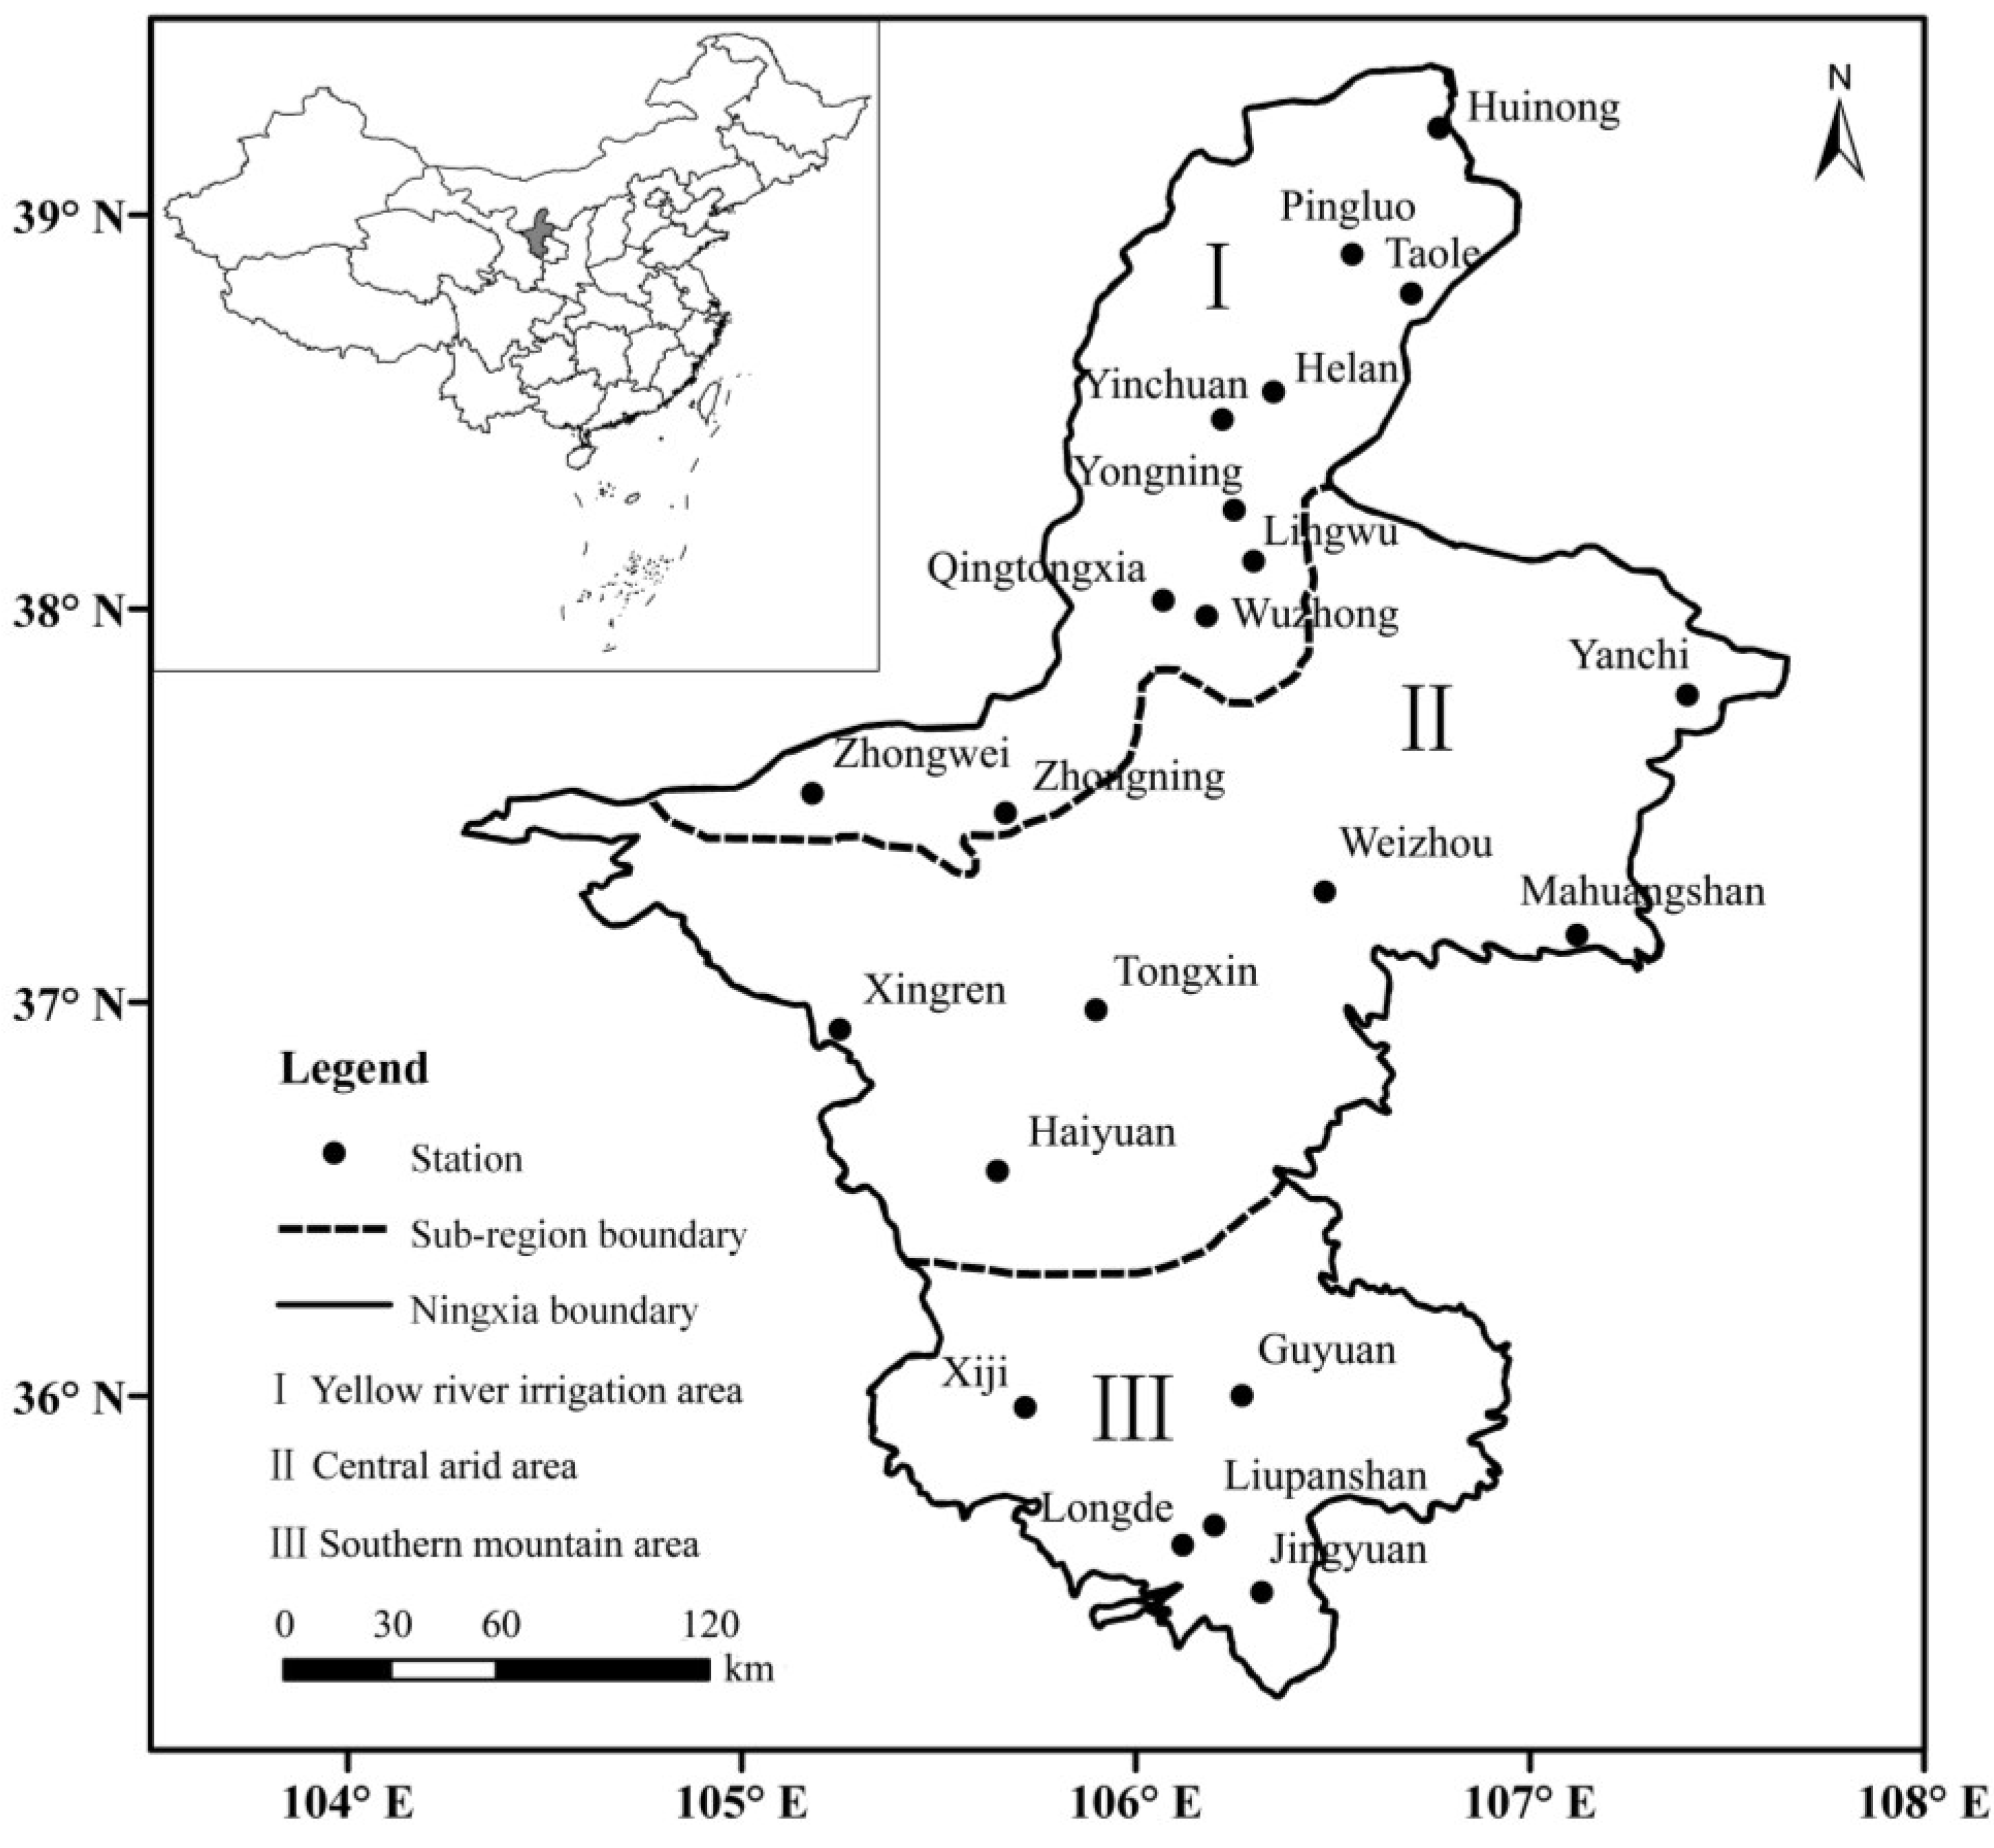
2.1. Study Area

Ningxia (35°14′–39°23′N, 104°17′–107°39′E) is located in Northwest China (Figure 1), which is in the Eurasian hinterland far from the sea. It spans 456 km from north to south and only 250 km from west to east and has an area of about 6.6 × 10⁴ km2 [44]. Ningxia has a temperate continental climate with hot summers and cold winters. It also belongs to the arid climates region according to Köppen–Geiger climate classification [45]. It is largely arid and semi-arid region with low rainfall, high evaporation, and uneven distribution of water resources [46]. Multi-year average annual total precipitation is from 169 to 630 mm in Ningxia, during years 1971–2011. Meanwhile, the precipitation is greatest in summer (100–400 mm), while lowest in winter (3–24 mm). The summer (winter) precipitation in Ningxia is mainly affected by the convective events (winter wind from the northwest).
Figure 1. Location of study area and distribution of meteorological stations.
Atmosphere 06 01399 g001
As a result, the ecosystem is very fragile and sensitive to climate change [47]. Ningxia is typically divided into three sub-regions according to climate conditions, farming, and animal husbandry distribution, and the eco-environment: the Yellow River irrigation area (North NX), the central arid area (Middle NX), and the southern mountain area (South NX) (Figure 1) [48,49]. Annual precipitation is less than 200 mm in the North NX, 200–400 mm in the Middle NX, and more than 400 mm in the South NX.

2.2. Data and Processing

Monthly precipitation and monthly mean air temperature data were collected from 22 meteorological stations (Figure 1) maintained by the Ningxia Meteorological Administration for the SPI and SPEI calculations. The complete time series of both precipitation and air temperature for each station were chosen from January 1971 to December 2011. The Ningxia Meteorological Administration strictly controlled data quality, and missing data values were substituted with average values. The regional value is the average value of all station values in Ningxia. The same data calculation method was used for each sub-region and the region as a whole.
The East Asian Summer Monsoon Index (EASMI) [50], South Asian Summer Monsoon Index (SASMI) [51], and North Atlantic Oscillation Index (NAOI) [52,53] were used to examine the relationship between atmospheric circulation and drought in Ningxia during years 1972–2011. Monthly EASMI and SASMI are from references [54,55], and monthly mean NAOI is provided by NOAA [56].
Seasonal atmospheric circulation indices were defined as the average values for spring (March, April, May), summer (June, July, August), autumn (September, October, November), and winter (December, January, and February).

2.3. Methods

2.3.1. Calculation of the SPI and SPEI

Standardized Precipitation Index (SPI)

The SPI was developed by McKee et al. [5] to define and monitor drought events at multiple time scales (1-, 3-, 6-, 12-, and 24-month). The World Meteorological Organization (WMO) recommended the SPI as a standard drought index [1,19]. The SPI only uses precipitation and can monitor both dry and wet conditions [57]. Negative and positive values indicate dry and wet periods, respectively [58]. The SPI becomes more negative or positive as the conditions become more severely dry or wet [59]. SPI calculation requires at least 20–30 years of monthly precipitation data, and 50–60 years or more is ideal [60]. Monthly precipitation data during years 1971–2011 (41 years) was used to calculate the monthly SPI values for Ningxia. SPI computation involves fitting a gamma distribution to a precipitation series [5,61,62]. Further details of the computation have been extensively described in many works such as Edwards and McKee [63] and Almedeij [64].

Standardized Precipitation Evapotranspiration Index (SPEI)

The parameters of the SPEI are a time-series of total monthly precipitation (P) and monthly potential evapotranspiration (PET). Monthly PET was calculated by the Thornthwaite equation [65] that only relies on monthly mean temperature (T) and latitude (L) to calculate the monthly average day length. The details of the SPEI computation, more thoroughly described in Vicente-Serrano et al. [9], are as follows:
Climate Water Balance
A simple climate water balance was calculated as the differences between precipitation P and PET for month j according to:
D j = P j P E T j
where monthly PET is calculated by:
P E T = 16 K ( 10 T I ) m
where T is monthly mean temperature (°C); I is heat index calculated as the sum of 12 monthly index values; m is the coefficient dependent on I: m=6.75 × 10⁻⁷·I3 – 7.71 × 10⁻⁷·I2 + 1.79 × 10 −2·I + 0.492; and K is a correction coefficient computed as a function of the latitude and month.
The calculated Di values are aggregated at different time scales, following the same procedure as used for the SPI. The difference D i , j k in month j and year i depends on the chosen time scale k. For example, the accumulated difference for one month in a particular year i with a 12-month time scale is calculated using:
X i , j k = l = 13 k + j 12 D i 1 , l + l = 1 j D i , l ,   j < k
X i , j k = l = j k + 1 j D i , l ,   i f   j k
where Di, l is the P − PET difference in month l and year i, in millimeters.
Normalize the Water Balance
The log-logistic distribution was used for normalizing the D series to obtain the SPEI. The probability density function of a three-parameter log-logistic distributed variable is expressed as:
f ( x ) = β α ( x γ α ) β 1 [ 1 + ( x γ α ) β ] 2
where α, β, and γ are scale, shape, and origin parameters respectively, for D values in the range (γ ˃ D ˃ ). The parameters of the Pearson III distribution can be obtained from Singh et al. [66].
Thus, the probability distribution function of the D series, according to the log-logistic distribution, is given by:
F ( x ) = [ 1 + ( α x γ ) β ] 1
Calculate the SPEI Series
The SPEI can easily be obtained as the standardized values of F(x). Following the classical approximation of Abramowitz and Stegun [67]:
SPEI = W C 0 + C 1 W + C 2 W 2 1 + d 1 W + d 2 W 2 + d 3 W 3
Where:
W = 2 ln ( P )   for   P 0.5
and P is the probability of exceeding a determined D value, P = 1 – F(x). If P ˃ 0.5, then P is replaced by 1 − P and the sign of the resultant SPEI is reversed. The constants are C0 = 2.515517, C1 = 0.8022853, C2 = 0.010328, d1 = 1.432788, d2 = 0.189269, and d3 = 0.001308.
Monthly SPI and SPEI values for each meteorological station were computed by an SPI Calculator (NDMC) [68] and an SPEI Calculator [9,69], respectively. The SPEI follows the same classification criteria as SPI, because of the similarity in the calculation principles of SPEI and SPI [5,70,71,72,73,74] listed in Table 1. The more negative the SPI/SPEI value, the more severe the drought.
The SPI and SPEI can be calculated at any timescale, but typically the 1-, 3-, 6-, 12- and 24- months are used [1]. Drought at these time scales is relevant for agriculture (1-, 3-, and 6-month), hydrology (12-month) and socioeconomic impact (24-month) [75]. In addition, the 1-month SPI reflects a short-term condition [76]; the 3-month SPI provides a seasonal estimation of precipitation [76]; the 12-month SPI also reflects medium-term trends in precipitation patterns [19] and may provide an annual estimation of water condition. Therefore, this study used the SPI/SPEI values at 3- and 12-month scales to explore the drought variation at inter-seasonal and inter-annual time scales, respectively. We focused on the impact of drought disaster on agriculture because the Ningxia region is an important food production area in northwest China. Our goal was to provide some basic data for drought disaster risk assessment. Therefore, monthly SPI and SPEI values at the 3-month scale were used to identify drought events and their related indicators including duration, intensity, and frequency. The time-series of all drought indicators examined was from 1972 to 2011 and was split into two 20-year intervals (1972−1991 and 1992–2011).
Table 1. Drought classification based on the SPI and SPEI.
LevelDrought CategorySPI, SPEI Values
0Non-drought0 ≤ Index
1Mild drought−1.0 < Index < 0
2Moderate drought−1.5 < Index ≤ −1.0
3Severe drought−2.0 < Index ≤ −1.5
4Extreme droughtIndex ≤ −2.0

2.3.2. Drought Evaluation Indicators

A drought event is defined as a period in which the SPI is continuously negative and the SPI reaches a value of −1.0 or less according to McKee et al. [5]. Drought starts when the SPI first falls below zero and ends with the positive SPI value following a value of −1.0 or less [5]. A drought event can also be defined by the SPEI based on the same criterion as the SPI, for their similarity in the calculation principles. Once a drought event with a start and end month was determined, drought-related indicators including duration, severity, and intensity were then assigned.

Duration and Intensity of Drought Events

The duration (m) of a drought event equals the number of months between its start (included) and end month (not included) [77]. Severity (Se) is the absolute value of the sum of all SPI/SPEI values during a drought event. Intensity (DIe) of a drought event refers to severity divided by duration. The larger the DIe value is, the more severe the drought. The formulas are:
S e = | j = 1 m I n d e x j | e
D I e = S e m
where e is a drought event; j is a month; Indexj is the SPI/SPEI value in month j; m, Se and DIe are the duration, severity, and intensity of a drought event e, respectively.

Drought Frequency

Drought frequency (Fs) was used to assess the drought liability during a study period [3]. It is calculated by:
F s = n s N s × 100 %
where ns is number of drought events, Ns is total number of years for the study period, and s is a station.

Drought Station Proportion

Drought station proportion (Pj) is the ratio of number of drought stations to total number of stations. It indicates the spatial extent of drought occurrence in a region [78]. It is calculated by:
P j = n j N j × 100 %
where j is a month, nj is number of drought stations (when the SPI/SPEI < 0) in month j, and Nj is total number of stations used.

2.3.3. Method of Trend Analysis

The rank-based Mann–Kendall (M–K) trend test, a nonparametric statistical test, is used frequently to evaluate significance in a monotonic increasing or decreasing trend in hydro-meteorological time-series [79,80,81] including a series of drought indices [58]. The M–K test is unrestricted by sample distribution and a few abnormal values compared to parametric tests. Additional details on the M–K trend test are given in Kumar et al. [80] and Sicard et al. [81].
It is well known that the M–K test, devised for independent data, rejects the null hypothesis of no trend more often than specified by the significance level applied to autocorrelated series [82,83,84]. Therefore, prewhitening should be applied to autocorrelated series before performing the M–K test to eliminate the influence of serial autocorrelation on the trend detection of data series [84]. This study used the M–K test to detect possible trends in the summer NAOI series, the annual and seasonal SPI/SPEI series, and all drought station proportion series in Ningxia, during years 1972–2011. Since the SPI and SPEI at the 3- and 12-month scales are strongly autocorrelated by definition, the M–K test with the trend-free pre-whitening performed by R package “zyp” [83] was applied in these temporal data series. However, it essentially produced the same result.

3. Results

3.1. Spatial and Temporal Variation in the SPI and SPEI

Usually, the SPI/SPEI values at the 12-month time scale for December indicate the status of year-round water deficit caused by drought [3]. Additionally, the SPI/SPEI values at a 3-month scale are appropriate indicators of the status of seasonal water deficit caused by drought. Therefore, the annual SPI/SPEI value was denoted by the December SPI/SPEI of each year. The spring, summer, autumn, and winter values were denoted by the May, August, November and February SPI/SPEI values, respectively. Figure 2 and Figure 3 show the annual and seasonal SPI/SPEI series of the entire Ningxia region during years 1972–2011. Positive and negative trends represent trends towards wetter and drier conditions.
Figure 2. Annual variation of regional average SPI and SPEI values at the 12-month time scale in Ningxia during years 1972–2011 (Blue font denotes the M–K trend per decade (including the statistical significance) in the SPI/SPEI series).
Atmosphere 06 01399 g002
Figure 3. Variation in spring (a), summer (b), autumn (c), and winter (d) SPI and SPEI values at the 3-month time scale in Ningxia during the years 1972–2011 (X-axis represents the year; blue font denotes the M–K trend per decade (including the statistical significance) in the SPI/SPEI series).
Atmosphere 06 01399 g003

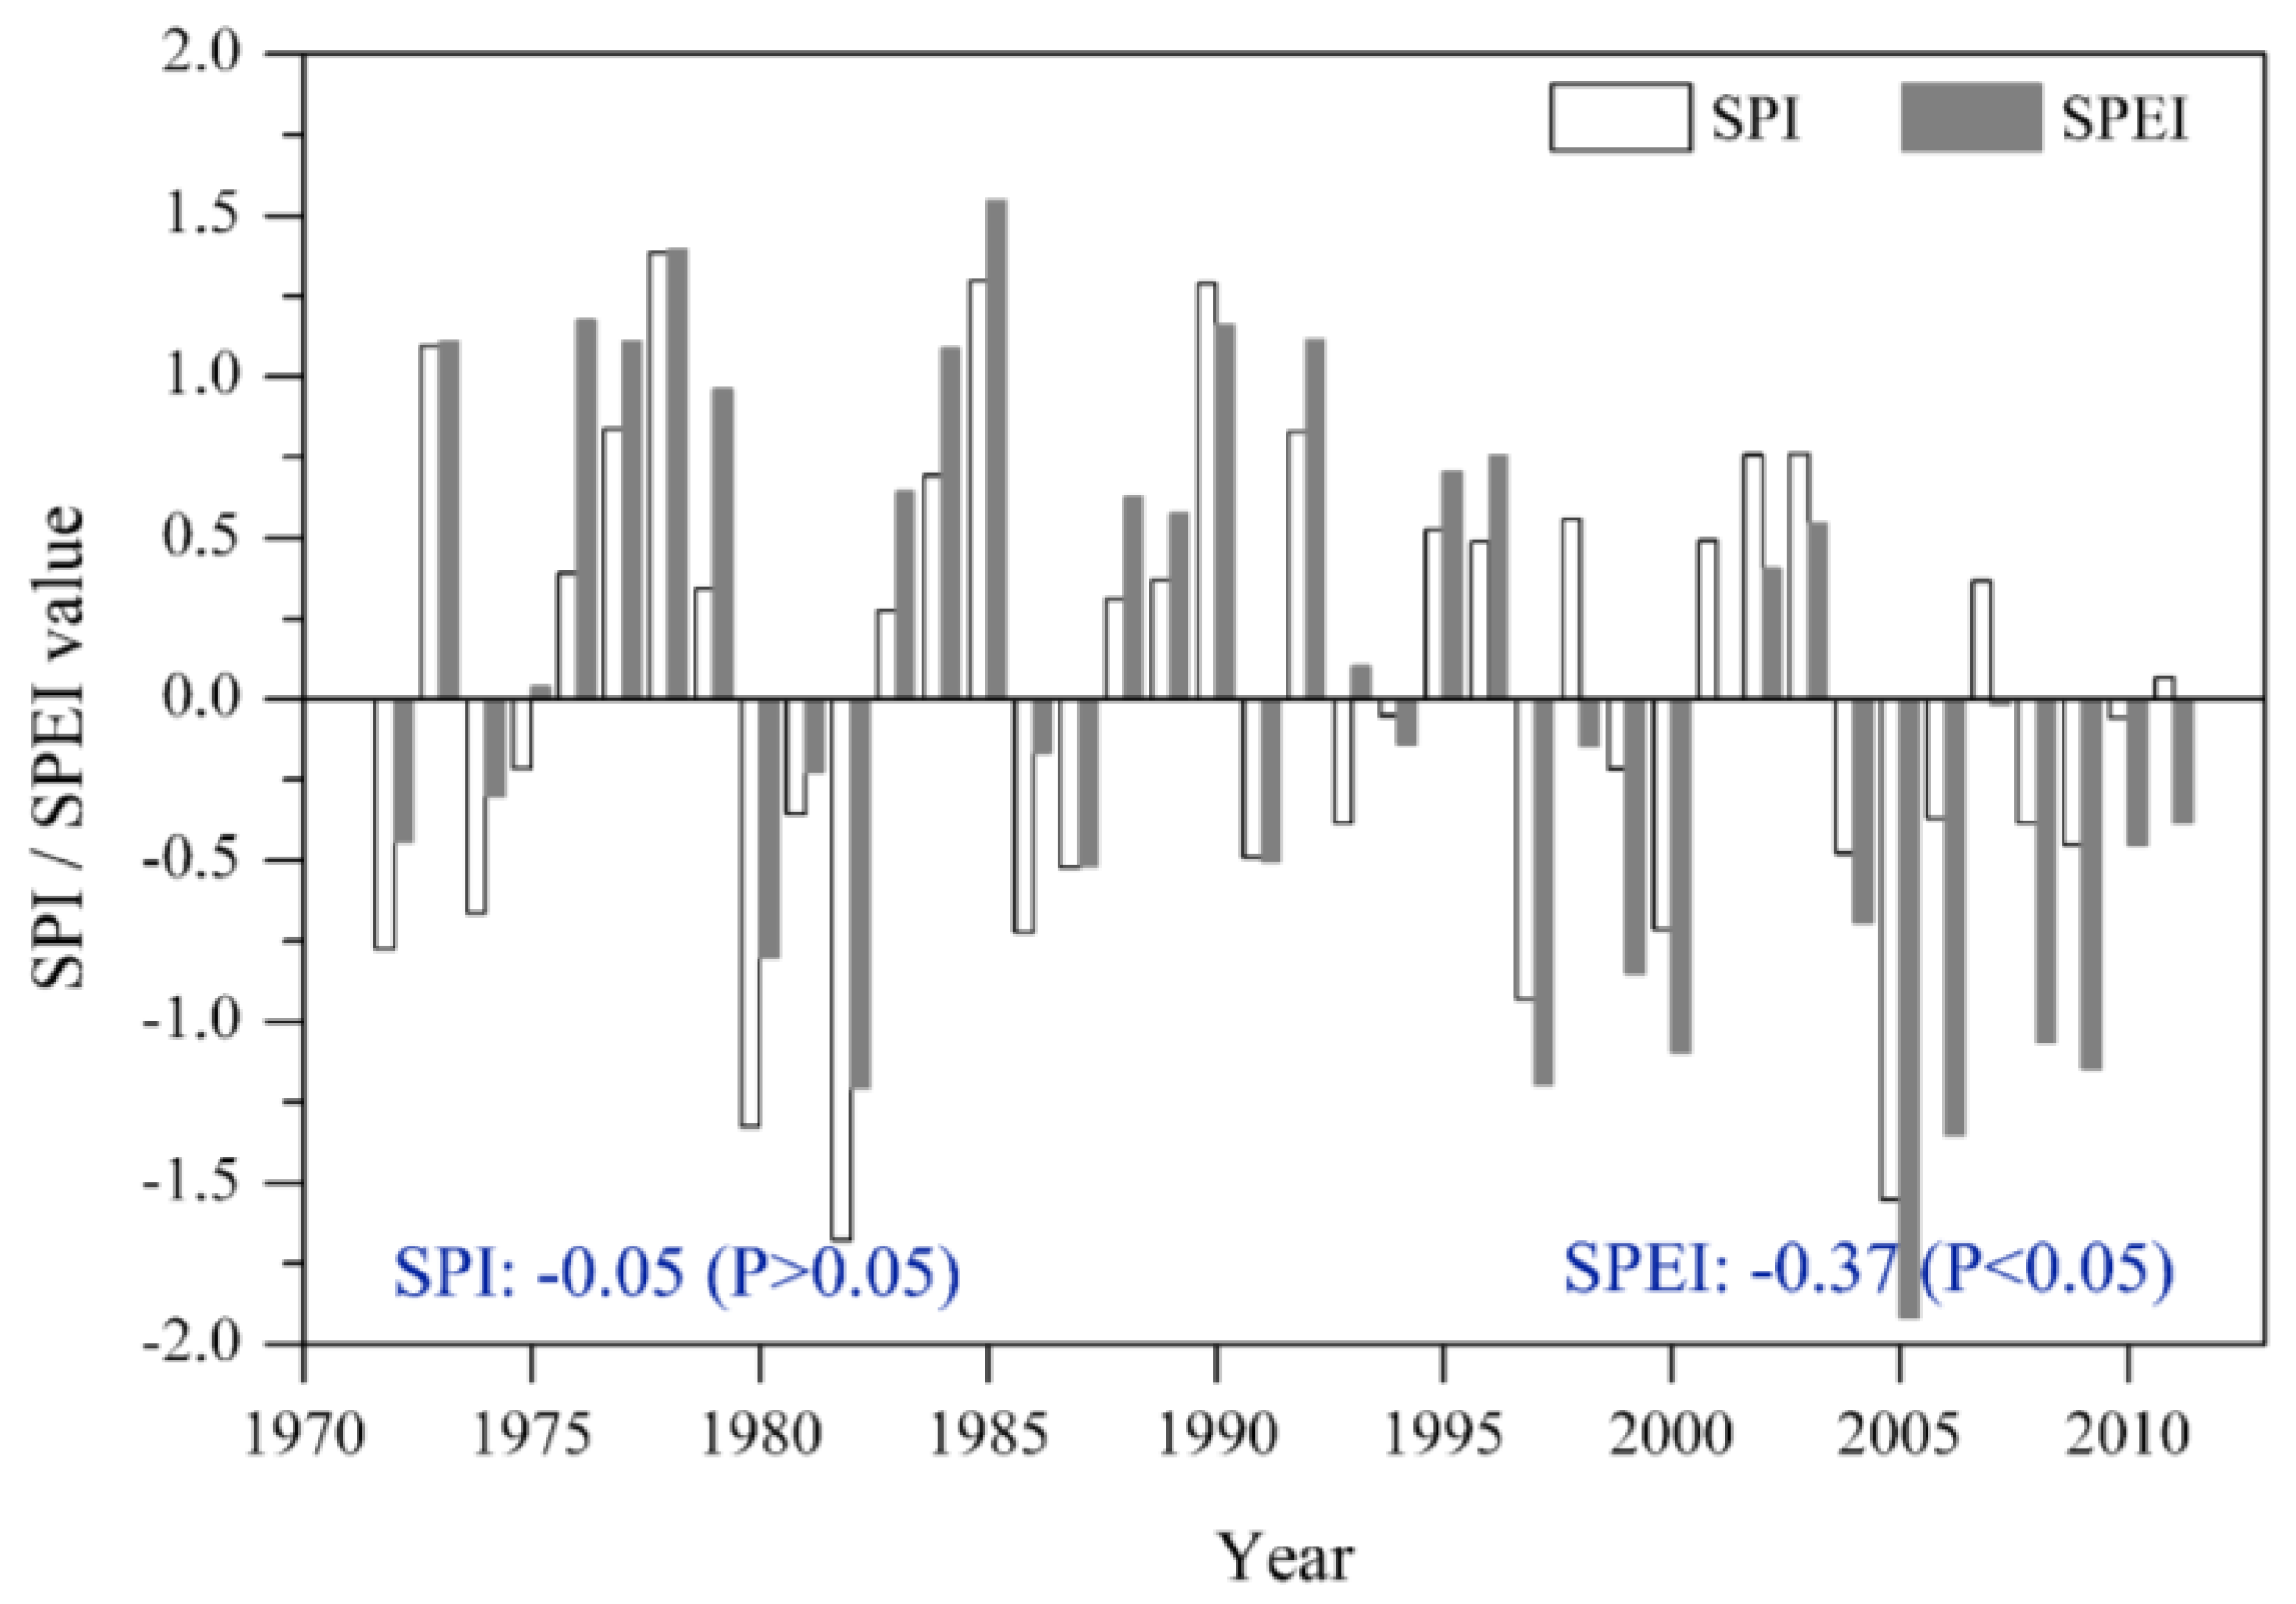
3.1.1. Temporal Variation

The regional annual SPI and SPEI have decreasing trends at the inter-annual time scale in Ningxia during years 1972–2011 (Figure 2). The regional SPI decreased slightly in spring, summer and winter (Figure 3a,b,d). Meanwhile, it increased slightly in autumn (Figure 3c). However, all trends from the SPI series are not significant. The regional SPEI has decreasing trends in four seasons, and are especially significant in spring and summer (Figure 3).
These results show that trends in the SPEI series are generally consistent with those in the SPI series. During years 1972–2011, drying climate tendencies are observed in both the SPI and SPEI series at inter-annual scales as well as inter-seasonal scales, except for autumn. There is a drying trend in the autumn SPEI series, and a wetting tendency in the autumn SPI series. In addition, the spring SPEI exhibits the greatest trend magnitude of all the seasons.

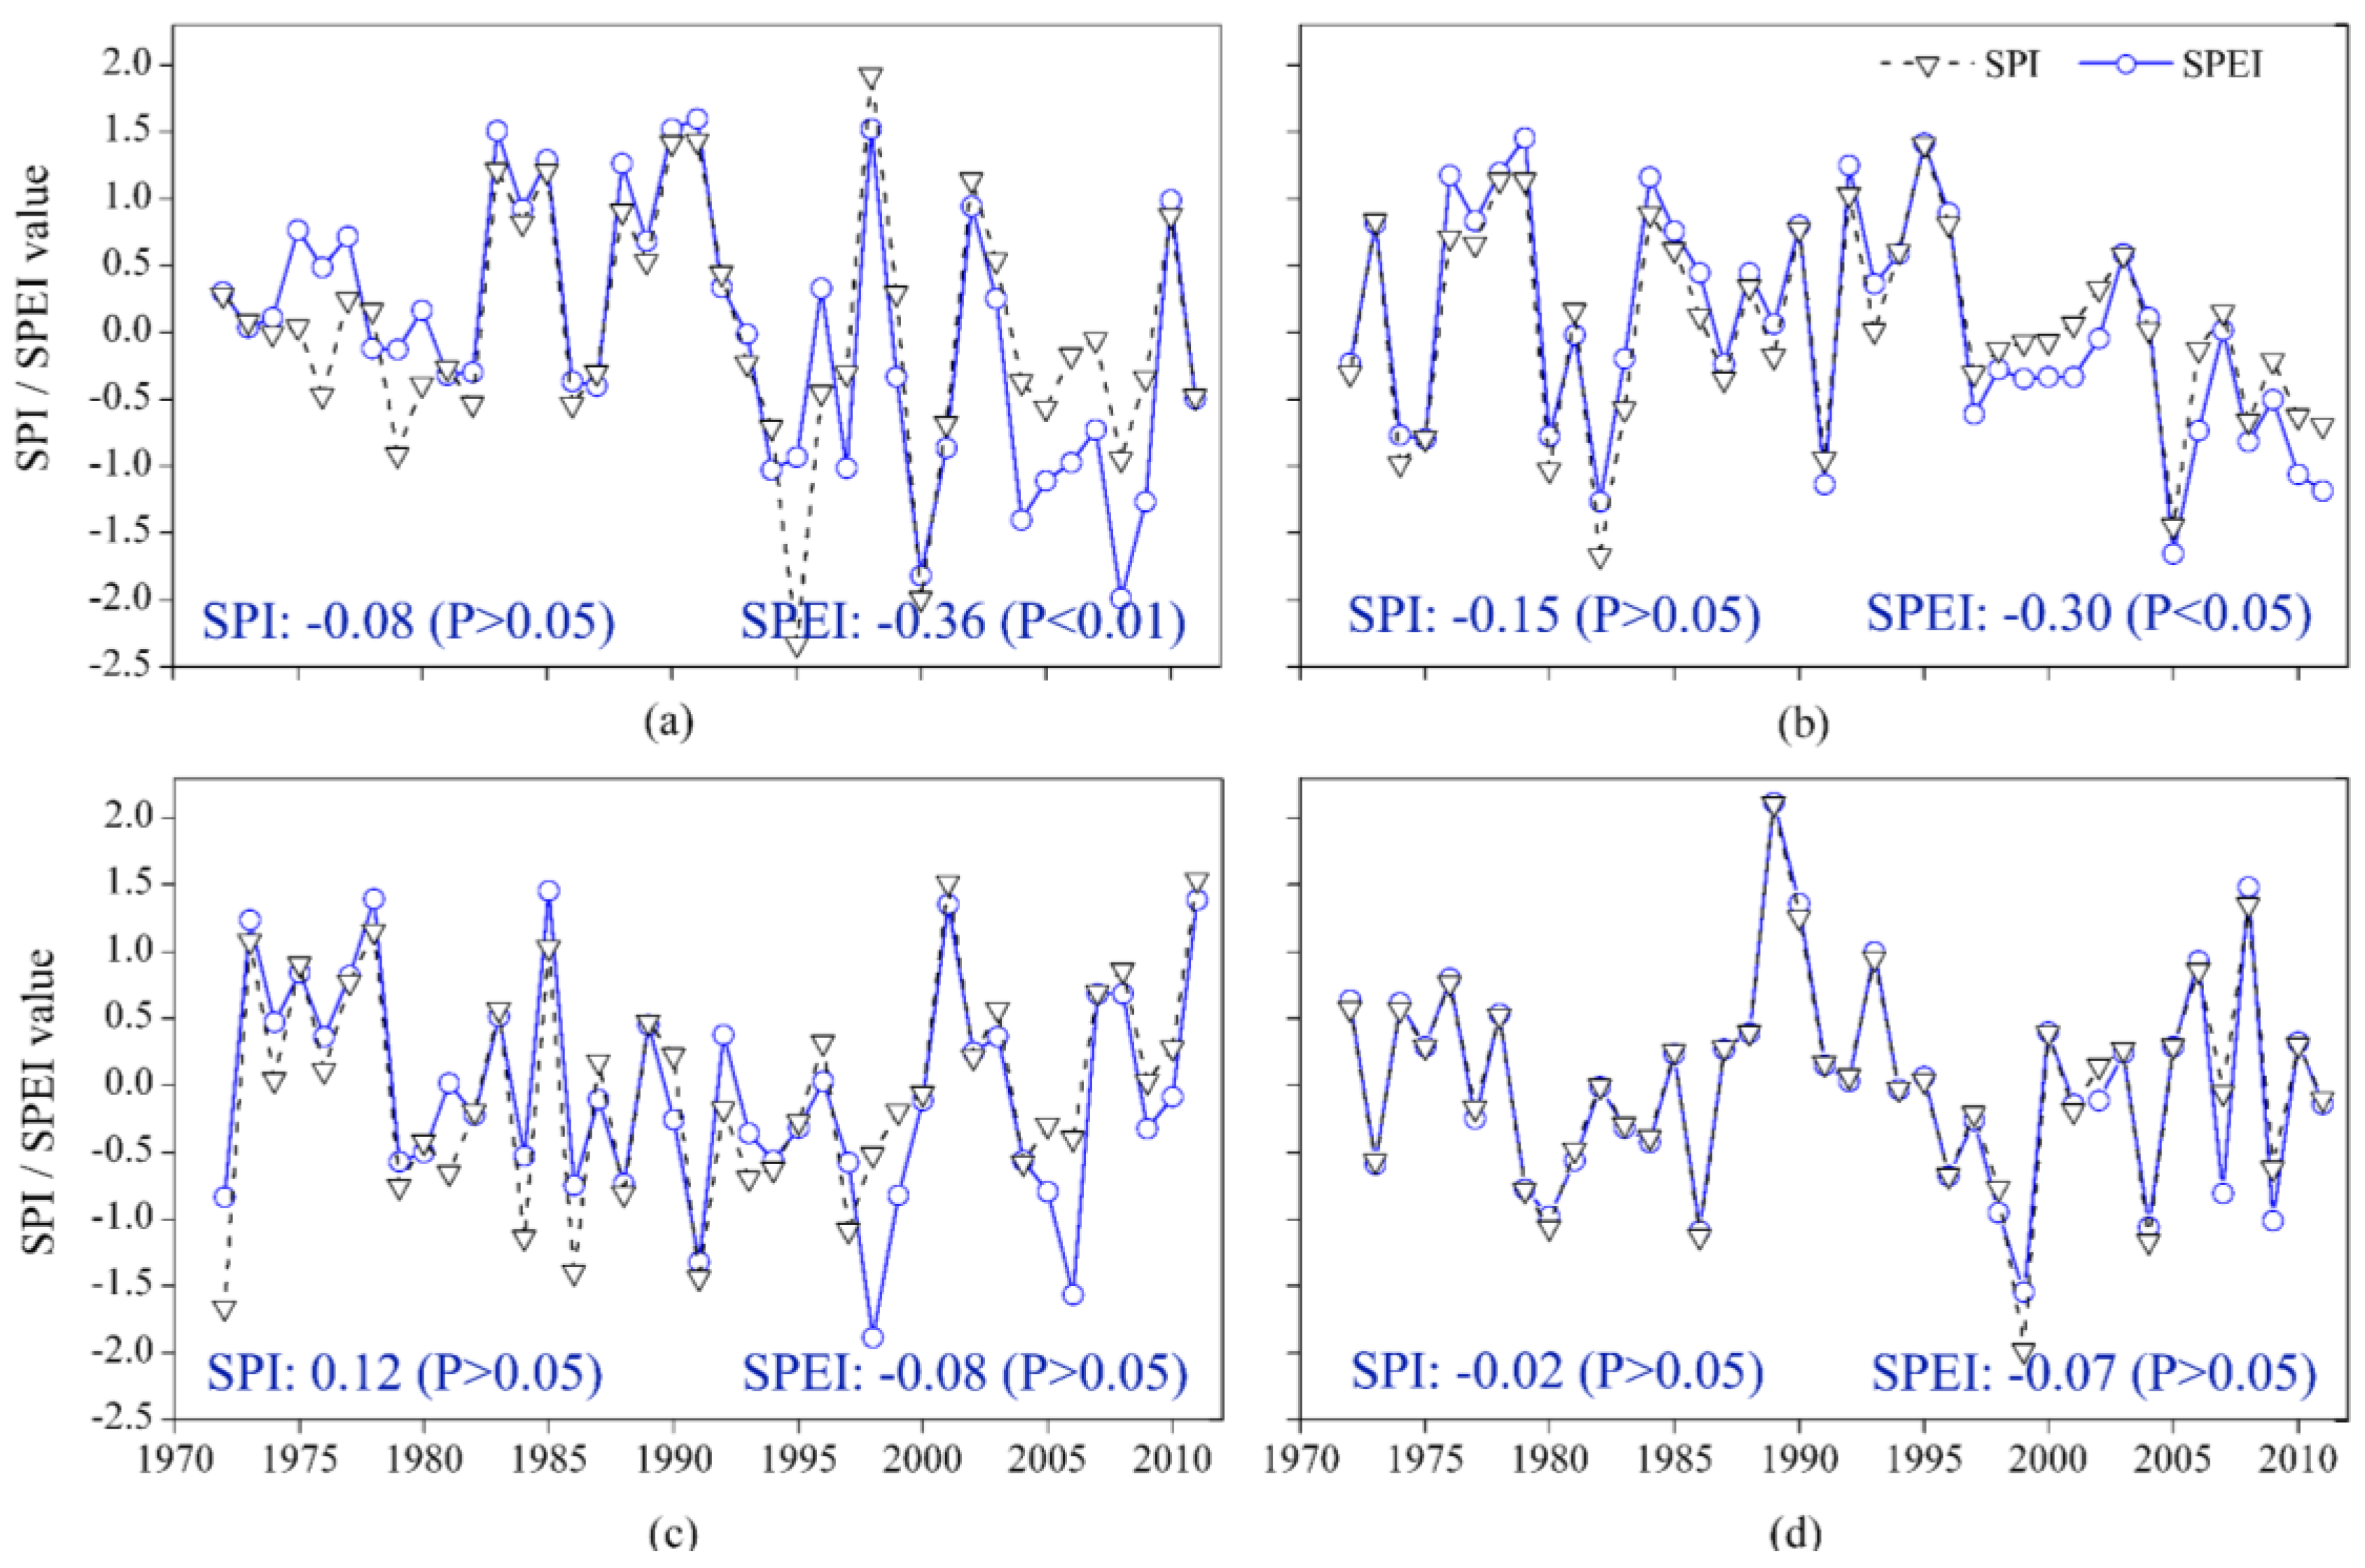
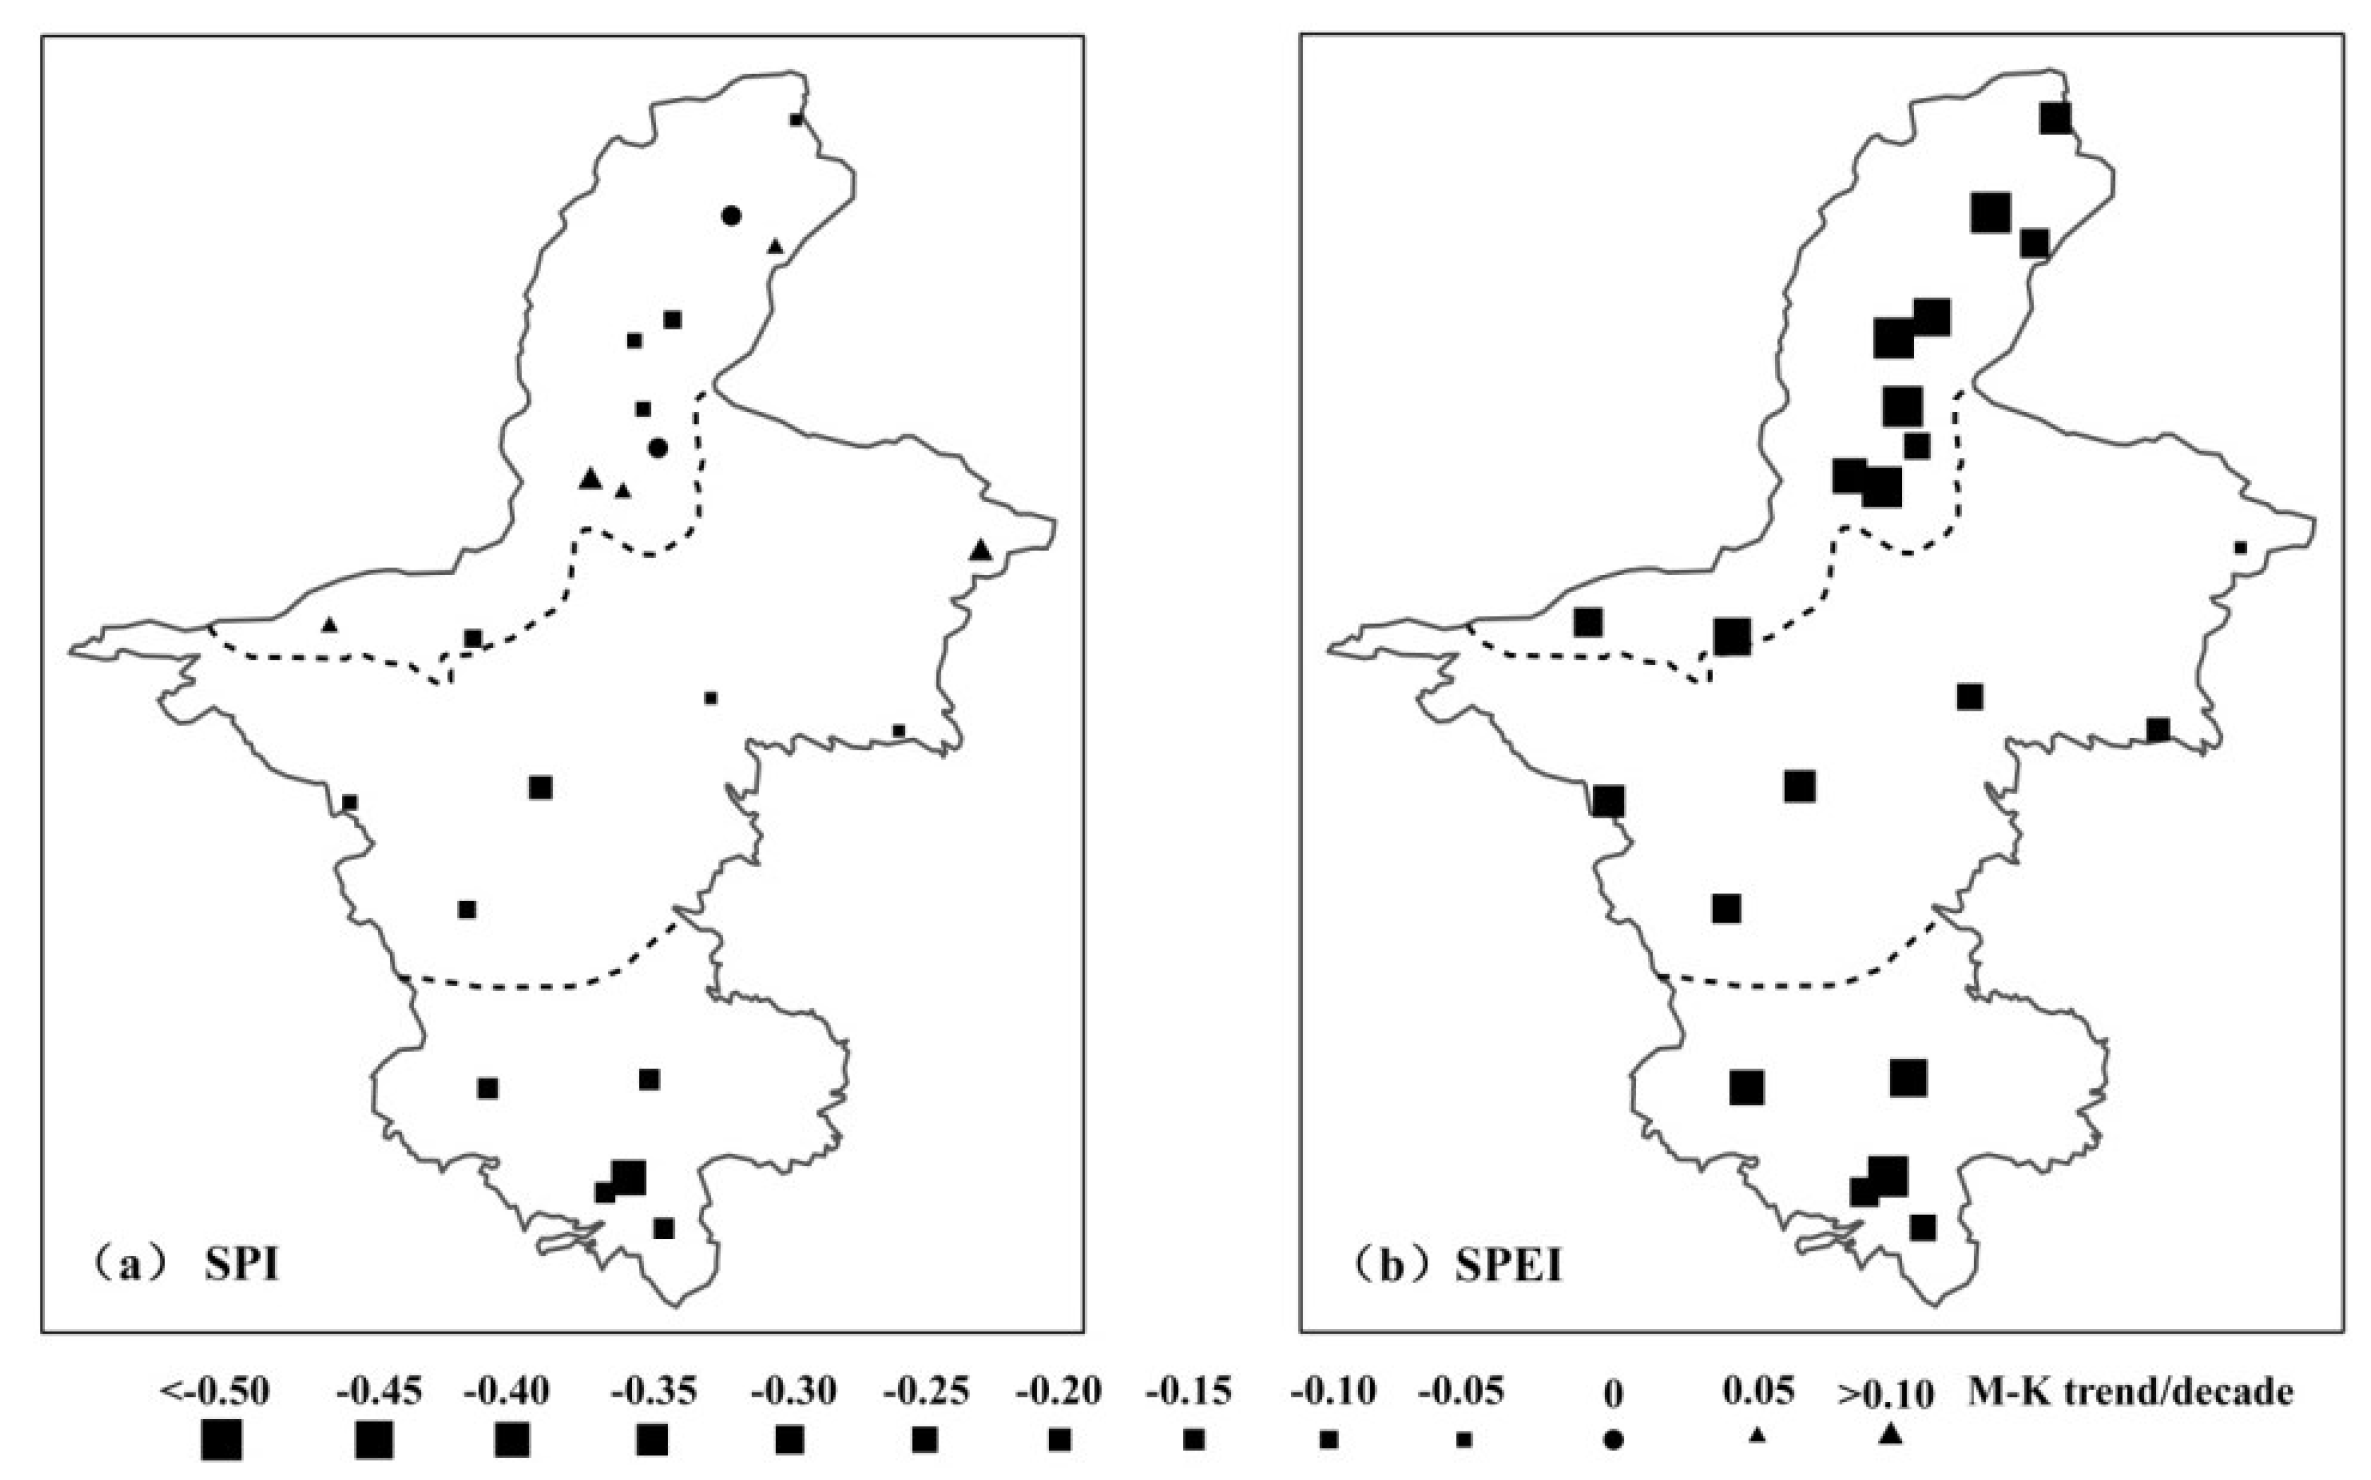
3.1.2. Spatial Variation

Spatially, the predominant evolution of annual SPI in the entire Ningxia region decreases. This occurs despite slightly increased data from five stations and no change at two stations during the years 1972–2011 (Figure 4a). However, trends in the SPI series from all stations are not significant, except for Liupanshan. The average annual SPI values decreased about 0.03 decade−1 (P > 0.05) in the North NX, 0.02 decade−1 (P > 0.05) in the Middle NX, and 0.24 decade−1 (P < 0.05) in the South NX. The annual SPEI series from all stations have a decreased trend (Figure 4b). The average annual SPEI decreased about 0.43 decade−1 (P < 0.01) in the North NX, 0.21 decade−1 (P > 0.05) in the Middle NX, and 0.38 decade−1 (P < 0.01) in the South NX. Results from both SPI and SPEI indicate that the detection of drying tendencies in the entire Ningxia area. The trend magnitude was relatively small in the Middle NX and increased northward and southward. However, trends in the SPEI series from most stations are significant compared to the SPI, and the magnitude of all trends was much greater.
Overall, the above results indicate that trends in the SPEI series are significant compared to the SPI, and the trend magnitude is greater in the SPEI than in the SPI at the inter-seasonal scale as well as inter-annual scale in Ningxia and/or its three sub-regions, during the years 1972−2011.
Figure 4. M–K trends of annual SPI/SPEI series at the 12-month time scale for 22 stations during years 1972–2011 in Ningxia. (a) SPI, (b) SPEI.
Atmosphere 06 01399 g004

3.2. Drought Duration, Intensity, and Frequency

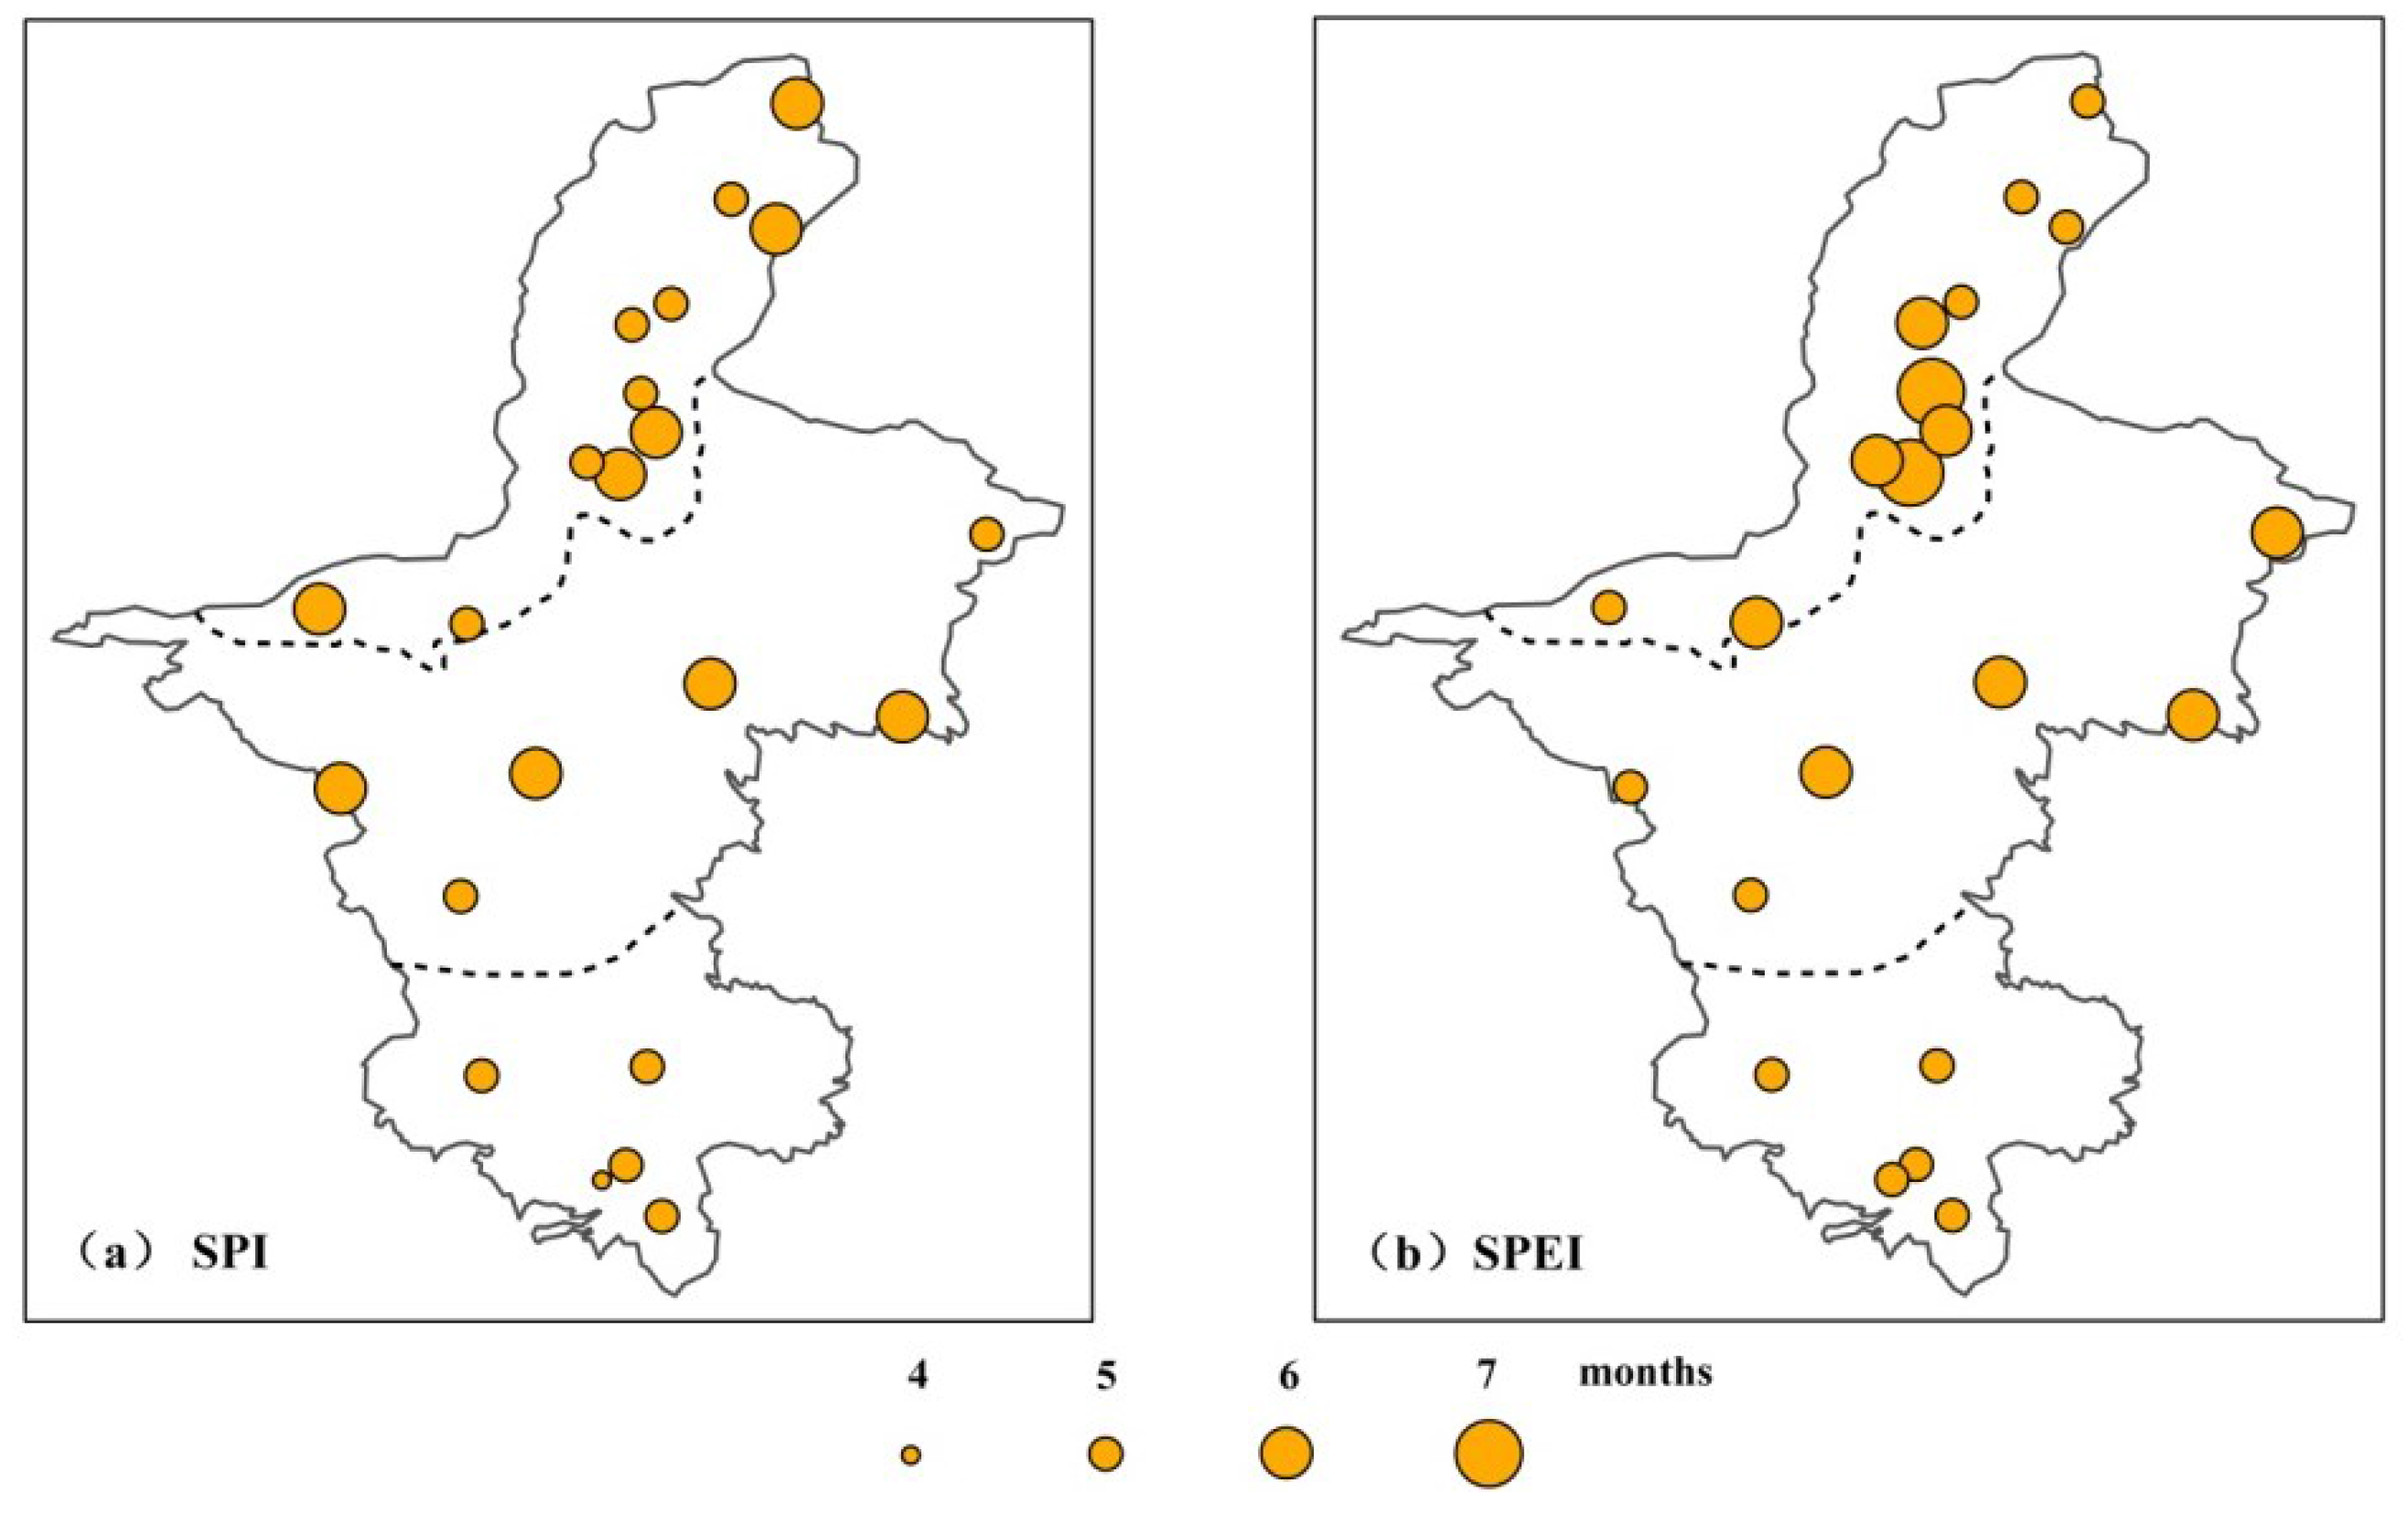
3.2.1. Duration of Drought Events
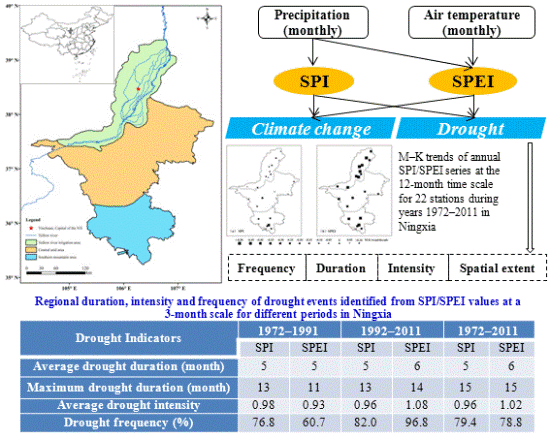
Drought duration identified by the SPI is generally consistent with that by the SPEI in Ningxia (Figure 5 and Figure 6). During years 1972–2011, average drought duration identified by both SPI and SPEI for most (>90.0%) stations was five to six months (Figure 5), and the regional average value calculated from the SPI (SPEI) was 5 (6) months (Table 2). Maximum drought duration identified by both SPI and SPEI for most (>60%) stations was 12–24 months (Figure 6), and the regional average value was 15 months (Table 2).
Figure 5. Average duration of drought events identified from monthly SPI/SPEI values at the 3-month time scale for 22 stations during the years 1972–2011 in Ningxia. (a) SPI, (b) SPEI.
Atmosphere 06 01399 g005
Figure 6. Maximum durations of drought events identified from monthly SPI/SPEI values at the 3-month time scale for 22 stations during the years 1972–2011 in Ningxia. (a) SPI, (b) SPEI.
Atmosphere 06 01399 g006
The regional average drought duration calculated from the SPEI for 1992–2011 increased from five to six months compared to the first period (1972–1991) (Table 2). Meanwhile, the regional average maximum drought duration calculated from the SPEI increased from 11 to 14 months. However, no significant change is found in values from the SPI between the two periods (Table 2).
Spatially, there is no significant difference in the average drought durations between the North NX and Middle NX, but it was relatively smaller in the South NX than that in the other sub-regions (Figure 5). The maximum duration of drought was greatest in the Middle NX, and it decreased northward and southward (Figure 6). During the years 1972–2011, the average maximum drought duration identified by the SPI (SPEI) was 15 (15) months in North NX, 18 (16) months in Middle NX, and 10 (11) months in South NX.
Table 2. Regional duration, intensity and frequency of drought events identified from SPI/SPEI values at a 3-month scale for different periods in Ningxia.
Drought Indicators1972–19911992–20111972–2011
SPISPEISPISPEISPISPEI
Average drought duration (month)555656
Maximum drought duration (month)131113141515
Average drought intensity0.980.930.961.080.961.02
Drought frequency (%)76.860.782.096.879.478.8

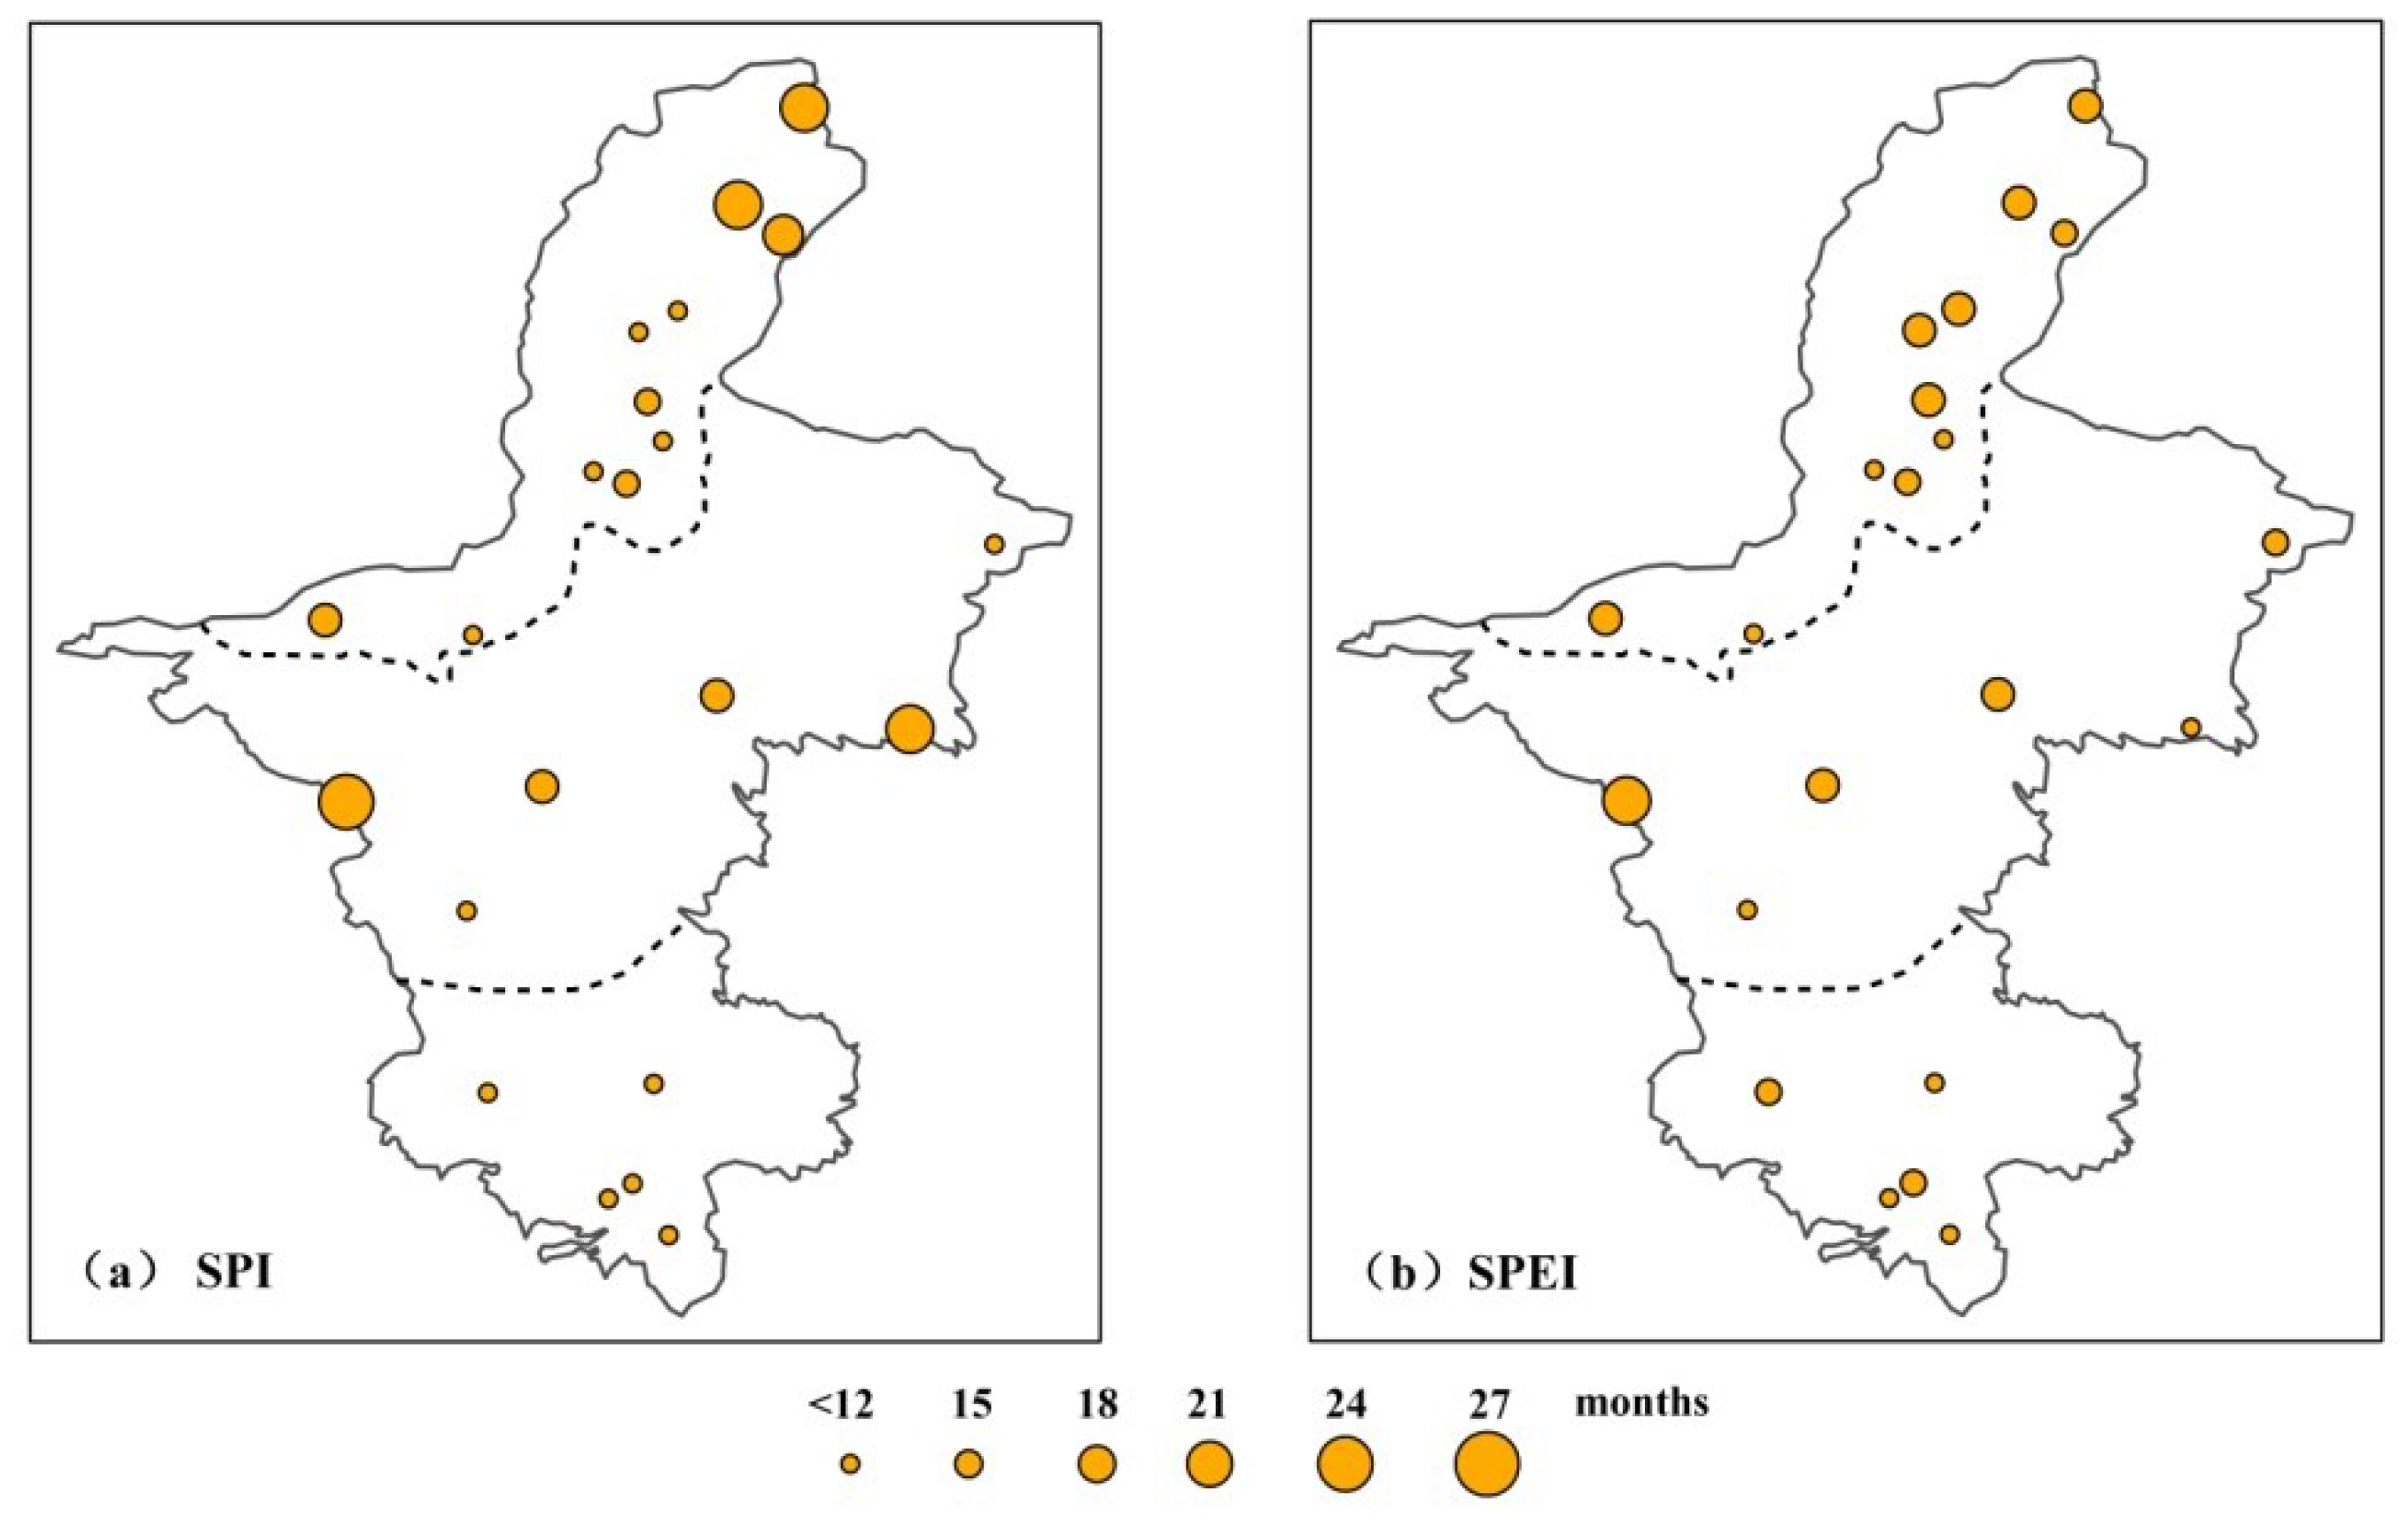
3.2.2. Intensity of Drought Events

Figure 7 shows average intensity of drought events for 22 stations in Ningxia during years 1972–2011. Average drought intensity calculated from the SPEI for most (77.3%) stations were greater than those from the SPI in Ningxia. During the years 1972–2011, regional average drought intensity identified by the SPI/SPEI was 0.96/1.02.
Figure 7. Average drought intensity calculated from monthly SPI/SPEI values at the 3-month time scale for 22 stations during the years 1972–2011 in Ningxia. (a) SPI, (b) SPEI.
Atmosphere 06 01399 g007
Regional average drought intensity calculated from the SPEI increased from 0.93 to 1.08 during years 1992–2011 compared to the period of 1972–1991. Meanwhile, the SPI value has no obvious change (Table 2). Spatially, average drought intensity calculated from the SPI (SPEI) was 0.94 (1.06) in the North NX, 0.97 (0.97) in the Middle Ningxia, and 1.01 (1.00) in the South Ningxia (Figure 7). Results from the SPI indicate that drought intensity generally increased from North NX to South NX, while drought intensity from the SPEI increased northward and southward from Middle NX.

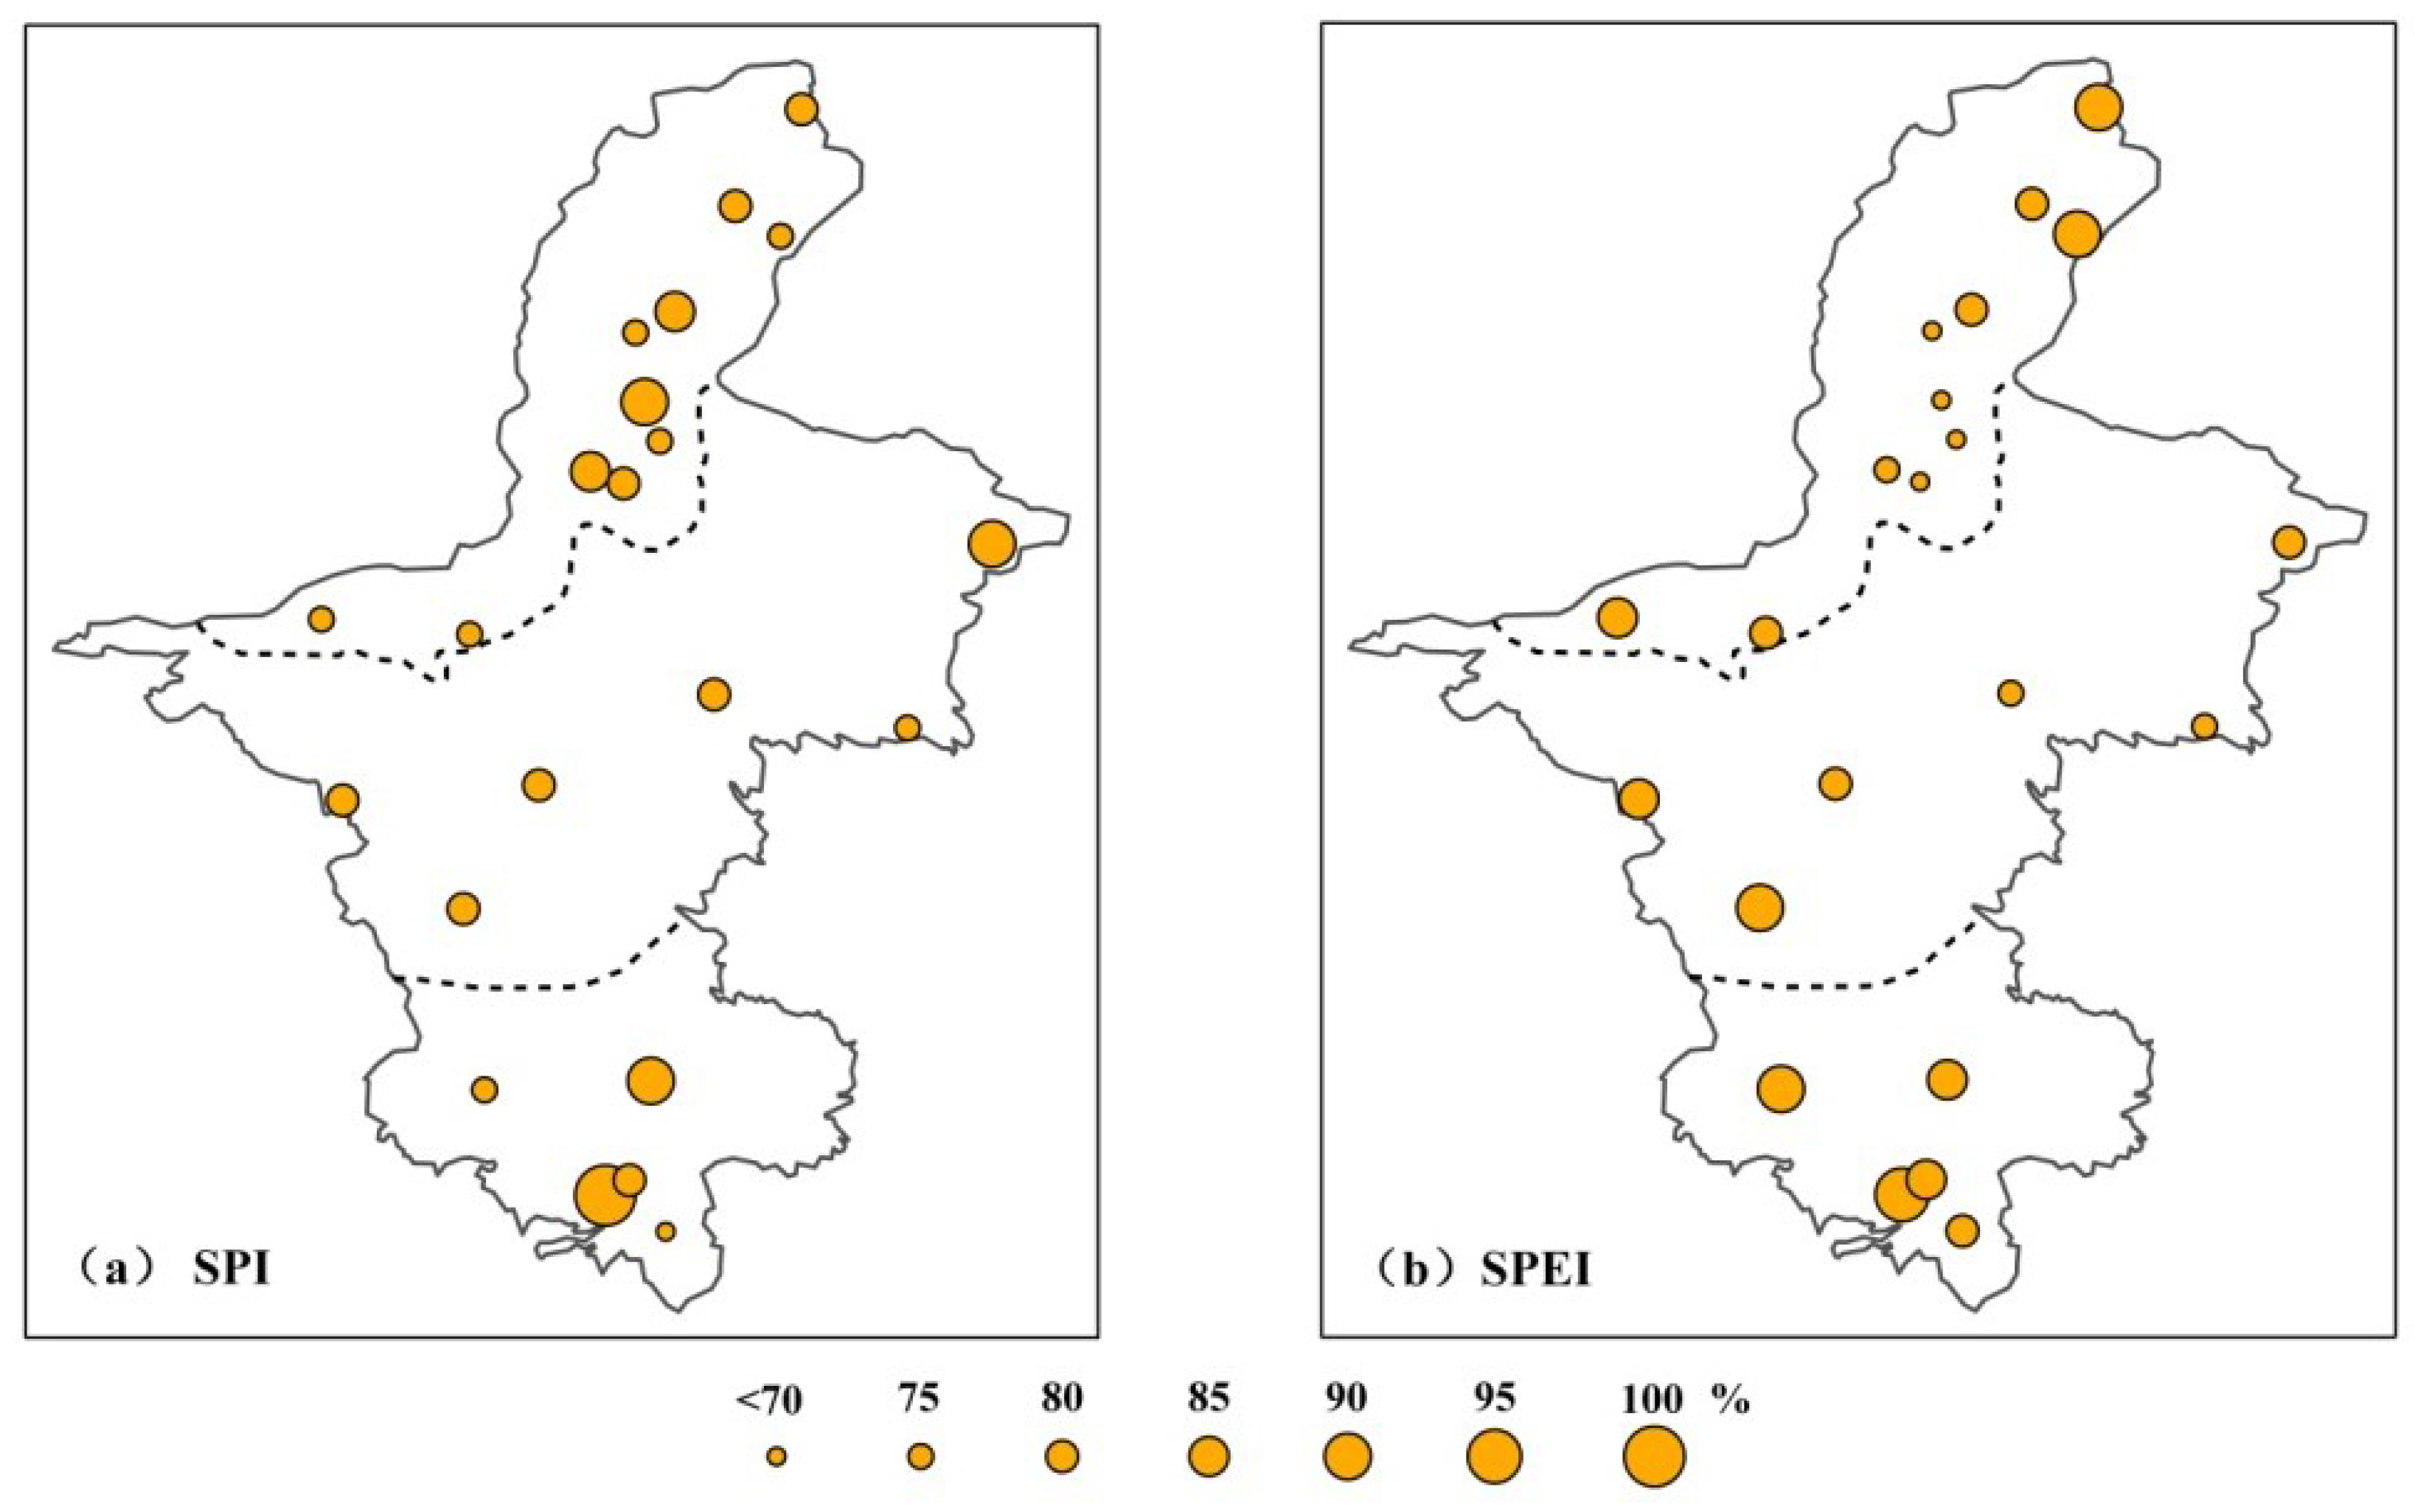
3.2.3. Frequency of Drought Events

Figure 8 shows that drought occurred frequently across the entire region of Ningxia. The drought frequency calculated from the SPI and SPEI for most (>80.0%) stations were more than 70.0%. The regional average drought frequency for the entire Ningxia area during the years 1971–2011 calculated from the SPI (SPEI) was 79.4% (78.8%).
Drought frequency generally increased in Ningxia over the period of 1971–2011 (Table 2). The regional drought frequency calculated from the SPI (SPEI) during years 1992–2011 compared to the period of 1971–1991 increased from 76.8% (60.7%) to 82.0% (96.8%) in Ningxia. Spatially, the average drought frequency calculated from the SPI (SPEI) was 78.2% (74.5%) in North NX, 79.2% (80.4%) in Middle Ningxia, and 82.5% (86.0%) in South Ningxia, during the years 1971–2011 (Figure 8). Results indicate that drought frequency was the lowest in the North NX and generally increased from the North NX to the South NX.
Figure 8. Drought frequency calculated from monthly SPI/SPEI values at the 3-month time scale for 22 stations during the years 1972–2011 in Ningxia. (a) SPI, (b) SPEI.
Atmosphere 06 01399 g008

3.3. Variation of Drought Station Proportion

The drought station proportion is used to reflect the spatial extent of drought. Monthly drought station proportion was calculated from monthly SPI/SPEI values using Equation (12). The annual drought proportion was actually the average value of monthly drought station proportions for the entire year. Seasonal values were calculated by averaging all monthly data within the spring (March, April, May), summer (June, July, August), autumn (September, October, November), and winter (December, January, and February).
Table 3 shows M–K trends in the drought station proportion series in Ningxia at monthly, inter-seasonal and inter-annual scales. On a monthly scale, during years 1972–2011, drought station proportions identified by the SPI slightly increased in April, June, August and September, and no trends were found in eight other months. Meanwhile, those calculated by the SPEI increased in all months, except February, and are especially significant in April, May, and August. At the inter-seasonal scale, drought station proportion calculated from the SPEI has increasing trends in all seasons, and is especially significant in spring and summer, with an increase rate of 14.4% decade−1 (P ˂ 0.01) and 8.2% decade−1 (P < 0.01). Drought station proportion calculated from the SPI also increased in spring and summer, and no trends were detected in autumn and winter. At the inter-annual scale, the annual drought station proportion identified by the SPEI increased significantly about 7.6% decade−1 (P < 0.01) during years 1972−2011 in Ningxia. Meanwhile, the increasing trend revealed by the SPI is not significant.
Results indicated the spatial extent of drought generally has increasing trends during years 1972−2011 in Ningxia, especially in the spring. However, the trend magnitude from the SPEI was generally greater than from the SPI at inter-monthly, inter-seasonal, and inter-annual scales.
Table 3. M–K trends in drought station proportion series calculated from the SPI/SPEI values at the 3-month time scale during years 1972–2011 in Ningxia.
TimeSPISPEITimeSPISPEITimeSPISPEI
January0.06.6July0.07.0Spring4.114.4 **
February0.00.0August6.511.4 *Summer3.28.2 *
March0.06.5September4.06.5Autumn0.04.4
April6.517.6 **October0.03.6Winter0.05.2
May0.012.2 *November0.03.5Annual1.37.6 **
June0.77.6December0.04.8---
Notes: * and ** denote trends statistically significant at P < 0.05 and P < 0.01, respectively.

4. Discussion

4.1. Applicability of the SPI and SPEI in Ningxia

Results show that the drying climate tendency revealed by the SPI is generally consistent with those by the SPEI during the years 1972–2011 in Ningxia. The magnitude of drying trends increased northward and southward from the Middle NX. However, trends revealed by the SPEI are significant compared to the SPI, and the trend magnitude was much greater. The above differences between the SPEI and the SPI are mainly attributed to the variation of air temperature in Ningxia. Abramopoulos et al. [85] found that the efficiency of drying resulting from temperature anomalies is as high as that due to rainfall shortage. Vicente-Serrano et al. [86] confirmed that drought severity increased as a consequence of greater atmospheric evaporative demand resulting from temperature rise. Ningxia is largely arid and semi-arid region, with initially low precipitation, and the increased evaporation from the increased air temperature plays a very important role in climate change. Tan et al. [36] indicated that the annual precipitation decreased slightly by 2.1 mm·decade−1 (P > 0.05) in Ningxia during years 1971–2011, while annual mean air temperature increased significantly by 0.42 °C·decade−1 (P < 0.01). Therefore, the drying climate tendency is attributed to the synthetic action of the rapid rise in air temperature and the decrease in precipitation in Ningxia.
Results revealed by the SPI show that there was a slight decrease in drought intensity, no obvious change in drought duration, and a slight increase in spatial extent of drought in Ningxia during the years 1972–2011. Meanwhile, results revealed by the SPEI show longer drought duration (average, maximum), higher drought intensity and larger spatial extent of drought with the drying climate tendency. Li et al. [42] indicated increased trends in drought days and drought intensity calculated from the CI during years 1981–2010. Ma et al. [37] pointed out that the cropland affected by drought increased annually during years 1951–2000. Tan et al. [36] reported that the cropland impacted by drought increased significantly by 3.16 × 10⁴ hm2·decade−1 (P < 0.01) during the years 1978–2010. Therefore, the results from the SPEI in this study are generally consistent with those from the CI reported in Li et al. [42] as well as the variation in observed situations of drought disaster in Ningxia reported in Ma et al. [37] and Tan et al. [36]. Moreover, Wang et al. [87] demonstrated that the CI is better than other drought indexes, such as the Pa, SPI, and PDSI for application examining the evolution of drought in Ningxia, because it considers both precipitation and evapotranspiration.
The above analysis indicates that the SPEI that considers both precipitation and evapotranspiration is more suitable than the SPI for applications examining climate change and drought variation in Ningxia. In addition, further studies are needed to discuss which index performs better, SPEI or CI, in exploring drought variation in Ningxia. We believe this work will be significant.

4.2. Potential Causal Factors for Drought Variation in Ningxia

Ningxia is in the eastern part of Northwest China and has largely arid and semi-arid region with low precipitation and strong evaporation resulting in frequent droughts. Precipitation is a major factor in drought occurrence. Previous studies indicated that atmospheric circulations including Asian summer monsoon and NAO have profound effects on precipitation in China [31,32,33,34]. In order to explore the relationships between atmospheric circulation and drought variation in Ningxia, the Pearson’s correlation analysis was applied. The correlation between the EASMI/SASMI and the SPI/SPEI as well as drought station proportion for summer in Ningxia, during the years 1972–2011 were tested. Meanwhile, the correlations between the NAOI and the above drought indicators for four seasons were also examined. When similar temporal trends in the data series are observed, spurious correlations may exist in these series. Therefore, linear trend removal was performed first to exclude spurious correlation.
Table 4 shows that almost no significant correlation was detected between the SPI/SPEI, drought station proportion, and the EASMI, as well as between them and the SASMI. Moist air from the Pacific Ocean is usually difficult to be transported to Ningxia because it is located in the Eurasian hinterland far from the sea. Moreover, the Tibetan Plateau (TP) usually blocks moist air from the Indian Ocean. Therefore, the EASMI and SASMI usually have less effect on drought in Ningxia.
Table 4. Pearson correlation coefficients between the EASMI/SASMI and drought indicators for summer in Ningxia during the years 1972–2011.
Atmospheric Circulation IndexSummer SPI/SPEIDrought Station Proportion
SPISPEISPISPEI
EASMI0.01−0.090.110.22
SASMI0.100.05−0.060.03
Note: ‘−’ sign indicates negative correlation.
Table 5 shows that statistically significant positive (negative) correlation exists between the NAOI and the SPI/SPEI (drought station proportion) for summer in Ningxia, during the years 1972–2011 (Table 5). Whereas the correlations between the NAOI and all drought indicators for other three seasons in Ningxia are not significant. This shows that drought variation for summer in Ningxia is likely to be related to the NAO over the last 40 years. Previous studies discovered that the summer precipitation over the eastern Tibetan Plateau (TP) is closely associated with the NAO [33,34]. The NAO primarily modifies the upper-level atmosphere [34]. Liu et al. [34] indicated that a cyclonic anomaly is present over and around the northeastern TP, during the positive phase of the NAO. Meanwhile, an anticyclonic anomaly exists over East Asia. Ding and Wang [88] discovered that the establishment of an anomalous high over East Asia has southeasterly flow at its southern flank that transports additional water vapour into the middle range of the Yellow River Valley, resulting in excessive rainfall to the west of the anomalous high. Furthermore, Liu et al. [34] indicated that the additional water vapor flux from oceans surrounding Asia can reach the upper range of the Yellow River Valley on the northeastern TP via the southeastern flank of the anomalous anticyclone. The northward-moving warm moist air encounters cold air masses subsequently strengthens cumulus convective activities and ultimately results in excessive precipitation over the northeastern TP [34]. In contrast, the opposite scenario occurs during the negative phase of the NAO [34]. Ningxia is just located in the upper range of the Yellow River Valley. The NAO may influence summer precipitation in Ningxia by modifying the atmosphere circulation over and around Ningxia. The significant correlation in Table 5 has provided us an important signal. However, further studies are needed to verify the relation between the NAO and summer precipitation in Ningxia, and to explore if the intensification of drought in Ningxia is closely related to the NAO variation. This would be an interesting and valuable field. Furthermore, the study of Liu et al. [34] has provided a good approach to explore the physical mechanism behind the correlation. We will focus on this issue in the following work.
Table 5. Pearson correlation coefficients between NAOI and drought indicators for four seasons in Ningxia during the years 1972–2011.
Atmospheric Circulation IndexSeasonSPI/SPEIDrought Station Proportion
SPISPEISPISPEI
NAOISpring0.03−0.05−0.06−0.01
Summer0.42 **0.41 **−0.42 **−0.41 **
Autumn0.180.26−0.13−0.16
Winter0.230.24−0.06−0.02
Notes: ‘−’ sign indicates negative correlation; ** denote correlation statistically significant at P < 0.01.

5. Conclusions

The non-parameter Mann–Kendall test and correlation analysis based on monthly SPI and SPEI were employed to analyze the spatial-temporal evolution of climate change, drought, and potential causal factors in Ningxia for the period 1972–2011. Variation and patterns in drought characteristics in Ningxia using intensity, duration, frequency, and station proportion as the main indicator. Correlation between drought indicators and atmospheric circulation were examined to explore the potential causal factors of drought variation in Ningxia.
Overall, the SPEI is more suitable than the SPI for applications examining characteristics of climate change and drought variation in Ningxia because it considers both precipitation and evapotranspiration data.
Ningxia experienced a significant trend towards drier conditions, with a decrease rate in the annual SPEI of 0.37 decade−1 during the years 1972–2011. The spring exhibits the most pronounced drying tendency of all the seasons, with an SPEI decrease rate of 0.36 decade−1 during the study period. The magnitude of drying trends generally increased northward and southward from Middle NX at the inter-annual scale.
The average drought duration for most (>90%) stations was five to six months during the years 1972–2011, in Ningxia; the maximum drought duration for most (>60%) stations was 12–24 months; drought frequencies for most (>80%) stations were more than 70.0%; and the regional average drought intensity identified by the SPI (SPEI) was 0.96 (1.02). Drought was exacerbated by the drying tendency in Ningxia. The regional average duration, maximum duration, intensity, and frequency of drought identified by the SPEI increased about one month, three months, 0.15 and 36.1%, respectively, during the years 1992–2011 compared to the period of 1972–1991. The spatial extent of drought also generally has an increasing trend in Ningxia during the years 1972–2011, especially significantly in spring with a drought station proportion calculated from the SPEI increase rate of 14.4% decade−1. Spatially, the average drought duration was relatively smaller in South NX than in North NX and Middle NX; the average maximum drought duration decreased northward and southward from Middle NX; the drought frequency generally increased from North NX to South NX; the drought intensity identified by the SPEI increased northward and southward from the Middle NX.
Almost no significant correlation is detected between drought and the EASMI and SASMI. Meanwhile drought variation for summer in Ningxia is likely to be related to the NAO over the last 40 years, but it needs further studies and to be verified.

Acknowledgements

This work was supported by the National Basic Research Program of China (No. 2012CB955404). The authors would like to thank Xingguo Yang for providing the meteorological data, and Aifang Cheng, Guobao Xu, Huancai Liu and Yinping Long from the Cold and Arid Regions Environmental and Engineering Research Institute, Chinese Academy of Sciences, for their assistance in data processing, and also thank the two anonymous reviewers for their constructive comments and suggestions. The authors also would like to thank Enago (www.enago.cn) for the English language review. A special thank is given to Jan Habel for her kind help in revising the language and grammar.

Author Contributions

All authors were involved in designing and discussing the study. Chunping Tan undertook the data analysis and drafted the manuscript. Jianping Yang revised the manuscript and edited the language. Man Li collected required data. All authors have read and approved the final manuscript.

Conflict of Interests

The authors declare that there is no conflict of interest.

References

  1. Chen, T.; van der Werf, G.R.; de Jeu, R.A.M.; Wang, G.; Dolman, A.J. A global analysis of the impact of drought on net primary productivity. Hydrol. Earth Syst. Sci. 2013, 17, 3885–3894. [Google Scholar] [CrossRef]
  2. Zhang, Z.X.; Chen, X.; Xu, C.Y.; Hong, Y.; Hardy, J.; Sun, Z.H. Examining the influence of river-lake interaction on the drought and water resources in the Poyang Lake basin. J. Hydrol. 2015, 522, 510–521. [Google Scholar] [CrossRef]
  3. Wang, Q.F.; Wu, J.J.; Lei, T.J.; He, B.; Wu, Z.T.; Liu, M.; Mo, X.Y.; Geng, G.P.; Li, X.H.; Zhou, H.K.; et al. Temporal-spatial characteristics of severe drought events and their impact on agriculture on a global scale. Quat. Int. 2014, 349, 10–21. [Google Scholar] [CrossRef]
  4. Wang, J.J.; Meng, Y.B. An analysis of the drought in Yunnan, China, from a perspective of society drought severity. Nat. Hazards 2013, 67, 431–458. [Google Scholar] [CrossRef]
  5. McKee, T.B.; Doesken, N.J.; Kleist, J. The relationship of drought frequency and duration to time scales. In Proceedings of the Eighth Conference on Applied Climatology, Boston, MA, USA, 17–22 January 1993; pp. 179–184.
  6. Sonmez, F.K.; Komuscu, A.U.; Erkan, A.; Turgu, E. An analysis of spatial and temporal dimension of drought vulnerability in Turkey using the Standardized Precipitation Index. Nat. Hazards 2005, 35, 243–264. [Google Scholar] [CrossRef]
  7. Vicente-Serrano, S.M.; Begueria, S.; Lopez-Moreno, J.I. Comment on “characteristics and trends in various forms of the Palmer Drought Severity Index (PDSI) during 1900–2008” by Aiguo Dai. J. Geophys. Res. 2011. [Google Scholar] [CrossRef]
  8. Palmer, W.C. Meteorological Drought; White, R.M., Ed.; U.S. Weather Bureau: Washington, DC, USA, 1965. [Google Scholar]
  9. Vicente-Serrano, S.M.; Begueria, S.; Lopez-Moreno, J.I. A multiscalar drought index sensitive to global warming: The Standardized Precipitation Evapotranspiration Index. J. Clim. 2010, 23, 1696–1718. [Google Scholar] [CrossRef]
  10. Kogan, F.N. Droughts of the late 1980s in the United States as derived from NOAA polar-orbiting satellite data. Am. Meteorol. Soc. 1995, 76, 655–668. [Google Scholar] [CrossRef]
  11. Byun, H.R.; Wilhite, D.A. Daily quantification of drought severity and duration. J. Clim. 1996, 5, 1181–1201. [Google Scholar]
  12. Tsakiris, G.; Pangalou, D.; Vangelis, H. Regional drought assessment based on the Reconnaissance Drought Index (RDI). Water Resour. Manag. 2007, 21, 821–833. [Google Scholar] [CrossRef]
  13. Nam, W.H.; Choi, J.Y.; Yoo, S.H.; Jang, M.W. A decision support system for agricultural drought management using risk assessment. Paddy Water Environ. 2012, 10, 197–207. [Google Scholar] [CrossRef]
  14. Wu, J.J.; Zhou, L.; Liu, M.; Zhang, J.; Leng, S.; Diao, C.Y. Establishing and assessing the Integrated Surface Drought Index (ISDI) for agricultural drought monitoring in mid-eastern China. Int. J. Appl. Earth Obs. 2013, 23, 397–410. [Google Scholar] [CrossRef]
  15. Hao, Z.C.; AghaKouchak, A. Multivariate Standardized Drought Index: A parametric multi-index model. Adv. Water Resour. 2013, 57, 12–18. [Google Scholar] [CrossRef]
  16. Yu, M.X.; Li, Q.F.; Hayes, M.J.; Svoboda, M.D.; Heim, R.R. Are droughts becoming more frequent or severe in China based on the Standardized Precipitation Evapotranspiration Index: 1951–2010? Int. J. Climatol. 2014, 34, 545–558. [Google Scholar] [CrossRef]
  17. Wang, Q.F.; Shi, P.J.; Lei, T.J.; Geng, G.P.; Liu, J.H.; Mo, X.Y.; Li, X.H.; Zhou, H.K.; Wu, J.J. The alleviating trend of drought in the Huang-Huai-Hai Plain of China based on the daily SPEI. Int. J. Climatol. 2015. [Google Scholar] [CrossRef]
  18. Potop, V. Evolution of drought severity and its impact on corn in the Republic of Moldova. Theor. Appl. Climatol. 2011, 105, 469–483. [Google Scholar] [CrossRef]
  19. Potop, V.; Mozny, M.; Soukup, J. Drought evolution at various time scales in the lowland regions and their impact on vegetable crops in the Czech Republic. Agric. Forest Meteorol. 2012, 156, 121–133. [Google Scholar] [CrossRef]
  20. Xie, N.M.; Xin, J.H.; Liu, S.F. China’s regional meteorological disaster loss analysis and evaluation based on grey cluster model. Nat. Hazards 2014, 71, 1067–1089. [Google Scholar] [CrossRef]
  21. Gu, Y.; Zhang, S.F.; Lin, J.; Liu, J.L. Characteristics, change trend and countermeasures of continuous drought years in China. Adv. Sci. Tech. Water Res. 2010, 30, 75–79. (In Chinese) [Google Scholar]
  22. Dong, Q.; Xue, C.J.; Ren, Y.Z. Spatio-temporal variability of drought over northern China and its relationships with Indian–Pacific sea surface temperatures. Proc. SPIE 2012. [Google Scholar] [CrossRef]
  23. Yang, J.H.; Yang, Q.G.; Yao, Y.B.; Wei, F.; Shan, H.T. Drought index in summer season of Northwest China. Resour. Sci. 2006, 28, 17–22. (In Chinese) [Google Scholar]
  24. Ye, M.; Qian, Z.H.; Wu, Y.P. Spatiotemporal evolution of the droughts and floods over China. Acta Phys. Sin. 2013, 62. [Google Scholar] [CrossRef]
  25. Zou, X.K.; Zhang, Q. Preliminary studies on variations in droughts over China during past 50 years. J. Appl. Meteorol. Sci. 2008, 19, 679–687. (In Chinese) [Google Scholar]
  26. Cheng, M.; Wang, R.H.; Xue, H.X.; Li, Q. Effects of drought on ecosystem net primary production in northwestern China. J. Arid L. Res. Environ. 2012, 6, 1–7. (In Chinese) [Google Scholar]
  27. Zhao, H.Y.; Wang, Y.H.; Wang, X.; Tan, D. Anomaly distribution of drought–flood and changing characteristics of arid over eastern Northwest China during 1961–2008. Arid L. Geogr. 2012, 35, 552–558. (In Chinese) [Google Scholar]
  28. Yang, X.L. Research and application of meteorological drought monitoring indexes in Northwest China. Meteorol. Mon. 2007, 33, 90–96. (In Chinese) [Google Scholar]
  29. Liu, X.C.; Xu, Z.X.; Yu, R.H. Spatiotemporal variability of drought and the potential climatological driving factors in the Liao River Basin. Hydrol. Process 2012, 26, 1–14. [Google Scholar] [CrossRef]
  30. Zhang, Q.; Xu, C.Y.; Chen, X.; Zhang, Z. Statistical behaviours of precipitation regimes in China and their links with atmospheric circulation 1960–2005. Int. J. Climatol. 2011, 31, 1665–1678. [Google Scholar] [CrossRef]
  31. Guo, Q.Y.; Cai, J.N.; Shao, X.M.; Sha, W.Y. Interdecadal variability of East Asian summer monsoon and its impatc on the climate of China. Acta Geogr. Sin. 2003, 58, 569–576. (In Chinese) [Google Scholar]
  32. Ding, Y.; Wang, Z.; Sun, Y. Inter-decadal variation of the summer precipitation in East China and its association with decreasing Asian summer monsoon. Part I: Observed evidences. Int. J. Climatol. 2008, 28, 1139–1162. [Google Scholar] [CrossRef]
  33. Liu, X.; Yin, Z.Y. Spatial and temporal variation of summer precipitation over the eastern Tibetan Plateau and the North Atlantic Oscillation. J. Clim. 2001, 14, 2896–2909. [Google Scholar] [CrossRef]
  34. Liu, H.; Duan, K.; Li, M.; Shi, P.; Yang, J.; Zhang, X.; Sun, J. Impact of the North Atlantic Oscillation on the dipole oscillation of summer precipitation over the central and eastern Tibetan Plateau. Int. J. Climatol. 2015. [Google Scholar] [CrossRef]
  35. Lee, H.F.; Zhang, D.D. Relationship between NAO and drought disasters in northwestern China in the last millennium. J. Arid Environ. 2011, 75, 1114–1120. [Google Scholar] [CrossRef]
  36. Tan, C.P.; Yang, J.P.; Qin, D.H.; Li, M. Climatic background of persistent drought in Ningxia Hui Autonomous Region, China. J. Desert. Res. 2014, 34, 518–526. (In Chinese) [Google Scholar]
  37. Ma, L.W.; Li, F.X.; Liang, X. Characteristics of drought and its influence to agriculture in Ningxia. Agric. Res. Arid Area 2001, 19, 102–109. (In Chinese) [Google Scholar]
  38. Li, S.S.; Yan, J.P.; Yang, R.; Hu, N.N. Spatial-temporal characteristics of drought and flood disasters under the backgroung of global warming in Ningxia in 1961–2010. J. Desert. Res. 2013, 33, 1552–1559. (In Chinese) [Google Scholar]
  39. Na, L.; Zheng, G.F.; Ren, S.Y.; Xu, J.Q. Relationship of drought with precipitation concentration period and precipitation–concentration degree in Ningxia in spring, summer and fall. J. Glaciol. Geocryol. 2013, 35, 1015–1021. (In Chinese) [Google Scholar]
  40. Wang, Y.; Liu, P.X.; Cao, L.G.; Gao, Y.; Yong, G.Z. A study on spatial-temporal variation characteristics of drought based on Standardized Precipitation Index in Ningxia Autonomous Region during recent 53 years. Soil Water Conserv. 2014, 34, 296–302. (In Chinese) [Google Scholar]
  41. Wang, S.Y.; Zheng, G.F.; Li, X.; Li, Z.L.; Yang, J.L.; Feng, J.M. Modification of CI comprehensive meteorological drought index and its application in Ningxia. J. Arid Meteorol. 2013, 31, 561–569. (In Chinese) [Google Scholar]
  42. Li, H.Y.; Zhang, X.Y.; Wang, J.; Zheng, G.F.; Wang, S.Y. Analysis of drought disasters-causing factors in Ningxia based on CI index. Plateau Meteorol. 2014, 33, 995–1001. (In Chinese) [Google Scholar]
  43. Liang, X.; Feng, J.M.; Zhang, Z.; Zheng, G.F. A study on drought climate change and its causes. J. Arid L. Res. Environ. 2007, 21, 68–74. (In Chinese) [Google Scholar]
  44. China’s Different Province Atlas Series: The Atlas of Ningxia Hui Autonomous Region, China; China Cartographic Publishing House: Beijing, China, 2012. (In Chinese)
  45. Kottek, M.; Grieser, J.; Beck, C.; Rudolf, B.; Rubel, F. World map of the Köppen–Geiger climate classification updated. Meteorology 2006, 15, 259–263. [Google Scholar] [CrossRef]
  46. Li, Y.; Conway, D.; Wu, Y.J.; Gao, Q.Z.; Rothausen, S.; Xiong, W.; Ju, H.; Lin, E.D. Rural livelihoods and climate variability in Ningxia, Northwest China. Clim. Change 2013, 119, 891–904. [Google Scholar] [CrossRef]
  47. Qin, Q.; Ghulam, A.; Zhu, L.; Wang, L.; Li, J.; Nan, P. Evaluation of MODIS derived Perpendicular Drought Index for estimation of surface dryness over northwestern China. Int. J. Remote Sens. 2008, 29, 1983–1995. [Google Scholar] [CrossRef]
  48. Zheng, G.F.; Chen, X.G.; Sun, Y.C.; Zhang, Z.; Na, L. The changes of temperature, precipitation, evaporation and their response to the climate warming. Sci. Meteorol. Sin. 2006, 26, 412–421. (In Chinese) [Google Scholar]
  49. Li, X.; Wang, L.X.; Li, Q.; Li, J.P. NDVI change and its relationship with climate in Ningxia in the last 25 years. J. Arid L. Res. Environ. 2011, 25, 161–166. (In Chinese) [Google Scholar]
  50. Wang, B.; Wu, Z.W.; Li, J.P.; Liu, J.; Chang, C.P.; Ding, Y.H.; Wu, G.X. How to measure the strength of the East Asian summer monsoon. J. Clim. 2008, 21, 4449–4463. [Google Scholar] [CrossRef]
  51. Li, J.; Zeng, Q. A unified monsoon index. Geophys. Res. Lett. 2002, 29, 1151–1154. [Google Scholar] [CrossRef]
  52. Chen, W.Y.; Van den Dool, H. Sensitivity of teleconnection patterns to the sign of their primary action center. Mon. Weather Rev. 2003, 131, 2885–2899. [Google Scholar] [CrossRef]
  53. Barnston, A.G.; Livezey, R.E. Classification, seasonality and persistence of low-frequency atmospheric circulation patterns. Mon. Weather Rev. 1987, 115, 1083–1126. [Google Scholar] [CrossRef]
  54. Li, J.P.; Zeng, Q.C. East Asian Summer Monsoon Index (EASMI). Available online: http://ljp.gcess.cn/dct/page/65577 (accessed on 28 September 2015).
  55. Li, J.P.; Zeng, Q.C. South Asian Summer Monsoon Index (SASMI). Available online: http://ljp.gcess.cn/dct/page/65576 (accessed on 28 September 2015).
  56. National Oceanic and Atmospheric Administration (NOAA). North Atlantic Oscillation (NAO). Available online: http://www.cpc.ncep.noaa.gov/products/precip/CWlink/pna/nao.shtml. (accessed on 12 December 2005).
  57. Morid, S.; Smakhtin, V.; Moghaddasi, M. Comparison of seven meteorological indices for drought monitoring in Iran. Int. J. Climatol. 2006, 26, 971–985. [Google Scholar] [CrossRef]
  58. Damberg, L.; AghaKouchak, A. Global trends and patterns of drought from space. Theor. Appl. Climatol. 2014, 117, 441–448. [Google Scholar] [CrossRef]
  59. Wang, W.; Zhu, Y.; Xu, R.G.; Liu, J.T. Drought severity change in china during 1961–2012 indicated by SPI and SPEI. Nat. Hazards 2015, 75, 2437–2451. [Google Scholar] [CrossRef]
  60. Guttman, N.B. On the sensitivity of sample-l moments to sample-size. J. Clim. 1994, 7, 1026–1029. [Google Scholar] [CrossRef]
  61. Mckee, T.B.; Doesken, N.J.; Kleist, J. Drought monitoring with multiple time scales. In Proceedings of Ninth Conference on Applied Climatology, Dallas, TX, USA, 15–20 January 1995; pp. 233–236.
  62. Daneshvar, M.R.M.; Bagherzadeh, A.; Khosravi, M. Assessment of drought hazard impact on wheat cultivation using Standardized Precipitation Index in Iran. Arab. J. Geosci. 2013, 6, 4463–4473. [Google Scholar] [CrossRef]
  63. Edwards, D.C.; McKee, T.B. Chacteristics of 20th Century Drought in the United States at Multiple Time Scales, 1997. Available online: http://ccc.atmos.colostate.edu/edwards.pdf (accessed on 15 April 2015).
  64. Almedeij, J. Drought analysis for Kuwait using Standardized Precipitation Index. Sci. World J. 2014, 2014, 1–9. [Google Scholar] [CrossRef] [PubMed]
  65. Thornthwaite, C.W. An approach toward a rational classification of climate. Geogr. Rev. 1948, 38, 55–94. [Google Scholar] [CrossRef]
  66. Singh, V.P.; Guo, H.; Yu, F.X. Parameter estimation for 3-parameter log-logistic distribution (LLD3) by Pome. Stoch. Hydrol. Hydraul. 1993, 7, 163–177. [Google Scholar] [CrossRef]
  67. Abramowitz, M.; Stegun, I.A. Handbook of Mathematical Functions: With Formulas, Graphs, and Mathematical Tables; Dover Publications: Mineola, NY, USA, 1965. [Google Scholar]
  68. National Drought Mitigation Center (NDMC). Program to Calculate Standardized Precipitation Index. Avaliable online: http://drought.unl.edu/MonitoringTools/DownloadableSPIProgram.aspx (accessed on 15 April 2015).
  69. Santiago, B.; Vicente-Serrano, S.M. SPEI Calculator. Available online: http://digital.csic.es/handle/10261/10002 (accessed on 21 August 2013).
  70. Banimahd, S.A.; Khalili, D. Factors influencing Markov chains predictability characteristics, utilizing SPI, RDI, EDI and SPEI drought indices in different climatic zones. Water Resour. Manag. 2013, 27, 3911–3928. [Google Scholar] [CrossRef]
  71. Kumar, M.N.; Murthy, C.S.; Sai, M.V.R.S.; Roy, P.S. On the use of Standardized Precipitation Index (SPI) for drought intensity assessment. Meteorol. Appl. 2009, 16, 381–389. [Google Scholar] [CrossRef]
  72. Mishra, S.S.; Nagarajan, R. Spatio-temporal drought assessment in Tel river basin using Standardized Precipitation Index (SPI) and GIS. Geomat. Nat. Haz Risk 2011, 2, 79–93. [Google Scholar] [CrossRef]
  73. Gocic, M.; Trajkovic, S. Analysis of precipitation and drought data in Serbia over the period 1980–2010. J. Hydrol. 2013, 494, 32–42. [Google Scholar] [CrossRef]
  74. Lloyd-Hughes, B.; Saunders, M.A. A drought climatology for Europe. Int. J. Climatol. 2002, 22, 1571–1592. [Google Scholar] [CrossRef]
  75. Potop, V.; Boroneant, C.; Mozny, M.; Stepanek, P.; Skalak, P. Observed spatiotemporal characteristics of drought on various time scales over the Czech Republic. Theor. Appl. Climatol. 2014, 115, 563–581. [Google Scholar] [CrossRef]
  76. Ji, L.; Peters, A.J. Assessing vegetation response to drought in the Northern Great Plains using vegetation and drought indices. Remote Sens. Environ. 2003, 87, 85–98. [Google Scholar] [CrossRef]
  77. Spinoni, J.; Naumann, G.; Carrao, H.; Barbosa, P.; Vogt, J. World drought frequency, duration, and severity for 1951–2010. Int. J. Climatol. 2014, 34, 2792–2804. [Google Scholar] [CrossRef]
  78. Li, Y.J.; Zheng, X.D.; Lu, F.; Ma, J. Analysis of drought evolvement characteristics based on Standardized Precipitation Index in the Huaihe River Basin. Proced. Eng. 2012, 28, 434–437. [Google Scholar]
  79. Zhang, Q.; Liu, C.L.; Xu, C.Y.; Xu, Y.P.; Jiang, T. Observed trends of annual maximum water level and streamflow during past 130 years in the Yangtze River Basin, China. J. Hydrol. 2006, 324, 255–265. [Google Scholar] [CrossRef]
  80. Kumar, S.; Merwade, V.; Kam, J.; Thurner, K. Streamflow trends in Indiana: Effects of long term persistence, precipitation and subsurface drains. J. Hydrol. 2009, 374, 171–183. [Google Scholar] [CrossRef]
  81. Sicard, P.; Mangin, A.; Hebel, P.; Mallea, P. Detection and estimation trends linked to air quality and mortality on French Riviera over the 1990–2005 period. Sci. Total Environ. 2010, 408, 1943–1950. [Google Scholar] [CrossRef] [PubMed]
  82. Storch, H.V. Misuses of statistical analysis in climate research. In Analysis of Climate Variability: Applications of Statistical Techniques; Storch, H.V., Navarra, A., Eds.; Springer Verlag: Berlin Germany, 1995; pp. 11–26. [Google Scholar]
  83. Yue, S.; Wang, C.Y. Applicability of prewhitening to eliminate the influence of serial correlation on the Mann–Kendall test. Water Resour. Res. 2002, 38, 1–7. [Google Scholar] [CrossRef]
  84. Bayazit, M.; Onoz, B. To prewhiten or not to prewhiten in trend analysis? Hydrol. Sci. J. 2007, 52, 611–624. [Google Scholar] [CrossRef]
  85. Abramopoulos, F.; Rosenzweig, C.; Choudhury, B. Improved ground hydrology calculations for Global Climate Models (GCMs): Soil water movement and evapotranspiration. J. Clim. 1988, 1, 921–941. [Google Scholar] [CrossRef]
  86. Vicente-Serrano, S.M.; Lopez-Moreno, J.-I.; Beguería, S.; Lorenzo-Lacruz, J.; Sanchez-Lorenzo, A.; García-Ruiz, J.M.; Azorin-Molina, C.; Morán-Tejeda, E.; Revuelto, J.; Trigo, R. Evidence of increasing drought severity caused by temperature rise in southern Europe. Environ. Res. Lett. 2014, 9, 1–9. [Google Scholar] [CrossRef]
  87. Wang, S.Y.; Zheng, G.F.; Yang, J.; Li, X. Application of three drought evaluation indices in Ningxia. J. Desert Res. 2012, 32, 517–524. (In Chinese) [Google Scholar]
  88. Ding, Q.H.; Wang, B. Circumglobal teleconnection in the northern hemisphere summer. J. Clim. 2005, 18, 3483–3505. [Google Scholar] [CrossRef]

