Next Article in Journal
Potential Sources of Trace Metals and Ionic Species in PM2.5 in Guadalajara, Mexico: A Case Study during Dry Season
Previous Article in Journal
Investigations of the Diurnal Variation of Vertical HCHO Profiles Based on MAX-DOAS Measurements in Beijing: Comparisons with OMI Vertical Column Data
 
 
Erratum published on 28 December 2015, see Atmosphere 2016, 7(1), 3.
Article

An Assessment of the South Asian Summer Monsoon Variability for Present and Future Climatologies Using a High Resolution Regional Climate Model (RegCM4.3) under the AR5 Scenarios

1
State Key Laboratory of Environmental Simulation and Pollution Control (SKLESPC), School of Environment, Tsinghua University, Beijing 100084, China
2
Department of Space Sciences, Institute of Space Technology, Islamabad Highway, Islamabad 44000, Pakistan
3
Institute of Geographic Science and Natural Resources Research/Key Laboratory of Water Cycle and Related Land Surface Processes, Chinese Academy of Sciences, Beijing 100101, China
4
Meteorology Institute of Stockholm University (MISU), Stockholm SE-106 91, Sweden
*
Authors to whom correspondence should be addressed.
Atmosphere 2015, 6(11), 1833-1857; https://doi.org/10.3390/atmos6111833
Submission received: 5 September 2015 / Revised: 7 November 2015 / Accepted: 10 November 2015 / Published: 23 November 2015

Abstract

:
We assessed the present and future climatologies of mean summer monsoon over South Asia using a high resolution regional climate model (RegCM4) with a 25 km horizontal resolution. In order to evaluate the performance of the RegCM4 for the reference period (1976–2005) and for the far future (2070–2099), climate change projections under two greenhouse gas representative concentration pathways (RCP4.5 and RCP8.5) were made, the lateral boundary conditions being provided by the geophysical fluid dynamic laboratory global model (GFDL-ESM2M). The regional climate model (RCM) improves the simulation of seasonal mean temperature and precipitation patterns compared to driving global climate model (GCM) during present-day climate conditions. The regional characteristic features of South Asian summer monsoon (SASM), like the low level jet stream and westerly flow over the northern the Arabian Sea, are well captured by the RegCM4. In spite of some discrepancies, the RegCM4 could simulate the Tibetan anticyclone and the direction of the tropical easterly jet reasonably well at 200 hPa. The projected temperature changes in 2070–2099 relative to 1976–2005 for GFDL-ESM2M show increased warming compared to RegCM4. The projected patterns at the end of 21st century shows an increase in precipitation over the Indian Peninsula and the Western Ghats. The possibilities of excessive precipitation include increased southwesterly flow in the wet period and the effect of model bias on climate change. However, the spatial patterns of precipitation are decreased in intensity and magnitude as the monsoon approaches the foothills of the Himalayas. The RegCM4-projected dry conditions over northeastern India are possibly related to the anomalous anticyclonic circulations in both scenarios.

Graphical Abstract

1. Introduction

Global warming, positive radiative forcing and increasing greenhouse gas (GHG) concentration in the atmosphere provide strong evidence of human influence on the Earth’s climate system. From 1951 to 2010, GHG caused a global surface warming in the range of 0.5 °C to 1.3 °C; continued GHG emissions will cause further warming and changes in the composure of the climate system [1]. More severe and extreme weather events are likely to occur in the future in global monsoon areas in the form of severe floods and droughts under the GHG-induced warmer climate [2,3,4]. However, the climate change response to various regional monsoon areas may differ due to a complex land−ocean configuration, topography and regional climate forcing [5]. South Asia has a diverse set of climates and the existence of complex geographical features with extensive mountain ranges of Hindukush, Karakorum and Himalaya (HKH) pose a great challenge to regional climate models (RCMs) in reproducing the observed climatology [6]. The South Asian summer monsoon (SASM) is one of the most spectacular and energetic occurrences in the planet’s climate system and exhibits highly complex variability from June to September [7]. Substantial variability in the SASM wields significant impacts on the economics, ecosystems, agriculture and water resources of the whole subcontinent of South Asia [8,9,10]. Pakistan is located at the western edge of the South Asia monsoon system and the northwestern areas of Pakistan including the Upper Indus Basin (UIB) are extremely vulnerable to the SASM. During the months of July and August, the monsoon precipitation events cause widespread flooding and damages to the land area of northern Pakistan [11]. The ruinous monsoonal flood that occurred in Pakistan in summer 2010 is reported as the worst flash flood in the history of entire region [10].
The world climate research program (WCRP) released the multi-model data archive of coupled model inter-comparison project phase 5 (CMIP5) in 2012 for preparation of the intergovernmental panel on climate change (IPCC)’s fifth assessment report (AR5) which describes the performance of various coupled general circulation models (CGCM) under four different representative concentration pathways (RCPs) [12]. Recent studies have revealed that the performance of CMIP5 models are much better compared to CMIP3 models, particularly in their representation of the Asian monsoon [12,13,14]. Over the past few decades, a number of studies have focused on SASM using GCMs [15,16,17,18,19,20]. Although the GCMs are capable of simulating the large-scale aspects of climate in a realistic manner, they do not resolve the topography, land use and influence of local climate forcing at the regional scales [21,22]. The GCMs’ application in the SASM region are limited, thus urging the use of the regional climate model (RCM) at a high resolution [23]. The dynamic and physics of the RCMs are adequate for integrating the climate data at a high resolution and can improve the simulation results from comparatively coarse resolution GCMs [24]. At present, the regional climate models (RCMs) are used to dynamically downscale the output of the GCMs and reanalysis data for seasonal climate variability, climate change impact and regional climate processes studies [25]. The performance of different RCMs have been investigated over South Asia with the emphasis on the SASM [6,8,26,27,28,29,30,31,32,33,34,35]. Among them, Dash et al. [29] conducted a simulation using RegCM3 to evaluate the model performance for Indian summer monsoon circulation and rainfall patterns. Islam et al. [30] investigated the frequency of cold and warm spells in Pakistan using PRECIS RCM. In their study, Ashfaq et al. [8] used a nested RCM to investigate the response of the SASM dynamics under IPCC AR4. They found that changes in the monsoon dynamic could have vital effects on decreasing summer precipitation over central areas of South Asia. Saeed et al. [34] proposed an evaluation framework for the evaluation of SASM in an RCM. Most of these studies have focused either on the evaluation of SASM for a short period of time or performed with the output of CMIP3 models dataset.
In 2012, the International Center for Theoretical Physics Italy (ICTP) released the fourth version of the regional climate model (RegCM4) with some major additions including a new land surface scheme, the community land model version 3.5 (CLM3.5) and mixed convection schemes running over land and ocean [36,37]. The applications of RCMs are very rare over Pakistan, in particular over the UIB. Syed et al. [6] investigated the uncertainties related to RCMs for SASM with reference to a driving global dataset; however, they used the CMIP3 GCMs dataset under AR4 climate projections.
In a very recent study, Dash et al. [35] used RegCM4 coupled with a biosphere atmosphere transfer scheme (BATS) over South Asia in order to assess the future climate projection of summer monsoon variability at 50 km horizontal resolution. They did not configure the model with the CLM land surface scheme, though there are several advantages of CLM over BATS [37]. In order to figure out the best convective and land surface scheme over South Asia, we have conducted successive sensitivity experiments with different physical parameterization schemes available in the current version of RegCM and found the improved performance of RegCM-CLM better than RegCM-BATS, which is in line with the study of Giogri et al. [37]. The purpose of the study is to analyze the RegCM with the best-suited physical parameterization scheme for present and future climate change signals using the latest AR5 scenarios based on the CMIP5 project. In order to better represent the responses of climate system dynamics associated with atmospheric convection, geographical complexity and heterogeneity of the land cover, we conducted the regional climate model simulations at 25 km fine resolution.

2. Model, Data and Experimental Design

2.1. Model Description

The ICTP regional climate model, RegCM, has a wide range of applications from process studies to paleo-climate and future climate change projections. RegCM version 4.3 has been adopted for the present study. RegCM was originally developed at the National Center for Atmospheric Research (NCAR) and evolved into the later versions, RegCM2 and RegCM2.5, with an up gradation to RegCM3 [38,39,40,41,42]. After the substantial evolution in term of physics and software code, ICTP released the fourth version of RegCM as documented by Giorgi et al. [37]. RegCM4.3 is a primitive equation model and compressible with sigma-p vertical coordinates running on an Arakawa B-grid in which wind and thermo-dynamical variables are horizontally staggered. The dynamical structure of RegCM4.3 is the same as that of the hydrostatic version of NCAR meso-scale model version 5 (MM5) [43].
RegCM4.3 includes two schemes for land surface process representation; the Biosphere Atmosphere Transfer Scheme (BATS) of Dickinson et al. [44] and CLM3.5 of Tawfik and Steiner [36]. CLM3.5 is one of major augmentation in RegCM4.3 in which land and atmospheric exchanges of water, energy and momentum are described through a series of bio-geophysical parameterization [45]. More details about the advantages of CLM3.5 over BATS can be found in the reference literature of Oleson et al. [45] and Steiner et al. [46]. RegCM4.3 includes the radiation package of NCAR’s global community climate model (CCM) version 3 [47]. CCM3 includes all greenhouse gases and the Delta-Eddington formulation is used to calculate the solar radiative processes [48]. Resolved scale precipitation scheme is based on the simplified sub grid explicit moisture (SUBEX) parameterization of Pal et al. [49] that solves the prognostic equation for cloud water. For the planetary boundary layer (PBL) processes representation, RegCM4.3 uses Holtslag et al. [50] scheme. Four cumulus parameterization schemes are available in the current version of RegCM4.3. The first one is the Kuo-type scheme of Anthes et al. [51] which provides poor precipitation simulation as compared to other available convective schemes and hence is used very occasionally [37]. The second one is the simplification of the Arakawa and Schubert parameterization and is known as the Grell scheme [52]. In this scheme, the clouds are considered as two steady state circulations including an updraft and a triggered penetrative downdraft. The Grell scheme is triggered when an air parcel reaches the moist convection level. The Grell scheme includes two closure assumptions: an Arakawa-Schubert (AS) in which buoyant energy is immediately released at each time step and Fritsch-Chappell (FC) type closure in which all available buoyant energy (CAPE) dissipates at a specified time step of 30 min [53,54]. The third cumulus scheme available in RegCM4.3 is Emanuel, which is considered as the most complex amongst the others [55,56]. It is activated when the buoyancy level is higher than the cloud base and tends to produce extensive precipitation over land. Tiedtke [57] is the fourth available convection scheme in RegCM4.3 which is based on a moisture convergence closure. As compared to the previous versions, RegCM4.3 includes a mixed convection scheme option in which one of the schemes amongst Grell (GF or AS) and Emanuel can be used at land with the other one over ocean.

2.2. Experimental Design and Model Data

As mentioned earlier, we conducted various sensitivity experiments and found RegCM-CLM with MIX convection scheme (Grell over land and MIT over ocean) as the best-suited combination for climate simulation over South Asia. Therefore, in the present study, we configured the RegCM4.3 with CLM3.5 and MIX convection schemes. The model used 18 vertical sigma levels from ground surface up to the 50 hPa top level. To assess the performance of the model, for present-day climatology, we selected a time period from 1975 to 2005 with the first year being considered a spin up. The resulting 30 years are used for analysis. To provide the initial and time-dependent lateral boundary conditions for RegCM4, we used geophysical fluid dynamics laboratory global circulation model (GFDL-ESM2M) of CMIP5 with approximately 2 degrees horizontal resolution. Note that the selection of GFDL-ESM2M is made on the basis of Coppola et al. [58] phase I CORDEX REgCM hyper-Matrix (CREMA) experiments. Two sets of RCP experiments are also conducted for far future climate projection (2070–2099), one for the moderate level of the GHG scenario (RCP4.5) and the second for the strongest level of the GHG scenario (RCP8.5). The United States Geological Survey (USGS) and Global Land Cover Characteristics (GLCC) datasets at 10 min resolution are respectively used for model topography and land-use information [59]. The observed precipitation and temperature datasets of the Climate Research Unit (CRU) of the University of East Anglia, UK at 0.5 degrees in addition to Asian precipitation, highly resolved, observational data integration towards evaluation (APHRODITE) at 0.25 degrees, which contains a high-density and quality station network including the Himalayas, are used for the purpose of comparison [60,61]. The European Center for Medium Range Weather Forecast (ECMWF) Interim reanalysis, hereafter referred to as ERAIM, at 0.7 degrees and National Center for Atmospheric Research (NCAR) Reanalysis 2 datasets (hereafter NCEP-DOE), are used to compare the models’ simulated fields. South Asia has a relatively homogeneous rainfall with different climatic types, falling in different geographic regions [23,62,63]. Based on the aforementioned studies, we present the detail analysis of monsoon core region (MCR) ranging between 69–88°E and 18–28°N along with the other geographically important areas as mentioned in Figure 1, where the SASM play a vital role [22,64].
Figure 1. Domain and topography of the RegCM covering South Asia. Surface elevation is given in meters. The box defines the monsoon core regions focused on in this discussion.
Atmosphere 06 01833 g001
The spatial pattern of temperature and precipitation changes in SASM are analyzed by considering two GHG RCPs scenarios. First, one is a medium stabilization scenario (RCP4.5), where the total radiative forcing is stabilized before 2100 by the usage of a range of technologies and strategies for reducing GHG emissions [65]. On the other hand, RCP8.5 is characterized by increasing GHG emissions as a result of high population growth and a lower rate of technology development [65]. RCP8.5 is a non-climate policy scenario. In fact, most of the non-climate policy scenarios predict the CO2 emissions of the order of 15 to 20 GtC (billion tonnes of carbon) by the end of 21st century [66]. For the RCP4.5 scenario, the CO2 emissions range from 5 to 10 GtC, which is comparable to several low emission reference scenarios such as SRES B1 [66]. Pertaining to aerosol emissions, RCP8.5 radiative forcing from tropospheric ozone increases by an additional 0.2 W/m2 and, in contrast, there is a decrease for RCP4.5 by 0.7 W/m2 at the end of 21st century [67].

3. Results

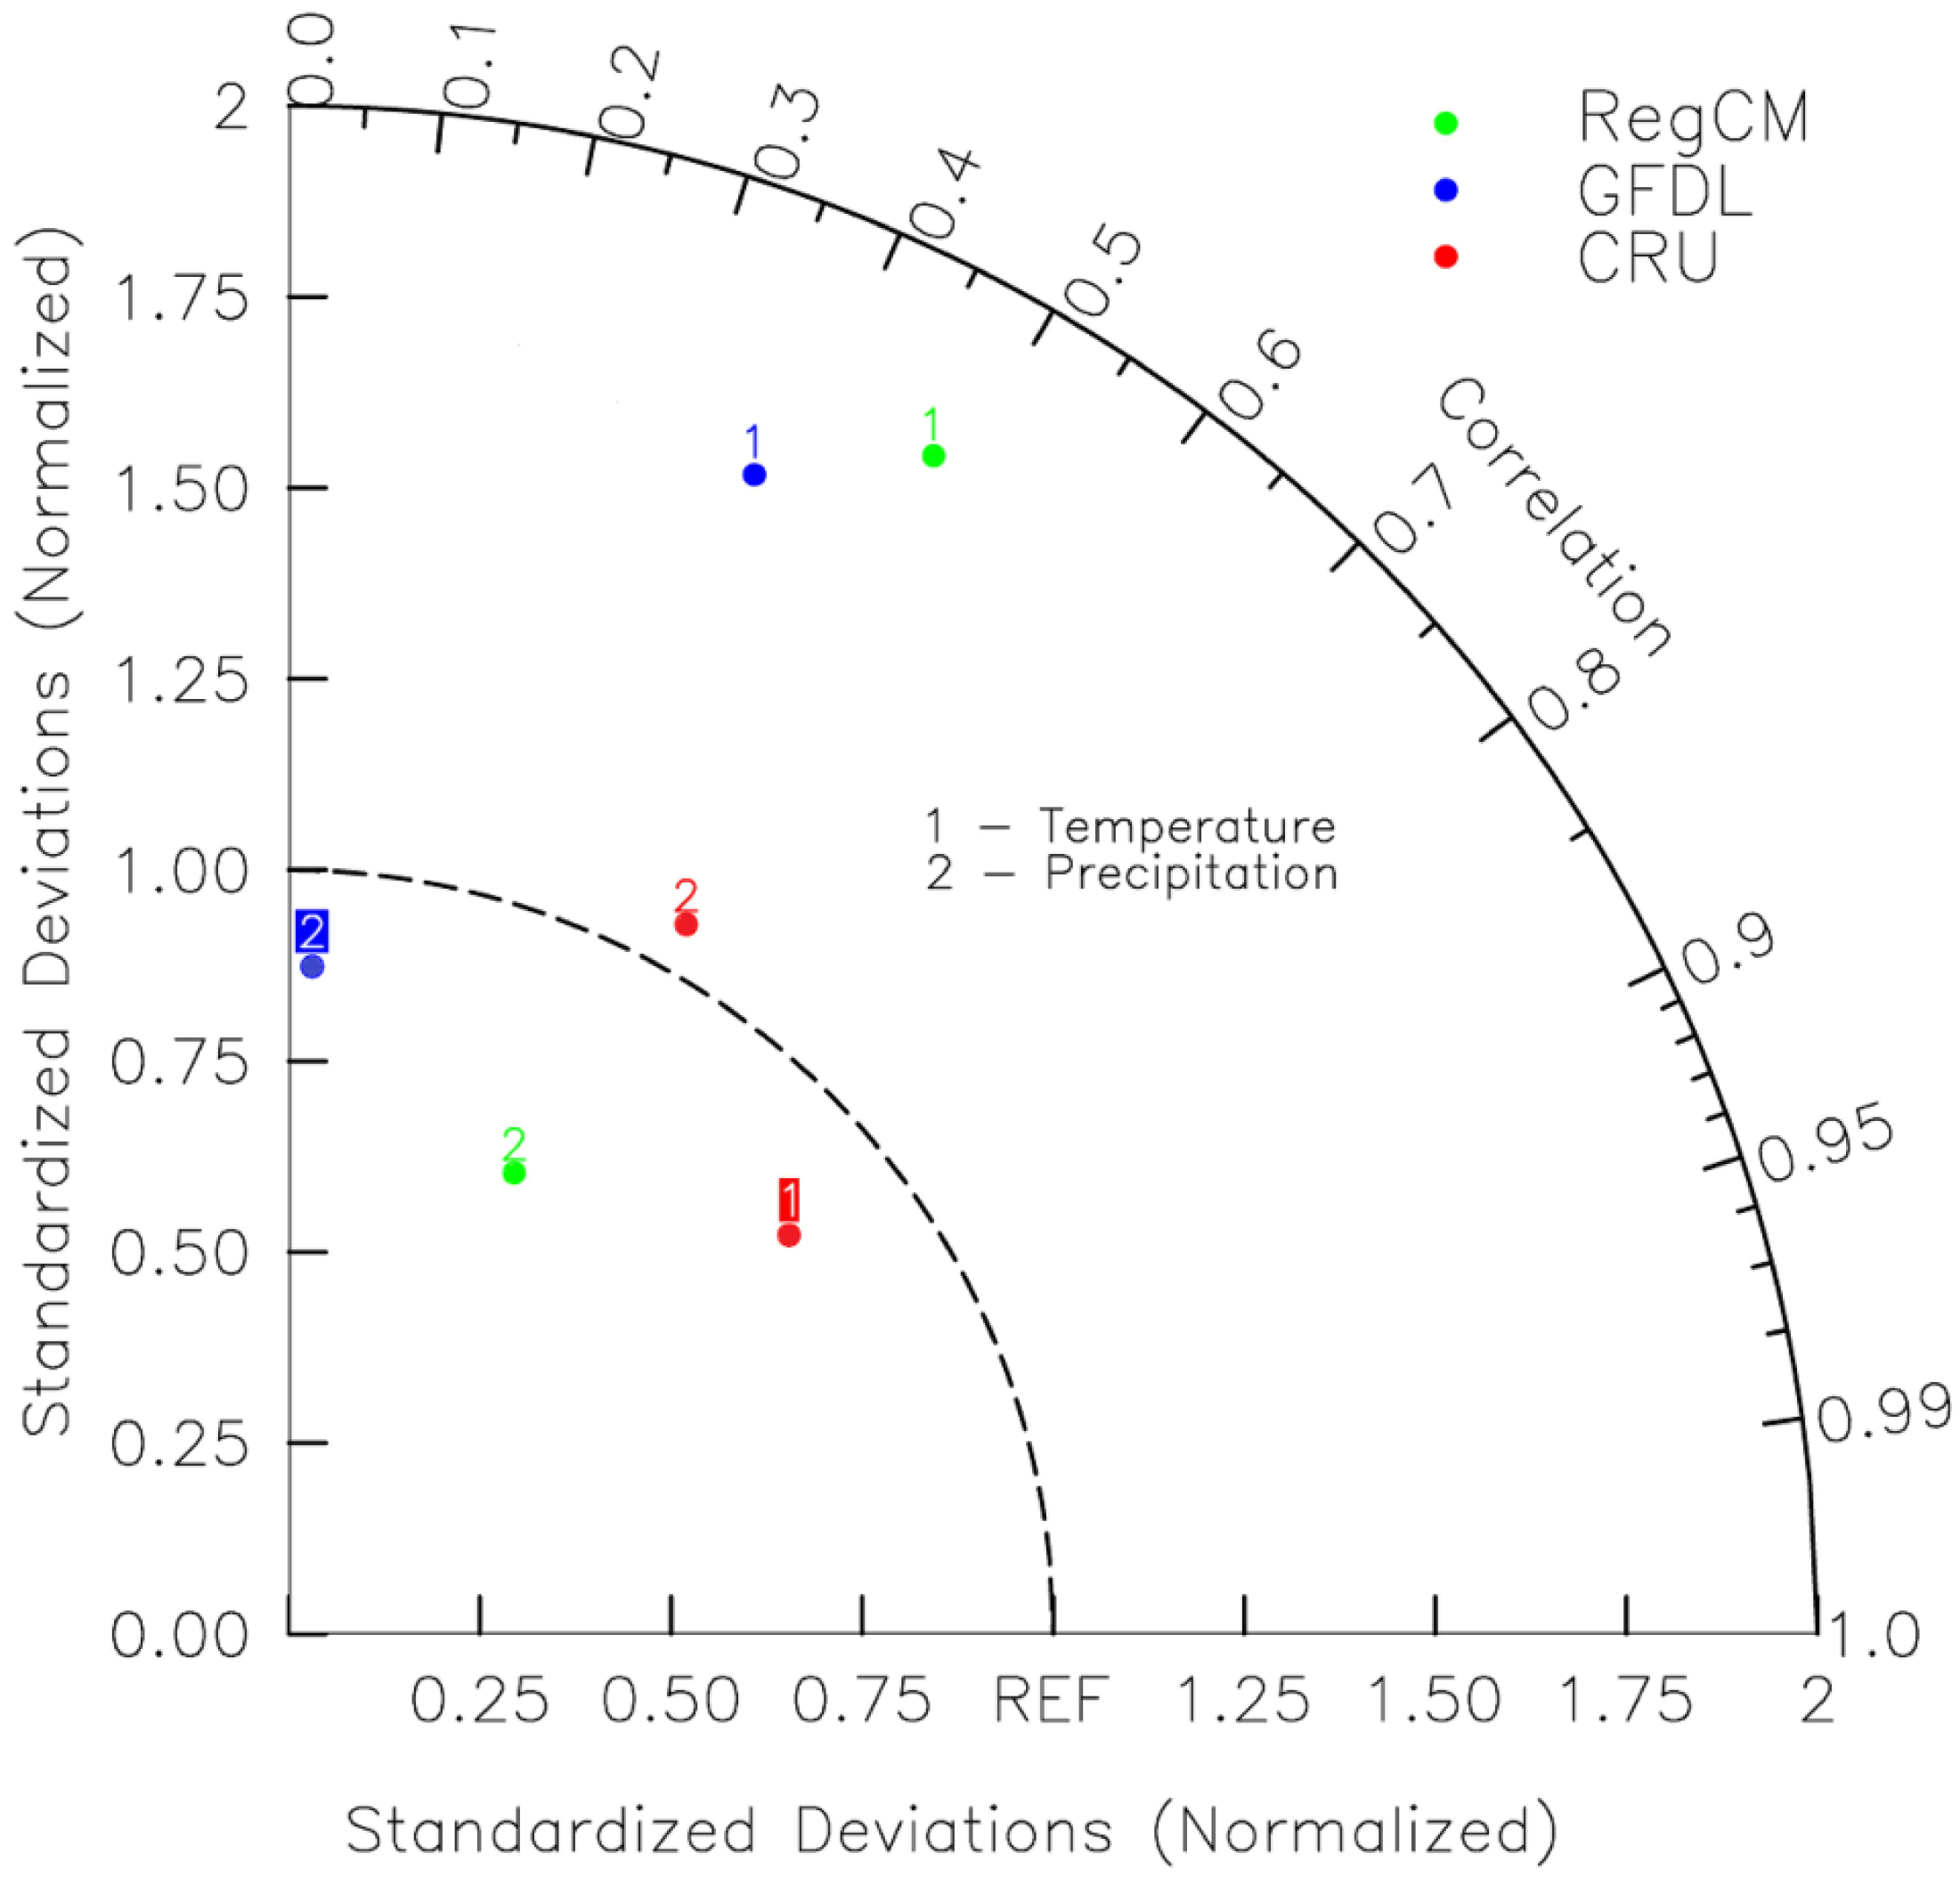
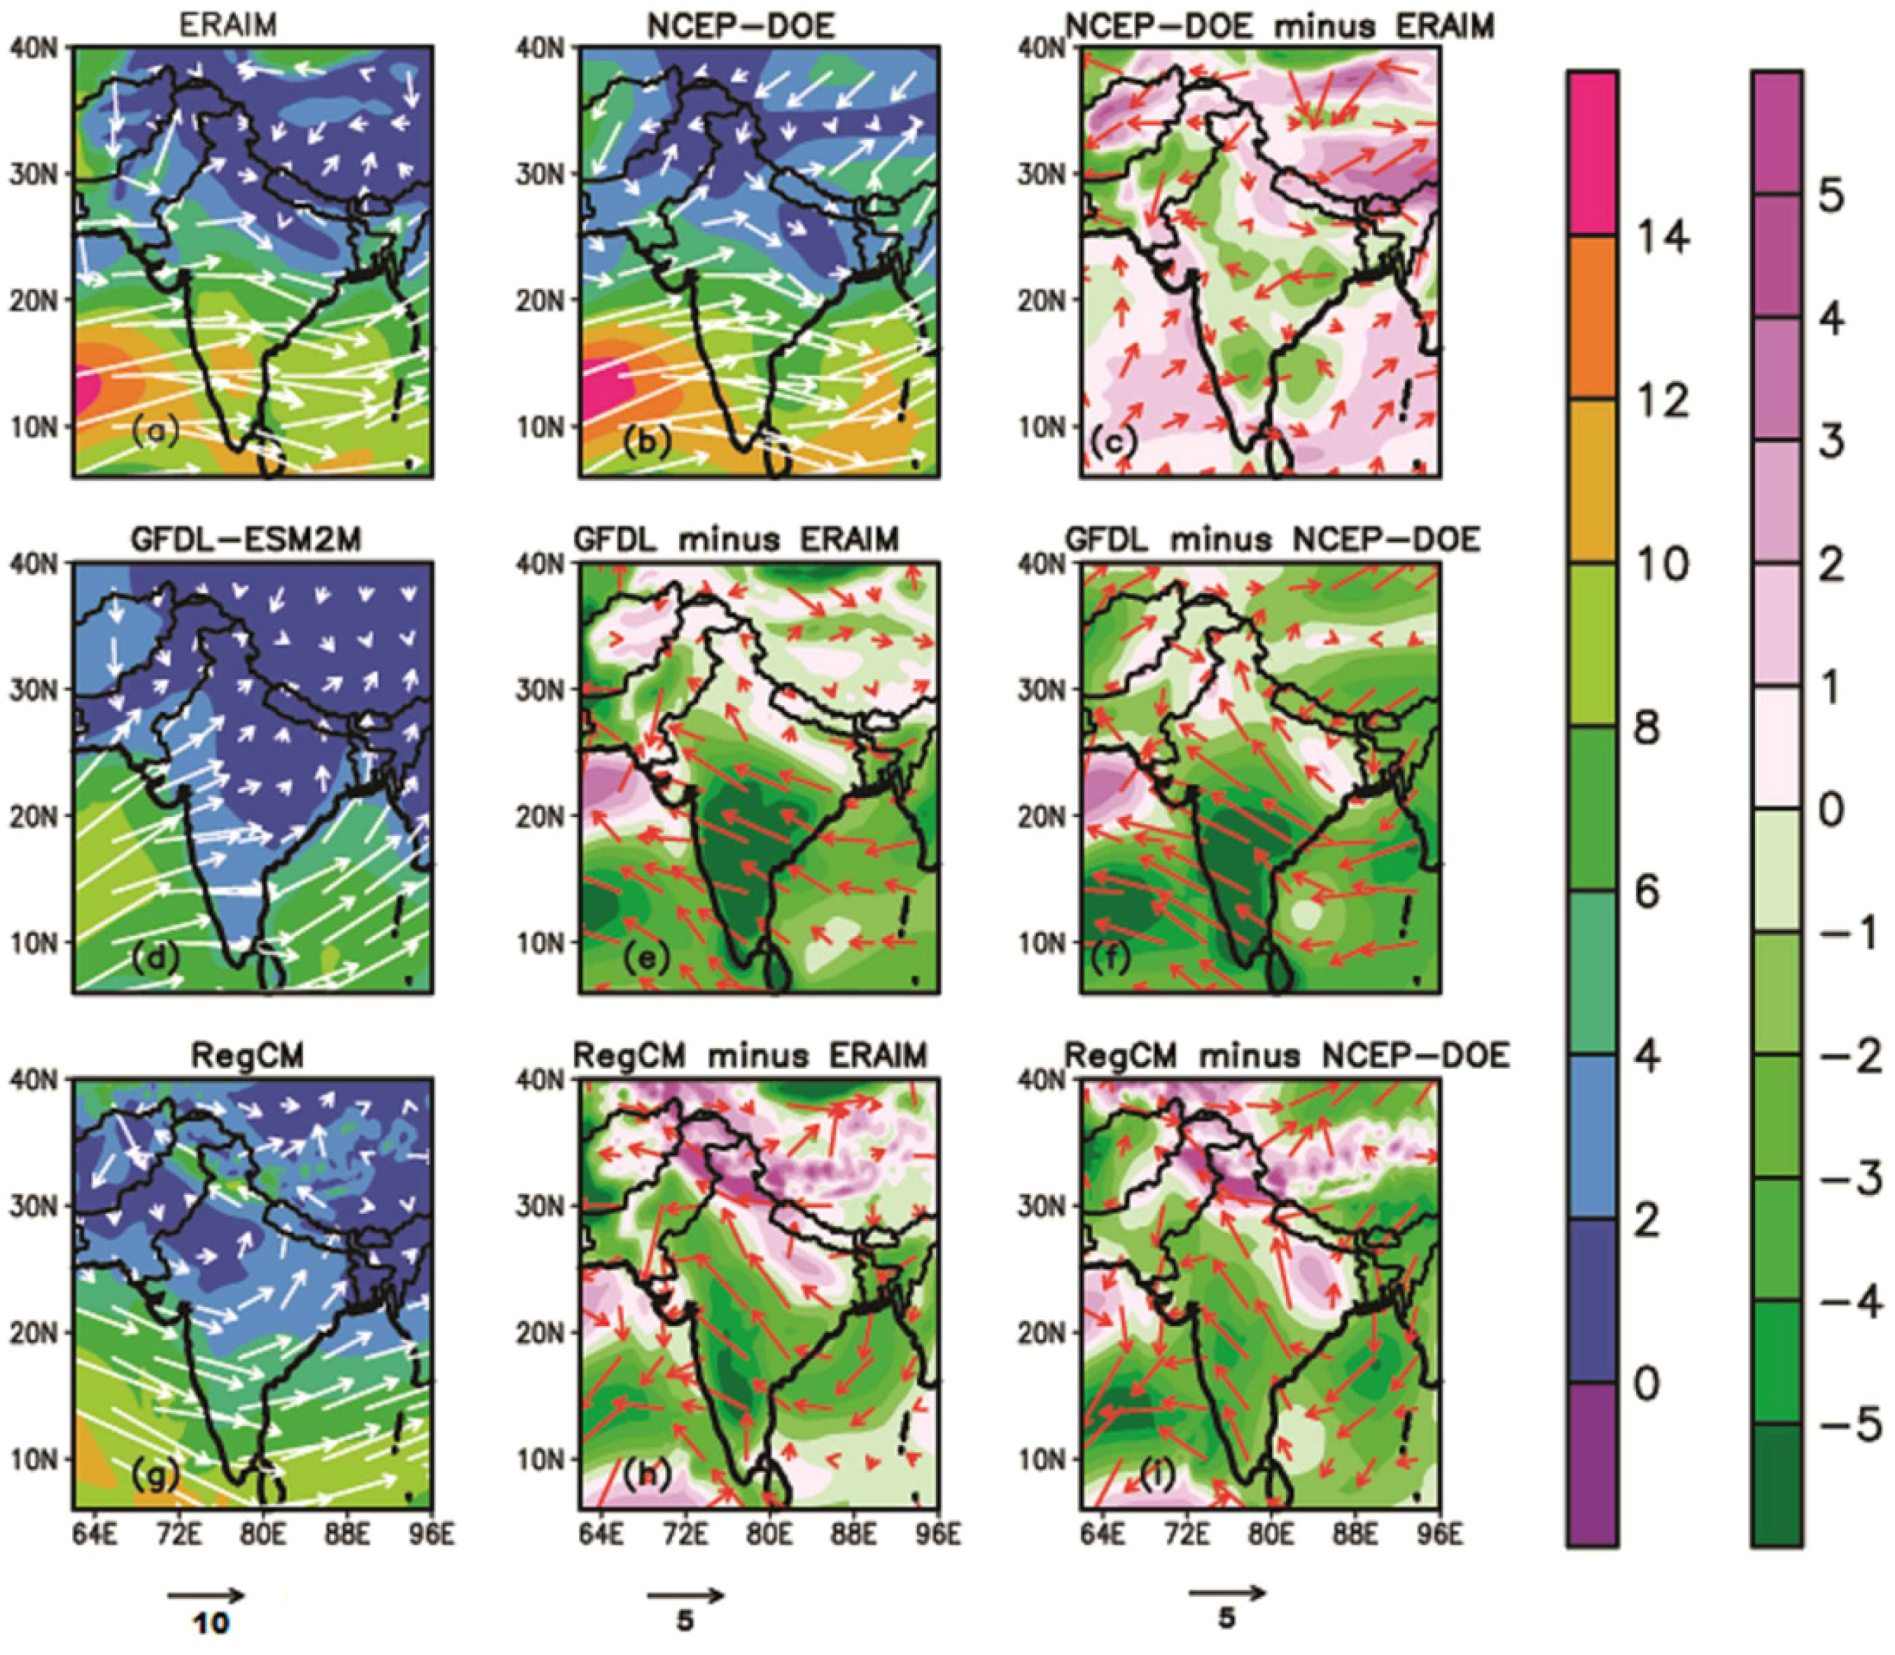
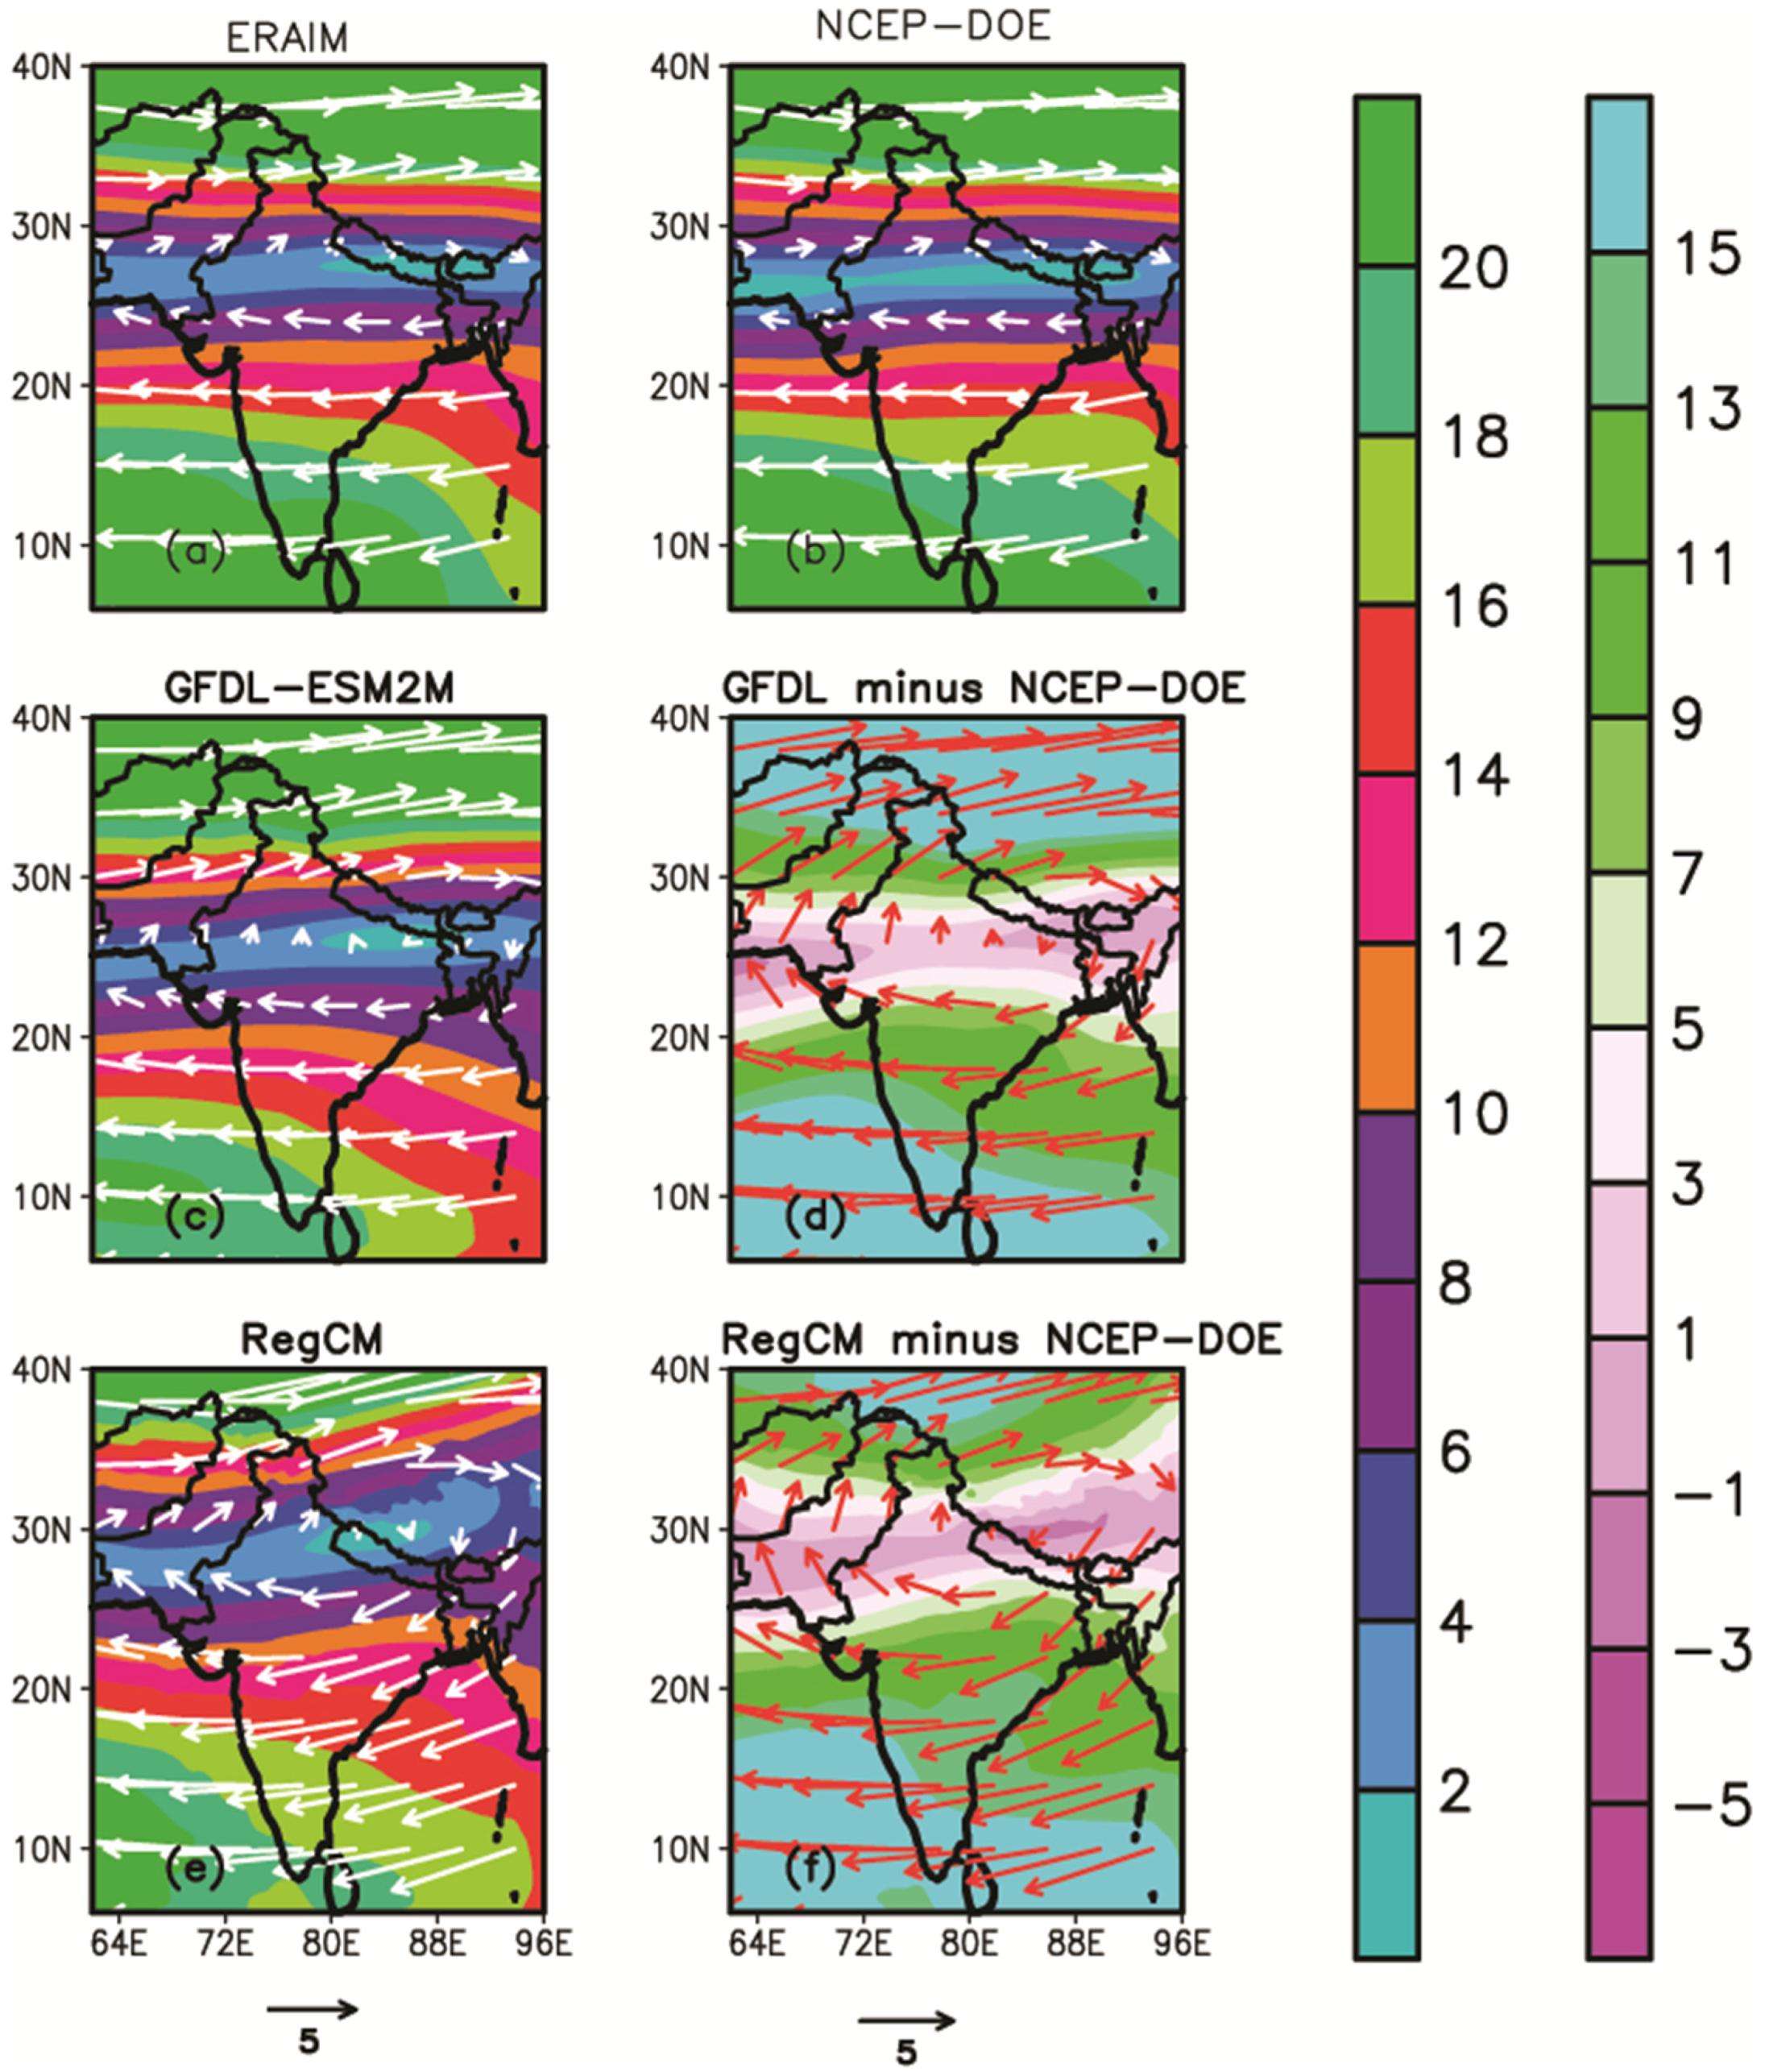
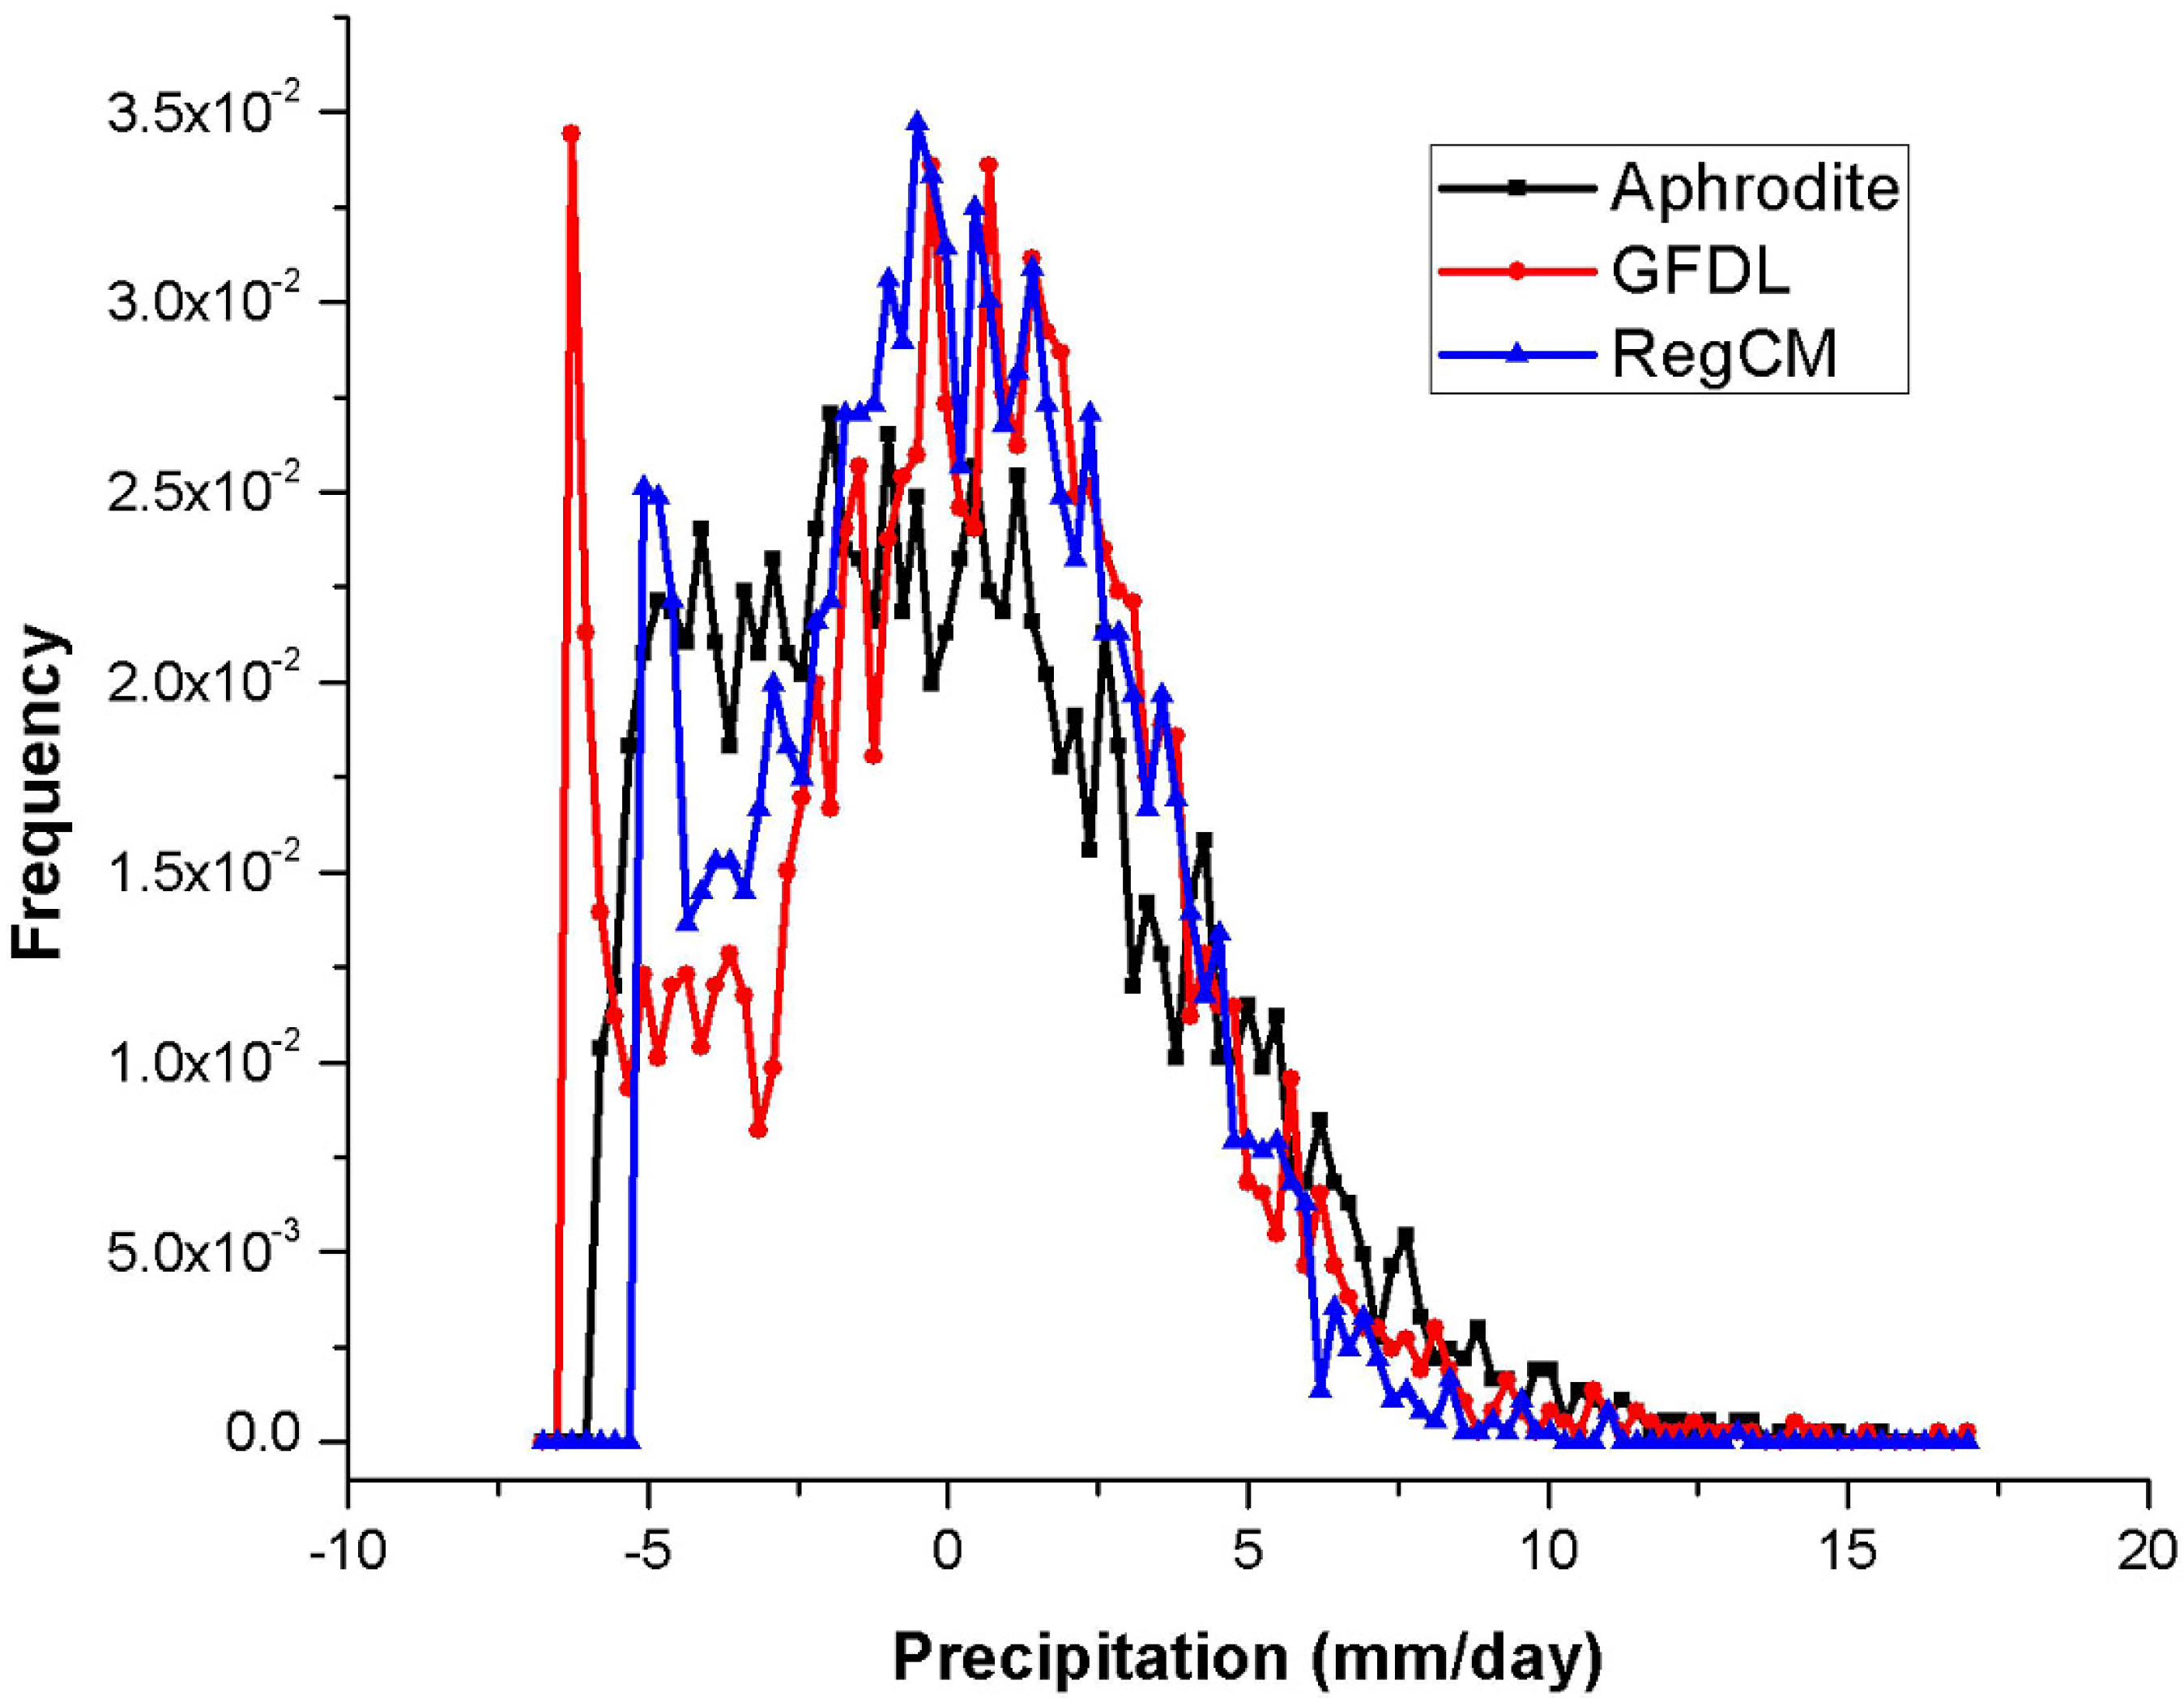
3.1. Evaluation of Model Performance for Reference Period

Before applying the RegCM for future projections, it is necessary to evaluate the model performance for the present climate. In this section, we describe the fundamental features of SASM like summer mean surface air temperature, precipitation and mean wind field. Figure 2a,b, shows the summer mean surface air temperature (1976–2005) from CRU and APHRODITE observations for SASM. Both of the datasets show a similar spatial pattern of temperature. The highest temperature up to 30 °C is recorded over central Pakistan as well as northwestern India, whereas the lowest temperature of about −15 °C is recorded over the Tibetan region. Figure 2c–f illustrates the mean summer biases in temperature for RegCM4 and driving GCM with respect to observations. The bias patterns in GCM and RCM present noticeable differences over most parts of the domain. Generally, GFDL-ESM2M shows a warmer climate, while RegCM4 shows cooler conditions especially over the foothills of HKH regions. The underestimation of summer mean surface air temperature (<5 °C) in RegCM over the Tibetan high region could be due to the large level of uncertainty present in observed climate data, mostly in the mountainous and remote areas [68,69,70,71].
The tendency of RegCM4 to produce lower temperatures over the northwestern Himalaya region is also reported in a few previous studies e.g., Syed et al. [6] and Coppola et al. [58]. The causes are still not entirely clear, though they are likely related to the treatment of cloud radiative process [72]. In this study, we used a CLM land surface scheme displaying some improvement in reducing the cold bias over this area as compared to BATS, used by Syed et al. [6]. The results from RegCM−BATS and RegCM−CLM comparison are shown in supplementary Figure S1.
Comparing with GFDL-ESM2M, RegCM4 has substantially reduced the warm biases from 8 °C to −2 °C over the northwestern parts of the domain (Figure 2e,f). The warm bias of GFDL-ESM2M over central Pakistan and northwestern India, as seen in Figure 2c,d, is diminished in RegCM4 (Figure 2e,f). Overall, RegCM4 is able to simulate the spatial pattern of summer mean surface air temperature which is closer to the observations. The spatial variability in the temperature bias as simulated by RegCM4 is, most of the time, smaller than that of GFDL-ESM2M. It is worth noting that the large-scale uncertainties are present between the station-based dataset and observed satellite dataset, especially over the high mountain areas, which should be considered in an evaluation of the climate model assessment [58].
Figure 2. Spatial distribution of summer mean surface air temperature (°C) for (a,b) CRU and APHRODITE observations; (c,d) GFDL-ESM2M and (e,f) RegCM4 model biases with respect to observations.
Atmosphere 06 01833 g002
The spatial distribution of SASM mean precipitation from CRU, APHRODITE and the models’ biases with respect to observations are displayed in Figure 3a–f. Spatial patterns of SASM precipitation are different in CRU and APHRODITE over some parts of the domain. CRU shows excessive precipitation as compared to APHRODITE over the MCR and northeastern India. Figure 3a,b depicts the weakening of monsoon currents as they enter through the foothills of the Himalayas. Pertaining to two models, GFDL-ESM2M shows wet bias over Nepal, whereas RegCM4 shows dry bias over the same region (Figure 3c–e). It is interesting to note that the dry biases over northeastern and central India are substantially reduced after comparing RegCM4 with APHRODITE (Figure 3e,f). RegCM4 reproduced the observed precipitation amount and spatial distribution reasonably well as compared to GFD-ESM2M L over the MCR and northwestern Himalaya region. The negative bias over northern India and Pakistan is up to 5 mm/day for GFDL-ESM2M. Nonetheless it is reduced to −3 mm/day in RegCM4 (Figure 3d,f). This indicates that RegCM4 at high resolution, which is more comparable to APHRODITE produced better spatial patterns of precipitation over the complex topography of the domain. Moreover, the precipitation amount in the GCM and RCM are strongly dependent to local dynamical forcing and internal model physics. The wet bias over the WG in RegCM4 shows that topographical induced precipitation pattern are strongly sensed in the regional climate model.
In order to analyze the results more quantitatively, we calculated Taylor diagram for SASM temperature and precipitation using the land point within the box (MCR) shown in Figure 1. The APHRODITE dataset is used as a reference to compare the spatial correlation and standard deviation in CRU, RegCM4 and driving GCM (Figure 4). The spatial correlation of temperature for RegCM4 is about 0.5 and less than 0.4 for that of GFDL−ESM2M with standard deviation above 1.5. Pertaining to precipitation, the spatial correlation for RegCM4 is more than 0.5, while in case GFDL−ESM2M it is less than 0.3. Generally the RegCM4 correlation for precipitation is more close to CRU and APHRODITE with less standard deviation (<0.75) as compare to GFDL−ESM2M. This consistency of RegCM4 with observation is of course due to fidelity of high resolution in capturing the present day monsoon climate.
Low Level Jet (LLJ) over the Arabian Seas (AS) is one of the most fundamental feature of SASM through which the moisture is transported into the flow of monsoon circulation [23]. In addition, the moisture transport over the AS is considered as the major source of SASM precipitation over Pakistan and adjoining regions [73]. This analysis will help us to understand the systematic biases and differences between the RegCM and parent GFDL-ESM2M precipitation. ERAIM and NCEP-DOE observation are used to compare the dynamical feature of LLJ with GCM and RCM. Figure 5 represents the mean low level wind fields at 850 hPa from the observations, the two models and respective wind biases.
LLJ over the AS across the Somali coast flows over the southern parts and enter into BB, where it hits the WG and generate precipitation [6]. The mean monsoon flow in both observations are almost same. However, over the northern part of the domain the circulation in NCEP-DOE is more cyclonic as compared to ERAIM (Figure 4a,b). RegCM4 and GFDL-ESM2M successfully represents the location of Somali jet over the BB. However, GFDL-ESM2M tends to underestimate the magnitude of wind field over most of the locations, particularly over the WG and AS (Figure 5e,f). Over the same regions, the circulation is more cyclonic (anomalous) in RegCM4 than that of GFDL-ESM2M, which could be a possible cause of excessive precipitation over the WG (Figure 3f and Figure 5h,i).
On the other hand, RegCM4 tends to overestimate the winds fields (3 m/s) over the HKH as compared to both observations. Saeed et al. [34] also found similar result and suggested that the biases could be due to the absence of an irrigation scheme in the regional climate model. During the SASM, the upper level tropospheric winds (200 hPa) are primarily characterized by the Tibetan anticyclone and Tropical Easterly Jet (TEJ) [74]. Figure 5 exhibits the SASM mean wind fields from the observations, two models and the models bias from NCEP-DOE. The mean wind fields at 200 hPa as represented in ERAIM and NCEP-DOE are nearly same. Therefore, for the sake of brevity, we consider here only the difference between the NCEP-DOE and the two models. Figure 6a,b, reveals that both observations are in well agreement in representation of Tibetan anticyclone, TEJ and subtropical westerly jet. GFDL-ESM2M and RegCM4 has captured the main features of upper tropospheric wind fields reasonably well. However, the TEJ and Tibetan anticyclone are slightly broader in RegCM4 (Figure 6c,e). The position of northward movement of jet stream extended up to 25°N and induces the anticyclone over the Tibetan plateau is realistically represented in RegCM4. Relative to observations, the TEJ is rather weaker in GFDL-ESM2M and its northward extension is confined up to 22°N (Figure 6a–c,e). The strong systematic biases are also observed in both models, in particular over the Indian land mass areas. GFDL-ESM2M and RegCM4 tends to overestimate the magnitude of wind fields of TEJ over the MCR and adjoining land areas, while they tends to underestimate it over the northwestern parts of the domain. Over the HKH, region the magnitude of positive wind bias in RegCM4 and GFDL-ESM2M is about 9 m/s and 15 m/s respectively (Figure 6d,f).
Figure 3. Spatial distribution of SASM mean precipitation (mm/day) for (a,b) CRU and APHRODITE observations, (c,d) GFDL−ESM2M and (e,f) RegCM4 model biases with respect to observations.
Atmosphere 06 01833 g003
Although we have discussed some improvements in wind circulation at 850 hPa, RegCM4 follows the mean climatology of GFDL−ESM2M at 200 hPa. In order to check the fidelity of the model at 200 hPa wind speed, a statistical significant test is performed at 200 hPa wind speed over the whole domain. Correlation coefficients are calculated for ERAIM, NCEP, GFDL−ESM2M and RegCM4 at 99% and 95% confidence levels, as given in Table 1.
The results indicate that the correlation between RegCM4 and ERAIM is significant at 99% confidence level, while the correlation between GFDL−ESM2M and ERAIM is not significant at this level. It is interesting to note that the resolution of ERAIM (0.75 degree) is more comparable to RegCM4 (0.25 degrees) than that of GFDL−ESM2M (2 degrees). On the other hand, correlations between RegCM4 and ERAIM and RegCM4 and NCEP−DOE are significant at 95% confidence level but not between GFDL−ESM and NCEP−DOE (Table 1). These results reveal the fidelity of RegCM4 for 200 hPa wind field as compared to the core GFDL−ESM2M.
Figure 4. Temperature (°C) and precipitation (mm/day) Taylor diagram for JJAS season over the MCR, compute for land point only for the reference period 1976–2005. The APHRODITE dataset is considered as REF point.
Atmosphere 06 01833 g004
Figure 5. Spatial distribution of SASM mean low level wind (850 hpa) speed (shading, m/s) and direction (arrows) for (a,b) ERA Interim and NCEP observations; (c) biases in observation; (df) GFDL−ESM2M and its biases with respect to observations; (gi) RegCM4 and its biases with respect to observations.
Atmosphere 06 01833 g005
In spite of improvements, the systematic biases are still present in the RegCM4 simulation. This indicates that in order to identify the added value of the regional climate model, higher order statistics need to be analyzed [58,75,76]. In order to assess the added, here we present an example of added value by analyzing the probability distribution function (PDF) of the seasonal summer precipitation anomalies. The PDF is calculated by using the original model grid at each point over the land areas as shown in Figure 1. We used APHRODITE-observed gridded precipitation dataset, which contain a high density and quality station network of daily rain-gauge data for Asia including the Himalayas [61]. Figure 7 depicts that for negative rainfall anomalies, the RegCM4 reproduces better distribution and follows APHRODITE more closely compared to driving GCM, whereas in the case of positive rain anomalies both models show no differences. The marginal improvement in RegCM4 over the core GCM in negative rain anomalies reveals the fidelity of RegCM4 high resolution.
Figure 6. Spatial distribution of SASM mean upper level wind (200 hpa) speed (shading, m/s) and direction (arrows) for (a,b) ERA Interim and NCEP observations; (c,d) GFDL−ESM2M and its bias with respect to observation; (e,f) RegCM4 and its bias with respect to observation.
Atmosphere 06 01833 g006
Table 1. Matrix of Correlation coefficients between ERAIM, NCEP−DOE, GFDL and RegCM4 datasets of wind speed at 200 hPa, at confidence level of 95% and 99%.
--ERAIMNCEP−DOEGFDLRegCM4
ERAIM1.000.920.450.52
NCEP−DOE0.921.000.320.40
GFDL0.450.321.000.95
RegCM40.520.400.951.00
Bold figures are at α = 5%; Bold and underline figures are at α = 1%.
Figure 7. Probability density function of the JJAS precipitation anomaly for land points of the domain (Figure 1).
Atmosphere 06 01833 g007

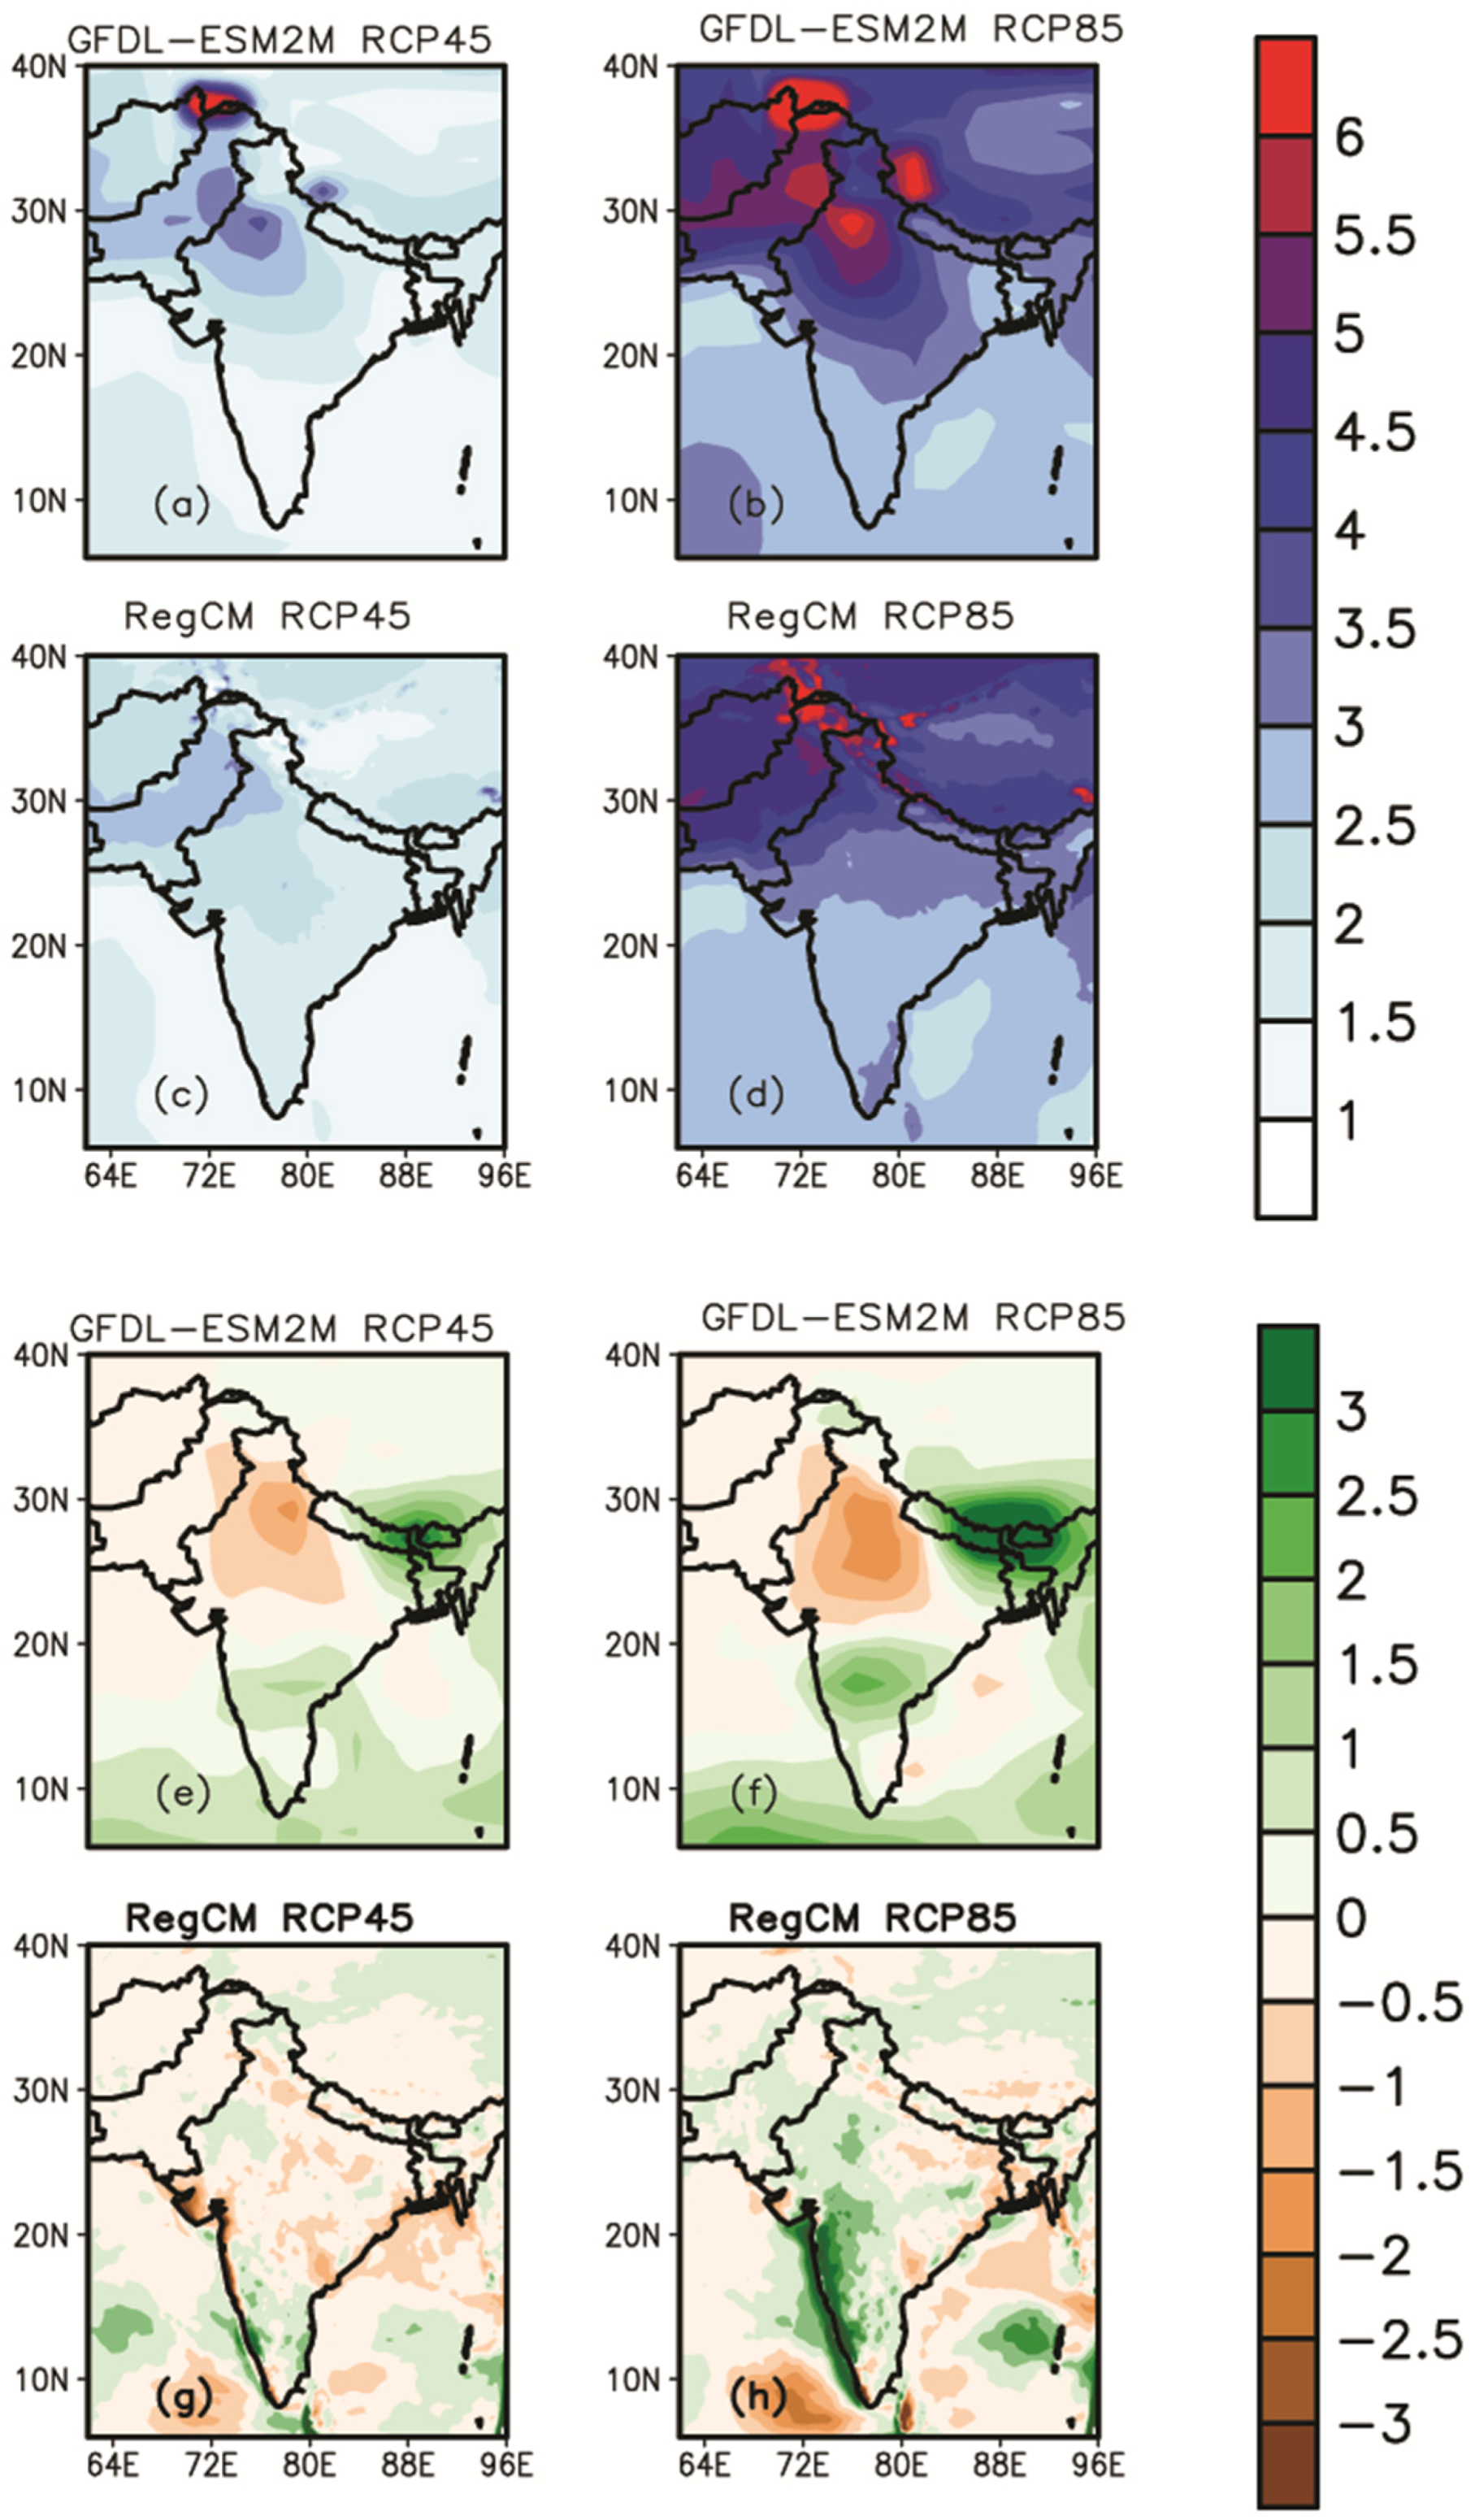
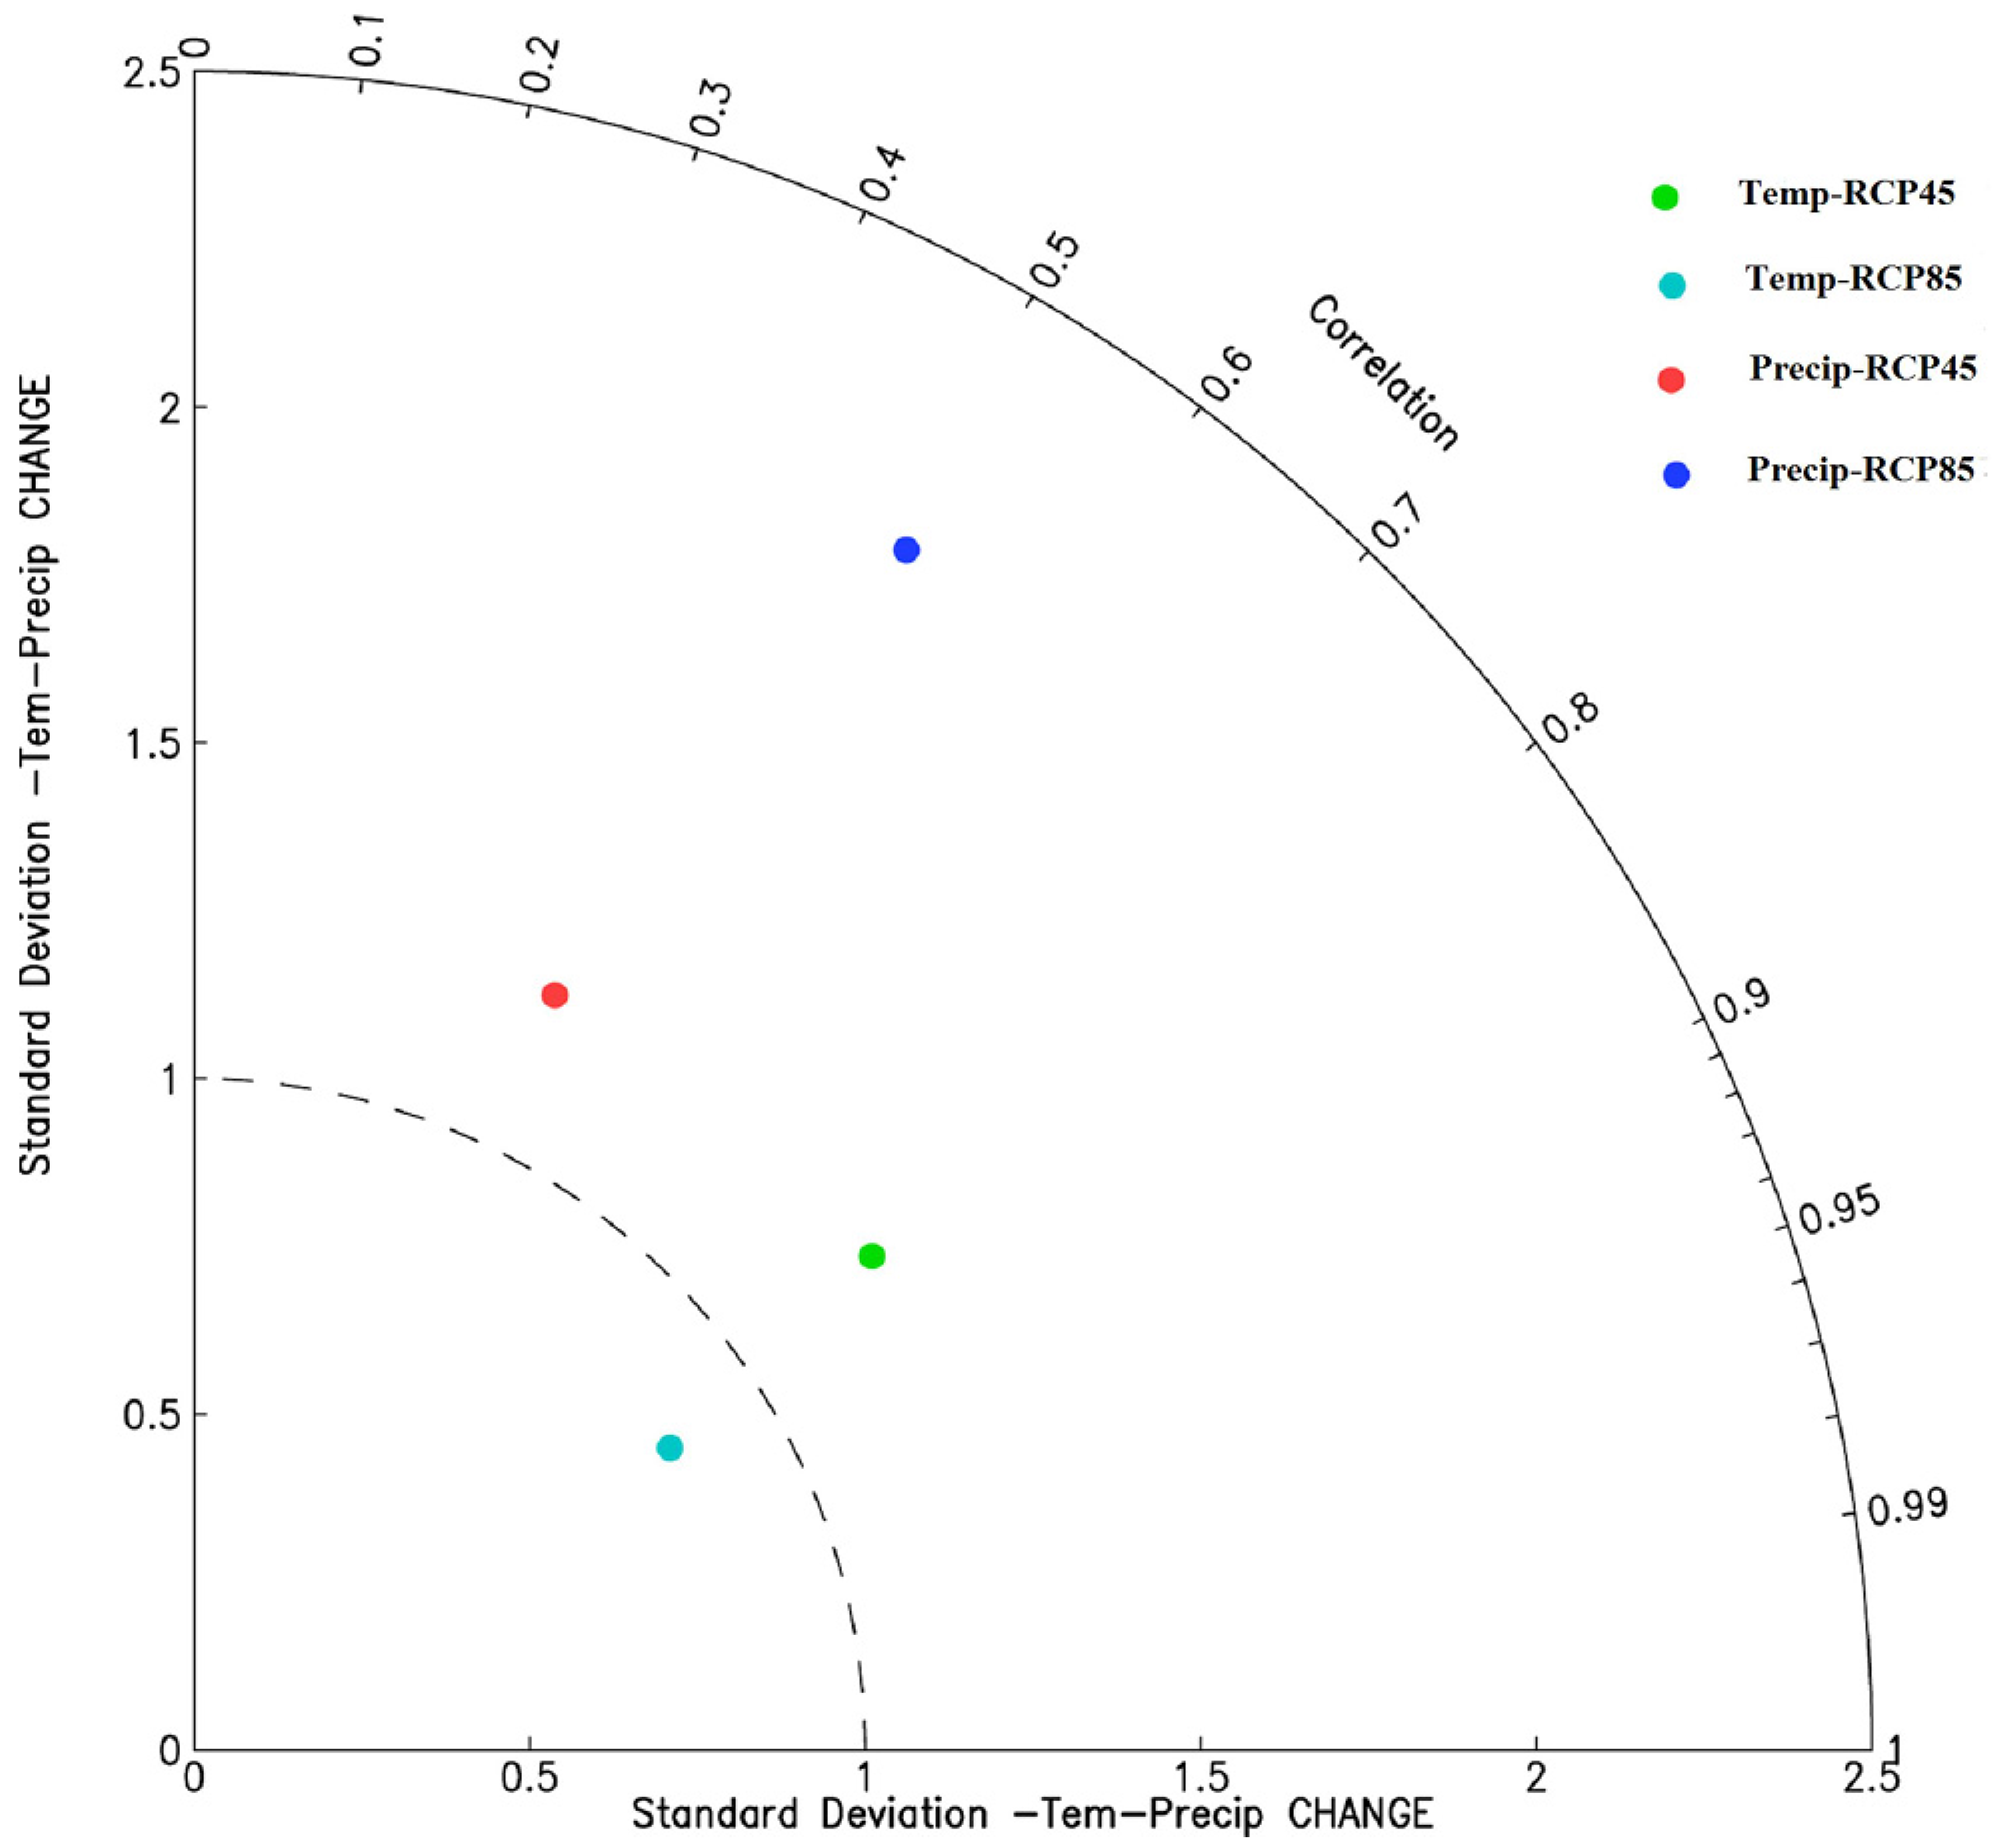
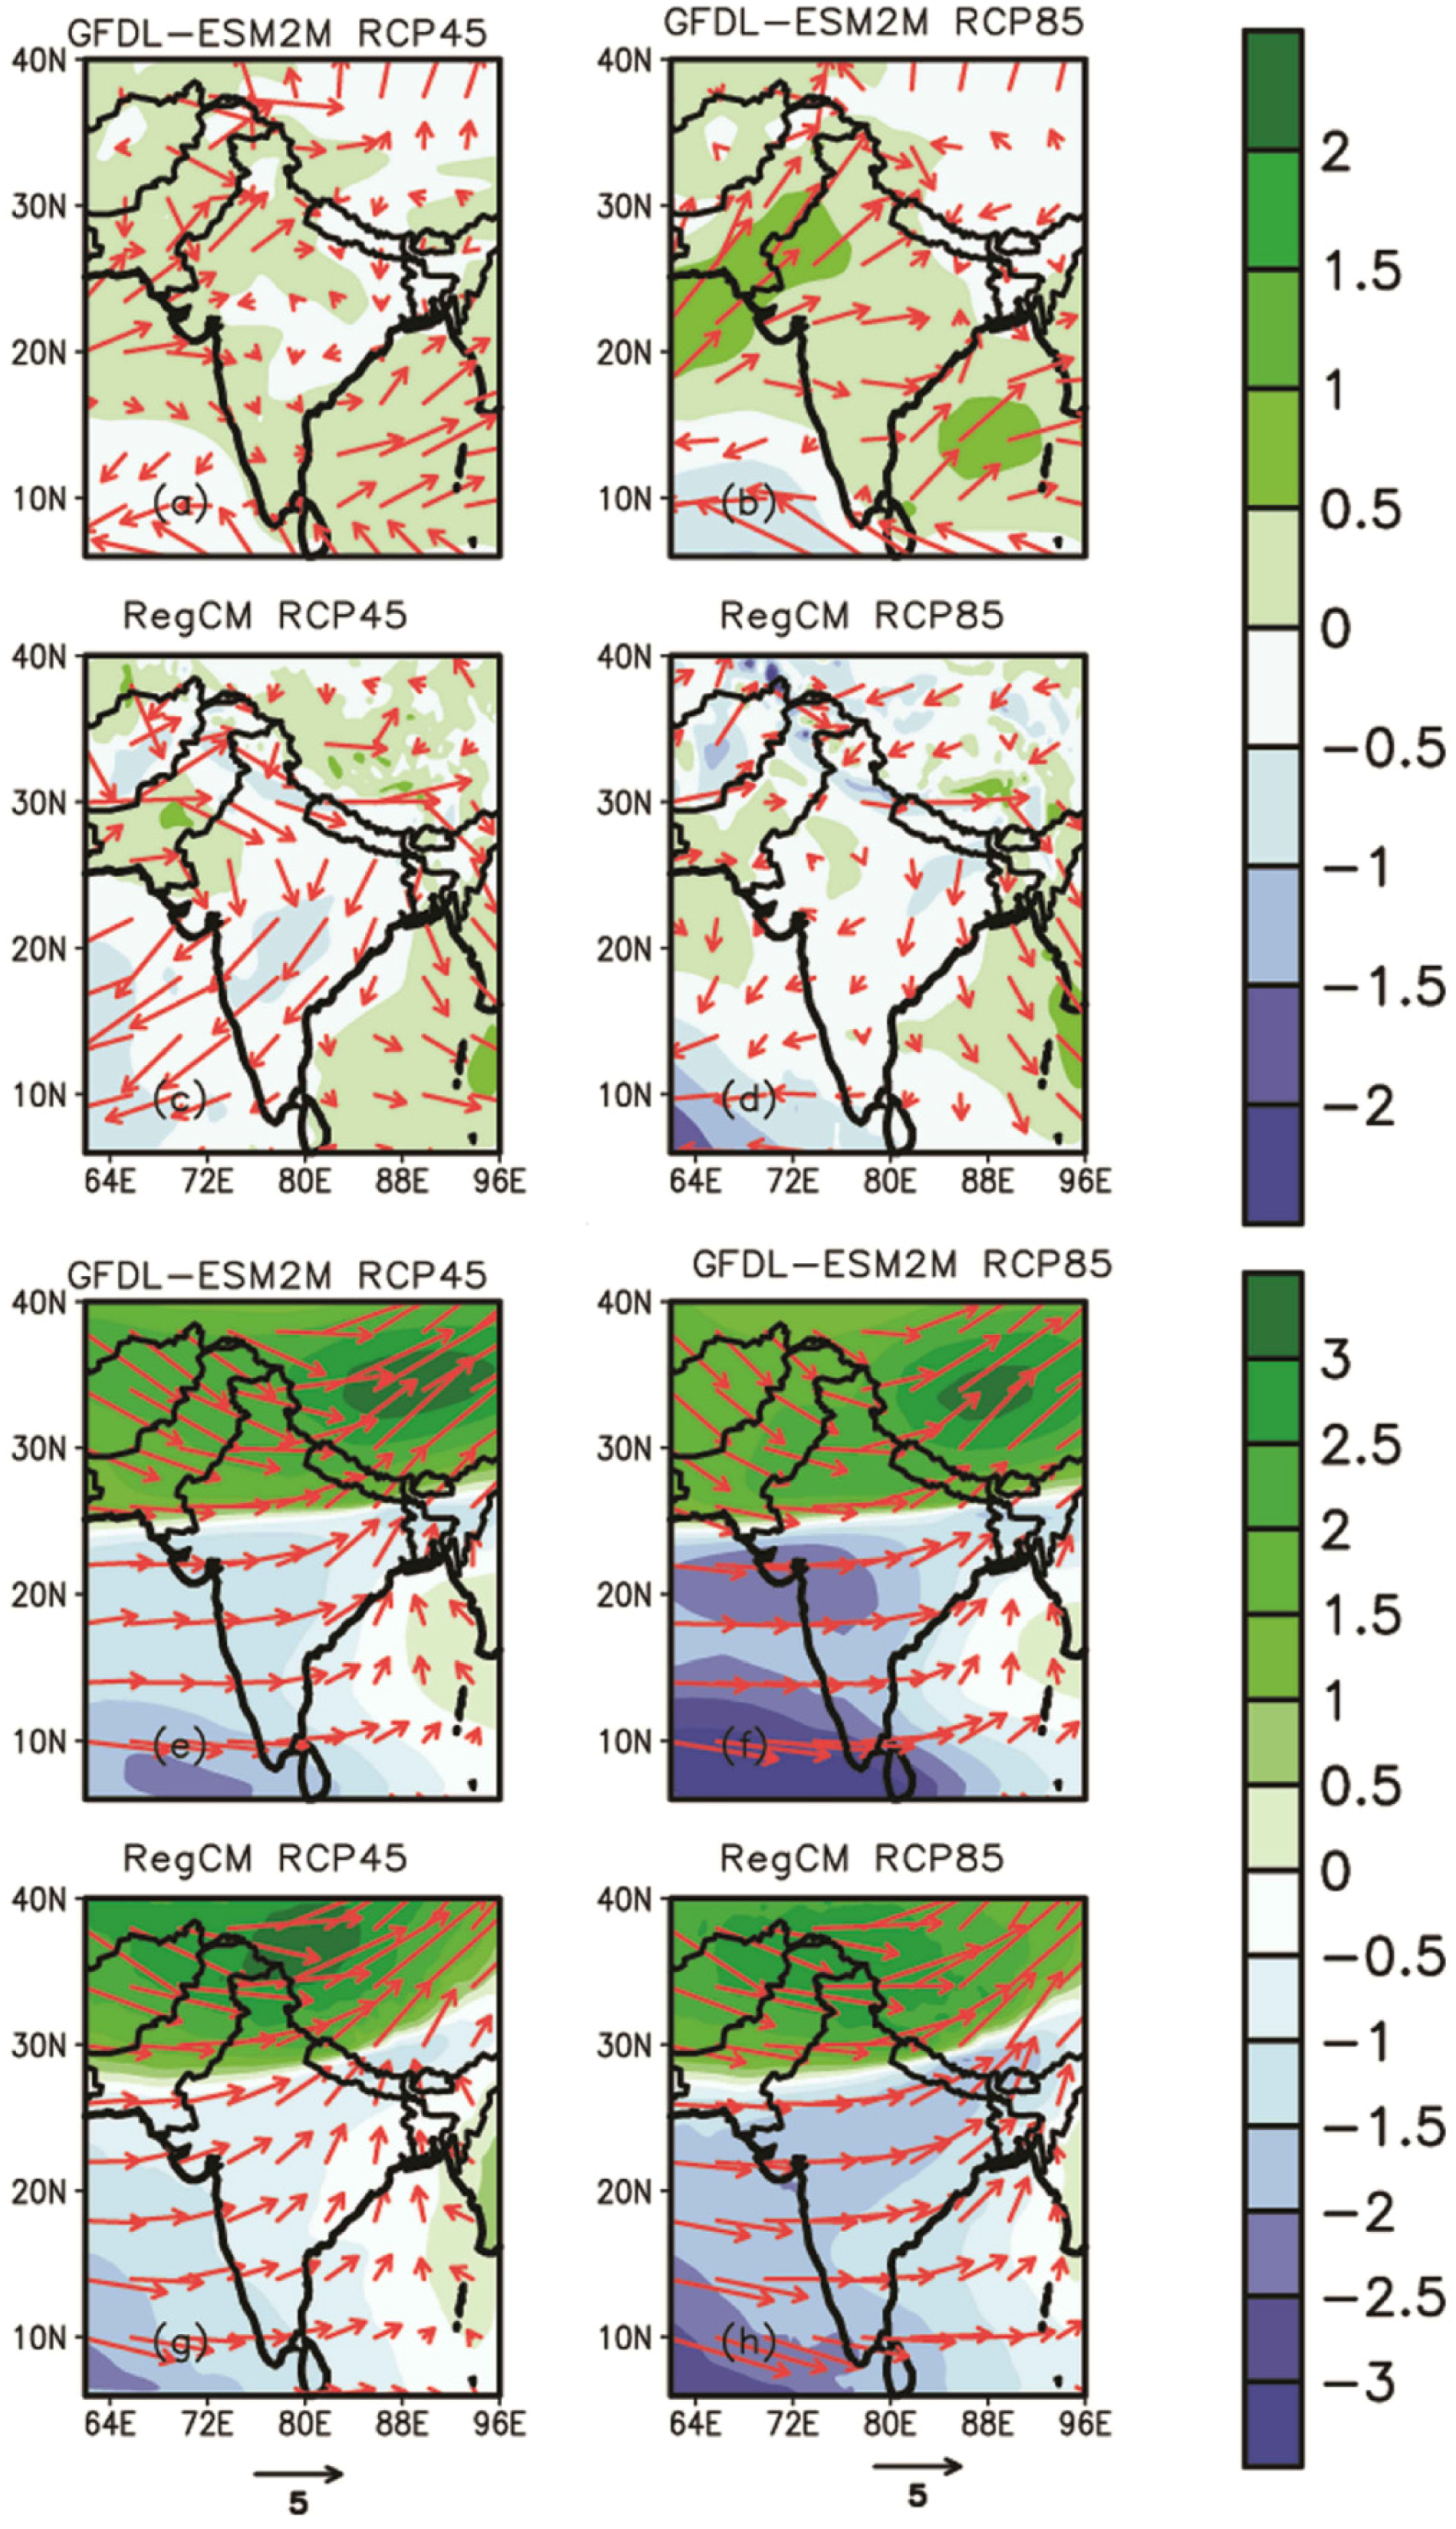
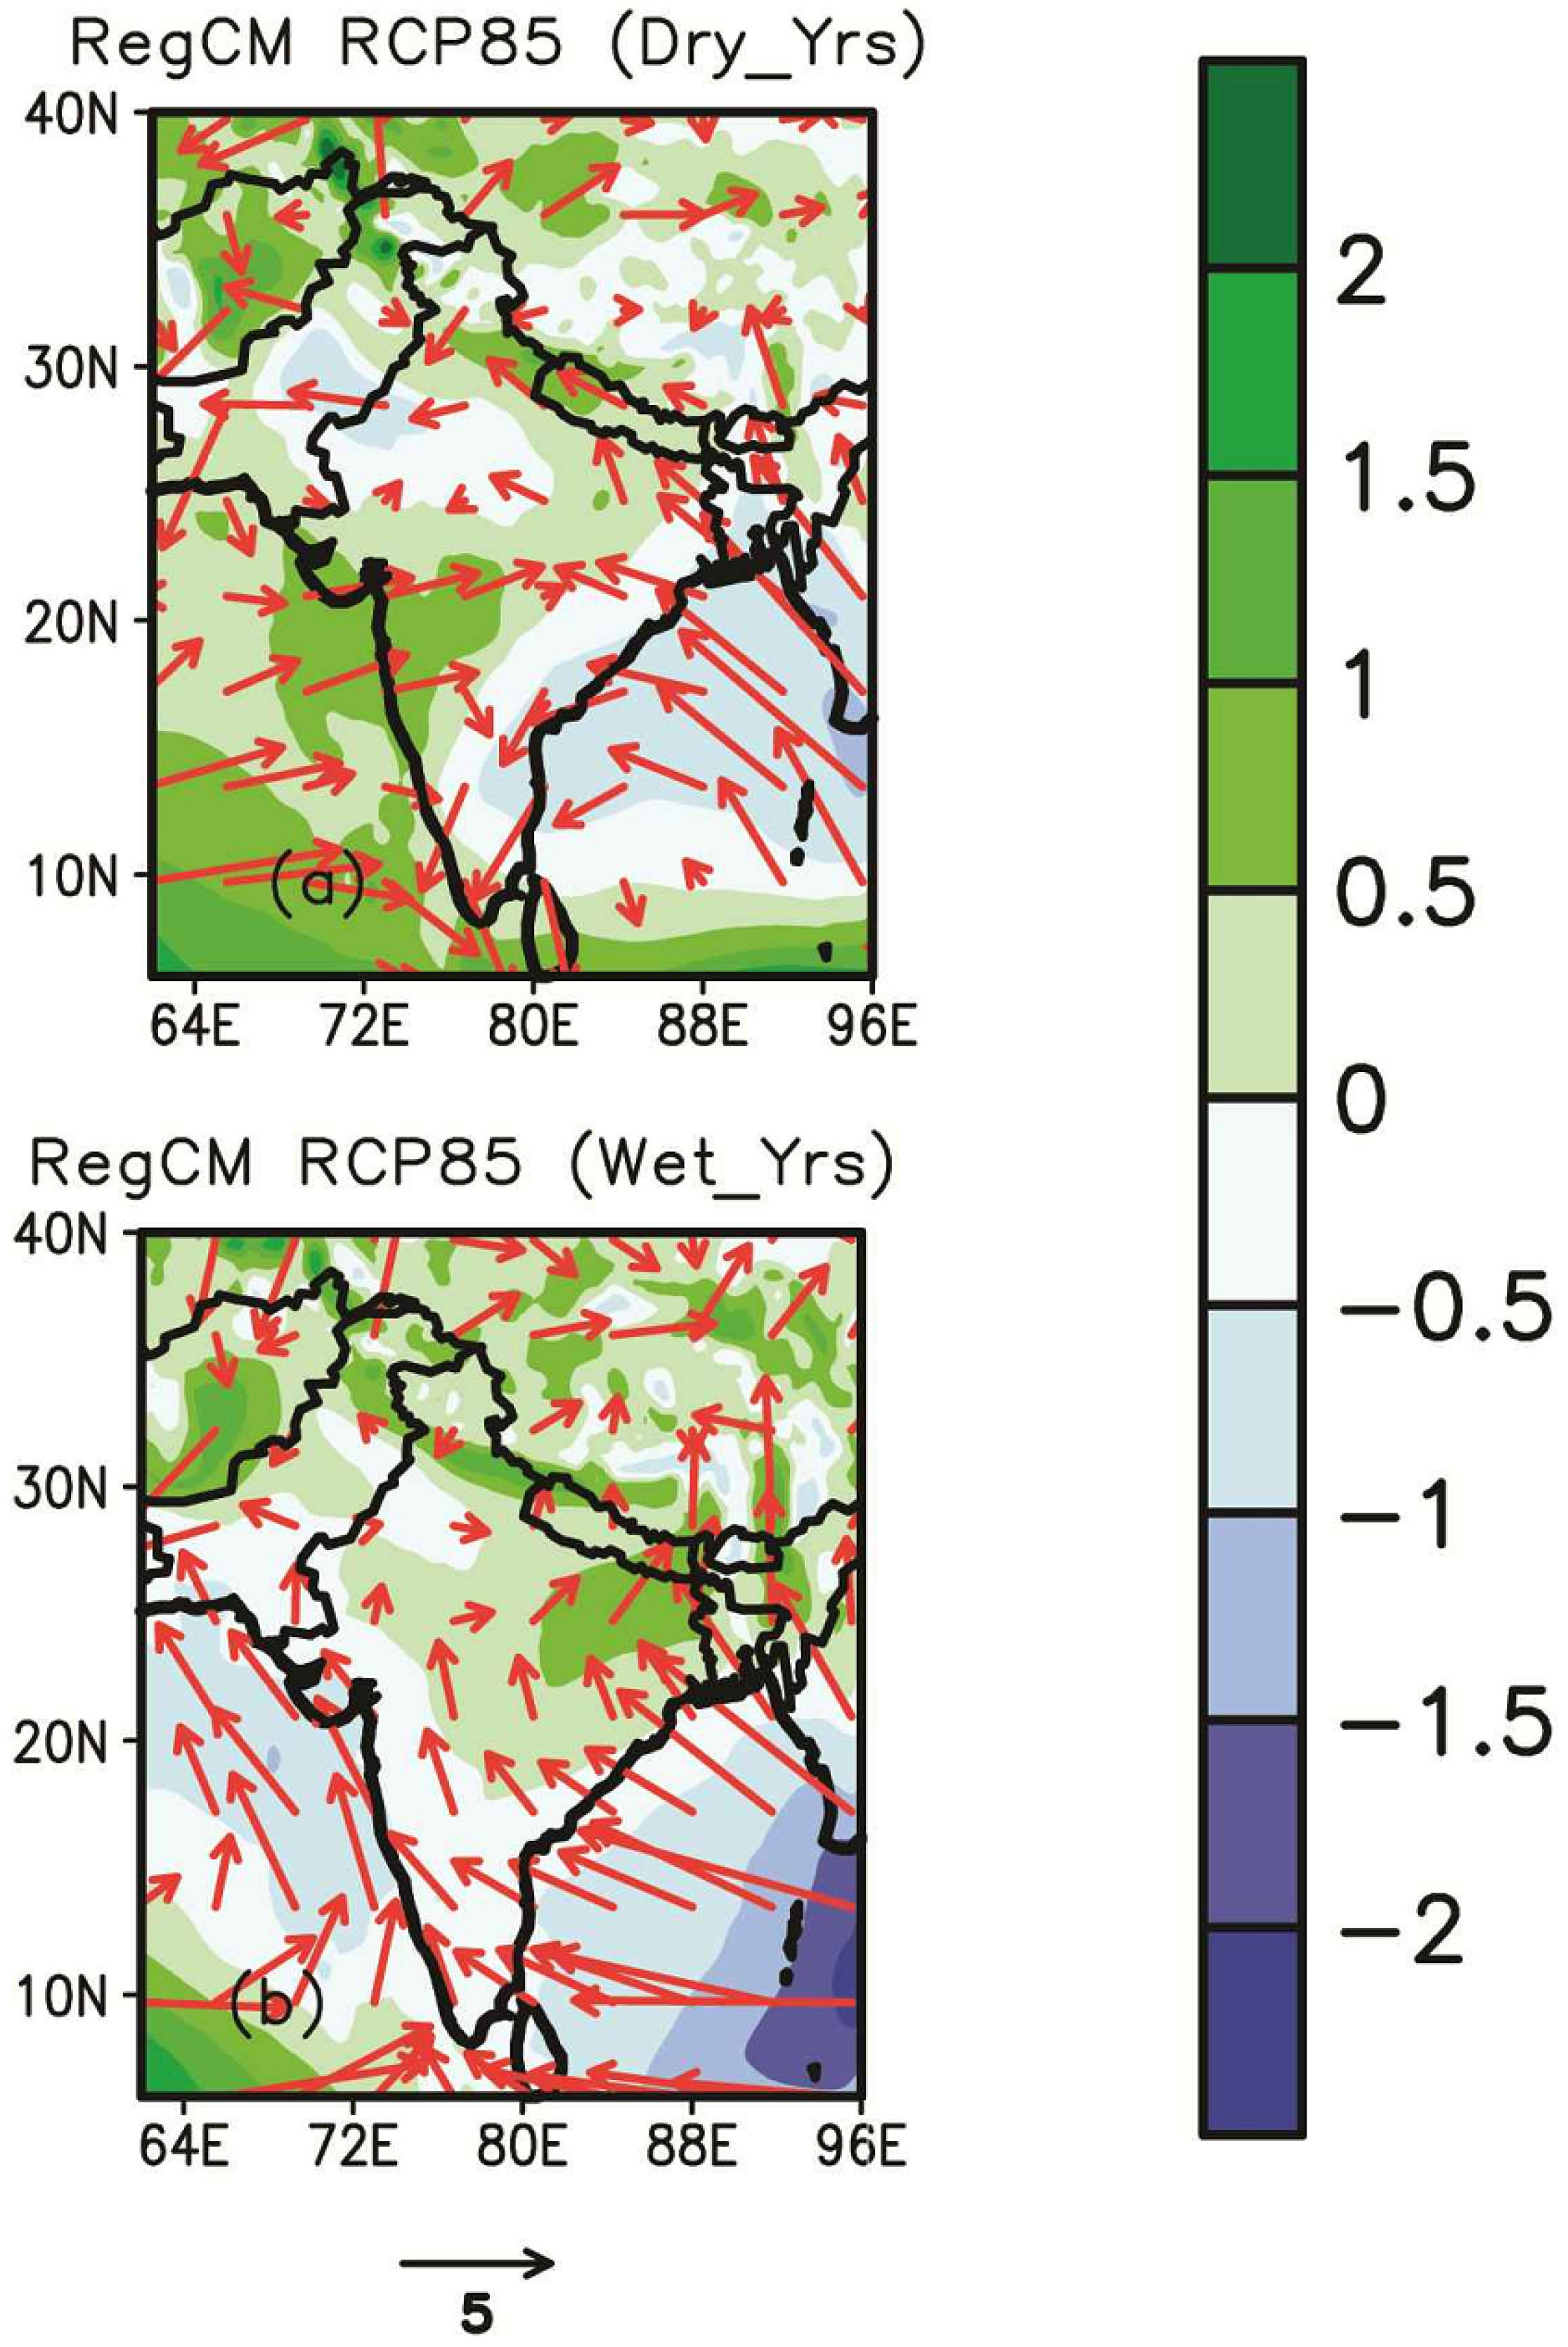
3.2. Assessment of Climate Change Signal for SASM

Figure 8 shows the projected changes of temperature and precipitation in the future (2070–2099) with respect to the reference period (1976–2005) for both scenarios. Under RCP4.5, both models predict warming over the whole domain by the end of the 21st century (Figure 8a,c). The projected changes of temperature are much higher under RCP8.5 than RCP4.5 (Figure 9b,d). The maximum warming (>6 °C) is recorded in GFDL-ESM2M over the Tibetan Plateau and foothills of the HKH under RCP8.5 (Figure 9b), which is in line with the findings of Gu et al. [71]. The magnitude of increased warming in RegCM4 under RCP8.5 is less than the GFDL-ESM2M.
These warming trends are predominantly observed over northern Indian and Pakistan under both scenarios. Kazmi et al. [77] and Kumar et al. [78] also found a similar increased tendency in the summer mean surface air temperature over the northern areas of Pakistan, the Himalayas and central India at the end of 21st century. Kumar et al. [78] concluded that the warming of southern India is projected to be lower than the north. These findings are in line with the predicted increase of warming over the land areas (>3 °C), which could develop a thermal contrast between the ocean and land. Over the MCR, the maximum increase in temperature is found to be 4 °C in GFDL-ESM2M under RCP8.5 and the minimum temperature increase is about 2 °C in RegCM4 under RCP4.5 (Figure 8b,c). Overall, RegCM4 shows a lower climate sensitivity with less warming as compared to the driving GFDL-ESM2M.
Figure 8e–h exhibits the projected changes in the spatial pattern of precipitation under moderate RCP4.5 and strongest RCP8.5 scenarios with respect to present climate as simulated by the two models. More than 3 mm/day increased precipitation is predicted over Nepal and Bhutan in GFDL-ESM2M under RCP8.5. However, the intensity of increased precipitation over the same region in the case of RCP4.5 is slightly less than in the RCP8.5 scenario (Figure 8e,h). In contrast, over most of parts of northwestern India, the SASM precipitation either decreases up to 2 mm/day or remains the same. Maximum increase in summer precipitation as predicted over MCR (up to 2 mm/day) lies between 15°N and 20°N. This projected increase in precipitation in GFDL-ESM2M is comparatively less under RCP4.5 than RCP8.5.
The change in precipitation in RegCM4 under RCP4.5 is not very prominent except over the WG and AS (Figure 8g). The projected increase of precipitation lies between 0.5 mm/day and 1.5 mm/day over this region. Most of the land areas are drier in RegCM4 under RCP4.5 as compared to GFDL-ESM2M. Although the northern parts of the domain receive a little amount of precipitation (~1 mm/day), in the case of RegCM4 under RCP8.5, these changes are more pronounced than that of driving GCM. Over the BB, RegCM4 presents mixed performance in simulating the SASM precipitation under the RCP8.5 scenario. There is a slight decrease (1 mm/day) and considerable increase (2 mm/day) in the precipitation over the BB which supports the conclusions of Islam et al. [30] and Syed et al. [6]. Figure 9h, also depicts the overall wet conditions of SASM projection over the MCR as simulated by the regional climate model. The increased precipitation patterns are extended up to northwestern India, the UIB and central Pakistan. However the magnitude and intensity of monsoon becomes weaker as it penetrates into Pakistan. The mountain ranges of WG along the western coast of the Indian Peninsula, which exposed to monsoon winds in June and July, receives a large amount of precipitation at the end of the 21st century as simulated by the RegCM4. These predicted changes in SASM precipitation are more than 2 mm/day under RCP8.5 and less than 1 mm/day under RCP4.5. Such local topographical forcing effects are not observed in the driving GCM projections. In general, the parent GFDL-ESM2M predicts stronger climate change signals for increasing (decreasing) precipitation as compared to the nested RegCM4.
Figure 8 depicts that the core GFDL-ESM2M is significantly affecting the RegCM4 in terms of temperature, while a different picture is observed for precipitation. To further confirm the robustness of the analysis, we devised a variant Taylor diagram to compute the change patterns in temperature and precipitation of the period 2070–2099 with respect to the reference 1976–2005 for RegCM4 simulation compared to its own driving GCM change (Figure 9). For temperature, we find a better agreement between the RegCM and GFDL-ESM2M with correlation approaches to 0.8 and normalized standard deviation in the range of 0.5 to 1.5 under the both scenarios. This means that in term of spatial variability and spatial pattern, the GFDL affects substantially the temperature change of RegCM4. With precipitation, the spatial pattern of correlation is less than 0.6 and the spatial standard deviation is about 2. The former analysis clearly depicts the importance of fine-scale forcing and the processes induced by the high resolution of the regional climate model.
Figure 8. Projected changes (2070–2099 minus 1976–2005) in SASM mean temperature for (a,b) GFDL−ESM2M (RCP45 and 85); (c,d) RegCM4 (RCP4.5 and 8.5) and precipitation for (e,f) GFDL−ESM2M (RCP4.5 and RCP8.5); and (g,h) RegCM (RCP4.5 and RCP8.5).
Atmosphere 06 01833 g008
The projected changes in the SASM wind field at 850 hPa and 200 hPa are shown in Figure 10a–h. The anticyclonic anomaly (Figure 10a–c) could possibly project drier conditions over central and northwestern India (Figure 8e–g). RegCM4 under RCP85 also show anticyclonic circulation (though much weaker compared to RCP45), which will bring the drier air from the interior of the continent. On the other hand, the RegCM4 under RCP85 data show significantly increased precipitation over the WG (Figure 8h). In order to explore the dynamical consistency of increased projected rainfall over the WG in RegCM4 under RCP85, we separated the whole study period into dry and wet years [22].
Figure 9. Taylor diagram computed for the change in temperature and precipitation of the period 2070−2099 with respect to 1976−2005 for RegCM4 simulation compared to its own driving GFDL-ESM2M.
Atmosphere 06 01833 g009
Figure 11 indicates the strengthening of southwesterly seasonal flow (anomalous cyclonic circulation) at 850 hPa over the Arabian Sea and Peninsular India for the wet period, missing during the dry years. This change could be associated with increased rainfall over the WG and supports the conclusion of Kunar et al. [78]. In order to further explore the dynamical inconsistency of increased rainfall over this region, the spatial correlation between the model bias and change is calculated. The significant correlation between RegCM4 bias and change (0.6 to 0.8) confirm that the bias has a significant effect on the simulated change. How much these effects could possibly lower the future projection is beyond the scope of the present study. The dynamic of South Asia monsoon season is quite complex and there are several other factors that could affect future climate changes. Therefore, it is very difficult to specify a single reason that may strengthen the South Asia monsoon over the specific areas.
The RegCM4 follows the driving model boundary forcing in simulating the upper tropospheric circulation features for both of the future scenarios. There is little difference between the magnitude of upper level circulation in GFDL-ESM2M and RCM over northern Pakistan, but the differences are significant over MCR, Nepal and AS under RCP8.5. It is clear from Figure 10e,f that the large-scale changes in the magnitude of the wind field (3 mm/s) over Nepal and Bangladesh add up to possible evidence of excessive precipitation in GFDL-ESM2M. On the other hand, we can see the prominent changes over AS, WG and MCR, where the wind field is underestimated up to 3 m/s in GFDL-ESM2M and 2 m/s in RegCM4 under RCP8.5. These projected changes in the wind fields could be a possible reason behind high variability of precipitation in nested and driving models over the MCR and AS.
Figure 10. Projected changes (2070–2099 minus 1976–2005) in SASM mean wind speed (shading, m/s) and direction (arrows) at 850 hpa for (a,b) GFDL−ESM2M (RCP45 and 85); (c,d) RegCM4 (RCP4.5 and 8.5) and at 200 hpa for (e,f) GFDL−ESM2M (RCP4.5 and RCP8.5); and (g,h) RegCM4 (RCP4.5 and RCP8.5).
Atmosphere 06 01833 g010
Figure 11. Projected changes (2070–2099 minus 1976–2005) in SASM mean wind speed (shading, m/s) and direction (arrows) at 850 hPa for (a) RegCM4 RCP85 (dry period)); (b) RegCM4 RCP85 (wet period).
Atmosphere 06 01833 g011
A statistical significance test is performed to assess the models’ bias effects on the simulated change. Significant correlation between the bias and change patterns is expected, if the model bias had a strong effect on the simulated change. Figure 12 and Figure 13 show the scattered plot with 95% confidence level for both temperature and precipitation. The correlations for temperature are generally high (0.8), whilst in the case of precipitation, the correlation varies from 0.6 to 0.8. These results indicate that the biases have a significant effect on the projected change patterns. These results are consistent with Boberg and Christensen [79] and support their conclusion of a significant influence of the bias on the change.
It should be noted that in spite of numerous improvements made in the regional and global climate models, it is still difficult to explain the complex mechanisms driving the variability of the Asian monsoon [80]. Moreover, the regional forcing, internal dynamic of the models and high level of uncertainties in the observational-based climate dataset could undermine the confidence on the future projection as well as the mitigation and adaptation strategies under a changing climate.
Figure 12. Effect of temperature bias on the projected changes in SASM for GFDL−ESM2M (a,b) RegCM4 (c,d) under both scenarios. Ellipses indicate that the biases are significant at 95% confidence level.
Atmosphere 06 01833 g012
Figure 13. Effect of precipitation bias on the projected changes in SASM for GFDL−ESM2M (a,b) RegCM4 (c,d) under both scenarios. Ellipses indicates that the biases are significant at 95% confidence level.
Atmosphere 06 01833 g013

4. Conclusions

The present study validates the RegCM4 for present-day climate against the observations and explores the possible changes in the South Asian summer monsoon (SASM) on the basis of regional and global climate model projections. The simulations are conducted with RegCM4 at a 25 km horizontal resolution driven by GFDL-ESM2M lateral boundary forcing under the moderate (RCP4.5) and the strongest (RCP8.5) representation concentration pathways. Temperature, precipitation and wind field datasets from the Climate Research Unit (CRU), Asian precipitation, highly resolved, observational data integration towards evaluation (APHRODITE), the European Center for Medium Range Weather Forecast (ECMWF) interim reanalysis (ERAIM) and the National Center for Atmospheric Research (NCAR) Reanalysis 2 datasets (NCEP-DOE) are used to assess the performance of the model for the reference time period. It is found that the regional climate model (RegCM4) can fairly reproduce summer mean surface air temperature and precipitation over most parts of South Asia. However, RegCM4 shows cold biases of up to 5 °C over the Hindukush, Karakorum and Himalaya (HKH) region. Although there are significant variabilities in the mean wind fields, the location of the Somali jet, low level cyclonic circulation over the MCR, and position of upper level Tibetan anticyclone are successfully reproduced by RegCM4. The cyclonic circulation at 850 hPa is stronger in RegCM4 as compared to driving general circulation models (GCMs) over the Arabian Seas (AS), which could bring enhanced moisture inland, resulting in excessive precipitation over the Western Ghats.
In terms of internal model variability, the spatial correlation of temperature over MCR for RegCM4 is about 0.5 and less than 0.4 in the case of GFDL−ESM2M. For precipitation, the spatial correlation between RegCM4 and APHRODITE is more than 0.5, while in the case of GFDL−ESM2M it is less than 0.3. The RegCM4 data show better consistency with the observations than the core GCM, thereby revealing RegCM4’s fidelity in capturing the present-day monsoon climate.
The warming patterns in RegCM4 for future climate conditions (2070–2009) with respect to the reference time period (1976–2005) are about 2 °C under RCP 4.5 and about 5 °C under RCP8.5 over the MCR. It is also observed that RegCM4 shows an approximate 2 °C increase in warming over northern India and Pakistan as compared to MCR under RCP8.5. The comparison between the change patterns in RegCM4 and driving GFDL−ESM2M shows that the core GCM forcing has substantial effects on the temperature change. While in the case of precipitation, RegCM4 tends to develop its own climatology in representing the SASM projections for the end of 21st century.
The significant increase in precipitation projection over the Western Ghats and peninsular India in RegCM4 under RCP8.5 is possibly related with the strengthening of southwesterly seasonal flow (anomalous cyclonic circulation) at 850 hPa during the wet period. A quantitative analysis of spatial correlation indicates a significant influence of model biases on the simulated change. The fact of the matter is that many of the climate models overestimate the regional amplification of global warming and share the systematic temperature and precipitation-dependent biases which may affect their ability to accurately capture certain observable climate conditions [75,78]. Therefore, it is recommended that the bias-correction methods should be used before the application of future climate projection for impact assessment studies. The present study is limited to the use of the single model and mean climatology of SASM. To understand the model biases for climate change projections, an ensemble of experiments are required using the additional RCMs with a different GCM boundary forcing and including the climate extremes. Despite some caveats in our results, this study will significantly contribute to the CORDEX project and climate change impact assessment over South Asia.

Supplementary Files

Supplementary File 1

Acknowledgments

The authors are grateful to the RegCM4.3 group of ICTP Trieste Italy for providing the model with boundary forcing. This work was supported by University of Nairobi and International Development Research Center, Canada (UoN-IDRC Project Number: 106855-001). The computational work is completed on the Explorer 100 cluster system of Tsinghua National Laboratory for Information Science and Technology (TNList). Technical assistance from Lin Jiao is much appreciated. University of East Anglia and APHRODITE water resources project are acknowledged for providing the observed datasets of temperature and precipitation. Thanks are also due to ECMWF and NCEP/NCAR for providing the wind field reanalysis dataset.

Author Contributions

Mujtaba Hassan and Pengfei Du designed the idea of this research, conducted the simulation and prepared the manuscript. Shaofeng Jia analyzed the results and revised the manuscript with Rashid Mahmood and Waheed Iqbal. Wulong Ba provided assistance in long-term simulation using the RegCM4 with GFDL-ESM2M dataset.

Conflicts of Interest

The authors declare no conflict of interest.

References

  1. IPCC. Summary for Policymakers. In Climate Change: The Physical Science Basis. Contribution of Working Group I to the Fifth Assessment Report of the Intergovernmental Panel on Climate Change; Stocker, T.F., Qin, D., Plattner, G.-K., Tignor, M., Allen, S.K., Boschung, J., Nauels, A., Xia, Y., Bex, V., Midgley, P.M., Eds.; Cambridge University Press: Cambridge, UK; New York, NY, USA, 2013; pp. 1–32. [Google Scholar]
  2. Hsu, P.C.; Li, T.; Luo, J.J.; Murakami, H.; Kitoh, A.; Zhao, M. Increase of global monsoon area and precipitation under global warming: A robust signal? Geophys. Res. Lett. 2012, 39. [Google Scholar] [CrossRef]
  3. Lau, W.K.M.; Wu, H.T.; Kim, K.M. A canonical response of precipitation characteristics to global warming from CMIP5 models. Geophys. Res. Lett. 2013, 40, 3163–3169. [Google Scholar] [CrossRef]
  4. Lee, J.-Y.; Wang, B. Future change of global monsoons in the CMIP5. Clim. Dyn. 2014, 42, 101–119. [Google Scholar] [CrossRef]
  5. Turner, A.G.; Annamalai, H. Climate change and the south Asian summer monsoon. Nat. Clim. Chang. 2012, 2, 587–595. [Google Scholar] [CrossRef]
  6. Syed, F.S.; Iqbal, W.; Syed, A.A.B.; Rasul, G. Uncertainties in the regional climate models simulations of South-Asian summer monsoon and climate change. Clim. Dyn. 2014, 42, 2079–2097. [Google Scholar] [CrossRef]
  7. Goswami, B.B.; Mani, N.J.; Mukhopadhyay, P.; Waliser, D.E.; Benedict, J.J.; Maloney, E.D.; Khairoutdinov, M.; Goswami, B.N. Monsoon intraseasonal oscillations as simulated by the superparameterized Community Atmosphere Model. J. Geophys. Res. 2011, 116. [Google Scholar] [CrossRef]
  8. Ashfaq, M.; Shi, Y.; Tung, W.; Trapp, R.J.; Gao, T.X.; Pal, J.S.; Diffenbaugh, N.S. Suppression of south Asian summer monsoon precipitation in the 21st century. J. Geophys. Res. 2009, 36. [Google Scholar] [CrossRef]
  9. Hussain, I.G.; Spock, J.P.; Yu, H.L. Spatio-temporal interpolation of precipitation during monsoon period in Pakistan. Adv. Water Resour. 2010, 33, 880–886. [Google Scholar] [CrossRef]
  10. Webster, P.J.; Toma, V.E.; Kim, H.M. Were the 2010 Pakistan floods predictable? Geophys. Res. Lett. 2011, 38. [Google Scholar] [CrossRef]
  11. Pai, D.S.; Sreejith, O.P. Global and regional circulation anomalies: Monsoon. Available online: http://www.imd.gov.in/section/nhac/dynamic/monsoon_report_2010.pdf (accessed on 5 September 2015).
  12. Taylor, K.E.; Stouffer, R.J.; Meehl, G.A. An overview of CMIP5 and the experiment design. Bull. Am. Meteorol. Soc. 2012, 93, 485–498. [Google Scholar] [CrossRef]
  13. Sperber, K.R.; Annamalai, H.; Kang, I.-S.; Kitoh, A.; Moise, A.; Turner, A.; Wang, B.; Zhou, T. The Asian summer monsoon: An inter-comparison of CMIP5 vs. CMIP3 simulations of the late 20th century. Clim. Dyn. 2012, 41, 2711–2744. [Google Scholar] [CrossRef]
  14. Wang, B.; Yim, S.Y.; Lee, J.-Y.; Liu, J.; Ha, K.J. Future change of Asian-Australian monsoon under RCP 4.5 anthropogenic warming scenario. Clim. Dyn. 2014, 42, 83–100. [Google Scholar] [CrossRef]
  15. Krishnamurti, T.N.; Stefanova, L.; Chakraborty, A.; Kumar, T.S.V.V.; Cocke, S.; Bachiochi, D.; Mackey, B. Seasonal forecasts of precipitation anomalies for North American and Asian monsoons. J. Meteorol. Soc. Jpn. 2002, 80, 1415–1426. [Google Scholar] [CrossRef]
  16. Kang, I.-S.; Lee, J.; Park, C.K. Potential predictability of summer mean precipitation in a dynamical seasonal prediction system with systematic error correction. J. Clim. 2004, 17, 834–844. [Google Scholar] [CrossRef]
  17. Wang, B.; Ding, Q.; Fu, X.; Kang, I.-S.; Jin, K.; Shukla, J.; Doblas-Reyes, F. Fundamental challenge in simulation and prediction of summer monsoon rainfall. Geophys. Res. Lett. 2005, 32. [Google Scholar] [CrossRef]
  18. Feng, J.; Fu, C. Inter-comparison of 10-year precipitation simulated by several RCMs for Asia. Adv. Atmos. Sci. 2006, 23, 531–542. [Google Scholar] [CrossRef]
  19. Saeed, S.; Muller, W.A.; Hagemann, S.; Jacob, D.; Mujumdar, M.; Krishnan, R. Precipitation variability over the South Asian monsoon heat low and associated teleconnections. Geophys. Res. Lett. 2011, 38. [Google Scholar] [CrossRef]
  20. Sharmila, S.; Joseph, S.; Sahai, A.K.; Abhilash, S.; Chattopadhyay, R. Future projection of India summer monsoon variability under climate change scenario: An assessment from CMIP5 climate models. Glob. Planet. Chang. 2014, 124, 62–78. [Google Scholar] [CrossRef]
  21. Von Storch, H.; Zorita, E.; Cubasch, U. Downscaling of global climate change estimates to regional scales: An application to Iberian rainfall in wintertime. J. Clim. 1993, 6, 1161–1171. [Google Scholar] [CrossRef]
  22. Ding, T.; Ke, Z. A comparison of statistical approach for seasonal precipitation prediction in Pakistan. Weather Forecast 2013, 32, 1116–1132. [Google Scholar] [CrossRef]
  23. Raju, A.; Parekh, A.; Chowdary, J.S.; Gnanaseelan, C. Assessment of the Indian summer monsoon in the WRF regional climate model. Clim. Dyn. 2015, 44, 3077–3100. [Google Scholar] [CrossRef]
  24. Ratana, S.B.; Ratnam, J.V.; Behera, A.K.; Rautenbach, C.J.; Ndarana, T.; Takahashi, K.; Yamagata, T. Performance assessment of three convective parameterization schemes in WRF for downscaling summer rainfall over South Africa. Clim. Dyn. 2013, 42, 2931–2953. [Google Scholar] [CrossRef]
  25. Da Rocha, R.P.; Cuadra, S.V.; Reboita, M.S.; Kruger, L.F.; Amrizzi, T.; Krusche, N. Effects of RegCM3 parameterizations on simulated rainy season over South America. Clim. Res. 2012, 52, 253–265. [Google Scholar] [CrossRef]
  26. Bhaskaran, B.; Jones, R.G.; Murphy, J.M.; Noguer, M. Simulations of the Indian summer monsoon using a nested climate model: Domain size experiments. Clim. Dyn. 1996, 12, 573–587. [Google Scholar] [CrossRef]
  27. Vernekar, A.D.; Ji, Y. Simulation of the onset and intraseasonal variability of two contrasting summer monsoons. J. Clim. 1999, 12, 1707–1725. [Google Scholar] [CrossRef]
  28. Bhaskar, D.V.; Ashok, K.; Yamagata, T. A numerical simulation study of the Indian summer monsoon of 1994 using NCAR MM5. J. Meteorol. Soc. Jpn. 2004, 82, 1755–1777. [Google Scholar] [CrossRef]
  29. Dash, S.K.; Shekhar, M.S.; Singh, G.P. Simulation of Indian summer monsoon circulation and rainfall using RegCM3. Theor. Appl. Climatol. 2006, 86, 161–172. [Google Scholar] [CrossRef]
  30. Islam, S.; Rehman, N.; Sheikh, M.M. Future change in the frequency of warm and cold spells durations over Pakistan simulated by the PRECIS regional climate model. Clim. Chang. 2009, 94, 35–45. [Google Scholar] [CrossRef]
  31. Dobler, A.; Ahrens, B. Analysis of the Indian summer monsoon system in the regional climate model COSMO-CLM. J. Geophys. Res. 2010, 115. [Google Scholar] [CrossRef]
  32. Hariprasad, D.; Venkata, S.C.; Bhaskar, R.D.; Anjaneyulu, Y. Simulation of Indian monsoon extreme rainfall events during the decadal period 2000–2009 using a high resolution mesoscale model. Adv. Geosci. 2011, A6, 31–48. [Google Scholar]
  33. Lucas-Picher, P.; Christensen, J.H.; Saeed, F.; Kumar, P.; Asharaf, S.; Ahrens, B.; Wilshire, A.J.; Jacob, D.; Hegemann, S. Can Regional Climate Models Represent the Indian Monsoon? J. Hydrometrol. 2011, 12, 849–868. [Google Scholar] [CrossRef]
  34. Saeed, F.; Hagemann, S.; Jacob, D. A framework for the evaluation of the South Asian summer monsoon in a regional climate model applied to REMO. Int. J. Climatol. 2012, 32, 430–440. [Google Scholar] [CrossRef]
  35. Dash, S.K.; Mishra, S.K.; Pattnayak, K.C.; Manmgain, A.; Mariotti, L.; Coppola, E.; Giorgi, F.; Giuliani, G. Projected seasonal mean summer monsoon over India and adjoining regions for the twenty-first century. Theor. Appl. Climatol. 2014. [Google Scholar] [CrossRef]
  36. Tawfik, A.B.; Steiner, A.L. The role of soil ice in land–atmosphere coupling over the United States: A soil moisture precipitation winter feedback mechanism. J. Geophys. Res. 2011, 116. [Google Scholar] [CrossRef]
  37. Giorgi, F.; Coppola, E.; Solmon, F.; Mariotti, L.; Sylla, M.B.; Bi, X.; Elguindi, N.; Diro, G.T.; Nair, V.; Giuliani, G.; et al. RegCM4: Model description and preliminary tests over multiple CORDEX domains. Clim. Res. 2012, 52, 7–29. [Google Scholar] [CrossRef]
  38. Dickinson, R.E.; Errico, R.M.; Giorgi, F.; Bates, G.T. A regional climate model for the western United States. Clim. Chang. 1989, 15, 383–422. [Google Scholar] [CrossRef]
  39. Giorgi, F. Simulation of regional climate using a limited area model nested in a general circulation model. J. Clim. 1990, 3, 941–963. [Google Scholar] [CrossRef]
  40. Giorgi, F.; Marinucci, M.R.; Bates, G. Development of a second generation regional climate model (RegCM2). I. Boundary layer and radiative transfer processes. Mon. Weather Rev. 1993, 121, 2794–2813. [Google Scholar] [CrossRef]
  41. Giorgi, F.; Mearns, L.O. Introduction to special section: Regional climate modeling revisited. J. Geophy. Res. 1999, 104, 6335–6352. [Google Scholar] [CrossRef]
  42. Pal, J.S.; Giorgi, F.; Bi, X.; Elguindi, N.; Solmon, F.; Rauscher, S.A. Regional climate modeling for the developing world: The ICTP Reg-CM3 and RegCNET. Bull. Am. Meteorol. Soc. 2007, 88, 1395–1409. [Google Scholar] [CrossRef]
  43. Grell, G.; Dudhia, J.; Stauffer, D.R. A Description of the Fifth Generation Penn State/NCAR Mesoscale Model (MM5); National Center for Atmospheric Research Technical Note; NCAR/TN-398 STR; NCAR: Boulder, CO, USA, 1994. [Google Scholar]
  44. Dickinson, R.E.; Henderson-Sellers, A.; Kennedy, P. Bio-Sphere-Atmosphere Transfer Scheme (BATS) Version 1e As Coupled to the NCAR Community Climate Model; National Center for Atmospheric Research Technical Note; NCAR.TN-387-STR; NCAR: Boulder, CO, USA, 1993. [Google Scholar]
  45. Oleson, K.W.; Niu, G.; Yang, Z.L.; Lawrence, D.M.; Lawrence, P.E.; Thornton, P.J.; Lawrence, R.; Stöckli, R.E.; Dickinson, G.B.; Bonan, S.; et al. Improvements to the community land model and their impact on the hydrologic cycle. J. Geophys. Res. 2008, 113. [Google Scholar] [CrossRef]
  46. Steiner, A.L.; Pal, J.S.; Rauscher, S.A.; Bell, J.L.; Diffenbaugh, N.S.; Boone, A.; Sloan, L.C.; Giorgi, F. Land surface coupling in regional climate simulations of the West Africa monsoon. Clim. Dyn. 2009, 33, 869–892. [Google Scholar] [CrossRef]
  47. Kiehl, J.T.; Hack, J.J.; Bonan, G.B.; Boville, B.A.; Breigleb, B.P. Description of the NCAR Community Climate Model (CCM3). Available online: http://www.osti.gov/scitech/biblio/442361 (accessed on 5 September 2015).
  48. Briegleb, B.P. Delta-Eddington approximation for solar radiation in the NCAR Community Climate Mode. J. Geophys. Res. 1992, 97, 7603–7612. [Google Scholar] [CrossRef]
  49. Pal, J.S.; Small, E.; Eltahi, E. Simulation of regional-scale water and energy budgets: Representation of sub grid cloud and precipitation processes within RegCM. J. Geophys. Res. 2000, 105, 29579–29594. [Google Scholar] [CrossRef]
  50. Holtslag, A.; Bruijn, E.; Pan, H.L. A high resolution air mass transformation model for short-range weather forecasting. Mon. Weather Rev. 1990, 118, 1561–1575. [Google Scholar] [CrossRef]
  51. Anthes, R.A.; Hsie, E.Y.; Kuo, Y.H. Description of the Penn State/NCAR Mesoscale Model Version 4 (MM4); National Center for Atmospheric Research Technical Note; TN-282STR; NCAR: Boulder, CO, USA, 1987. [Google Scholar]
  52. Grell, G.A. Prognostic evaluation of assumptions used by cumulus parameterization. Mon. Weather. Rev. 1993, 12, 764–787. [Google Scholar] [CrossRef]
  53. Arakawa, A.; Schubert, W.H. Interaction of a cumulus cloud ensemble with the large-scale environment, part I. J. Atmos. Sci. 1974, 31, 674–701. [Google Scholar] [CrossRef]
  54. Fritsch, J.; Chappell, C. Numerical prediction of convectively driven mesoscale pressure systems. I. Convective parameterization. J. Atmos. Sci. 1980, 37, 1722–1733. [Google Scholar] [CrossRef]
  55. Emanuel, K.A. A scheme for representing cumulus convection in large-scale models. J. Atmos. Sci. 1991, 48, 2313–2335. [Google Scholar] [CrossRef]
  56. Emanuel, K.A.; Zivkovic-Rothman, M. Development and evaluation of a convection scheme for use in climate models. J. Atmos. Sci. 1999, 56, 1766–1782. [Google Scholar] [CrossRef]
  57. Tiedtke, M. A comprehensive mass-flux scheme for cumulus parameterization in large-scale models. Mon. Weather Rev. 1989, 117, 1779–1800. [Google Scholar] [CrossRef]
  58. Coppola, E.; Giorgi, F.; Raffaele, F.; Fuentes-Franco, R.; Giuliani, G.; LLopart-Pereira, M.; Mamgain, A.; Mariotti, L.; Diro, G.T.; Torma, C. Present and future climatologies in the phase I CREMA experiment. Clim. Chang. 2014, 125, 23–38. [Google Scholar] [CrossRef]
  59. Loverland, T.R.; Reed, B.C.; Brown, J.F.; Ohlen, D.O.; Zhu, Z.; Yang, L.; Merchant, J.W. Development of a global land cover characteristics database and IGBP DISCover from 1 km AVHRR data. Int. J. Remote. Sens. 2000, 21, 1303–1365. [Google Scholar] [CrossRef]
  60. Mitchell, T.D.; Jones, P.D. An improved method of constructing a database of monthly climate observations and associated high resolution grids. Int. J. Climatol. 2005, 25, 693–712. [Google Scholar] [CrossRef]
  61. Yatagai, A.; Kenji, K.; Osamu, A.; Atsushi, H.; Natsuko, Y.; Akio, K. APHRODITE: Constructing a long-term daily gridded precipitation dataset for Asia based on a dense network of rain gauges. Bull. Am. Meteor Soc. 2012, 93, 1401–1415. [Google Scholar] [CrossRef]
  62. Rao, Y.P.; Ramamurti, K.S. Climatology of India and neighborhood. Available online: http://www.imdpune.gov.in/weather_forecasting/Forecasting_Mannuals/IMD_I-2.pdf (accessed on 5 September 2015).
  63. Srinivas, C.V.; Hariprasad, D.; Bhaskar, R.D.V.; Anjaneyulu, Y.; Baskarana, R.; Venkataramana, B. Simulation of the Indian summer monsoon regional climate using advanced research WRF model. Int. J. Climatol. 2012. [Google Scholar] [CrossRef]
  64. Rajeevan, M.; Gadgil, S.; Bhate, J. Active and break spells of the Indian summer monsoon. J. Earth Syst. Sci. 2010, 119, 229–247. [Google Scholar] [CrossRef]
  65. Van Vuuren, D.P.; Edmonds, J.; Kainuma, M.; Riahi, K.; Thomson, A.; Hibbard, K.; Hurtt, G.C.; Kram, T.; Krey, V.; Lamarque, J.-F.; et al. The representative concentration pathways: An overview. Clim. Chang. 2011, 109, 5–31. [Google Scholar] [CrossRef]
  66. Meinshausen, M.; Smith, S.J.; Calvin, K.; Daniel, J.S.; Kainuma, M.L.T.; Lamarque, J.F.; Matsumoto, K.; Montzka, S.A.; Raper, S.C.B.; Riahi, K.; et al. The RCP greenhouse gas concentrations and their extensions from 1765 to 2300. Clim. Chang. 2001. [Google Scholar] [CrossRef]
  67. Lamarque, J.F.; Page, K.G.; Meinshause, M.; Riahi, K.; Smith, S.; van Vuuren, D.P.; Conley, A.J.; Vitt, F. Global and regional evolution of short-lived radiatively-active gases and aerosols in the representative concentration pathways. Clim. Chang. 2011. [Google Scholar] [CrossRef]
  68. New, M.G.; Hulme, M.; Jones, P.D. Representing twentieth century space time climate variability. Part 1. Development of a 1961–1990 mean monthly terrestrial climatology. J. Clim. 1999, 12, 829–856. [Google Scholar] [CrossRef]
  69. Nikulin, G. Precipitation climatology in an ensemble of CORDEX Africa regional climate simulations. J. Clim. 2012, 25, 6057–6078. [Google Scholar] [CrossRef]
  70. Sylla, M.B.; Giorgi, F.; Coppola, E.; Mariotti, L. Uncertainties in daily rainfall over Africa: Assessment of gridded observation products and evaluation of a regional climate model simulation. Int. J. Climatol. 2012. [Google Scholar] [CrossRef]
  71. Gu, H.; Wang, G.; Yu, Z.; Mei, R. Assessing future climate changes and extreme indicators in east and south Asia using RegCM regional climate model. Clim. Chang. 2012, 114, 301–317. [Google Scholar] [CrossRef]
  72. Giorgi, F.; Huang, Y.; Nishizawa, K.; Fu, C. A seasonal cycle simulation over eastern Asia and its sensitivity to radioactive transfer and surface processes. J. Geophys. Res. 1999, 104, 6403–6423. [Google Scholar] [CrossRef]
  73. Ullah, K.; Gao, S.T. Moisture transport over the Arabian associated with the summer rainfall over Pakistan in 1994 and 2002. Adv. Atmos. Sci. 2012, 29, 501–508. [Google Scholar] [CrossRef]
  74. Krishnamurti, T.N.; Bhalme, H.N. Oscillations of a monsoon system, Part I: Observational aspects. J. Atmos. Sci. 1976, 33, 1937–1954. [Google Scholar] [CrossRef]
  75. Mariotti, L.; Coppola, E.; Sylla, M.B.; Giorgi, F.; Piani, C. Regional climate model simulation of projected 21st century climate change over an all-Africa domain: Comparison analysis of nested and driving model results. J. Geophys. Res. Atmos. 2013. [Google Scholar] [CrossRef]
  76. Di Luca, A.; de Elia, R.; Laprise, R. Potential for small scale added value of RCM’s downscaled climate change signal. Clim. Dyn. 2013, 40, 601–618. [Google Scholar] [CrossRef]
  77. Kazmi, D.H.; Li, J.; Rasul, G.; Tong, J.; Ali, G.; Cheema, S.B.; Liu, L.; Gemmer, M.; Fischer, T. Statistical downscaling and future scenario generation of temperature for Pakistan regions. Theor. Appl. Climatol. 2014, 120, 341–350. [Google Scholar] [CrossRef]
  78. Kumr, A.; Wiltshire, A.; Mathison, C.; Asharaf, S.; Ahrens, B.; Lucas-Picher, P.; Christensen, J.H.; Gobiet, A.; Saeed, F.; Hagemann, S.; et al. Downscaled climate change projections with uncertainty assessment over India using a high resolution multi-model approach. Sci. Total Environ. 2013, 468–469, S18–S30. [Google Scholar] [CrossRef] [PubMed]
  79. Boberg, F.; Christensen, J.H. Overestimation of Mediterranean summer temperature projections due to model deficiencies. Nat. Clim. Chang. 2012, 2, 433–436. [Google Scholar] [CrossRef]
  80. Cook, E.R.; Anchunkaitis, K.J.; Buckley, B.M.; D’Arrigo, R.D.; Jacoby, G.C.; Wright, W.E. Asian Monsoon failure and magadrought during the last millennium. Science 2010, 328, 486–489. [Google Scholar] [CrossRef] [PubMed]

