Article

UV Irradiance Enhancements by Scattering of Solar Radiation from Clouds

1
Meteorological Observatory Lindenberg-Richard-Aßmann-Observatory, German Meteorological Service, Lindenberg 15848, Germany
2
The SETI Institute Carl Sagan Center/NASA Ames Research Center, Moffett Field, CA 94035, USA
3
Department of Biology, Friedrich-Alexander-Universität Erlangen-Nürnberg, Erlangen 91054, Germany
*
Author to whom correspondence should be addressed.
These authors contributed equally to this work.
Atmosphere 2015, 6(8), 1211-1228; https://doi.org/10.3390/atmos6081211
Submission received: 11 June 2015 / Revised: 6 August 2015 / Accepted: 13 August 2015 / Published: 18 August 2015

Abstract

:
Scattering of solar radiation by clouds can reduce or enhance solar global irradiance compared to cloudless-sky irradiance at the Earth’s surface. Cloud effects to global irradiance can be described by Cloud Modification Factors (CMF). Depending on strength and duration, irradiance enhancements affect the energy balance of the surface and gain of solar power for electric energy generation. In the ultraviolet region, they increase the risk for damage to living organisms. Wavelength-dependent CMFs have been shown to reach 1.5 even in the UV-B region at low altitudes. Ground-based solar radiation measurements in the high Andes region at altitudes up to 5917 m a.s.l showed cloud-induced irradiance enhancements. While UV-A enhancements were explained by cloud scattering, both radiation scattering from clouds and Negative Ozone Anomalies (NOA) have been discussed to have caused short-time enhancement of UV-B irradiance. Based on scenarios using published CMF and additional spectroradiometric measurements at a low-altitude site, the contribution of cloud scattering to the UV-B irradiance enhancement in the Andes region has been estimated. The range of UV index estimates converted from measured UV-B and UV-A irradiance and modeled cloudless-sky ratios UV-B/erythemal UV is compatible with an earlier estimate of an extreme UV index value of 43 derived for the high Andes.

Graphical Abstract

1. Introduction

Single and multiple scattering of solar radiation by droplets and ice particles of clouds result in a distribution of diffuse radiance being different from the anisotropic pattern of the cloudless sky. Number, shapes, and size distribution of cloud droplets and particles determine the radiance distribution of the cloudy sky. Radiation scattering depends on wavelength. Direct solar irradiance at the ground can be reduced or blocked by clouds in the path of the solar beam. If the direct solar beam irradiance is not or only slightly affected by clouds, and clouds in the sky strongly scatter radiation to the ground, global irradiance at the ground can be higher than that under a cloudless sky. Enhancements usually persisting for a few minutes to tens of minutes modify the energy and heat balance of the Earth’s surface. They can have beneficial effects for gaining additional solar power. In the UV region, they can increase the risk of damage to living organisms.
A number of studies have shown irradiance enhancements by radiation scattering from clouds for the UV and visible region. Enhancements of total solar irradiance were described for Brazil at 11° S that exceeded cloudless-sky irradiance for hours and extraterrestrial irradiance for minutes, though with frequent short-time fluctuations and reductions to lower values due to cloud movement [1]. Measured enhancements of total solar global irradiance over extraterrestrial irradiance by 8%, and average enhancements referred to cloudless sky by 12% for total global irradiance and by 6% in the UV region from 295–385 nm were reported from Puna de Atacama (23.3° S, 3700 m a.s.l) [2]. Higher enhancements of total solar irradiance that exceeded extraterrestrial irradiance by 8% and cloudless-sky irradiance by 43% were measured by [3] at Recife, Brazil (8° S, 4 m a.s.l). Daily maximum total irradiance exceeded extraterrestrial irradiance for 3.4% of the days of the measurement period [3]. Still higher enhancements of total solar irradiance by 12% over extraterrestrial irradiance were reported by [4] for high latitudes in Southern Norway.
In the UV-B (280–315 nm) and UV-A (315–400 nm) regions, radiation scattering by clouds can be remarkable. Solar UV irradiance measured in the wavelength region covering part of the UV-B at Mauna Loa Observatory (19.5° N, 3,400 m a.s.l) showed enhancements over cloudless-sky irradiance due to Cumulus clouds near the apparent position of the Sun [5]. Enhancements of up to 30% persisted for minutes to tens of minutes. Enhancements by 50% in the UV-B and for the UV index [6,7], the latter of which is defined as the 40 fold of erythemal irradiance according to the action spectrum by [8] with corrections according to [9], and somewhat smaller maximum enhancements by 30% for UV-A irradiance were reported from measurements at Girona (Spain) at 42° N latitude and 100 m a.s.l, and in Toowoomba, Australia at 28° S and 693 m a.s.l. Wavelength dependencies of enhancements derived in different studies [6,10,11,12,13,14] show either increasing or decreasing enhancements with increasing wavelengths.
Ground-based measurements of UV-A irradiance, UV-B irradiance and Photosynthetic Active Radiation (PAR, 400–700 nm) using Eldonet dosimeters in the high Andes region at altitudes up to 5916 m a.s.l had shown enhancements over irradiance at cloudless conditions, the latter of which was derived from radiative transfer model calculations, for minutes to tens of minutes [15]. While the irradiance enhancements for PAR and UV-A were explained by radiation scattering from clouds, extreme UV-B enhancements were ascribed to the result of both cloud scattering and Negative Ozone Anomalies (NOA). NOAs observed in satellite-based data were defined as small-scale air parcels containing extremely low atmospheric ozone concentration. Due to missing satellite-based column ozone data at the time and place of ground-based UV-B irradiance measurements, the contribution by radiation scattering to measured UV-B irradiance was based on assumptions on the extent and wavelength dependence of scattering.
Using results of cloud-related radiation enhancement from the literature and from measurements taken at a low-altitude site, the present paper focuses in more detail on the wavelength-dependent nature of radiation scattering by clouds in relation to NOAs that contributed to extremely high UV-B irradiance and high UV-B/UV-A irradiance ratios at the high-altitude sites. We also focus on the conversion from measured UV-B/UV-A ratios to estimates of UV index values discussed by [15]. It is mentioned here, though not further discussed, that enhancements in UV-B irradiance also affect photolysis rates of tropospheric trace constituents [16,17] and thus potentially modify tropospheric chemistry.

2. Materials and Methods

2.1. Cloud Modification Factors

Global solar irradiance of the cloudless sky increases with increasing altitude due to decreasing mass of air and usually less aerosol at higher altitudes. Cloudless-sky UV irradiance was modeled for altitude levels between ground level and 7 km a.s.l by the LibRadtran model [18] for a tropical atmosphere, a column ozone amount of 250 DU, and a low surface albedo of loam. In addition to the low surface albedo, a model calculation for higher altitudes of 5, 6, and 7 km a.s.l was performed using an albedo of snow cover. The cloud effect on irradiance can be expressed by a cloud modification factor (CMF) that is defined as the ratio between global irradiance for cloudy conditions UVmeas and irradiance with cloudless conditions UVCS in the respective wavelength region (e.g., [19,20]).
C M F = U V m e a s U V C S
During cloudy conditions, cloudless-sky UV irradiance can be estimated with some uncertainty from radiative transfer model calculations or extrapolations/parameterizations from irradiances measured at other times with cloudless, but otherwise similar atmospheric conditions. CMFs become greater than one, usually if the sun is not occluded by a cloud, as a result of strong radiance enhancements by scattering of solar radiation from clouds that are preferably near the apparent position of the sun or opposite the sun (e.g., [21]). If radiance values of cloudy sky regions are higher than cloudless-sky radiance, the resulting irradiance of cloudy sky exceeds cloudless-sky irradiance.
The duration of CMFs > 1 in time depends on vertical structure, movement and optical characteristics of clouds within the 180° field of view at the observation site. Fast moving clouds can lead to short-time fluctuations of CMFs. The duration of an irradiance enhancement recorded by the radiation instrument depends on the change of the viewing angle of the scattering cloud spot in time. Figure 1 illustrates the time in minutes that it takes for a scattering cloud pixel at altitudes of 9 km or 3 km, respectively, above the ground to move by an angle of 2.5°, which is half the viewing angle of a pyrheliometer, at speeds of 10 km/h, 30 km/h or 50 km/h from a starting viewing angle shown at the abscissa. While it takes a cloud pixel close to the zenith at a height of 9 km above the ground at a speed of 10 km/h almost 3.5 h to move from 5° to 7.5° viewing angle, it takes only 5 minutes at the higher viewing angle from 40° to 42.5°. Viewing angle changes are still larger at a lower cloud height of 3 km. It has been assumed for simplicity for Figure 1 that the apparent position of the sun does not change within that time and that only one cloud pixel scatters radiation. The dashed curve at a time of 10 minutes in Figure 1 shows that, from the geometric point of view, parts of clouds at larger heights above the ground and viewing angles of less than about 30° from the zenith that occur at lower geographic latitudes have a higher chance to effectively scatter radiation to the ground for longer time periods of minutes to even hours than clouds at lower heights and higher speed. It is noted that in the real atmosphere, other effects such as changing solar zenith and azimuth angles, changing scattering angles with cloud particle movement, and the anisotropy of the cloudless sky, significantly contribute to the duration and the values of enhancement at the ground. It must be noted that stationary clouds preferably developing by forced uplifting and cooling of air at the luv side of mountains, or by pressure reduction or gravity waves induced at mid-tropospheric levels at their lee side can also result in longer-lasting scattering of radiation from clouds even at higher viewing angles. Banner clouds that seem to hang at the mountain crest as well as wave clouds such as Altocumulus lenticularis at the mountain’s lee sides are typical examples of longer lasting quasi-stationary cloud phenomena.
Figure 1. Time t in minutes for a cloud pixel to move by 2.5° viewing angle from the start viewing angle α at the abscissa (α = 0° corresponds to zenith) for cloud-base altitudes of 9 km and 3 km above the ground, respectively, and at horizontal speeds of 10 km/h, 30 km/h and 50 km/h derived from geometric relations.
Atmosphere 06 01211 g001
Figure 2 illustrates results of LibRadtran model calculations for UV-B (280–315 nm), erythemal irradiance according to the action spectrum by [8] and [9] (plotted as UV index), UV-A (315–400 nm) and Photosynthetic Active Radiation (PAR), which is defined as broad-band irradiance in the visible region between 400 and 700 nm. In addition to low surface albedo, results for a snow-covered surface are shown in Figure 2 at the highest altitudes (5–7 km a.s.l). Enhanced irradiance by scattering from clouds with an assumed CMF = 1.35, as it was measured by a fast scanning spectroradiometer and a multichannel filter radiometer with neural network technique in the UV-A and UV-B over 22 minutes at Izaña (Tenerife) at an altitude of 2409 m a.s.l [20], is also shown in Figure 2 for altitudes between 5 and 7 km, and for solar zenith angles (SZA) of 0° and 20°. Scattering by clouds (sc) in addition to high surface albedo enhances UV-A and PAR even beyond their extraterrestrial values, while UV-B and erythemal irradiance (UV index) still remain below their extraterrestrial values due to the strong absorption of solar irradiance by stratospheric ozone.
Figure 2. Global irradiance for UV-A (315–400 nm), UV-B (280–315 nm), UV index according to the action spectrum by CIE (1987) and PAR (400–700 nm) in dependence of altitude above sea level from LibRadtran model calculations for a column ozone value of 250 DU, low aerosol optical depth, low precipitable water, and a surface albedo of loam for solar zenith angles (SZA) 80°, 60°, 40°, 20°, and 0° (solid lines). For the three highest altitude levels, results are also shown for snow albedo (dashed curves). Results for a CMF of 1.35 are shown at altitudes 5, 6, and 7 km, and SZAs 20° and 0° as scattering by clouds (sc). EXT: extraterrestrial irradiance.
Atmosphere 06 01211 g002

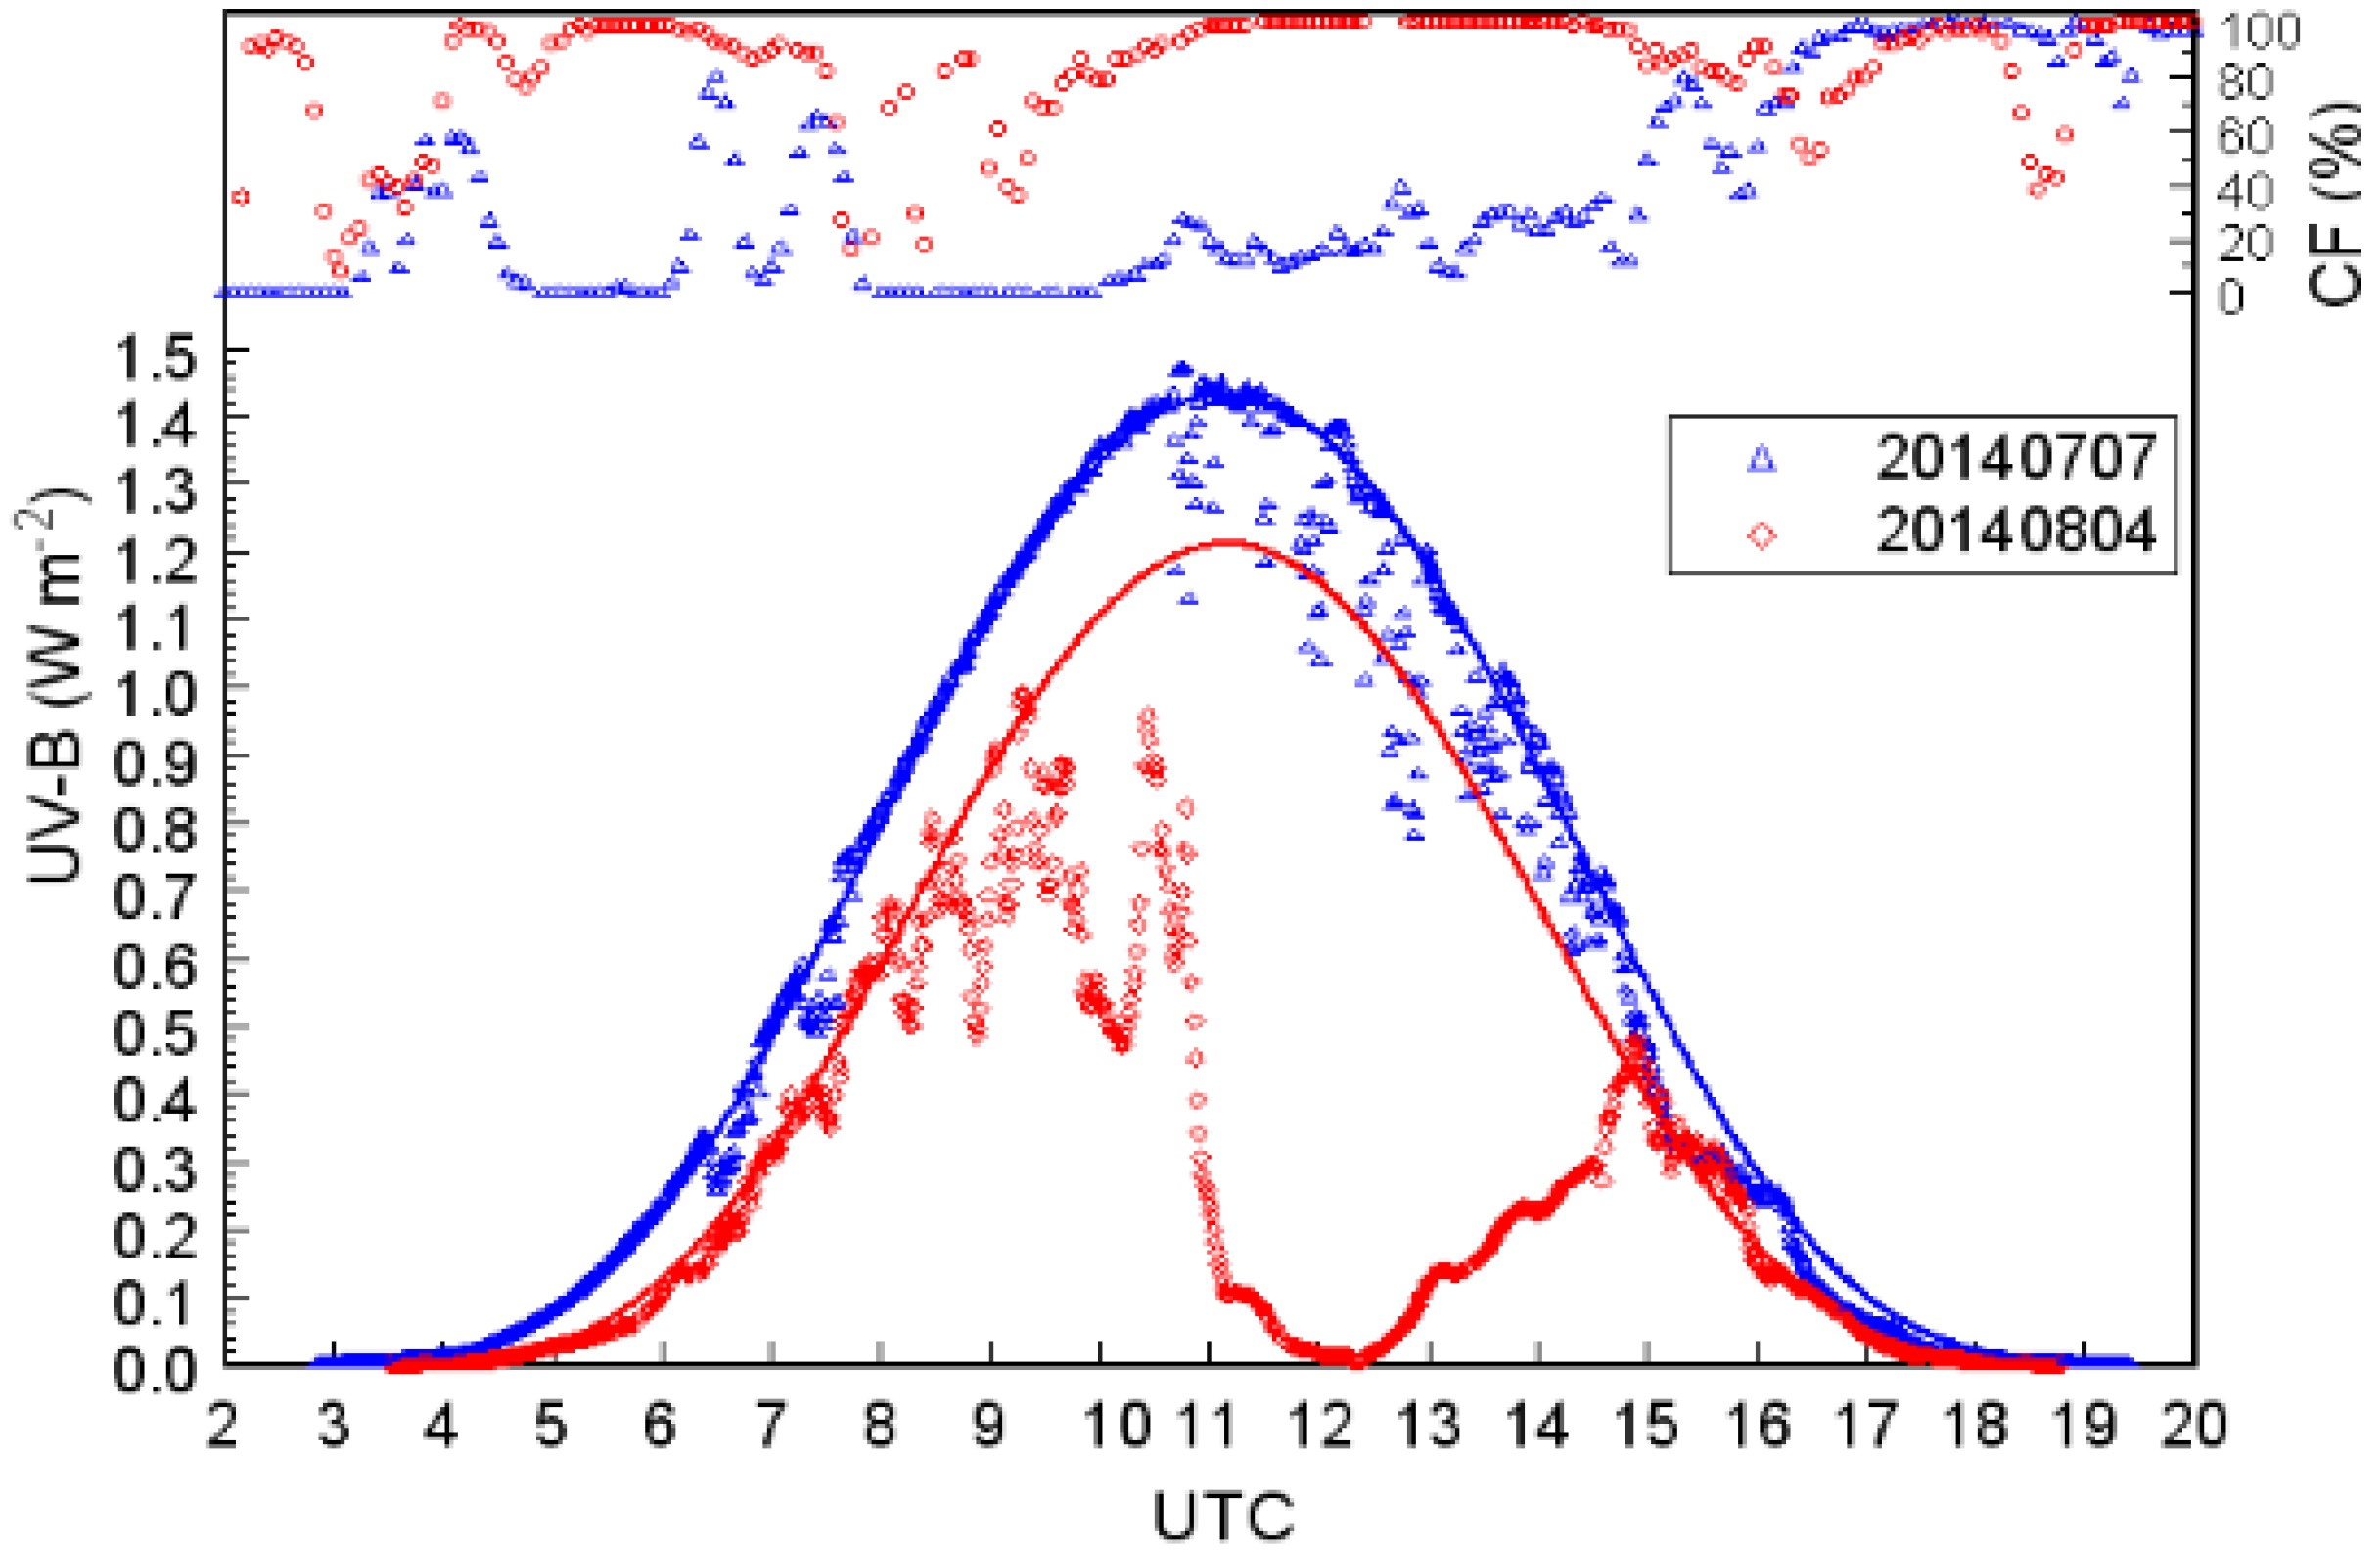
2.2. Diurnal Changes of UV Cloud Modification Factors

Cloud Modification Factors (CMF) according to Equation (1) were derived for UV-B, erythemal and UV-A irradiance from spectroradiometric measurements UVmeas performed at the site Lindenberg (52.2° N, 14.1° E, 127 m a.s.l) and from corresponding LibRadtran cloudless model calculations UVCS for two days (7 July and 4 August 2014). Each spectroradiometric scan from 290–450 nm takes 23 s and was repeated every minute. Model calculations were performed for every minute between sunrise and sunset. Using measured cloud fraction of the upper hemisphere from a Nubiscope that scans the whole sky in the infrared region (8–14 µm) in about 3.5 minutes, cloudless time periods were checked for CMF = 1 at the three wavelengths regions. Cloud-free periods derived by the Nubiscope are supported by images of an All-Sky camera taken at one minute time steps. Figure 3 shows UV-B irradiance from measurements (all-sky) and from model calculations for cloudless sky (lower panel), and cloud fractions (upper panel) for the two days. Concurrent Whole Sky Imager measurements showed high diffuse radiances in the visible region close to the apparent position of the sun, but not in the circumsolar region, at times when measured global UV radiation exceeded cloudless-sky irradiance. On 4 August, a thick Cumulonimbus (Cb) cloud reduced UV-B irradiances between about 11 and 15 UTC down to 0.41% and UV-A to 0.97% of their cloudless-sky values. The resulting CMFs on the two days vary between 0.004 and 1.34, as it is shown for UV-B, ERY, and UV-A in Table 1. CMF variations in time are shown for UV-B and UV-A in Figure 4. Cloudless-sky values were derived assuming that diurnal changes of aerosol optical depths were negligible. AOD340 at 340 nm derived from a CIMEL photometer at the site show low values between 0.35 and 0.5 on 7 July. On 4 August, only few AOD340 measurements with an average of 0.162 in the morning hours between 7:45 and 9:30 UTC are available due to mostly cloudy sky during the rest of the day.
Figure 3. UV-B global irradiance measured at Lindenberg (52.2° N, 14.1° E, 0.127 km a.s.l) on 7 July and 4 August 2014 by a fast scanning spectroradiometer Spectro 320D (symbols), and cloudless-sky model calculations (lower panel). Total cloud fraction (CF) derived from Nubiscope measurements (IR sky scanner) are shown in the upper panel.
Atmosphere 06 01211 g003
Table 1. Minimum and maximum cloud modification factors (CMF) of UV-B, erythemal irradiance (ERY), and UV-A, and for ratios UV-B/UV-A, UV-B/ERY on two days at Lindenberg.
7 July 20144 August 2014
MINMAXMINMAX
CMFUVB0.4071.1980.0041.293
CMFERY0.3791.1050.0051.319
CMFUVA0.3501.1530.0101.337
CMFUVB/UVA0.8731.3100.3461.328
CMFUVB/ERY0.9701.1430.7681.157
Figure 4. Cloud modification factors (CMF) derived from spectroradiometric measurements and LibRadtran model calculations in the UV-B and UV-A on 7 July and 4 August 2014 at Lindenberg (lower panel). CMFUVB/UVA of ratios CMFUVB/CMFUVA on the two days is shown in the upper panel.
Atmosphere 06 01211 g004
Enhanced multiple scattering of radiation and thus longer photon path lengths within optically thick clouds and resulting stronger absorption of UV-B irradiance by tropospheric ozone can result in increased ratios between-UV-B and UV-A irradiance, as was first observed from spectroradiometric measurements of solar radiation at Garmisch-Partenkirchen/Germany (47.5° N, 0.734 km a.s.l) and modeled by [23]. Spectroradiometric measurements at Lindenberg (52.2° N, 0.127 km a.s.l) over a 4-year period had shown several cases of significantly enhanced absorption of shorter-wave UV irradiance compared to irradiance at longer wavelengths by optically very thick clouds [24]. It is generally not recommended to take column ozone measurements during the occurrence of Cb clouds, as they would falsely show too high column ozone. CMF ratios such as CMFUVB/UVA
CMFUVB/UVA = CMFUVB/CMFUVA
are helpful for understanding the wavelength dependence of solar irradiance modification by clouds. They can be calculated for any broad-band UV values from measured and modeled UV irradiances. On 4 August 2014, CMF ratios CMFUVB/UVA measured at Lindenberg were reduced to 0.35, and CMFUVB/ERY, which is derived from a relation analogous to Equation (2) by replacing UV-A by ERY, still went down to 0.77. On the other hand, CMFs were enhanced at times on the two days to 1.34 for UV-A, 1.32 for erythemal irradiance, and 1.29 for UV-B (Table 1). Those values closely correspond to CMF enhancements measured at the high-altitude site Izaña at 28.3° N, 16.5° W and 2409 m a.s.l [22]. Results of CMFs found at other sites over longer time periods, as mentioned above, report even higher maximum CMFs of 1.5 for UV-B and erythemal, and 1.3 for UV-A irradiance [7], and durations exceeding 20 minutes [12]. We note that CMFUVB/UVA for ratios UV-B/UV-A on the two days at the low-altitude site Lindenberg reached values of 1.31 and 1.33 (Table 1).

3. Results

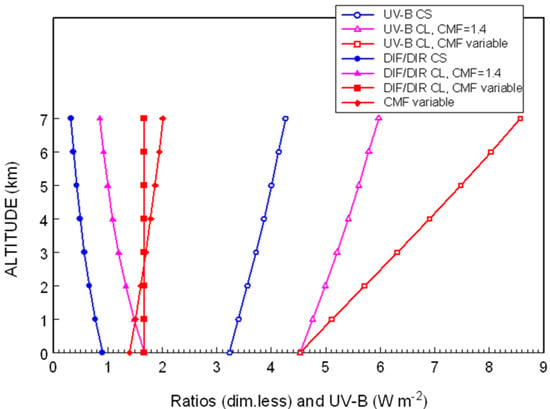
3.1. UV Irradiance Enhancement by Clouds in the Andes Region

UV-B, UV-A, and PAR irradiance measurements performed at high-mountain sites in the tropical high Andes region indicated extreme enhancements over cloudless-sky values lasting for minutes to tens of minutes [15]. Possible causes of the PAR and UV-A irradiance enhancements such as scattering by clouds and, in addition for the UV-B, small-scale Negative Ozone Anomalies (NOA), were discussed in [15]. NOAs had been found in satellite data, though not at the same time when measured UV-B irradiance values at the ground were enhanced. Due to the limited spatial resolution and poor time resolution of data from polar orbiting satellites as well as due to missing satellite observations at the locations of UV-B irradiance enhancements, no ozone values were available to derive cloudless-sky UV-B irradiance.
Figure 5. UV-B and UV-A irradiance measured on 17 January 2004 at Licancabur (symbols). Results of cloudless-sky model calculations for UV-A as well as extraterrestrial UV-A and UV-B irradiance for column ozone values of 240 DU, 180 DU, 133 DU, and 75 DU are shown as solid and dashed curves. Additional symbols (full circles and plus signs) around 11 TST indicate estimated cloudless UV-B irradiance derived from measurements assuming CMFs of 1.4 and 1.6. Note that a time correction of 1 h has been applied to the measured data shown here that was not applied in [15].
Atmosphere 06 01211 g005
A number of possible atmospheric processes that could have contributed to the NOAs such as vertically propagating gravity waves with quasi-stationary wave clouds and overshooting deep convection by Cb clouds were discussed in [15]. An additional possible cause of short-time and spatially small-scale ozone perturbations not mentioned in that paper may have been Blue Jets. They are beams of short-term electromagnetic pulses with very narrow spatial extension of about 400 m on top of Cb clouds. Cb cloud tops in the tropics can reach heights of about 18 km a.s.l, which is still about 12–13 km above the surface in the Andes region. Electrical discharges go upwards from cloud tops at a speed of 100 km/s to the lower and middle stratosphere (40 km), while gradually spreading and reaching about 3 km in diameter at 35 km altitude [25]. Their cone angle is between about 7 km and 22 km [25]. While earlier model calculations of the consequences of discharges on stratospheric ozone showed slight enhancements of ozone in the lower and mid stratosphere [26], recent modeling results of effects from electric discharges in the altitude range 18 km to 38 km in the tropical stratosphere do confirm an initial ozone increase due to NOX and N2O production by the streamer. However, this ozone increase is immediately followed by a drastic decrease in ozone volume concentration reaching more than five orders of magnitude at 18 km altitude due to production of nitrogen monoxide (NO) that destroys ozone [27]. As a result of spatial movement of the Cb clouds, the perturbed region of one Blue Jet discharge (0.4 to 3 km) can extend to several tens of kilometers [25,26] to become detectable by a satellite-based instrument with high pixel resolution. Their small spatial extension corresponds to the spatially limited and short-time phenomenon of UV-B enhancements discussed by [15]. Blue Jets are another potential cause of the existence of NOAs. Data on Blue Jets for the time and place of the extreme UV-B irradiance values were not available.
Using CMFUVA derived from measurements at Licancabur (22.48° S, 67.47° W, 5917 m a.s.l) and probable ranges of CMFUVB/UVA discussed above, we tried to determine a reasonable range of the cloud scattering contribution to the enhancement in UV-B irradiance over cloudless-sky UV-B irradiance. Figure 5 shows results of measurements and model calculations for different hypothetic column ozone values of 240 DU, 180 DU, 133 DU. and 75 DU, as well as UV-A irradiance on 17 January 2004 in dependence of true solar time (TST) (Figure 1 in [15]; the corrected date in the upper left corner of that Figure 1 in [15] should be 17 January 2004 and the time of the x axis should be corrected by +1 h). The range of column ozone values was chosen to illustrate UV-B irradiances for cloudless sky, i.e., without radiation scattering by clouds. They are not meant to imply that those column ozone values actually occurred. Highest UV-B irradiance values occur between 10:39 and 11:09 TST. They partly concur with high UV-A irradiance exceeding cloudless-sky UV-ACS with maximum CMFUVA values of 1.21–1.33, as derived from measured data and LibRadtran model calculations. They partly even exceed extraterrestrial UV-A irradiance, which was corrected for seasonal sun-earth distance variation, by 14% and 4%. Potential cloudless-sky UV-B irradiance derived from measured values by assuming a CMFUVB of 1.4 and an alternative CMFUVB of 1.6 are shown as symbols (full circles and plus signs) in Figure 5. They correspond to higher column ozone values between about 133 DU and 200 DU. CMFUVA values are shown in Table 2 for times, when UV-B irradiance or UV-B/UV-A ratios were highest. To estimate cloudless-sky UV-B irradiances, column ozone values have to be known. For the location of Licancabur, no satellite ozone values are available for that day neither from the AIRS satellite nor from EPTOMS [28]. Satellite-based ozone values at the closest distance (a few hundred kilometers) are 256 DU for EPTOMS and 222 DU for AIRS data. Globally, minimum ozone values on that day were 215 DU at 17.5° N for EPTOMS and 165 DU at 5.5° S for AIRS. Assuming a CMFUVB/UVA of 1.40, which is only slightly higher than the highest value measured during the two days at Lindenberg (Table 1), we derived from Equation (3) CMFUVB values of 1.69 and 1.35 for the times of two maximum enhancements of UV-B irradiance
CMFUVB = CMFUVA × CMFUVB/UVA
that result in cloudless-sky UV-BCS irradiance values of 4.82 and 5.82 W·m−2 (Table 3). A higher assumed CMFUVB/UVA of 1.6 would result in CMFUVB values of 1.93 and 1.54, and thus lower cloudless-sky UV-B irradiances of 4.22 and 5.09 W·m−2. The cloudless-sky estimates of UV-BCS correspond to column ozone values between about 133 DU and 200 DU depending on which of the selected CMFUVB/UVA is taken (Table 2, Table 3 and Figure 5). Assuming a slightly higher CMFUVB/UVA of 1.7 would further reduce cloudless-sky UV-BCS irradiance to values compatible with column ozone values above 200–220 DU, as measured by the EPTOMS mission. Though higher CMFs cannot be ruled out to have occurred at the site, we have not been aware of reports on such high CMFUV-B/UV-A from other sites.
The last row in Table 2 and Table 3 shows values of measured and modeled UV-A and UV-B irradiance, as well as corresponding CMFs, when cloud-induced reductions in UV irradiance were largest. CMFUVA = 0.36 and CMFUVB = 0.12 were derived from measurements and model calculations assuming a column ozone of 240 DU for the latter. The CMFUVB/UVA for ratios at the time of lowest CMFUVA and CMFUVB amounts to 0.3, which is in close correspondence to the minimum value reached on 4 August 2014 at Lindenberg during the passage of an optically thick cloud.
Table 2. UV-A and UV-B irradiances (W·m−2) measured at Licancabur on 17 January 2004 at true solar time (TST); SZA (°): solar zenith angle; UV-ACS (W·m−2) irradiance from LibRadtran cloudless-sky model calculation; cloud modification factors CMFUVA derived from Equation (1) different assumed CMFUVB/UVA ratios.
TSTSZAUV-AUV-ACSCMFUVAUV-BCMFUVB/UVA
19.4835.189.7674.371.218.151.4
211.1512.173.5376.150.977.871.4
39.4835.189.7674.371.218.151.6
411.1512.173.5376.150.977.871.6
59.4835.189.7674.371.218.151.7
611.1512.173.5376.150.977.871.7
712.325.428.0977.830.360.520.3
Table 3. Continuation of Table 2 for the same cases: CMFUVB was derived from Equation (3); ratios CMFUVB/CMFERY were assumed to be slightly smaller than ratios CMFUVB/UVA; ratios UV-BCS/ERYCS were derived from LibRadtran model calculations (Figure 9); UV index estimates were derived from Equation (6).
CMFUVBUVBCSUVBCS/UVACSCMFUVB/CMFERYUVBCS/ERYCSUVI
11.694.820.0651.35.645
21.355.820.0761.35.147
31.934.220.0571.56.235
41.545.090.0671.55.936
52.053.970.0531.46.238
61.644.790.0631.45.938
70.124.260.0550.36.811
We also looked at the possibility that the altitude above sea level and a resulting change in cloudless-sky contributions of diffuse and direct irradiance to global irradiance could have affected the CMFs. Ratios between cloudless-sky diffuse and global irradiance decrease with increasing altitude. As illustrated by the results of model calculations for cloudless-sky in Figure 6, ratios between diffuse and direct irradiance decrease from 0.90 at sea level to 0.37 at 6 km altitude a.s.l, i.e., by −41%. Only about half the number of molecules scattering solar radiation out of beam radiation is available at 6 km compared to their number at sea level. As is shown in Figure 7, cloudless-sky global UV-BCS irradiance increases from 3.23 W·m−2 at sea level to 4.14 W·m−2 at 6 km altitude a.s.l (+28%). Relative changes of ratios between diffuse and global irradiance with height are stronger at shorter wavelengths such as UV-B and erythemal irradiance than at longer wavelengths (UV-A and PAR). They are also stronger at higher SZAs.
Figure 6. Ratios of diffuse to global irradiance for UV-B, erythemal irradiance (ERY), and UV-A at SZAs of 20° and 0° in dependence of altitude above sea level for the same atmospheric conditions as in Figure 1.
Atmosphere 06 01211 g006
Clouds in the sky not occluding direct sun irradiance change diffuse sky radiance. A constant CMF of 1.4 assumed to be independent of height, enhances UV-B irradiance at sea level from 3.23 W·m−2 to 4.53 W·m−2, and at 6 km altitude a.s.l from 4.14. W·m−2 to 5.79 W·m−2 (Figure 7). As an idealized case, let us assume that multiple scattering back into beam radiation is negligible or is the same for cloudy and cloudless conditions. Diffuse irradiance of cloudy sky DIFCL is then derived from
DIFCL = CMF × (DIFCS + DIR) − DIR
Using a constant CMF = 1.4, ratios DIFCL/DIR show a slightly stronger decrease from 1.67 at sea level to 0.92 at 6 km a.s.l (−55%) (Figure 7) compared to the −41% change in the cloudless case. Air pressure and volume concentration of air molecules exponentially decrease with increasing altitude to reach about 1/10 of their sea level values at highest cloud top heights around 17–18 km a.s.l. Therefore, radiation scattering with clear sky rapidly decreases towards higher altitudes. With cloudy sky, particularly with Cb clouds, moisture is transported by updrafts towards the tropical tropopause layer TTL [29]. Overshooting deep convective clouds and small-scale ‘jumping Cirrus’ that can develop by gravity wave-breaking at their tops can even penetrate the TTL and inject tropospheric air including cloud particles to the lower stratosphere [30,31]. The volume concentration of cloud particles need not change with increasing height in the same way as the number of air molecules decreases. Cross sections, size distributions, and optical characteristics of cloud droplets and particles can vary in different ways at different heights. Assuming for simplicity that the scattering efficiency of cloud particles remains the same with increasing height such that diffuse to direct ratios for cloudy-sky DIFUVBCL/DIRUVB do not decrease, as can be assumed for the cloudless-sky case, but remain constant with increasing height or in other words, the same percentage of radiation is scattered from direct irradiance at all heights—cloud modification factors according to
C M F U V B = D I R U V B + D I F U V B C L D I R U V B × D I R U V B D I R U V B + D I F U V B C S
increase with height. In our example, CMFUVB increases from 1.4 at sea level to 1.94 at 6 km a.s.l. For clouds at higher levels, the change would still be higher. This change in CMFUVB results in an increase of global UV-BCL irradiance with cloudy sky from 4.53 W·m−2 at sea level to 8.03 at 6 km altitude a.s.l, i.e., by 77% instead of a 28% increase for a constant CMFUVB = 1.4. The higher CMFUVB for UV-B at 6 km a.s.l and the derived value of UV-BCL roughly correspond to the results of measurements shown in Table 2 and Table 3. Though we cannot exactly derive the CMFUVB and its changes at the site of Licancabur during the day on 17 January 2004, the higher maximum values of CMFUVB according to Table 3, which have not been observed at lower altitudes, appear more likely to be compatible with the measurements at Licancabur.
Figure 7. Model calculations of cloudless-sky UV-B irradiance UV-BCS; cloudy-sky irradiance. UV-BCL was derived from Equations (3) and (1) by assuming a constant CMF = 1.4, and alternatively by assuming a constant ratio DIFCL/DIR according to Equation (4), which results in a variable CMF. Results of DIF/DIR ratios and CMF according to Equation (4). Irradiance curves at the right-hand side; ratio curves at the left-hand side; SZA = 0°.
Atmosphere 06 01211 g007
Figure 8 shows average cloud-top pressure from the Atmospheric InfraRed Sounder (AIRS) and the Moderate Resolution Imaging Spectroradiometer (MODIS), both of which were carried by the near-polar, low-Earth orbit Aqua satellite, for the period October 2003 to April 2004 over South America. AIRS and MODIS cloud-top retrievals were compared with one another and with other satellite-based data sets by [32]. The satellite data sets illustrate that average cloud-top pressure reaches minimum values around 200 hPa, i.e., at largest heights, over the high Andes region, where the ground-based radiation measurements were taken. Individual satellite overpass data measurements show cloud top pressure values down to around 100 hPa (16–17 km) in that region.
Figure 8. Average cloud top pressure (hPa) between 1 October 2003 and 30 April 2004 from the Atmospheric InfraRed Sounder (AIRS) on the left and from the Moderate Imaging Spectroradiometer (MODIS) on the right.
Atmosphere 06 01211 g008

3.2. Conversion from UV-B Irradiance to Erythemal Irradiance or UV Index

Erythemal irradiance (ERY) was not measured by [15], but estimates derived from UV-B and UV-A irradiance measurements and radiative transfer model calculations to show extreme values in comparison to the range of common values. The UV index can be derived from measured UV-B irradiance, ratios between cloudless-sky UV-BCS and cloudless-sky erythemal irradiance ERYCS, and the respective ratios of cloud modification factors for UV-BCS and ERYCS.
U V I = 40 × U V B U V B c s E R Y c s × C M F U V B C M F E R Y
Tables of clear-sky ratios UV-BCS/ERYCS in dependence of SZA and column ozone were published by [33]. For cloudy skies, the ratios CMFUVB/CMFERY have to be taken into account in the conversion from UV-B irradiance to the UV index. For CMFUVB = CMFERY, Equation (6) reduces to the cloudless case. The uncertainty of an estimated UV index from measured UV-B irradiance by Equation (6) depends on the uncertainties of measured UV-B irradiance, CMF ratios, and modeled UVBCS/ERYCS ratios. For fixed column ozone, uncertainties of UVBCS/ERYCS ratios arising from uncertainties in ozone absorption cross-sections and aerosol extinction modeled by LibRadtran are estimated to be small (in the order of 1%–3%), because only ratios are concerned. Uncertainties in ratios of CMFUVB/CMFERY in Equation (6) can appreciably affect the conversion from UV-B irradiance to UV index. They are fixed to selected values in our examples (see Table 2 and Table 3). Their effect on the conversion is illustrated by the results shown in Table 2 and Table 3. For a given CMFUVB/CMFERY ratio, an uncertainty factor of a UV index estimate derived by Equation (6) is thus similar to the uncertainty factor of measured UV-B irradiance. The upper panel of Figure 9 shows cloudless-sky UV-BCS/ERYCS ratios, and the lower panel ratios UV-BCS/UV-ACS for column ozone values of 240 DU, 180 DU, 133 DU, and 75 DU derived by the LibRadtran model for 17 January 2004 at the site of Licancabur. The column ozone values down to 75 DU were selected for the model calculations to illustrate hypothetic cloudless-sky UV-B irradiance without radiation scattering by clouds. They are not meant to show that they did occur. Assuming cloud modification factors CMFUVB/UVA of 1.4 and CMFUVB/ERY of 1.3, UV-BCS/ERYCS ratios correspond to about 5.1 and 5.6 at 9:48 TST and 11:15 TST (Table 3 and Figure 9). They result in maximum UV index values of 45–47 (Table 3). If slightly higher CMFUVB/UVA ratios of 1.6 are assumed to have occurred (Table 2), measured UV-B irradiance values would correspond to slightly smaller maximum UV index values of 35–36. The maximum UV index of 43 given by [15] is within the range of UVI values estimated here.
Figure 9. Lower panel: Ratios between UV-B and UV-A irradiance measured on 17 January 2004 at Licancabur (5917 m a.s.l) are shown as red circles. Red dots show estimated cloudless-sky ratios UV-B/UV-A divided by CMFUVB/UVA = 1.4, and green plus signs indicate UV-B/UV-A ratios divided by CMFUVB/UVA = 1.6. Constant CMFs were applied to all measured irradiance ratios to show the potential cloud effect, but do not mean that constant CMF did occur for the whole day. Solid lines represent cloudless-sky model calculations of ratios UV-BCS/UV-ACS for different column ozone values of 240 DU, 180 DU, 133 DU, and 75 DU. Column ozone values were selected for illustration of hypothetic UV-B without scattering. Upper panel: Modeled cloudless-sky ratios between UV-BCS and erythemal irradiance ERYCS for the respective column ozone values (dashed).
Atmosphere 06 01211 g009

4. Conclusions

Scattering of solar radiation by clouds can drastically enhance UV irradiance at the surface. Wavelength-dependent cloud modification factors (CMF) were used to analyze UV irradiance measurements taken at sites in the high-altitude Andes region. Cloud Modification Factors CMFUVA are derived from measured UV-A irradiance and model calculations. Due to missing column ozone values at the site and time of observed UV enhancements, cloud modification factors for ratios CMFUVB/UVA derived from measurements at a low-altitude site and from the literature were used to derive a probable range of UV-B irradiance enhancements by clouds at the high-altitude site Licancabur. Measured UV-B and UV-A irradiance, and model-derived irradiance for different column ozone and SZA were used to estimate UV index values for the high Andes site. The extreme UV index of 43 derived by [15] is within the range of values derived above.
Cumulonimbus clouds with top heights close to the tropical tropopause layer at altitudes of 17–18 km a.s.l have the potential to significantly enhance diffuse UV-B radiance over its clear sky value, which is relatively small at high altitudes. If CMFs increase with altitude, larger CMFs at higher altitudes would enlarge the contribution of radiation scattering to observed extreme UV-B irradiance and thus reduce potential values of Negative Ozone Anomalies that explain the extremely high UV-B irradiance measurements. More measurements of solar UV-A and UV-B irradiance need to be performed concurrently with measurements of column ozone and cloud distribution at high time resolution in the high Andes region.

Acknowledgments

We are grateful to AIRS and MODIS mission scientists and associated NASA personnel for the production of the data used in this research effort. Data availability accessible by Giovanni [34] is greatly acknowledged. We gratefully acknowledge funding of the High Lakes Project by the NASA Astrobiology Institute. We thank Ralf Becker from the Meteorological Observatory Lindenberg for the AOD data of the AErosol RObotic NETwork (AERONET). We also thank the reviewers for their careful reviews of the manuscript.

Author Contributions

Uwe Feister provided spectroradiometric measurements at the low-altitude site and model calculations, and interpreted the data for cloud modification issues. Nathalie Cabrol performed the UV radiation measurements and data analysis for the high-altitude sites in the Andes region. Donat Häder developed the Eldonet instruments used at high altitudes in the Andes and contributed to the interpretation of results.

Conflicts of Interest

The authors declare no conflict of interest.

Abbreviations / Nomenclature

AIRS
Atmospheric InfraRed Sounder
a.s.l
above sea level
Cb
Cumulonimbus
CF
cloud fraction, i.e., percentage of the upper hemisphere covered by clouds
CMF
cloud modification factor (dimensionless)
CL
index for cloudy sky
CS
index for cloudless sky
DIF, DIFFUSE
diffuse irradiance in the respective wavelength region (W·m−2)
DIR
direct irradiance in the respective wavelength region (W·m−2)
DU
Dobson unit
EPTOMS
Earth Probe Total Ozone Mapping Spectrometer
ERY
erythemal irradiance derived from spectral irradiance weighted by the erythemal action spectrum according to [8]
EXT
extraterrestrial irradiance in the respective wavelength region (W·m−2)
GLOBAL
global irradiance component in the respective wavelength region (W·m−2)
MEAS
index for measured irradiance
MOD
index for model calculation using the LibRadtran radiative transfer model
MODIS
Moderate Imaging Spectroradiometer
PAR
Photosynthetic Active Radiation defined as irradiance from 400 to 700 nm (W·m−2)
sc
index for irradiance including scattered radiation from clouds
SZA
solar zenith angle
TST
True Solar Time
TTL
tropical tropopause layer
UTC
Universal Time Coordinated
UV-A
irradiance from 315 to 400 nm (W·m−2)
UV-B
irradiance from 280 to 315 nm (W·m−2)
UVI
UV index (dimensionless) defined as the 40 fold of erythemal irradiance in W·m−2

References

  1. Gu, L.; Fuentes, J.D.; Garstang, M.; Tota da Silva, J.; Heitz, R.; Sigler, J.; Shugart, J.H. Cloud modulation of surface solar irradiance at a pasture site in southern Brazil. Agr. For. Meteorol. 2001, 106, 117–129. [Google Scholar] [CrossRef]
  2. Piacentini, R.D.; Cede, A.; Barcena, H. Extreme solar total and uv irradiances due to cloud effect measured near the summer solstice at the high-altitude desertic plateau puna of Atacama (Argentina). J. Atmos. Sol.-Terr. Phys. 2003, 65, 727–731. [Google Scholar] [CrossRef]
  3. Piacentini, R.D.; Salum, G.M.; Fraidenraich, N.; Tiba, C. Extreme total solar irradiance due to cloud enhancement at sea level of the Ne Atlantic Coast of Brazil. Renew. Energ. 2011, 36, 409–412. [Google Scholar] [CrossRef]
  4. Yordanov, G.H.; Midtgård, O.-M.; Saetre, T.O.; Nielsen, H.K.; Norum, L.E. Overirradiance (Cloud Enhancement) events at high latitudes. IEEE J. Photovoltaics 2013, 3, 271–277. [Google Scholar] [CrossRef]
  5. Mims, F.E., III; Frederick, J.E. Cumulus clouds and UV-B. Nature 1994, 371, 291. [Google Scholar] [CrossRef]
  6. Sabburg, J.M.; Long, C.N. Improved sky imaging for studies of enhanced uv irradiance. Atmos. Chem. Phys. Discuss. 2004, 4, 6213–6238. [Google Scholar] [CrossRef]
  7. Sabburg, J.; Calbó, J. Five Years of cloud enhanced surface uv radiation measurements at two sites (in the Northern and Southern Hemispheres). Atmos. Res. 2009, 93, 902. [Google Scholar] [CrossRef]
  8. McKinlay, A.F.; Diffey, B.L. A reference action spectrum for ultraviolet induced erythema in human skin. CIE-J. 1987, 6, 17–22. [Google Scholar]
  9. Webb, A.R.; Slaper, H.; Koepke, P.; Schmalwieser, A.W. Know your standard: clarifying the CIE erythema action spectrum. Photochem. Photobiol. 2011, 87, 483–486. [Google Scholar] [CrossRef] [PubMed]
  10. Schwander, H.; Koepke, P.; Kaifel, A.; Seckmeyer, G. Modification of spectral UV irradiance by clouds. J. Geophys. Res. 2002, 107, D16. [Google Scholar] [CrossRef]
  11. Lovengreen, C.; Fuenzalida, H.A.; Videla, L. On the spectral dependency of UV radiation enhancements due to clouds in Valdivia, Chile (39.8° S). J. Geophys. Res. 2005, 110, D14207. [Google Scholar] [CrossRef]
  12. Sabburg, J.M.; Parisi, A.V. Spectral dependency of cloud enhanced UV irradiance. Atmos. Res. 2006, 81, 206–214. [Google Scholar] [CrossRef]
  13. Lopez, M.L.; Palancar, G.G.; Toselli, B.M. Effect of different types of clouds on surface UV-b and total solar irradiance at southern mid-latitudes: cmf determinations at Cordoba, Argentina. Atmos. Environ. 2009, 43, 3130–3136. [Google Scholar] [CrossRef]
  14. Gelsor, N.; Pingcuo, N.; Wangmu, T.; Kjeldstad, B.; Chen, Y.C.; Frette, Ø.; Stamnes, J.J.; Bhattarai, B.K.; Dahlback, A. Solar UV irradiance measurements at four sites in Tibet. J. Ins. Eng. 2011, 8, 75–86. [Google Scholar]
  15. Cabrol, N.A.; Feister, U.; Häder, D.-P.; Piazena, H.; Grin, E.A.; Klein, A. Record solar UV irradiance in the tropical Andes. Front. Environ. Sci. 2014, 2, 1–6. [Google Scholar] [CrossRef]
  16. Balis, D.S.; Zerefos, C.S.; Kourtidis, K.; Bais, A.F.; Hofzumahaus, A.; Kraus, A.; Schmitt, R.; Blumthaler, M.; Gobbi, G.P. Measurements and modeling of photolysis rates during the Photochemical Activity and Ultraviolet Radiation (PAUR) II campaign. J. Geophys. Res. 2002, 107, 8138. [Google Scholar] [CrossRef]
  17. Zerefos, C.S.; Kourtidis, K.A.; Melas, D.; Balis, D.; Zanis, P.; Katsaros, L.; Mantis, H.T.; Repapis, C.; Isaksen, I.; Sundet, J.; et al. Photochemical activity and solar ultraviolet radiation (PAUR) modulation factors: An overview of the project. J. Geophys. Res. 2002, 107, 8134. [Google Scholar] [CrossRef]
  18. Mayer, B.; Kylling, A. Technical note: The LibRadtran software package for radiative transfer calculations-description and examples of use. Atmos. Chem. Phys. 2005, 5, 1855–1877. [Google Scholar] [CrossRef]
  19. den Outer, P.N.; Slaper, H.; Kaurola, J.; Lindfors, A.; Kazantzidis, A.; Bais, A.; Feister, U.; Junk, J.; Janouch, M.; Josefsson, W. Reconstructing of erythemal ultraviolet radiation levels in Europe for the past four decades. J. Geophys. Res. Atmos. 2010, 115, 1–17. [Google Scholar] [CrossRef]
  20. Staiger, H.; den Outer, P.; Bais, A.; Feister, U.; Johnsen, B.; Vuilleumier, L. Hourly resolved cloud modification factors in the ultraviolet. Atmos. Chem. Phys. 2008, 8, 2493–2508. [Google Scholar] [CrossRef]
  21. Feister, U.; Shields, J. Cloud and Radiance Measurements with the VIS/NIR Daylight Whole Sky Imager at Lindenberg (Germany). Meteorol. Zeitschr. 2005, 14, 627–639. [Google Scholar] [CrossRef]
  22. Feister, U.; Kaifel, A.; Grewe, R.-D.; Kaptur, J.; Reutter, O.; Wohlfart, M.; Gericke, K. Fast measurements of solar spectral irradiance-first performance results of two novel spectroradiometers. Opt. Eng. 2005, 44, 1–9. [Google Scholar]
  23. Mayer, B.; Kylling, A.; Madronich, S.; Seckmeyer, G. Enhanced absorption of UV radiation due to multiple scattering in clouds-experimental evidence and theoretical explanation. J. Geophys. Res. 1998, 103, 241–254. [Google Scholar] [CrossRef]
  24. Feister, U.; Laschewski, G.; Grewe, R.D. UV Index Forecasts and Measurements of Health-effective Radiation. J. Photochem. Photobiol. Bio. 2011, 102, 55–68. [Google Scholar] [CrossRef] [PubMed]
  25. Mishin, E. Ozone Layer Perturbation by a Single Blue Jet. Geophys. Res. Lett. 1997, 24, 1919–1922. [Google Scholar] [CrossRef]
  26. Pasko, V.P.; George, J.J. Three-dimensional modeling of blue jets and blue starters. J. Geophys. Res. 2002, 107, 1458. [Google Scholar] [CrossRef]
  27. Winkler, H.; Notholt, J. A Model study of the plasma chemistry of stratospheric blue jets. J. Atmos. Sol.-Terr. Phys. 2015, 122, 75–85. [Google Scholar] [CrossRef]
  28. Nirala, M. Multi-sensor data fusion and comparison of total column ozone. Int. J. Remote Sens. 2007, 29, 15, 4553–4573. [Google Scholar] [CrossRef]
  29. Hassim, M.E.E.; Lane, T.P. A Model study on the influence of overshooting convection on ttl water vapour. Atmos. Chem. Phys. 2010, 10, 9833–9849. [Google Scholar] [CrossRef]
  30. Wang, P.K.; Su, S.H.; Charvát, Z.; Šťástka, J.; Lin, H.M. Cross tropopause transport of water by mid-latitude deep convective storms: A review. Terr. Atmos. Ocean. Sci. 2011, 22, 447–462. [Google Scholar] [CrossRef]
  31. Aumann, H.H.; Gregorich, D.; DeSouza-Machado, S. AIRS observations of deep convective clouds. In Proceedings SPIE 6301of the Atmospheric and Environmental Remote Sensing Data Processing and Utilization II: Perspective on Calibration/Validation Initiatives and Strategies, San Diego, CA, USA, 13 August 2006.
  32. Weisz, E.; Li, J.; Menzel, J.W.; Heidinger, A.K.; Kahn, B.H.; Liu, C.-Y. Comparison of AIRS, MODIS, CloudSat and CALIPSO cloud top height retrievals. Geophys. Res. Lett. 2007, 34, L17811. [Google Scholar] [CrossRef]
  33. McKenzie, R.; Smale, D.; Kotkamp, M. Relationship between UVB and erythemally weighted radiation. Photochem. Photobiol. Sci. 2004, 3, 252–256. [Google Scholar] [CrossRef] [PubMed]
  34. Acker, J.G.; Leptoukh, G. Online Analysis enhances use of NASA earth science data. Eos Trans. AGU 2007, 88, 14–17. [Google Scholar] [CrossRef]

