1. Introduction
Atmospheric particulates, with diameters ranging from 1 nm to 100 μm, play a crucial role in regional and global climate change, and public health, including respiratory problems and reduced lung function [
1,
2,
3,
4]. In addition, fine particles, generally referred as PM
1 and PM
2.5, and PM
10 are considered to be the primary reason for the degradation of visibility [
5]. Black carbon (BC), also referred to as elemental carbon, contributes to the temperature and climate of the Earth because its absorption of solar energy alters the radiative properties of the atmosphere [
6,
7], and contributes to global warming [
8].
The physical and optical properties of particulate matter (PM) have been explored in the urban areas of China [
9,
10]. Most research on the characteristics of particulate matter is based on data gathered in the Sichuan Basin [
11], the Yangtze River delta [
12,
13], and Northern China [
14,
15,
16]. When considering the impact factors of PM, analysis of the chemical characteristics of ultrafine particles, such as inorganic ions, shows that inorganic water soluble ions constitute 48.9% of the PM
1, while second species in PM
1 are in the form of NH
4NO
3 and NH
4HSO
4 [
17]. Furthermore, although the correlation between BC levels and those of traffic related gaseous pollutants, such as CO, NO2, and NO, has been shown to be higher than that between BC levels and PM across different European cities [
18], it was concluded that BC, rather than PM, may be an effective additional air quality indicator for estimating the health risks of air quality [
19]. However, BC particle has a huge impact on environment in Wuhan which has a flourishing steel industry in urban area. Thus, it is of vital significance to explore the correlation between PM and BC in Wuhan, since the relationship between PM and BC remains unclear.
In this study, the hourly concentrations of PM1, PM2.5, PM10, and BC were measured in Wuhan in 2014. Based on the average monthly monitored data for PM, this study analyzes the characteristics of temporal distribution and correlations between PM1, PM2.5, and PM10. The local aspect analysis of the correlation between PM and BC over four seasons indicates that it is stronger in summer and autumn than in winter and spring. Further than that, this paper selects two days in winter and uses them as an example to explore the key factors causing Wuhan’s severe pollution in winter.
2. Study Area and Instruments
2.1. Site and Meteorology
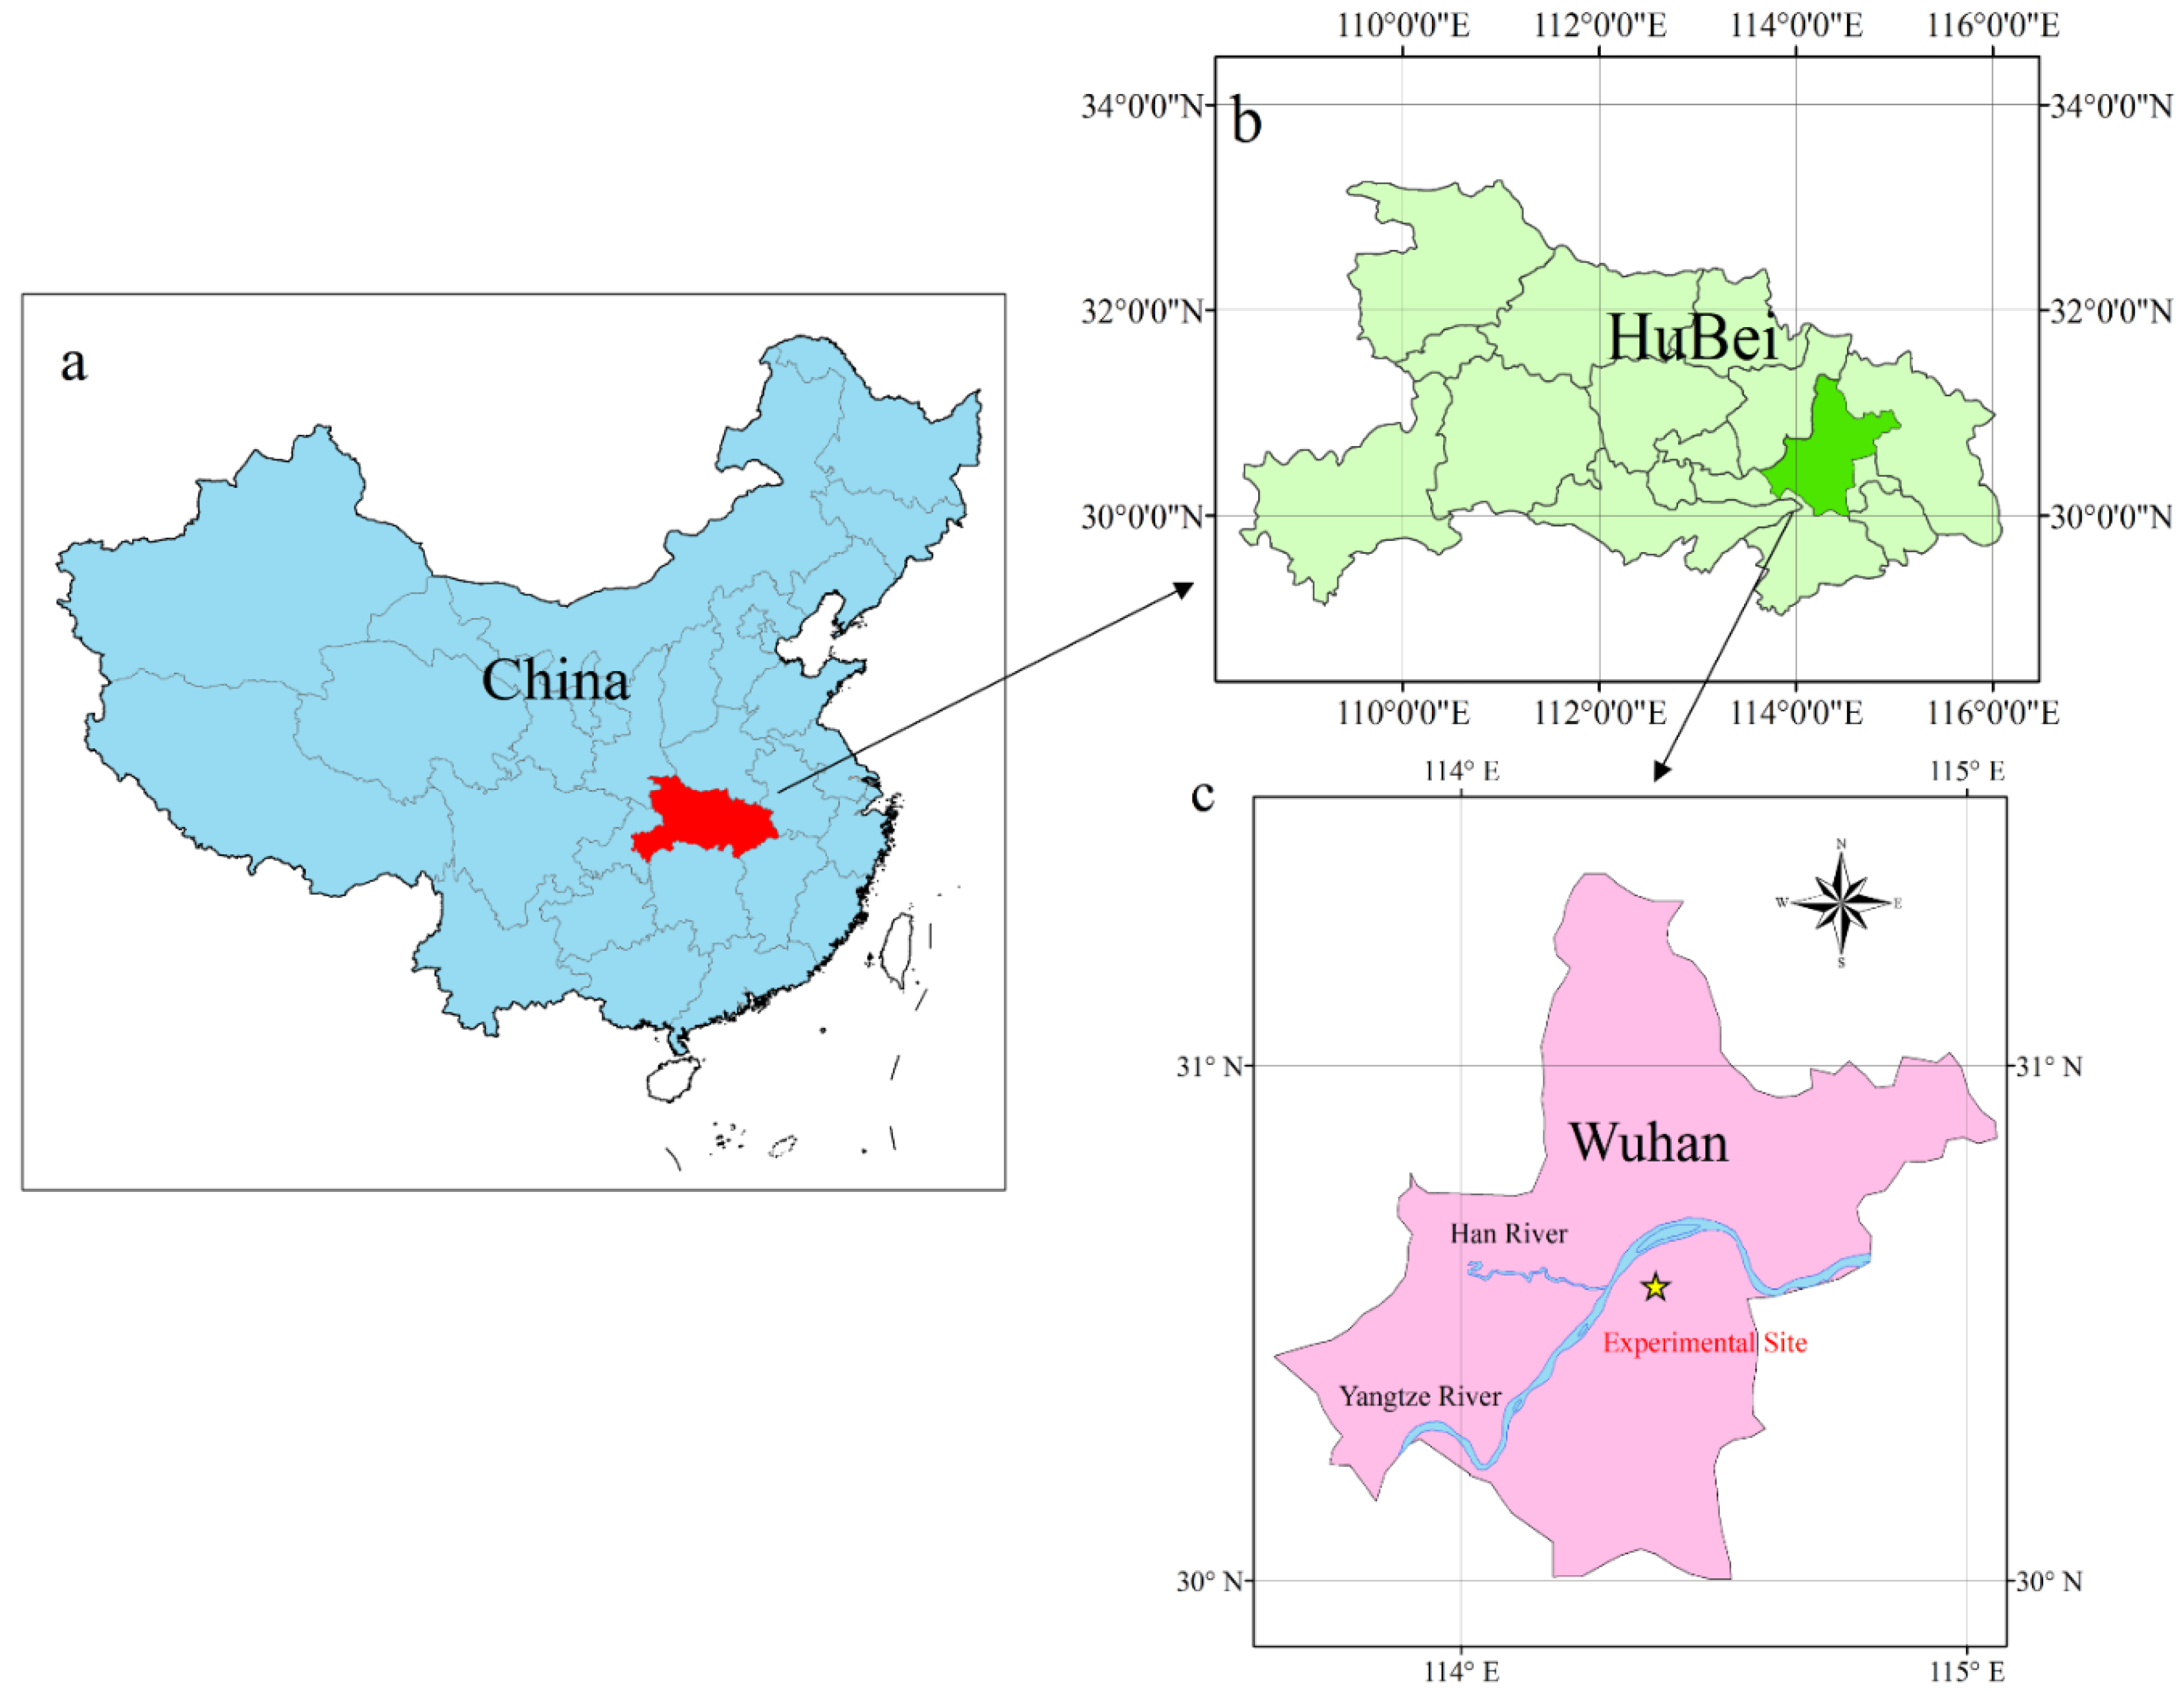
Geographically situated at the confluence of the Yangtze and Han rivers, Wuhan lies in Central China (Hubei Province), which is divided into three administrative regions: Hankou, Wuchang, and Hanyang (
Figure 1) [
20]. Wuhan, growing rapidly in past decades, has a relatively high level of industrialization with the production of steel from Wuhan Iron and Steel Corporation ranking eighth, globally, in 2014 [
21]. The instruments for monitoring atmospheric particulates are installed in the attic of the Laboratory of Information in Wuhan University (30°32′N, 114°21′E), which is located in an urban area of Wuhan. Influenced by its typical subtropical monsoon climate, Wuhan possesses well-defined seasons with abundant precipitation in summer and relatively low precipitation in winter [
22].
Figure 1.
Geographical location of the experimental area: (a) location of Hubei Province in China; (b) location of Wuhan in Hubei Province; and (c) experimental site in Wuhan.
Figure 1.
Geographical location of the experimental area: (a) location of Hubei Province in China; (b) location of Wuhan in Hubei Province; and (c) experimental site in Wuhan.
2.2. Measurements and Instrumentation
Particle mass concentrations of PM
1, PM
2.5, and PM
10 were measured and recorded every 5 min using a Grimm-180 device (German Online PM Monitor) deployed in the laboratory. This instrument uses an optical method to measure the angle of light scattering caused by each particle, when a semiconductor laser is used as light source [
23]. After sufficient amplification of the electric signal conducted by the light pulse through the diode, particle size is classified into 31 size distribution channels, which define a weighting curve of PM
1, PM
2.5, and PM
10, with a measuring range of 1–1500 μg/m
3 and a measuring accuracy of ± 2%. In the period from December 2013 to December 2014, 202 groups of valid PM data have been recorded, excluding missing data, abnormal data, and instrument calibration times.
BC mass concentration was measured by an Aethalometer (model AE-31, Magee Scientific), which estimates the mass concentration of BC that accumulates on a 1.6 cm quartz fiber filter on a 2 min time base [
13]. To ensure the quality of data, the service behavior of the Aethalometer, as well as the quartz filtration membrane, filter and the stability of the light source, has been checked daily. Furthermore, to ensure its accuracy and avoid season-dependent measurement artifacts, there was calibration including blank measurements and flow rate calibration in every three months. The raw data format includes seven channels acquired via wavelengths of 350 nm, 470 nm, 521 nm, 590 nm, 660 nm, 880 nm, and 950 nm. However, this study utilizes the measurements taken at 880 nm, since that is identified as the standard channel for BC and is used exclusively to determine BC concentration. During December 2013 to December 2014, 251 sets of valid BC data have been acquired.
Daily meteorological data, including precipitation, wind velocity, and temperature, was gleaned from a weather station in Wuhan, which is attached to the China meteorological administration.
3. Results and Analysis
3.1. Monthly and Seasonal Variations in PM1, PM2.5, and PM10
Figure 2 and
Figure 3 show the local monthly and seasonal average mass concentrations of PM
1, PM
2.5, and PM
10, respectively, combined with monthly precipitation in 2014.
Figure 2 reveals the trend of monthly average mass concentration of PM from January to December, is consistent and takes a concave parabolic form, which is approximatively opposite to the trend of precipitation. The peak values of monthly average mass concentrations of PM
1, PM
2.5, and PM
10 appear in January, reaching 128 μg/m
3, 146 μg/m
3, and 202 μg/m
3, respectively, while the trough values are in August and September, reaching 22 μg/m
3, 25 μg/m
3, and 27 μg/m
3. On the contrary, the monthly total precipitation in July, August, and September are all over 1400 mm, while those in December and January are both less than 50 mm. Compared with nationwide PM data in China, the peak values of PM in Wuhan exceed the nationwide average and might be caused by rapid development in Central China including Wuhan, while the lowest values of PM here are lower than the nationwide average, which can be explained by the abundant precipitation guided by summer monsoons. It is observed that mass concentrations of PM
2.5 in January, February, March, November, and December exceed the daily average PM
2.5 upper limit of 75 μg/m
3 as defined by the ambient air quality standard GB3095-2012, illustrating the severity of PM
2.5 pollution in the Wuhan urban area during late autumn, early spring, and winter.
Figure 2.
Monthly variations of PM1, PM2.5, and PM10 mass concentration with monthly total precipitation.
Figure 2.
Monthly variations of PM1, PM2.5, and PM10 mass concentration with monthly total precipitation.
Figure 3 illustrates local seasonal characteristics in the seasonal average mass concentration of PM
1, PM
2.5, and PM
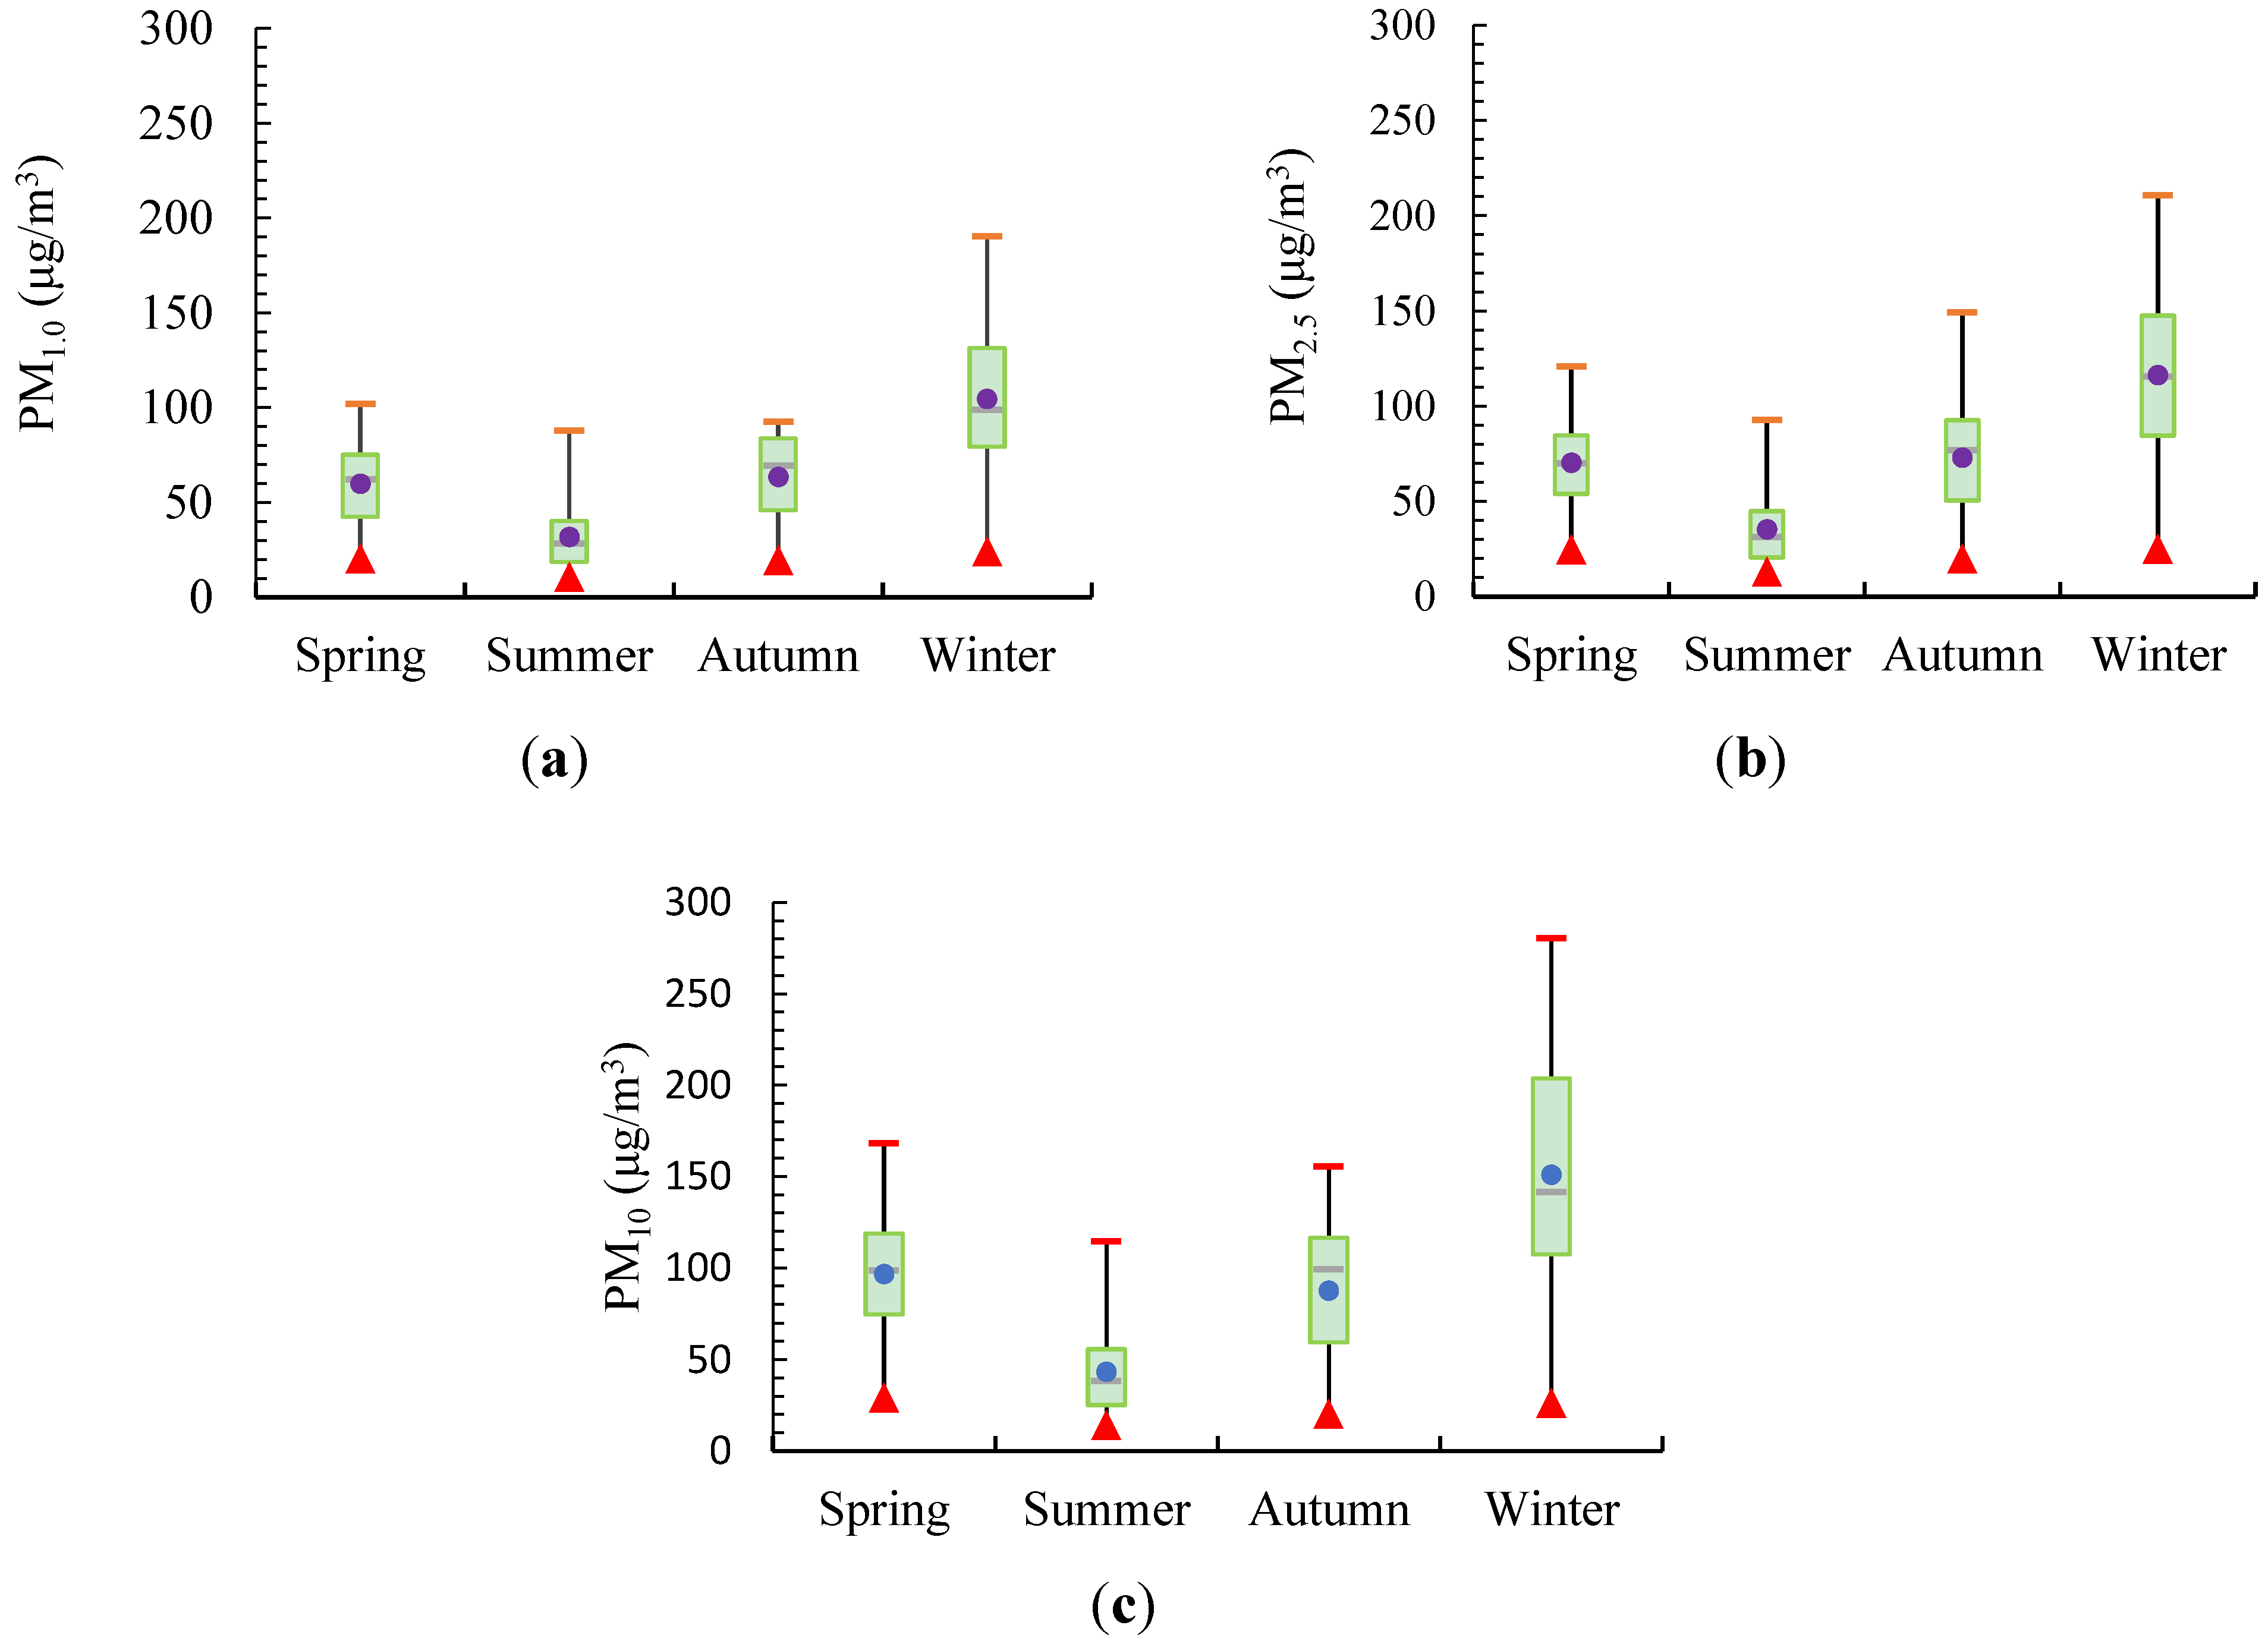
10, respectively. In this study, spring consists of the months of March, April, and May; summer refers to June, July, and August; autumn includes September, October, and November; winter includes December, January, and February.
Figure 3.
Seasonal characteristics of PM1 (a), PM2.5 (b), and PM10 (c) mass concentration. The purple dot represents the mean value of PM in each season and the box represents the twenty-fifth and seventy-fifth percentiles (upper and lower edges of box); the short red horizontal line represents the maximum; the red triangle represents the minimum, and the horizontal green line shows the median value of PM in each season.
Figure 3 indicates that regardless of particle size, summer has the lowest PM mass concentration. In contrast, winter has a significantly higher level of PM mass concentration, probably caused by the stagnant atmosphere which leads to pollution’s cumulative effect in winter [
17]. From the figures above, based on the boxplot, which graphically depict numerical data via quartiles, it is demonstrated that there was a tiny minority of large values in summer, since the mean and median values is below the middle position between maximum and minimum, which could result from longstanding high temperature and low pressure with occasional precipitation in summer.
3.2. Relationships between PM1, PM2.5, and PM10
Figure 4 illustrates the correlations between PM
1 and PM
2.5, and those between PM
2.5 and PM
10. After conducting a linear regression of 202 groups of valid samples, the local aspect correlation coefficients between them were calculated to be 0.99 and 0.94 while the R-squared of the regression model reached 0.98 and 0.89 respectively, which emphasizes the significance of correlations between PM
1, PM
2.5, and PM
10 in Wuhan. The remarkable coherence between PM
1 and PM
2.5 in
Figure 4a, which demonstrates the proportion of PM
1 contained within PM
2.5 is stable, high, and reaching roughly 90%, should not be ignored. This result directly proves that ultrafine particles with diameters less than 1 μm may be the main component of PM
2.5 in the Wuhan urban area. In
Figure 4b, there is a lower correlation between PM
2.5 and PM
10 when mass concentration of PM
10 increases, which indicates that fine particles with diameters less than 2.5 μm might not be the only factor contributing to the increase in PM
10.
Figure 4.
Correlation between mass concentration of PM1 and PM2.5 (a), PM2.5, and PM10 (b).
Figure 4.
Correlation between mass concentration of PM1 and PM2.5 (a), PM2.5, and PM10 (b).
3.3. Relationships between PM2.5, PM10, and Black Carbon (BC) in Seasonal Scale
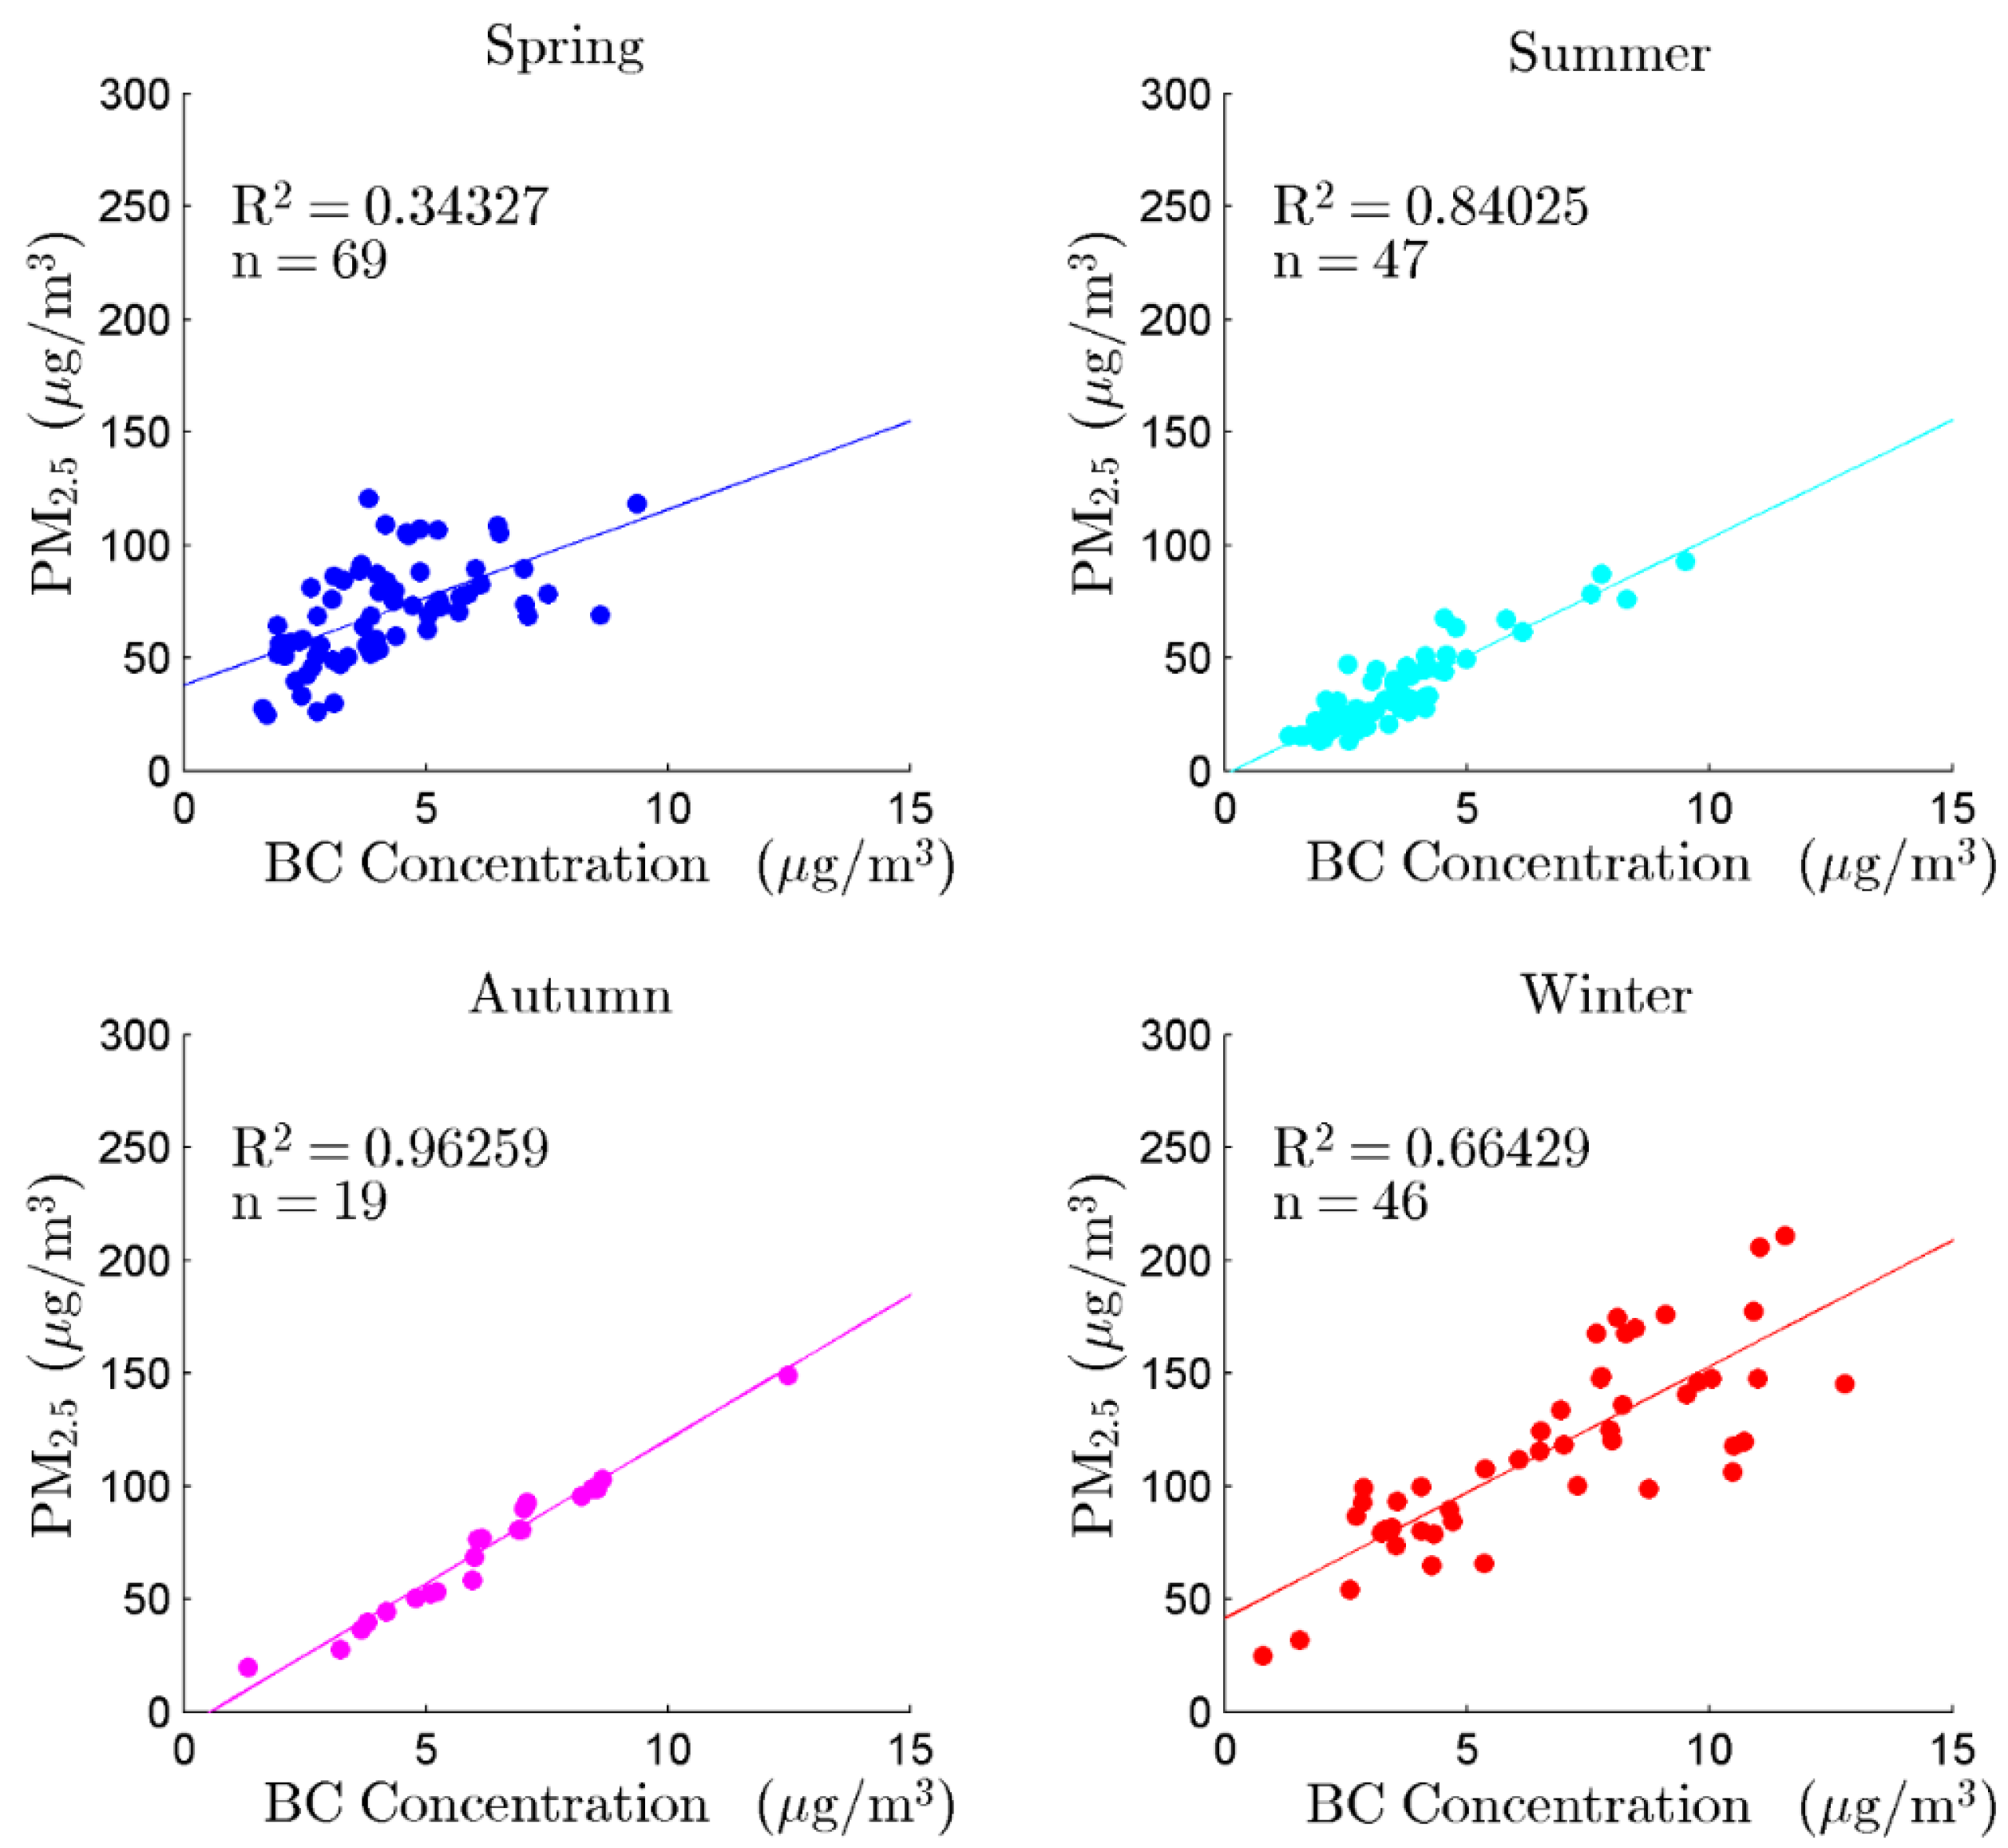
Figure 5 demonstrates the local aspect relationship between the mass concentrations of PM
2.5 and BC in each season, showing a strong correlation in summer and autumn, thus indicating the proportion of BC contained in PM
2.5 is relatively steady. However, the role of BC in contributing to the increase in PM
2.5 is unclear, and requires further research.
Similar to
Figure 5,
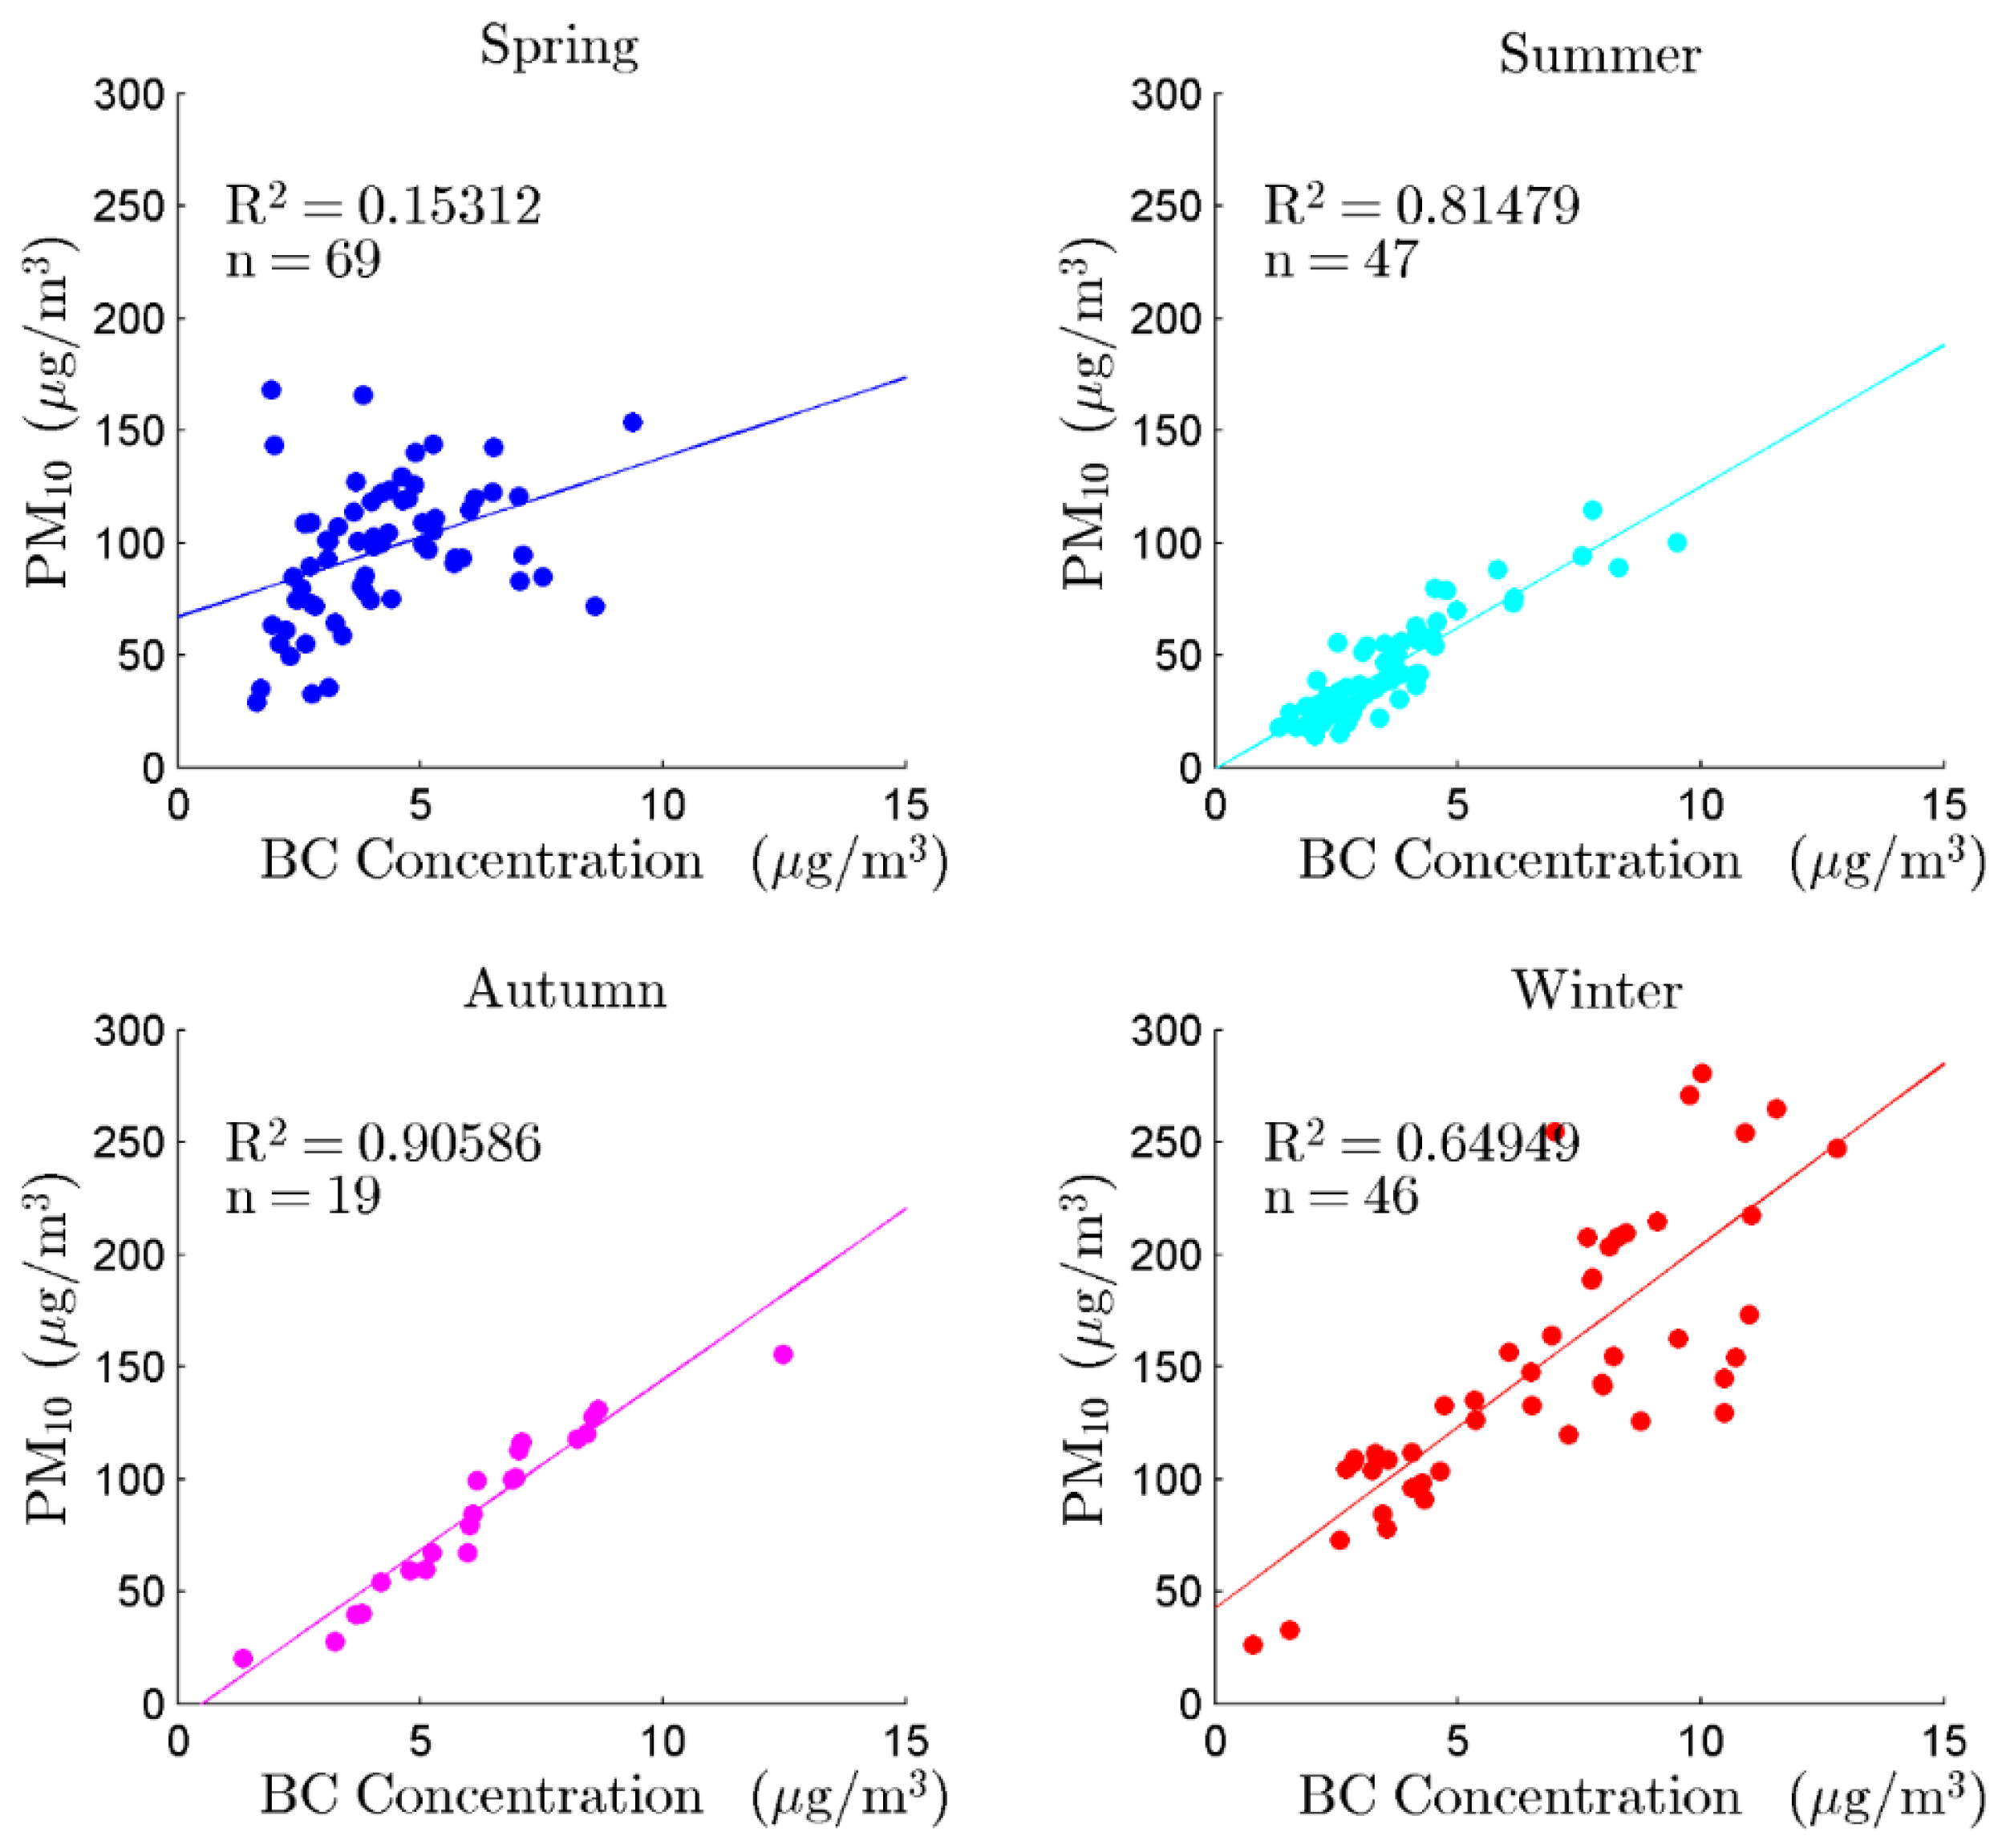
Figure 6 demonstrates the correlation between the mass concentration of PM
10 and BC in each season. It clearly indicates that although the correlation between PM
10 and BC is similar to that between PM
2.5 and BC, the coherence of PM
10 and BC is lower. It should be noted that due to topographic factors, Wuhan becomes a passage for cold air coming down from the north and west in winter and spring, when weather changes are fierce [
24,
25]. The ambiguous relationship between PM and BC could be explained by the fact that combined with the stagnant atmosphere at low temperatures in winter and spring [
26], the mass concentrations of PM and BC are potentially influenced by both autochthonous and input particles. It could also be concluded that the proportion of BC in PM is relatively stable in summer and autumn, because of dilution by clean air flow from low latitudes and a maritime airstream [
17], which cause strong atmospheric turbulence and precipitation [
27].
Figure 5.
Correlation between the mass concentrations of PM2.5 and black carbon (BC).
Figure 5.
Correlation between the mass concentrations of PM2.5 and black carbon (BC).
Figure 6.
Correlation between the mass concentrations of PM10 and black carbon (BC).
Figure 6.
Correlation between the mass concentrations of PM10 and black carbon (BC).
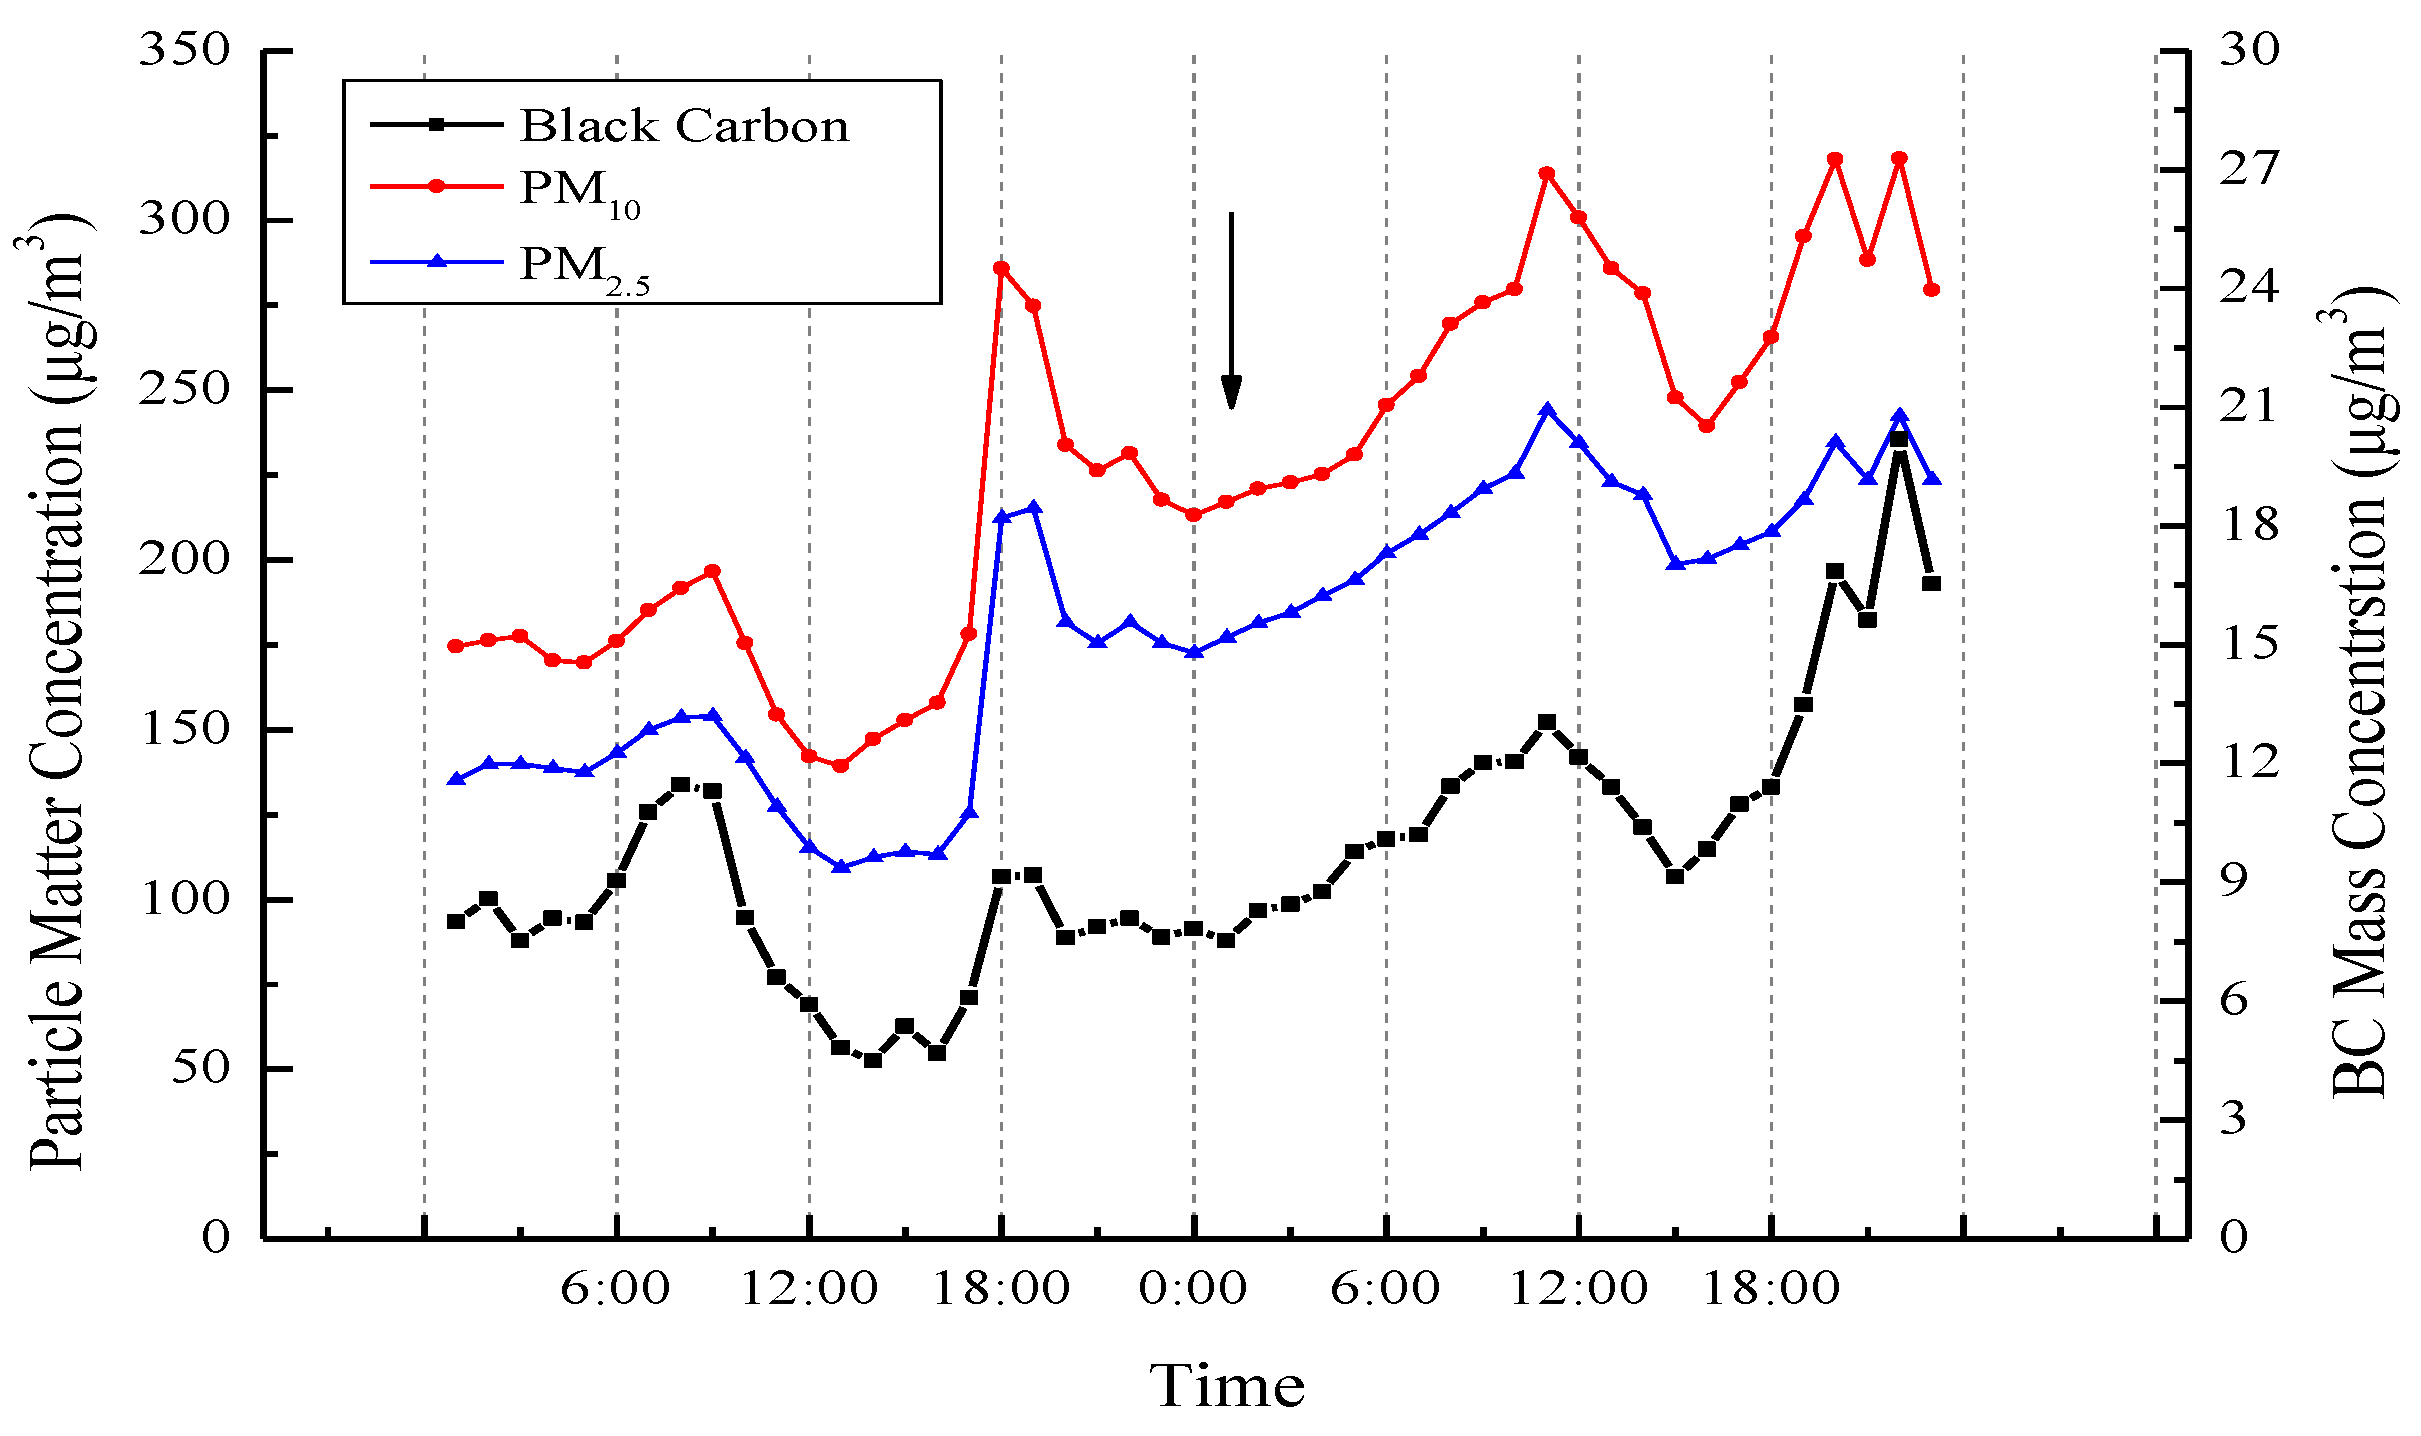
3.4. Diurnal Variation of PM and BC in Winter
Figure 7 displays the diurnal pattern of mass concentrations of PM
2.5, PM
10, and BC from data observed in winter from 12 January to 13 January in 2014, since the increase in pollution levels was steady during these two days. During this period, the weather was partly cloudy with a gentle breeze and no precipitation. The variation tendencies of PM and BC show similar profiles. From the diurnal scale, it could be demonstrated as a bimodal distribution that mass concentrations of PM and BC increased obviously during morning traffic rush hour starting at around 06:00 local time (LT) and evening traffic rush hour commencing around 17:00 LT. It can be conjectured that traffic emissions should be responsible for this bimodal increase. On a macroscale, it was observed that the mass concentrations of PM and BC increased during the two days. The most probable cause for this increase was pollutant input from industrial cities around Wuhan with intensive coal combustion, displayed by the arrow in
Figure 7 when the mass concentrations of PM and BC rose slowly during the night. In order to verify the accuracy of the inference, the meteorological record in these two days had been referred to that the average wind speed was 1.6 m/s and 0.7 m/s respectively. Although the average wind speed was gentle, winds coming to Wuhan was from the east at most of time. Since the cities which are famous for smelting, namely Huangshi and Daye, are to the east of Wuhan, exogenous pollutants from the east should be responsible for the rise at night in
Figure 7. Furthermore, as the convection and fluctuation of atmosphere were relatively weaker, the Planetary Boundary Layer Height (PBLH) was usually shallow in winter [
28], reducing the diffusion effect and accelerating the accumulation of pollution. In conclusion, traffic emissions in rush hour, exogenous pollutants, and the shallow PBLH with stagnant atmosphere contribute to severe winter pollution in Wuhan.
Figure 7.
Diurnal variation in mass concentrations of PM2.5, PM10 and BC in winter.
Figure 7.
Diurnal variation in mass concentrations of PM2.5, PM10 and BC in winter.
4. Conclusions
In this article, the Grimm-180 measurements of PM1, PM2.5, and PM10 and the Aethalometer measurements BC were collected over one year from December 2013 to December 2014 in urban Wuhan, Central China. Through a series of analyses, conclusions have been conducted as follows:
(1) Mass concentrations of PM1, PM2.5, and PM10 from Wuhan were higher in winter than in summer. The peak values of monthly average mass concentrations of PM1, PM2.5, and PM10 occurred in January, reaching 128 μg/m3, 146 μg/m3, and 202 μg/m3, respectively. The trough values occurred in August or September reaching 22 μg/m3, 25 μg/m3, and 27 μg/m3, respectively. The concave parabolic pattern of the distribution can be explained by the abundant precipitation in summer and the cumulative effects of pollution in winter, due to the typical subtropical monsoon climate in Wuhan.
(2) The local aspect correlation coefficients and R-squared of the linear regression model between PM1 and PM2.5 are quite high, reaching 0.99 and 0.98, respectively, showing remarkable coherence between PM1 and PM2.5. Furthermore, the discovery that the proportion of PM1 contained within PM2.5 is rather stable and high, reaching roughly 90%, directly proves that ultrafine particles with a diameter less than 1 μm may be the primary component of PM2.5 in Wuhan urban area. However, there is decreasing coherence between PM2.5 and PM10 when mass concentration of PM10 increases, which implies that fine particles with a diameter less than 2.5 μm might not be the only contributor to PM10.
(3) The local seasonal relationship between PM and BC illustrates that the proportion of BC contained in PM2.5 and PM10 is relatively steady in summer and autumn. This might be caused by abundant precipitation that makes the composition of aerosols stable. In contrast, because of the stagnant atmosphere at low temperatures in winter and spring, and topographic factors, the relationship between PM and BC in winter and spring is ambiguous.
(4) An observation of the diurnal variation of PM and BC was conducted to explore the key factors causing Wuhan’s severe pollution and the definite relationship between PM and BC in winter. After analysis of the diurnal variation of PM and BC, it has been determined that traffic emissions during rush hour, exogenous pollutants, and shallow Planetary Boundary Layer Height with stagnant atmosphere are very likely to be the key factors contributing to the severe pollution of Wuhan in winter.
To sum up, a preliminary analysis of PM and their relation to BC has been made in Wuhan, representative of central plains in China, combined with climate, meteorological factors, topographic factors, and atmospheric factors. More detailed measurement, not only of particles’ chemical composition, but also of BC’s physical attributes, are still necessary to further study the cumulative effect and diffused effect of PM pollution in this region. The conclusion in this study could offer guidance of emissions control in cities of heavy industry in China.
Acknowledgments
This study was supported financially by the program of Key Laboratory for National Geographic Census and Monitoring, National Administration of Surveying, Mapping and Geo-information (No. 2014NGCM), the China Postdoctoral Science Foundation (Grant No. 2015M572198) and the NSFC Program (41401498, 41571344 and 10978003). We express our sincere gratitude to all members of the Lidar group in LIESMARS, Wuhan University, China.
Author Contributions
The study was carried out in collaboration between all authors. Wei Gong and Tianhao Zhang designed the research topic. Tianhao Zhang conducted the experiment and wrote the paper. Zhongmin Zhu, Yingying Ma and Xin Ma checked the experimental results. Wei Wang provided the experimental data. All authors agreed to submission of the manuscript.
Conflicts of Interest
The authors declare no conflict of interest.
References
- Charlson, R.J.; Schwartz, S.; Hales, J.; Cess, R.; Coakley, J.J.; Hansen, J.; Hofmann, D. Climate forcing by anthropogenic aerosols. Science 1992, 255, 423–430. [Google Scholar] [CrossRef] [PubMed]
- Charlson, R.J.; Heintzenberg, J. Aerosol Forcing of Climate; John Wiley & Sons: New York, NY, USA, 1995. [Google Scholar]
- Pope, C.A., III; Dockery, D.W. Acute health effects of PM10 pollution on symptomatic and asymptomatic children. Am. Rev. Respir. Dis. 1992, 145, 1123–1128. [Google Scholar] [CrossRef] [PubMed]
- Baker, K.R.; Foley, K.M. A nonlinear regression model estimating single source concentrations of primary and secondarily formed PM2.5. Atmos. Environ. 2011, 45, 3758–3767. [Google Scholar] [CrossRef]
- Sloane, C.S.; Watson, J.; Chow, J.; Pritchett, L.; Richards, L.W. Size-segregated fine particle measurements by chemical species and their impact on visibility impairment in denver. Atmos. Environ. Part A. Gen. Top. 1991, 25, 1013–1024. [Google Scholar] [CrossRef]
- Jacobson, M.Z. Strong radiative heating due to the mixing state of black carbon in atmospheric aerosols. Nature 2001, 409, 695–697. [Google Scholar] [CrossRef] [PubMed]
- Hansen, J.; Sato, M.; Ruedy, R.; Lacis, A.; Oinas, V. Global warming in the twenty-first century: An alternative scenario. Proc. Natl. Acad. Sci. 2000, 97, 9875–9880. [Google Scholar] [CrossRef] [PubMed]
- Menon, S.; Hansen, J.; Nazarenko, L.; Luo, Y. Climate effects of black carbon aerosols in China and India. Science 2002, 297, 2250–2253. [Google Scholar] [CrossRef] [PubMed]
- Zhang, R.; Jing, J.; Tao, J.; Hsu, S.C.; Wang, G.; Cao, J.; Lee, C.; Zhu, L.; Chen, Z.; Zhao, Y.; Shen, Z. Chemical characterization and source apportionment of PM2.5 in Beijing: Seasonal perspective. Atmos. Chem. Phys. 2013, 13, 7053–7074. [Google Scholar] [CrossRef]
- Zhao, H.; Che, H.; Zhang, X.; Ma, Y.; Wang, Y.; Wang, H.; Wang, Y. Characteristics of visibility and particulate matter (PM) in an urban area of Northeast China. Atmos. Pollut. Res. 2013, 4, 427–434. [Google Scholar] [CrossRef]
- Li, Y.; Chen, Q.; Zhao, H.; Wang, L.; Tao, R. Variations in PM10, PM2.5 and PM1.0 in an urban area of the Sichuan Basin and their relation to meteorological factors. Atmosphere 2015, 6, 150–163. [Google Scholar] [CrossRef]
- Jia, X.; Cheng, T.; Chen, J.; Xu, J.; Chen, Y. Columnar optical depth and vertical distribution of aerosols over Shanghai. Aerosol Air Qual. Res. 2012, 12, 320–330. [Google Scholar] [CrossRef]
- Xu, J.; Tao, J.; Zhang, R.; Cheng, T.; Leng, C.; Chen, J.; Huang, G.; Li, X.; Zhu, Z. Measurements of surface aerosol optical properties in winter of Shanghai. Atmos. Res. 2012, 109, 25–35. [Google Scholar] [CrossRef]
- Cheng, T.; Wang, H.; Xu, Y.; Li, H.; Tian, L. Climatology of aerosol optical properties in Northern China. Atmos. Environ. 2006, 40, 1495–1509. [Google Scholar] [CrossRef]
- Cheng, T.; Zhang, R.; Han, Z.; Fang, W. Relationship between ground-based particle component and column aerosol optical property in dusty days over Beijing. Geophys. Res. Lett. 2008. [Google Scholar] [CrossRef]
- Wang, X.; Huang, J.; Zhang, R.; Chen, B.; Bi, J. Surface measurements of aerosol properties over northwest China during ARM china 2008 deployment. J. Geophys. Res. Atmos. 2010. [Google Scholar] [CrossRef]
- Lyu, X.P.; Wang, Z.W.; Cheng, H.R.; Zhang, F.; Zhang, G.; Wang, X.M.; Ling, Z.H.; Wang, N. Chemical characteristics of submicron particulates (PM1.0) in Wuhan, Central China. Atmos. Res. 2015, 161, 169–178. [Google Scholar] [CrossRef]
- Reche, C.; Querol, X.; Alastuey, A.; Viana, M.; Pey, J.; Moreno, T.; Rodríguez, S.; González, Y.; Fernández-Camacho, R.; Rosa, J. New considerations for PM, black carbon and particle number concentration for air quality monitoring across different european cities. Atmos. Chem. Phys. 2011, 11, 6207–6227. [Google Scholar] [CrossRef] [Green Version]
- Janssen, N.; Hoek, G.; Simic-Lawson, M.; Fischer, P.; Van Bree, L.; Ten Brink, H.; Keuken, M.; Atkinson, R.W.; Anderson, H.R.; Brunekreef, B.; et al. Black carbon as an additional indicator of the adverse health effects of airborne particles compared with PM10 and PM2.5. Environ. Health Perspect 2011, 119, 1691–1699. [Google Scholar] [CrossRef] [PubMed]
- Cheng, J.; Masser, I. Urban growth pattern modeling: A case study of Wuhan city, PR China. Landsc. Urban Plan. 2003, 62, 199–217. [Google Scholar] [CrossRef]
- Gong, W.; Zhang, S.; Ma, Y. Aerosol optical properties and determination of aerosol size distribution in Wuhan, China. Atmosphere 2014, 5, 81–91. [Google Scholar] [CrossRef]
- Wang, L.; Gong, W.; Ma, Y.; Zhang, M. Modeling regional vegetation NPP variations and their relationships with climatic parameters in Wuhan, China. Earth Interact. 2013, 17, 1–20. [Google Scholar] [CrossRef]
- Zhang, X.; Wang, Y.; Lin, W.; Zhang, Y.; Zhang, X.; Zhao, P.; Yang, Y.; Wang, J.; Hou, Q.; Che, H.; et al. Changes of atmospheric composition and optical properties over Beijing-2008 Olympic Monitoring Campaign. Bull. Am. Meteorol. Soc. 2009, 90, 1633–1651. [Google Scholar] [CrossRef]
- Feng, Q.; Wu, S.; Du, Y.; Li, X.; Ling, F.; Xue, H.; Cai, S. Variations of PM10 concentrations in Wuhan, China. Environ. Monit. Assess. 2011, 176, 259–271. [Google Scholar] [CrossRef] [PubMed]
- Qian, Z.; He, Q.; Lin, H.M.; Kong, L.; Liao, D.; Dan, J.; Bentley, C.M.; Wang, B. Association of daily cause-specific mortality with ambient particle air pollution in Wuhan, China. Environ. Res. 2007, 105, 380–389. [Google Scholar] [CrossRef] [PubMed]
- Gupta, T.; Mandariya, A. Sources of submicron aerosol during fog-dominated wintertime at Kanpur. Environ. Sci. Pollut. Res. 2013, 20, 5615–5629. [Google Scholar] [CrossRef] [PubMed]
- Deshmukh, D.K.; Deb, M.K.; Tsai, Y.I.; Mkoma, S.L. Atmospheric ionic species in PM2.5 and PM1 aerosols in the ambient air of Eastern Central India. J. Atmos. Chem. 2010, 66, 81–100. [Google Scholar] [CrossRef]
- Gong, W.; Zhang, M.; Han, G.; Ma, X.; Zhu, Z. An investigation of aerosol scattering and absorption properties in Wuhan, Central China. Atmosphere 2015, 6, 503–520. [Google Scholar] [CrossRef]
© 2015 by the authors; licensee MDPI, Basel, Switzerland. This article is an open access article distributed under the terms and conditions of the Creative Commons Attribution license (http://creativecommons.org/licenses/by/4.0/).


